

Abstract
Path integration, the constant updating of the navigator's knowledge of position and orientation during movement, requires both visuospatial knowledge and memory. This study aimed to develop a systems‐level understanding of human path integration by examining the basic building blocks of path integration in humans. To achieve this goal, we used functional imaging to examine the neural mechanisms that support the tracking and memory of translational and rotational components of human path integration. Critically, and in contrast to previous studies, we examined movement in translation and rotation tasks with no defined end‐point or goal. Navigators accumulated translational and rotational information during virtual self‐motion. Activity in hippocampus, retrosplenial cortex (RSC), and parahippocampal cortex (PHC) increased during both translation and rotation encoding, suggesting that these regions track self‐motion information during path integration. These results address current questions regarding distance coding in the human brain. By implementing a modified delayed match to sample paradigm, we also examined the encoding and maintenance of path integration signals in working memory. Hippocampus, PHC, and RSC were recruited during successful encoding and maintenance of path integration information, with RSC selective for tasks that required processing heading rotation changes. These data indicate distinct working memory mechanisms for translation and rotation, which are essential for updating neural representations of current location. The results provide evidence that hippocampus, PHC, and RSC flexibly track task‐relevant translation and rotation signals for path integration and could form the hub of a more distributed network supporting spatial navigation. Hum Brain Mapp 37:3636–3655, 2016. © 2016 Wiley Periodicals, Inc.
Keywords: functional magnetic resonance imaging, navigation, hippocampus, retrosplenial cortex, parahippocampus, working memory
INTRODUCTION
Path integration is the constant updating of the navigator's knowledge of their position and orientation during movement [Byrne et al., 2007] and is a likely mechanism by which humans acquire metric survey knowledge of an environment [Chrastil, 2013]. Path integration often involves complex behaviors such as tracking a location, typically the start or home location. Complex path integration can be thought of as an aggregate of separate navigational components: translation and rotation computations, terms we here use interchangeably with distance and angle, respectively. The goal of this study was to examine the neural mechanisms that support these navigational components, using a novel task in which translational and rotational information was encoded based on virtual movement through a sparse, landmark‐free virtual environment. In addition, this study aimed to resolve current questions regarding distance coding in the human brain and adds the novel element of rotation coding that is an important component of navigation that has not been previously examined in human neuroimaging studies.
In rodent models, cellular fundamentals for path integration have been found in the medial temporal lobe (MTL), including grid cells [Fyhn et al., 2004; Hafting et al., 2005], place cells [O'Keefe and Burgess, 1996; O'Keefe and Nadel, 1978], and head‐direction cells [Sargolini et al., 2006; Taube et al., 1990; Taube, 1995]. This information can be combined to update spatial position during navigation [Burgess et al., 2007; Erdem and Hasselmo, 2012; Hasselmo, 2009]. Lesion studies have yielded inconsistent results leading to controversy regarding the role of the hippocampus in path integration; some studies demonstrate that lesions to the hippocampus and entorhinal cortex cause impairments of path integration in rodents and humans [Brun et al., 2008; McNaughton et al., 2006; Philbeck et al., 2004; Whishaw et al., 1997; Worsley, 2001; Yamamoto et al., 2014], while other studies have shown minimal path integration impairments with lesions [Alyan and McNaughton, 1999; Kim et al., 2013; Shrager et al., 2008], suggesting that further investigation into the contribution of the hippocampus to path integration is needed.
Previous functional imaging studies have implicated regions that could be important for path integration. Evidence for grid cells has been found in entorhinal cortex [Doeller et al., 2010; Jacobs et al., 2010, 2013], and place cells in the hippocampus [Ekstrom et al., 2003; Jacobs et al., 2010; Miller et al., 2013]. Hippocampal activity predicts accuracy in a triangle completion path integration task [Wolbers et al., 2007], and in a goal‐directed navigation task in a landmark‐free environment [Sherrill et al., 2013]. The parahippocampal cortex (PHC) is known to be involved in landmark‐based navigation [Aguirre et al., 1996; Epstein, 2008; Janzen and van Turennout, 2004], is important for disambiguation of contextual information [Brown et al., 2014b, 2010; Brown and Stern, 2014] and for recalling spatial associations [Aminoff et al., 2007], and the nearby presubiculum region has been shown to be important for coding facing direction [Vass and Epstein, 2013]. PHC activity has also been observed in navigation in sparse environments [Chrastil et al., 2015; Doeller et al., 2010; Sherrill et al., 2013], suggesting that PHC may also be important for processing fundamental path integration signals including distance and rotation. In addition, both PHC and hippocampus are involved in encoding and maintenance phases of non‐navigational delayed match to sample (DMS) tasks [Nauer et al., 2015; Newmark et al., 2013; Ranganath et al., 2005; Schon et al., 2005, 2004], suggesting that these regions could be important for the encoding and maintenance of task‐dependent navigational information during working memory.
The retrosplenial cortex (RSC) may also play a key role in tracking movement by translating between egocentric (relative to the navigator) and allocentric (independent of the navigator) perspectives [Byrne et al., 2007; Ino et al., 2002]. Head direction cells are also found in RSC [Chen et al., 1994; Cho and Sharp, 2001], suggesting that RSC could support rotational components of path integration by tracking heading direction [Baumann and Mattingley, 2010; Doeller et al., 2010; Marchette et al., 2014; Vass and Epstein, 2013]. Lesions to RSC and nearby posterior parietal cortex (PPC) in humans and rats cause impairments in recalling directional information [Aguirre and D'Esposito, 1999; Takahashi et al., 1997] and in path integration [Save et al., 2001; Save and Poucet, 2009]. Both RSC and PHC have been shown to be responsive to movement direction in virtual environments [Doeller et al., 2010], suggesting that these regions are important for tracking fundamental signals needed for path integration. Animal models show that the RSC has anatomical connections with the hippocampus and PHC [Sugar et al., 2011; Suzuki and Amaral, 1994], as well as prefrontal cortex [Shibata et al., 2004], suggesting that these areas could form a network processing path integration signals, with rotational information from RSC updating the PHC and hippocampus context for location. Based on these studies in both humans and animals, we expected that hippocampus, PHC, and RSC would contribute to the translational and rotational components of path integration.
Previous neuroimaging studies have demonstrated that the hippocampus plays a role in tracking distance to goal, but with mixed results regarding the nature of this relationship (see Spiers and Barry, 2015 for review). In goal‐oriented navigational tasks, some researchers have found increased hippocampal activation with increasing proximity to a goal [Sherrill et al., 2013; Viard et al., 2011]. In contrast, others have found that increasing Euclidean distance from a goal was associated with increased hippocampal activation [Chrastil et al., 2015; Howard et al., 2014; Morgan et al., 2011; Spiers and Maguire, 2007]. What these tasks have in common is a design in which the navigator traveled to a known goal location, which allows the navigator to anchor to either the initial start point or to the final goal location. Thus, it is unclear whether the hippocampal responses in those studies were a result of proximity to the goal or distance from the start. Critically, here we test translation and rotation when no goal is present, leaving only one anchor point—the start location—from which to track the accumulation of translation and rotation information.
Using a modified DMS task (Fig. 1), we developed a functional magnetic resonance imaging (fMRI) study to investigate the navigational components comprising complex path integration in humans. We used this novel paradigm to examine the brain regions recruited in encoding and maintaining the translational and rotational components of path integration. Participants viewed two videos of a single type of movement (translation in a straight line or rotation in place) and then judged whether the magnitude of the encoded distance or rotation angle in the videos matched (Fig. 1). This design allows us to examine the basic building blocks of path integration, operating under the assumption that the translation and rotation signals studied here play a role in complex path integration such as location tracking and spatial updating. Updating one's position during movement requires some measure of the magnitude of translation and rotation that has taken place [Benhamou et al., 1990; Fujita et al., 1993, 1990; Muller and Wehner, 1988], without which more complex path integration behaviors would be impossible. Critically, during encoding, participants were not trying to reach a goal location, but rather were simply accumulating translational and rotational information during virtual self‐motion without a pre‐determined end point. This design differs from previous navigational tasks that have examined distance coding to a goal location [Chrastil et al., 2015; Howard et al., 2014; Morgan et al., 2011; Sherrill et al., 2013; Spiers and Maguire, 2007], and introduces the novel element of rotational coding. We examined two key factors: (1) Tracking translation and rotation during movement and (2) Encoding and maintaining path integration signals during a DMS task.
Figure 1.
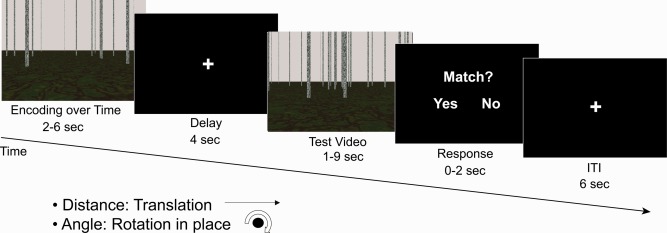
Experimental design. Participants viewed a short encoding video of movement, followed by a delay, then a test video of the same type of movement. Participants then indicated whether the movement in the two videos was a match or non‐match, for example, whether the distance traveled in the two videos was the same. The distance (translation) and angle (rotation) tasks were presented in blocks of six trials in each fMRI scan run. The ground texture and arrangement of poles changed between the encoding and test videos, so that they could not be used as landmarks for the task. Two travel speeds were used to discourage time‐based strategies; the speeds in the two videos were the same on only half of the trials. Mean proportion correct was 0.671 (SEM ± 0.021) for the distance task and 0.688 (SEM ± 0.029) for the angle task.
Our hypothesis was that the hippocampus, PHC, and RSC would track components of path integration, with changes in BOLD signal tied to the magnitude of translation or rotation. With respect to encoding and maintenance of these path integration signals, we hypothesized that the RSC would be important for encoding and maintaining changes in rotation, whereas the hippocampus and PHC would be recruited for the successful encoding and maintenance of both translation and rotation path integration components. We expected that these three regions would track the task‐relevant information that would be used to process path integration signals.
MATERIALS AND METHODS
Participants
Thirty‐one participants were recruited for this study from the Boston University community. All participants had no history of neurological disorders. Written informed consent was obtained from each participant prior to enrollment in accordance with the experimental protocol approved by both the Partners Human Research Committee and the Boston University Charles River Campus Institutional Review Board.
Two participants were eliminated from the final analysis due to excessive motion during fMRI scanning, three participants were not scanned due to claustrophobia, one participant was found to be ineligible after screening, and one participant fell asleep during the scan as determined by non‐responses for a significant portion of the scanning session. Twenty‐four participants were included in the final data analysis (mean age 23.50 ± 4.81(SD); 11 males, 13 females).
Stimuli and Tasks
Overview
We developed a virtual environment using POV‐Ray v.3.6 (http://www.povray.org/), a 3D ray‐tracing modeling program. The environment used to generate video images consisted of a textured ground plane with approximately 150 textured poles randomly placed in the scene to provide optic flow information; the arrangement of poles and floor texture differed in each video (Fig. 1). Two experimental tasks were presented to participants, using a modified DMS paradigm. In the two experimental DMS tasks, participants viewed a short video of virtual movement in the sparse environment (Fig. 1), followed by a delay, and then another video presentation. Following the second video presentation, participants indicated via a button press whether the movement in the two videos was the same or different. In addition to the two experimental tasks, three separate experimental tasks—curve, loop closure, and static image change—were also collected, but are not discussed here [Chrastil et al., 2015].
Trial procedure
Each trial began with the first “encoding” video, which varied in duration (Fig. 1). Following the encoding video, the 4‐s fixation delay was presented. Next, the second “test” video was presented, which also varied in duration. Durations of the cue and test videos were varied, based on differences in the speed and the magnitude of the translations and rotations in the virtual environment. Movement was presented at two speeds for each of the experimental tasks (1.5 and 2.0 virtual units/second for the distance task, 35° and 40°/s for the angle task), to discourage participants from simply counting time. The movement speed in the encoding and test videos matched on half of the trials and did not match on the other half. After the test video, a response screen was presented, and participants had up to 2 s to respond whether the magnitude of the movement was the same or different in the two videos. A 6‐s intertrial interval (ITI) began as soon as the response was recorded; thus, the duration of the response was based on participants' reaction time. The name of the condition (“Distance” or “Angle”) was printed in text at the top of the screen during the two video presentations, to ensure that participants were aware of the condition.
The textured ground and poles in the environment provided optic flow information during the video presentation of movement. The poles were taller than the top of the screen so that height changes could not be used as a cue to distance. The large number of poles and random placement discouraged participants from using the scene arrangement as a landmark. Each video had a different random arrangement of the poles and floor texture, such that the arrangement differed between the encoding and test videos, thereby ensuring that the poles could not be used as landmarks for gauging translation or rotation. Movement in the videos never passed directly through a pole. We emphasize that self‐motion information used in this study stems purely from visual information, with no vestibular or proprioceptive input, due to the constraints of fMRI scanning. Visual information has been shown to be sufficient for path integration [Kearns et al., 2002; Tcheang et al., 2011].
Videos of movement in the environment were generated as a series of images rendered in POV‐Ray, presented at 30 frames per second. The horizontal field of view was 67.38°, the aspect ratio was 4:3 with a display resolution of 1,024 × 768. The scenes were presented to participants using E‐Prime 2.0 (Psychology Software Tools), which also recorded the exact timing of stimulus presentation and participants' responses.
Distance
Movement in both the encoding and test videos was translation in a straight line. During the response period, participants indicated whether the distance traveled in the test video was the same or different as the encoding video. Two outbound distances were used for the first encoding video, either 5 or 9 virtual units. On half of the distance trials, distances in the second test video matched the distance in the encoding video, half were non‐matches. Half of the non‐match trials were overshoots of the match distance and half were undershoots; non‐matches for the 5 unit encoding video were either 2 or 9 units, and non‐matches for the 9 unit encoding video were either 5 or 13 units. The length of the videos varied based on distance and speed presented, with an average of 4 s across all trials.
Angle
Movement in both the encoding and test videos was rotation in place, similar to a person standing in a single location and turning in place. During the response period, participants indicated whether the rotation angle in the test video was the same or different as the encoding video. Two degrees of rotation were used for the first encoding video, either 80° or 140°. In half of the trials, the rotations in the second test video matched the rotation in the encoding video, and half of the trials were non‐matches. Half of the non‐match trials were overshoots of the match rotation and half were undershoots; non‐matches for the 80° encoding video were either 40° or 120°, and non‐matches for the 140° encoding video were either 80° or 200°. Left and right turns were equally represented across all rotation trials, and the encoding and test video always went in the same direction; left and right rotation trials were collapsed in our analysis. The length of the videos varied based on degree of rotation and speed presented, with an average of 3 s.
Procedure
Pre‐scan training
Participants were trained outside the scanner the day prior to scanning. Participants were given a general description of movement in the environment and shown a short example. They were then given specific instructions and practice for each of the tasks in turn, starting with distance, followed by angle, curve (not discussed here), loop (not discussed here), and static image change (not discussed here). The practice consisted of 24 trials, and the distances and angles used in the practice were not the same as those used during the test at the scanner, although they were within a similar range of the magnitude of movement. Feedback was provided during the practice; immediately after each response, participants were presented with information about whether they got the trial correct and a running average of their percent correct. After practicing all experimental tasks once, participants were given the opportunity to take a break and to ask questions about the tasks. One more set of practice with feedback was given for the experimental tasks. Finally, participants were given practice with one run of the tasks in the manner in which they would be presented at the scanner, that is, with no feedback and with each task presented in blocks of six trials.
Experimental task
While the structural scans were being acquired, participants were given a practice run with feedback using examples from the training, with eight trials per task block. Each of the test runs consisted of one block each of the experimental tasks (distance, angle, curve, loop, and static image change). Each block contained six trials of the task, with match and mismatch trials counterbalanced across runs. The task order of each block was counterbalanced across runs. There were six runs, randomized across participants, for a total of 36 trials per condition. Because the ITI began as soon as participants made their responses, the scan time for each run varied but generally lasted just under 10 min. Total scan time for the experimental task was approximately 1 h.
Image Acquisition
Images were acquired at the Athinoula A. Martinos Center for Biomedical Imaging, Massachusetts General Hospital in Charlestown, MA using a 3 Tesla Siemens MAGNETOM TrioTim scanner with a 32‐channel Tim Matrix head coil. A high‐resolution T1‐weighted multi‐planar rapidly acquired gradient echo structural scan was acquired using Generalized Autocalibrating Partially Parallel Acquisitions (TR = 2,530 ms; TE = 3.31 ms; flip angle = 7°; slices = 176; resolution = 1 mm isotropic). T2*‐weighted BOLD images were acquired using an Echo Planar Imaging sequence (TR = 2,000 ms; TE = 30 ms; flip angle = 85°; slices = 33, resolution = 3.44 mm isotropic, interslice gap of 0.5 mm). Functional image slices were aligned parallel to the long axis of the hippocampus.
fMRI Preprocessing
Functional imaging data were preprocessed and statistically analyzed using the SPM8 software package (Statistical Parametric Mapping, Wellcome Department of Cognitive Neurology, London, UK). All BOLD images were first reoriented so the origin (i.e., coordinate x,y,z = [0, 0, 0]) was at the anterior commissure. The images were then corrected for differences in slice timing. Motion correction was conducted next, and included realigning and unwarping the BOLD images to the first image in the series to correct for image distortions caused by susceptibility‐by‐movement interactions [Andersson et al., 2001]. Realignment was estimated using 7th degree B‐spline interpolation with no wrapping while unwrap reslicing was done using 7th degree B‐spline interpolation with no wrapping. The high‐resolution structural image was then coregistered to the mean BOLD image created during motion correction and segmented into white and gray matter images. The bias‐corrected structural image and coregistered BOLD images were spatially normalized into standard Montreal Neurological Institute (MNI) space using the Diffeomorphic Anatomical Registration using Exponentiated Lie algebra algorithm [Ashburner, 2007] for improved inter‐subject registration. BOLD images were resampled during normalization to 2 mm3 isotropic voxels and smoothed using a 6 mm full‐width at half‐maximum Gaussian kernel. The normalized structural images of all 24 participants were averaged after normalization for displaying overlays of functional data.
Analysis
Behavioral performance analysis
Behavioral performance was assessed using MatLab (MathWorks) and SPSS20 (IBM). Within‐subjects repeated‐measures ANOVAs were used to assess potential differences in accuracy and reaction time between the different conditions. A Pearson correlation was also conducted to assess the relationship between accuracy on the distance and angle tasks. Paired t‐tests were conducted to assess differences in accuracy and reaction time between matches and non‐matches, and for other comparisons.
fMRI analysis
Two primary fMRI analyses were used to investigate the brain regions that contribute to processing path integration information: (1) Parametric analysis of translation and rotation tracking and (2) Analysis of encoding and maintenance of path integration signals. To model the data, separate models were created for the encoding video and maintenance during delay. Because the final test video could have multiple processes occurring at the same time, such as encoding the test video while also recalling the encoding video and preparing to make a response, we did not analyze this time period, and focused on the encoding and delay periods. One model contained a regressor for the encoding videos for each of the DMS conditions (distance, angle, curve, and static image change). Each experimental condition had separate regressors for correct and incorrect trials, totaling eight experimental regressors in the encoding model. A separate model was created with regressors for the delay period of each of the conditions, with separate regressors for correct and incorrect trials, also for a total of eight regressors. The six motion parameters calculated during motion correction were added to each model as additional covariates of no interest, as were regressors removing signal intensity spikes (using SPM8's ART function developed by Mozes and Whitfield‐Gabrieli with a z‐threshold of 9, a movement threshold of 2 mm, and a rotation threshold of 0.02 radians; http://www.nitrc.org/projects/artifact_detect/).
Each analysis was performed at both the ROI and whole‐brain level. First, an ROI was used based on the strong a priori hypotheses that the hippocampus contributes both to human spatial navigation and encoding in a DMS task [Brown et al., 2014a; Howard et al., 2014; Newmark et al., 2013; Schon et al., 2004; Sherrill et al., 2013 Stern et al., 1996; Wolbers et al., 2007], that the PHC contributes to orientation and encoding in a DMS task [Epstein and Vass, 2013; Newmark et al., 2013; Schon et al., 2004; Sherrill et al., 2013], and that the RSC contributes to tracking orientation and distance [Baumann and Mattingley, 2010; Chen et al., 1994; Chrastil et al., 2015; Marchette et al., 2014; Viard et al., 2011]. We created an ROI mask from the anatomical boundaries of both the left and right hemisphere hippocampi and the entire left and right parahippocampal gyri (including entorhinal cortex) using the Wake Forest University (WFU) Pick‐Atlas automatic anatomical labeling [Maldjian et al., 2003] available for statistical parametric map (SPM). The WFU Pick‐Atlas does not have an anatomical ROI for the RSC, so we generated an ROI using the anatomical tracing program ITK‐SNAP [Yushkevich et al., 2006]. This ROI tracing followed along the anatomical boundaries and Brodmann areas outlined in Vann et al. [2009] and Damasio [2005], including the extreme posterior cingulate, the cingulate isthmus connecting to the parahippocampal gyrus, and the most ventral and posterior areas of the precuneus, without extending into the occipital‐parietal sulcus. The border between the RSC and PHC was defined as the first slice where the hippocampus tail was visible, since the hippocampus tail serves as the boundary marker for PHC [Pruessner et al., 2002]. It is important to note that this was an anatomically‐defined RSC ROI, and included some, but not all, areas of the broader, functionally‐defined retrosplenial complex [Epstein, 2008]. We combined the hippocampal, parahippocampal gyrus, and RSC ROIs and resampled to the appropriate image space in SPM. We applied a voxel‐wise statistical threshold of P < 0.05 to the contrast maps. To correct for multiple comparisons, we applied a cluster‐extent threshold technique. The 3dClustSim program in the AFNI software package (http://afni.nimh.nih.gov/afni/) was used to conduct a 10,000 iteration, 8 mm autocorrelation Monte Carlo simulation of the ROI volume (5,041 voxels). The 8 mm smoothing kernel was derived from the smoothness estimates of each contrast using AFNI's 3dFWHMx function. For simplicity and to be more conservative, we rounded these values up to the nearest whole number that was greater than any of the smoothness estimates, yielding an isotropic kernel of 8 mm. From this simulation, a minimum voxel extent of 175 was determined to maintain a family‐wise error rate of P < 0.05. Where possible, we also report which areas within our ROI held at more conservative voxel‐wise significance levels: P < 0.01 (minimum 62 voxels), P < 0.005 (minimum 42 voxels), and P < 0.001 (minimum 16 voxels).
Although studies in rodents indicate an important role for entorhinal cortex in spatial coding [Fyhn et al., 2007, 2004; Hafting et al., 2005; Sargolini et al., 2006], fMRI signal dropout in anterior MTL prevented analysis of entorhinal cortex activity in this study.
For the whole‐brain analysis, a voxel‐wise statistical threshold of P < 0.01 was applied to the whole brain contrast maps. Similar to the ROI analysis, 3dClustSim was used to conduct a 10,000 iteration, 8 mm autocorrelation Monte Carlo simulation analysis on voxels within the group functional brain space using the ResMS header file (167,038 total voxels). From this analysis, a minimum voxel extent of 219 was determined to maintain a family‐wise error rate of P < 0.05. In light of recent suggestions that a more conservative voxel‐wise threshold should be used for whole brain fMRI analyses [Woo et al., 2014], we also applied a more conservative voxel‐wise threshold of P < 0.001 with a cluster extent of 64 voxels (cluster corrected to P <0.05) to our data set. We used Damasio [Damasio, 2005] and Pruessner [Pruessner et al., 2000, 2002] as references for localization.
Parametric analysis of translation and rotation tracking
A model‐based approach was taken to test the hypothesis that hippocampal, parahippocampal, and retrosplenial activation tracks accumulating translation and rotation information during successful path integration, using within‐subject parametric analyses of the distance and angle tasks. Only correct trials of the encoding video were examined. In contrast with simple localization, the model comparison approach indicates that one model describes the data better than an alternative, providing greater explanatory power behind how a cognitive process is implemented in the brain areas of interest [O'Doherty et al., 2007]. This approach has been used to study a variety of cognitive processes in learning, memory, and perception, and provides a means for testing models where shared variance is expected [Barendregt et al., 2015; Chrastil et al., 2015; Davis et al., 2014; Harvey et al., 2013; Ribas‐Fernandes et al., 2011; Simon and Daw, 2011].
Tracking translation and rotation
To assess the contribution of translation and rotation to activation in the distance and angle tasks, respectively, the basic model described above was modified to create a new parametric model. In this model, the distance or angle encoding video regressor was defined as stick functions (onsets with zero duration) sampled at half‐second intervals, sampling over the entire course of the encoding video. Parametric modulators for these regressors contained the distance or angle values corresponding to each of these time points [Sherrill et al., 2013; Spiers and Maguire, 2007]. For example, for distance traveled, the regressors were the cumulative distance (in virtual units) traveled at each half second (e.g., 0.75, 1.5, 2.25, etc.), and for rotation, the regressors were the cumulative number of degrees that had been traversed (e.g., 17.5, 35.0, 52.5, etc.). Because this model is tied to the magnitude of self‐motion, we refer to it as the tracking translation/rotation model.
Tracking time
The model‐based approach tests the hypothesis that the hippocampus, RSC, and PHC track path integration information; however, it is possible that an alternative model that follows a similar trajectory could provide a better fit for the data. Thus, in addition to the translation and rotation analyses, we also created an alternative parametric modulator to test a model corresponding to the passage of time at each time point, the time model. Critically, by including two travel speeds in our design, this analysis tests for the possibility that brain regions could be responsive to the amount of time that has passed, rather than Euclidean translation or rotation per se. For the analysis of the time model, the parametric regressors were simply time values at every half second (0.5, 1.0, 1.5, etc.). By varying the speed in which the participant experienced the environment, we were able to examine the relative contribution of these factors. These alternative models are qualitatively similar (both generally described by a linear increase) and have shared variance, but by contrasting the models we can determine which model (the tracking translation/rotation model or the time model) is a better quantitative fit for the data.
Model comparison
To compare these models, we first created separate models in SPM for the translation model and its corresponding time model. We also created separate models in SPM for the rotation model and its corresponding time model. We created separate models, rather than follow the conventional approach of putting both within the same general linear model (GLM), because the GLM approach removes potentially important shared variance, thereby reducing power to detect regions that support either the tracking translation/rotation model or the time model. Thus, to effectively compare the models, it is important to include the shared variance in both models. Although time and translation/rotation linearly increase at the same rate during the course of a single trial, having two travel speeds decouples this perfect correlation when testing over all trials. The two models we created included separate regressors for both correct trials and incorrect trials to account for variance attributed to incorrect trials, and also included the motion and signal intensity spike regressors described earlier. The parameter estimates for the parametric modulation for only correct trials from each model were loaded into a one‐sample t‐test against 0 to test whether the models significantly described the data. We conducted ROI and whole‐brain analysis on both the tracking translation/rotation and time models, using the ROI, voxel‐wise thresholds, and cluster extents described earlier.
After determining whether the two models significantly described the distance task and angle task data, we next compared the two models. Because the SPMs had been created separately, we normalized each parameter estimate, or “beta,” into a t‐statistic by dividing them by the standard error of the beta, to ensure that they were comparable. The standard error was computed from the ResMS file (ResMS), the covariance matrix value for that beta (Bcov), and the number of time points that were part of the beta (N): beta_norm = beta/(sqrt(ResMS × Bcov)/sqrt(N)). We contrasted the t‐statistics for the different models in SPM8 by conducting a paired t‐test between the two SPMs.
Encoding and maintenance of path integration signals
This analysis tested the hypothesis that RSC would be active when encoding and maintaining changes in rotation, whereas the hippocampus and PHC would be recruited for the successful encoding and maintenance of both translation and rotation path integration components. To test this hypothesis, we focused on the memory aspects of the task by comparing successful versus unsuccessful trials and performance‐based analysis of the brain regions active during encoding and maintenance of path integration signals during the DMS task. The basic model described above was analyzed using the GLM approach. Regressors from the task were constructed as a series of square waves or “boxcars.” Boxcar onsets were defined by the onset of each event and extended for the duration of the event. These parameters were convolved with the canonical hemodynamic response function in SPM8. Participant‐specific parameter estimates pertaining to each regressor were calculated. Three primary univariate analyses were conducted for both encoding over time and maintenance during delay:
Successful navigation. To examine brain activation during successful encoding and maintenance of path integration signals, the t‐contrasts between correct trials and incorrect trials for both the distance and angle tasks were constructed for each participant for both the encoding phase and the delay phase. Group‐averaged SPMs were created by entering the Correct > Incorrect contrast images from each participant into a one‐sample t‐test using participant as a random factor.
Comparison of component tasks. To examine underlying navigational processes between experimental conditions, we created contrasts between the distance task and the angle task. Correct trials for each experimental condition were contrasted with correct trials of the other experimental condition (i.e., Distance > Angle and Angle > Distance) for both encoding and delay. Group‐averaged SPMs were created by entering these contrast images from each participant into a one‐sample t‐test using participant as a random factor.
Performance‐based between‐subject parametric analysis. To examine differential brain recruitment based on performance, we performed a parametric analysis which related brain activity with better accuracy on each of the tasks. Parameters for correct trials only were used to assess brain activity for successful navigation of path integration components. Group‐averaged SPMs were created by entering the parameter estimates for correct trials from each participant into a one‐sample t‐test, using the proportion correct in the experimental condition of interest (distance or angle) as a between‐subjects covariate in the model. This analysis examines brain activations that are greater for participants who performed well at the task, even when looking only at correct navigation. SPMs were created separately for distance and angle tasks, with one SPM for encoding and one for delay, for a total of four parametric analyses.
RESULTS
Behavioral Performance
Mean proportion correct for the distance task was 0.671 (SEM ± 0.021) and mean proportion correct for the angle task was 0.688 (SEM ± 0.0292). Mean reaction time was 867.216 ms (SEM ±27.661) for the distance task and 854.154 ms (SEM ± 25.448) for the angle task. Performance in both experimental tasks was significantly above chance (distance: t 23 = 8.181, P < 0.001; angle: t 23 = 6.427, P < 0.001). There were no differences in accuracy (t 23 = −0.515, P = 0.612) or reaction times (t 23 = 0.786, P = 0.440) between the two tasks. Interestingly, performance on the two experimental tasks appeared to be fairly independent; there was no significant correlation between the distance and angle tasks (r 22 = 0.243, P = 0.252).
For the distance task, paired t‐tests found that participants were significantly more accurate for non‐match than for match trials (t 23 = −2.386, P = 0.026), although this finding was not observed in the angle task (t 23 = −0.464, P = 0.647). There were no significant differences between match and non‐match trials for reaction times in the angle task (t 23 = 1.640, P = 0.115), although there was a marginal difference in the distance task (t 23 = 2.056, P = 0.051).
We further examined whether participants were more accurate for trials in which the movement speed matched in the two videos. Participants were only marginally more accurate in the distance (t 23 = 1.980, P = 0.060) and angle tasks (t 23 =1.752, P = 0.093). Participants were significantly faster for matching speed trials in the distance task (t 23 = −2.083, P = 0.049) but not for the angle task (t 23 = 0.476, P = 0.638).
Tracking Translation and Rotation
Tracking translation and rotation
The regions in our a priori ROI, the hippocampus, RSC, and PHC, all demonstrated significantly greater activation with both increasing distance traveled and increasing rotation traveled (Fig. 2A), supporting our hypothesis that these regions track self‐motion information during path integration (voxel‐wise P < 0.05, cluster corrected to P < 0.05, minimum cluster size 175 voxels). For the parametric analysis of translation, the ROI revealed increasing activation in a cluster in left hippocampus head and body and left PHC, a cluster that included right hippocampus tail and PHC, and bilateral clusters in RSC, suggesting that these areas track the accumulation of distance information during path integration. Peak voxel location, cluster size (k), and t‐value and P‐value for the peak voxels are as follows: Hippocampus (x,y,z: −32,−22,−10; k = 500; t 23 = 3.78; P = 0.0005; x,y,z: 28,−14,−24; k = 420; t 23 = 4.03; P = 0.0003); RSC (x,y,z: −2,−58,22; k = 448; t 23 = 5.90; P = 0.000003; x,y,z: 2,−56,12; k = 219; t 23 = 5.32; P = 0.00001); PHC (x,y,z: −22,−26,−22; k = 500; t 23 = 2.15; P = 0.021; x,y,z: 16,−36,−6; k = 420; t 23 = 2.13; P = 0.022). At more conservative voxel‐wise thresholds within the ROI, we found significant activation bilaterally in medial RSC (left: P < 0.001, k = 85; right: P < 0.001, k = 106) and in the left hippocampus head (P < 0.005, k = 137). Whole‐brain parametric analysis of translation (voxel‐wise P < 0.01, cluster corrected to P <0.05, minimum cluster size 219 voxels) found activation in a cluster that included bilateral hippocampus, RSC, inferior frontal gyrus, insula, superior temporal sulcus, supramarginal gyrus, precuneus, lingual gyrus, and cuneus. We also examined our results at a more conservative voxel‐wise threshold of P < 0.001 (cluster corrected to P < 0.05, minimum cluster size 64 voxels) [Woo et al., 2014] for the primary analysis of regions showing increasing activity with distance from the home location. Using this more conservative voxel‐wise threshold, activity was localized to a cluster that included right RSC and bilateral precuneus, a cluster that included left RSC, bilateral lingual gyrus, and bilateral cuneus, bilateral clusters that included inferior frontal gyrus, bilateral clusters that included superior temporal sulcus, and bilateral clusters of supramarginal gyrus. Whole‐brain results at voxel‐wise P < 0.001 are shown in Table 1.
Figure 2.
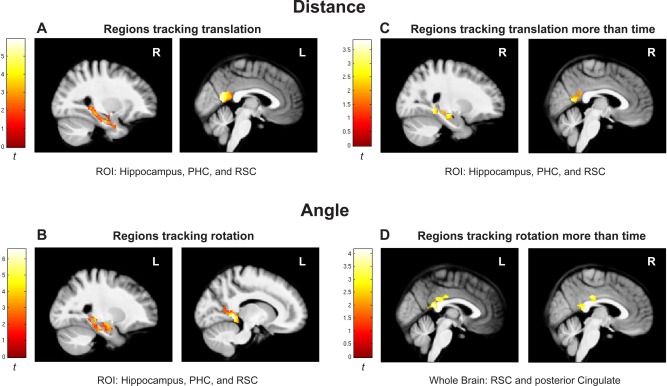
Parametric analysis of distance and angle tasks. Parametric results are shown for areas in our Hippocampus, PHC, and RSC ROI that had increasing activity with (A) increasing translation (distance task) and (B) increasing rotation (angle task). (C) and (D) show regions that are more responsive to translation and rotation, respectively, than to time after model comparison. ROI results are shown in a masked ROI, with a voxel‐wise threshold of P < 0.05, corrected to family‐wise P < 0.05, minimum cluster extent 175 voxels. Whole brain results are shown with a voxel‐wise threshold of P < 0.01, corrected to family‐wise P < 0.05, minimum cluster extent 219 voxels.
Table 1.
Whole‐brain results of within‐subject parametric activation tracking translation or rotation in the two experimental tasks
| Left | Right | ||||||
|---|---|---|---|---|---|---|---|
| Contrast | Brain region | k | t | MNI x,y,z | k | t | MNI x,y,z |
| Distance Parametric | Inferior Frontal Gyrus | 110 | 4.32 | 40,50,0 | |||
| (Increased activity with greater distance) | Inferior Frontal Gyrus | 676 | 6.65 | −58,18,12 | 818 | 6.85 | 60,14,10 |
| Sylvian Fissure | 4.34 | −36,24,0 | 4.63 | 36,24,0 | |||
| Middle Frontal Gyrus | 176 | 5.72 | 46,42,22 | ||||
| Postcentral Gyrus | 68 | 4.55 | −42,−28,54 | ||||
| Paracentral Gyrus | 102 | 5.06 | 14,−22,52 | ||||
| Superior Temporal Gyrus | 84 | 4.80 | −54,−4,−4 | 1029 | 4.31 | 52,−4,−2 | |
| Superior Temporal Sulcus | 1249 | 7.45 | −54,−36,−2 | 7.03 | 66,−22,0 | ||
| Supramarginal Gyrus | 525 | 5.52 | −48,−60,36 | 705 | 7.09 | 56,−42,38 | |
| Precuneus | 301 | 4.95 | −8,−54,42 | 301 | 4.19 | 8,−62,50 | |
| Retrosplenial Cortex | 1655 | 5.93 | −2,−58,22 | 4.59 | 4,−52,16 | ||
| Lingual Gyrus | 6.71 | −2,−62,8 | 1655 | 5.54 | 12,−64,4 | ||
| Calcarine Sulcus | 4.07 | −14,−72,2 | 4.55 | 22,−70,4 | |||
| Cuneus | 5.94 | −6,−82,22 | 5.47 | 8,−78,26 | |||
| Angle Parametric | Middle Frontal Gyrus | 114 | 5.06 | −54,20,32 | 169 | 5.74 | 48,50,14 |
| (Increased activity with greater rotation) | Inferior Frontal Gyrus | 997 | 6.98 | −48,22,−2 | 5.59 | 48,52,−4 | |
| Sylvian Fissure | 4.59 | −40,28,−6 | |||||
| Superior Frontal Gyrus | 322 | 4.95 | −2,28,42 | 322 | 4.85 | 6,30,36 | |
| Precentral Gyrus | 68 | 4.11 | −40,6,42 | ||||
| Postcentral Gyrus | 64 | 4.44 | 24,−26,56 | ||||
| Medulla | 94 | 4.24 | −6,−32,−38 | 94 | 4.06 | 8,−24,−30 | |
| Superior Temporal Gyrus | 104 | 4.94 | −54,−8,−4 | 210 | 5.27 | 66,−6,−2 | |
| Superior Temporal Sulcus | 164 | 6.03 | −48,−44,−4 | 97 | 4.96 | 50,−32,0 | |
| Angular Gyrus | 264 | 5.97 | −30,−86,32 | 334 | 5.03 | 40,−78,26 | |
| Middle Temporal Gyrus | 311 | 4.38 | −50,−72,−4 | 4.60 | 52,−70,10 | ||
| Fusiform Gyrus | 5.99 | −42,−56,−20 | |||||
| Superior Parietal Lobule | 817 | 5.91 | −36,−46,60 | ||||
| Supramarginal Gyrus | 5.55 | −52,−44,42 | 1092 | 8.39 | 48,−44,52 | ||
| Amygdala | 109 | 4.50 | −22,−10,−14 | ||||
| Thalamus | 116 | 4.96 | −12,−28,0 | ||||
| Hippocampus Tail | 4.50 | −24,−32,−10 | 3863 | 3.97 | 24,−34,−4 | ||
| Retrosplenial Cortex | 3863 | 6.59 | −12,−42,−2 | 5.58 | 14,−48,0 | ||
| Precuneus | 4.43 | −2,−62,58 | 5.09 | 2,−62,58 | |||
| Lingual Gyrus | 7.59 | 0,−64,14 | |||||
| Cuneus | 7.37 | 0,−82,24 | 7.90 | 4,−68,22 | |||
| Cerebellum | 129 | 6.32 | −36,−58,−38 | 5.17 | 14,−64,−14 |
Table includes significant activations related to increased distance and rotation traveled. Cluster size (k) indicates the size of the significant cluster at voxel‐wise P < 0.001 corrected to family‐wise P < 0.05 with a minimum cluster threshold of 64 voxels. MNI coordinates reflect peak activation voxels within each cluster. t‐Values represent local peak voxel t‐statistics passing a threshold of P < 0.001.
For the parametric analysis of rotation, ROI analysis revealed activation in a cluster containing right hippocampus head, a cluster with right hippocampus tail and RSC, and a cluster that spanned left hippocampus head, hippocampus tail, RSC, and PHC, suggesting that these areas track the accumulation of rotation information during path integration (Fig. 2B). Voxel location, cluster size (k), and t‐value and P‐value for the peak voxels are as follows: Hippocampus head (x,y,z: −22,−8,−20; k = 876; t 23 = 3.18; P = 0.0021; x,y,z: 30,−12,−22; k = 197; t 23 = 2.98; P = 0.0033), Hippocampus tail (x,y,z: −20,−34,−2; k = 876; t 23 = 3.48; P = 0.001; x,y,z: 24,−34,−4; k = 621; t 23 = 3.99; P = 0.0003); RSC (x,y,z: −12,−42,−2; k = 876; t 23 = 6.60; P = 0.0000005; x,y,z: 2,−60,16; k = 621; t 23 = 5.56; P = 0.000006); PHC (x,y,z: −26,−22,−20; k = 876; t 23 = 5.15; P = 0.00002). At more conservative voxel‐wise thresholds within the ROI, we found significant activation in the right hippocampus tail (P < 0.001, k = 65), bilateral lateral RSC/PHC border (left: P < 0.001, k = 88; right: P < 0.001, k = 79), bilateral medial RSC (left: P < 0.001, k = 25; right: P < 0.001, k = 31), and left hippocampus tail (P < 0.005, k = 42). Whole‐brain parametric analysis (voxel‐wise P < 0.01) found activation in a cluster that contained bilateral hippocampus, RSC, insula, supramarginal gyrus, precuneus, lingual gyrus, and cuneus, bilateral clusters that included superior temporal sulcus, and bilateral clusters that included inferior frontal gyrus. Using the more conservative voxel‐wise P < 0.001 threshold, activity was localized to a cluster of left hippocampus tail and thalamus, a cluster that included right hippocampus tail, bilateral RSC, precuneus, lingual gyrus, and cuneus, bilateral clusters that included inferior frontal gyrus, bilateral clusters of superior temporal sulcus, and bilateral clusters that included supramarginal gyrus. See Table 1 for whole‐brain results at voxel‐wise P < 0.001.
Model comparison with tracking time
We also created separate models using time as the regressor (see Methods). This analysis allowed us to test an alternative explanation, namely that the increasing response to translation or rotation could be due to the passage of time. The results for the parametric analysis of the time model revealed a similar pattern to the tracking translation/rotation model, with increasing activation in hippocampus, RSC, and PHC with increasing passage of time. However, the contrast between the tracking translation and time models revealed that activation in the hippocampus, RSC, and PHC ROI were more sensitive to tracking distance than to time (Fig. 2C). The clusters included left hippocampus, a cluster spanning right hippocampus, RSC, and PHC, and a cluster spanning left RSC and PHC. Voxel location, cluster size (k), and t‐value and P‐value for the peak voxels are as follows: hippocampus (x,y,z: −24,−26,−16; k = 196; t 23 = 3.85; P = 0.000411; x,y,z: 26,−18,−14; k = 470; t 23 = 2.70; P = 0.0063), RSC (x,y,z: −4,−62,12; k = 332; t 23 = 3.22; P = 0.0019; x,y,z: 4,−56,10; k = 470; t 23 = 3.47; P = 0.0010), PHC (x,y,z: −14,−38,−6; k = 332; t 23 = 3.65; P = 0.000663; x,y,z: 26,−44,−6; k = 470; t 23 = 3.56; P = 0.000828). Within the ROI, the right RSC cluster (k = 74) was also observed at voxel‐wise P < 0.01. For the opposite contrast, no brain regions were found to be more responsive to the time model than to the tracking distance model in either the ROI (voxel‐wise P < 0.05) or whole brain (voxel‐wise P < 0.01) threshold levels. Together, these results indicate that when translation is the critical factor for the task, these regions track translation rather than time, in support of the tracking translation/rotation model.
For the angle task, the contrast between the tracking rotation and time models at the whole brain level (voxel‐wise P < 0.01) revealed a cluster spanning bilateral RSC and posterior cingulate that was more sensitive to tracking rotation than to time, although we did not find this activation within the smaller ROI (voxel‐wise P < 0.05). Voxel location, cluster size (k), and t‐value and P‐value for the peak voxels in the whole‐brain analysis are as follows: RSC (x,y,z: 0,−42,18; k = 338; t 23 = 4.09; P = 0.000226; x,y,z: 4,−40,16; k = 338; t 23 = 3.33; P = 0.0015), posterior cingulate (x,y,z: −8,−36,28; k = 338; t 23 = 4.16; P = 0.000191; x,y,z: 2,−24,32; k = 338; t 23 = 4.01; P = 0.000279). No other regions were found on the whole‐brain map (Fig. 2D). For the opposite contrast, no brain regions were found to be more responsive to the time model than to the tracking rotation model at either the ROI (voxel‐wise P < 0.05) or whole brain (voxel‐wise P < 0.01) level of analysis, consistent with the tracking translation/rotation model.
Critically, the results of this parametric analysis suggest that the hippocampus, RSC, and PHC track the accumulation of translation and rotation signals even when no navigational goal is present, consistent with the tracking translation/rotation model. Furthermore, the magnitude of activation in hippocampus, RSC, and PHC was higher for translation than for time, and was higher for rotation than for time in RSC, suggesting that the tracking translation/rotation model is a better fit for the data than the time model. These results are consistent with the fact that translation and rotation signals were more salient and relevant to task performance than time alone in this task. These findings suggest that hippocampus, RSC, and PHC flexibly track the most relevant information for the task at hand, in this case, the magnitude of translation and/or rotation. These findings help resolve some of the discrepancies in the literature regarding the role of these regions in coding distance, as well as time and landmark information.
Encoding and Maintaining Path Integration Signals
This analysis focused on the memory aspects of the task by comparing brain activity on three dimensions of the task: (A) successful versus unsuccessful trials; (B) comparisons between activations in the distance task versus the angle task; (C) performance‐based analysis relating individual differences in proportion correct on each task with brain activation. We conducted these three analyses separately for the encoding and maintenance during delay of path integration signals during the DMS task.
Activity during encoding period
We examined BOLD activation during the first video of the task, the encoding period. Participants encoded the distance or angle over the course of the video, and this analysis focused on brain regions supporting the encoding of basic path integration information.
Successful encoding of path integration components
This analysis contrasted the encoding period for correct trials compared with incorrect trials. For the distance task, ROI analysis (voxel‐wise P < 0.05, cluster corrected to P < 0.05, minimum cluster size 175 voxels) found significant bilateral clusters that included hippocampal and PHC activation during the encoding period of successful trials compared to incorrect trials (Fig. 3A). This result is consistent with the hypothesis that hippocampus and PHC are important for encoding translation information. The hippocampal activation was located primarily in the head and body of the right hippocampus, and body of the left hippocampus. Peak voxel location, cluster size (k), and t‐value and P‐value for the peak voxels are as follows: Hippocampus: (x,y,z: −26,−26,−8; k = 293; t 23 = 3.07; P = 0.0027; x,y,z: 20,−14,−18; k = 246; t 23 = 2.95; P = 0.0036); PHC: (x,y,z: −24,−32,−16; k = 293; t 23 = 3.55; P = 0.0009; x,y,z: 24,−22,−20; k = 246; t 23 = 3.02; P = 0.0031). There was no significant activation in the ROI for the encoding period of the angle task that was specifically associated with correct subsequent performance in the test period.
Figure 3.
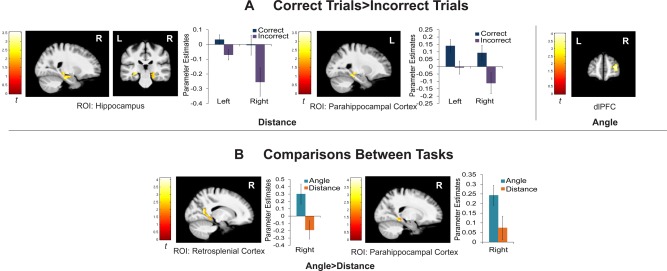
Activation during encoding period. (A) Activations for correct > incorrect trials during the encoding period for distance and angle. (B) Comparisons between the distance and angle task during the encoding period. Hippocampus, parahippocampal gyrus, and RSC are all shown as a masked ROI. Parameter estimates extracted from peak voxels in the ROI are included for illustration purposes. Error bars indicate standard error of the mean. ROIs used a voxel‐wise threshold of P < 0.05, corrected to family‐wise P < 0.05, minimum cluster extent 175 voxels. Whole brain results are also shown with a voxel‐wise threshold of P < 0.01, corrected to family‐wise P < 0.05, minimum cluster extent 219 voxels.
Whole‐brain analysis of the distance task (voxel‐wise P < 0.01, cluster corrected to P < 0.05, minimum cluster size 219) revealed additional significant activation in a cluster of bilateral thalamus for the encoding period that was associated with correct subsequent performance. The angle task showed significant activation associated with correct performance in the right dorsolateral prefrontal cortex (dlPFC). Table 2 summarizes whole‐brain results during encoding.
Table 2.
Whole‐brain results of encoding
| Left | Right | ||||||
|---|---|---|---|---|---|---|---|
| Contrast | Brain region | k | t | MNI x,y,z | k | t | MNI x,y,z |
| Distance Correct > Incorrect | Thalamus | 304 | 3.51 | −4,−18,4 | 304 | 3.75 | 6,−10,4 |
| Angle Correct > Incorrect | Middle Frontal Gyrus | 329 | 4.02 | 30,50,10 | |||
| Distance Correct > Angle Correct | Thalamus | 260 | 3.11 | 8,−8,10 | |||
| Putamen | 3.16 | 28,−14,6 | |||||
| Angle Correct > Distance Correct | Precentral Gyrus | 257 | 5.06a | −56,0,44 | 927 | 4.58 | 40,−8,62 |
| Postcentral Gyrus | 4.25 | 46,−32,56 | |||||
| Parahippocampal Cortex | 9186 | 3.92 | −28,−40,−6 | 9186 | 3.15 | 20,−38,−12 | |
| Retrosplenial Cortex | 4.12a | 16,−58,12 | |||||
| Collateral Sulcus | 3.50 | −26,−60,−10 | 4.52a | 22,−54,−6 | |||
| Lingual Gyrus | 5.84a | −6,−78,−2 | 7.13a | 12,−76,2 | |||
| Cuneus | 6.95a | −12,−84,28 | 6.29a | 18,−90,16 | |||
| Fusiform Gyrus | 5.36a | −16,−74,−6 | 5.19a | 18,−68,−10 | |||
| Distance Correlation with Accuracy | — | ||||||
| Angle Correlation with Accuracy | — |
Table includes contrasts for each experimental task of correct > incorrect trials, contrasts between the tasks, and between‐subject performance‐based activation. Cluster size (k) indicates the size of the significant cluster at voxel‐wise P < 0.01 corrected to family‐wise P < 0.05 with a minimum cluster threshold of 219 voxels. MNI coordinates reflect peak activation voxels within each cluster. t‐Values represent local peak voxel t‐statistics passing a threshold of P < 0.01.
Next to result indicates that the result holds at the voxel‐wise P < 0.001 level (family‐wise P < 0.05, minimum cluster threshold of 64 voxels).
Comparison of activation during encoding between different tasks
ROI analysis for the contrasts between the tasks showed that a cluster that included right RSC and PHC had greater activation during the encoding period in the angle task than in the distance task (Fig. 3B). Peak voxel location, cluster size (k), and t‐value and P‐value for the peak voxels are as follows: lateral RSC, angle > distance: (x,y,z: 16,−58,12; k = 248; t 23 = 4.12; P = 0.0002); PHC, angle > distance: (x,y,z: 20,−38,−12; k = 248; t 23 = 3.15; P = 0.002). In the ROI, both PHC and RSC peaks within the cluster hold at voxel‐wise P < 0.01 (k = 94), and the RSC peak within the cluster holds at voxel‐wise P < 0.005 (k = 43). Whole‐brain analysis (voxel‐wise P < 0.01) revealed significantly greater activation in a cluster spanning right RSC, bilateral PHC, bilateral cuneus, and bilateral lingual gyrus during the encoding period for the angle task compared to the distance task. At a more conservative voxel‐wise P < 0.001 threshold, a cluster in left precentral gyrus, and a cluster including right RSC, right collateral sulcus, and bilateral lingual gyrus, cuneus, and fusiform gyrus showed greater activation for the angle task than the distance task. The distance task showed greater activation than the angle task during encoding in a cluster of right thalamus and putamen (whole brain, voxel‐wise P < 0.01). Table 2 summarizes the whole‐brain results for the comparison between tasks during encoding.
Activation correlating with performance during encoding
We found no significant correlations between navigational accuracy and brain activation within our ROI (voxel‐wise P < 0.05) or within the whole‐brain (voxel‐wise P < 0.01) analysis.
Maintenance during delay
We next analyzed brain activations during the delay period between the encoding and test videos. During this time, participants needed to maintain the path integration component information from the encoded video to make a comparison with the second test video.
Successful maintenance of path integration components
This analysis contrasted activity during the delay period for correct trials compared with incorrect trials. ROI analysis (voxel‐wise P < 0.05, cluster corrected to P < 0.05, minimum cluster size 175 voxels) during the delay period showed significant activation for correct versus incorrect trials in the distance task in a cluster that contained the head and body of the left hippocampus (Fig. 4A; x,y,z: −34,−8,−20; k = 342; t 23 = 3.05; P = 0.0029). The ROI did not show significant activation during delay associated with correct subsequent performance for the angle task.
Figure 4.
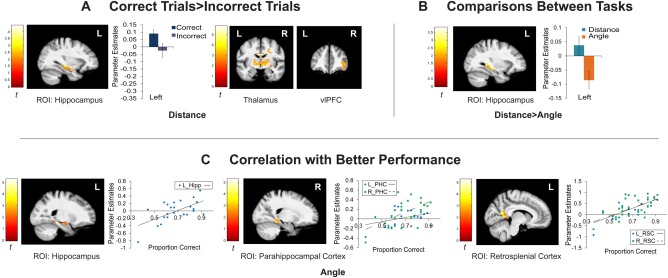
Activation supporting maintenance during the delay period. (A) Activations for correct > incorrect trials during the delay period for distance. No areas showed greater activation for this contrast for the angle task during delay. (B) Comparisons between the distance and angle tasks during the delay period. No regions were more active for the angle task. (C) Correlations of activation with performance during the delay period for the angle task. No regions showed a correlation with performance in the distance task. Hippocampus, parahippocampal gyrus, and RSC are all shown as a masked ROI. Parameter estimates were extracted from peak voxels in the ROI included for illustration purposes. Error bars indicate standard error of the mean. The ROI used a voxel‐wise threshold of P < 0.05, corrected to family‐wise P < 0.05, minimum cluster extent 175 voxels. Whole brain results are also shown with a voxel‐wise threshold of P < 0.01, corrected to family‐wise P < 0.05, minimum cluster extent 219 voxels.
Whole‐brain analysis (voxel‐wise P < 0.01) of successful maintenance (correct vs. incorrect trials) during the delay period of the distance task revealed activation within a bilateral thalamus cluster, a cluster of right ventrolateral PFC, a cluster that included bilateral lingual gyrus and right cuneus and lateral occipital gyrus, and a cluster that included left cuneus and lateral occipital gyrus. A cluster in right lateral occipital gyrus held at the more conservative whole brain level (voxel‐wise P < 0.001). No brain regions passed the significance thresholds during the delay period for activation associated with correct subsequent performance in the angle task. Complete results for the whole brain for the delay period are listed in Table 3.
Table 3.
Whole‐brain results of maintenance during delay
| Left | Right | ||||||
|---|---|---|---|---|---|---|---|
| Contrast | Brain region | k | t | MNI x,y,z | k | t | MNI x,y,z |
| Distance Correct > Incorrect | Inferior Frontal Gyrus | 296 | 3.33 | 44,40,0 | |||
| Precentral Gyrus | 1197 | 3.48 | 48,12,20 | ||||
| Insula | 3.23 | 32,16,−4 | |||||
| Putamen | 1387 | 2.64 | 32,−8,−6 | ||||
| Thalamus | 1387 | 3.75 | −4,−10,0 | 3.63 | 10,−20,6 | ||
| Mesencephelon | 3836 | 3.67 | 0,−36,−20 | 3836 | 2.63 | 6,−36,−22 | |
| Pons | 3.34 | 12,−34,−32 | |||||
| Lingual Gyrus | 3.26 | −4,−70,0 | 3.43 | 6,−72,6 | |||
| Calcarine Sulcus | 3.08 | 14,−66,8 | |||||
| Cerebellum | 3.96 | −28,−42,−30 | 4.06 | 26,−40,−38 | |||
| Cuneus | 1055 | 3.12 | −10,−94,16 | 2.82 | 14,−92,8 | ||
| Intraparietal Sulcus | 3.00 | −28,−66,28 | 4.04 | 18,−70,46 | |||
| Lateral Occipital Gyrus | 3.72 | −26,−90,0 | 4.23a | 34,−90,4 | |||
| Fusiform Gyrus | 3.55 | −26,−84,−8 | |||||
| Angle Correct > Incorrect | — | ||||||
| Distance Correct > Angle Correct | Precentral Gyrus | 1087 | 3.09 | 48,−8,16 | |||
| Insula | 3.40 | 42,−10,4 | |||||
| Hippocampus | 1493 | 3.06 | −34,−34,−6 | 3.71 | 32,−36,0 | ||
| Angle Correct > Distance Correct | — | ||||||
| Distance Correlation with Accuracy | — | ||||||
| Angle Correlation with Accuracy | Precentral Gyrus | 283 | 3.56 | −48,−6,24 | 798 | 5.11a | 64,6,22 |
| Postcentral Gyrus | 3.41 | −64,−16,32 | 3.50 | 62,−8,30 | |||
| Parahippocampal Cortex | 1604 | 3.66 | 20,−42,−10 | ||||
| Retrosplenial Cortex | 1604 | 5.27a | −8,−52,4 | 4.35a | 18,−44,0 | ||
| Lingual Gyrus | 3.72 | −14,−58,−8 | 6.00a | 14,−58,0 | |||
| Cerebellum | 3.32 | 16,−56,−16 | |||||
| Superior Temporal Sulcus | 608 | 3.56 | −60,−50,10 | ||||
| Lateral Occipital Gyrus | 4.08 | −50,−68,0 |
Table includes contrasts for each experimental task of correct > incorrect trials, contrasts between the tasks, and between‐subject performance‐based activation. Cluster size (k) indicates the size of the significant cluster at voxel‐wise P < 0.01 corrected to family‐wise P < 0.05 with a minimum cluster threshold of 219 voxels. MNI coordinates reflect peak activation voxels within each cluster. t‐Values represent local peak voxel t‐statistics passing a threshold of P < 0.01.
Next to result indicates that it holds at the voxel‐wise P < 0.001 level (family‐wise P < 0.05, minimum cluster threshold of 64 voxels).
Comparison of activation during the delay period between different tasks
The ROI (voxel‐wise P < 0.05) revealed significantly greater activation during the delay period in the distance task than in the angle task in a cluster encompassing the left hippocampus body and tail (Fig. 4B; x,y,z: −34,−34,−6; k = 347; t 23 = 3.06; P = 0.0028). This ROI result held at the voxel‐wise P < 0.005 level. The ROI did not show significant differences for the angle task greater than the distance task during the delay period at either the ROI (voxel‐wise P < 0.05) or whole‐brain (voxel‐wise P < 0.01) level of analysis.
Whole‐brain analysis (voxel‐wise P < 0.01) of activation during the delay period showed significantly greater activation in the distance task compared to the angle task in the left tail of the hippocampus and a region that spanned right hippocampus tail, insula, and precentral gyrus. Complete results for the whole brain during the delay period are listed in Table 3.
Activation correlating with performance during the delay period
For the angle task, activation in the ROI (voxel‐wise P < 0.05) was observed in left hippocampus, a cluster containing left RSC and PHC, and a cluster containing right RSC and PHC (Fig. 4C). Peak voxel location, cluster size (k), and t‐value and P‐value for the peak voxels are as follows: Hippocampus: (x,y,z: −18,−10,−16; k = 208; t 23 = 4.40; P = 0.0001); PHC: (x,y,z: −20,−38,−12; t 23 = 2.32; k = 391; P = 0.0149; x,y,z: 20,−42,−10; k = 327; t 23 = 3.66; P = 0.0007); RSC: (x,y,z: −8,−52,4; k = 391; t 23 = 5.27; P = 0.00001; x,y,z: 18,−44,0; k = 327; t 23 = 4.35; P = 0.0001). Within the ROI, a cluster that included right RSC, cingulate isthmus, and PHC held at voxel‐wise P < 0.01 (k = 141), and the right PHC area held at voxel‐wise P < 0.001 (k = 28). Left RSC continuing into the cingulate isthmus held at voxel‐wise P < 0.001 (k = 121). The ROI did not show significant parametric correlation of activity during delay with behavioral performance for the distance task.
At the whole‐brain level (voxel‐wise P < 0.01), better performance in the angle task was associated with greater activation in a cluster spanning bilateral RSC, right PHC, bilateral lingual gyrus, and in bilateral clusters of precentral gyrus during the delay period. At the more conservative voxel‐wise P < 0.001 whole brain level, this relationship was found in left RSC, right RSC and lingual gyrus, and right precentral gyrus. Table 3 summarizes the whole‐brain results for performance‐based activation.
DISCUSSION
This experiment examined the mechanisms underlying human path integration by isolating its translational and rotational components in a novel DMS task. Our results demonstrate two key findings. First, consistent with our hypothesis, the hippocampus and RSC, as well as PHC, demonstrated changes in BOLD activity that were tied to the magnitude of translation and rotation during encoding. These results suggest that these regions track self‐motion when no end point or goal is present, consistent with a model that tracks translation/rotation information. In addition, RSC was found to be more sensitive to the online tracking of both translation and rotation signals than the tracking of time, and hippocampus and PHC were more sensitive to the tracking of translation than time. Given that time was the less task‐relevant property, these findings suggest that these regions may flexibly code task‐relevant information. This result helps resolve some of the discrepancies in the imaging literature with regards to the role of these regions in coding distance, rotation, time, and landmark information. Second, the results demonstrate that the hippocampus, PHC, and RSC were recruited for the successful encoding and maintenance of task‐relevant path integration information. Together, these results provide evidence that hippocampus, PHC, and RSC flexibly track translation and rotation signals used for path integration.
Hippocampus, RSC, and PHC Track the Accumulation of Translation and Rotation Information
The hippocampus, RSC, and PHC tracked the magnitude of both translation and rotation during movement, with the hippocampus and RSC results holding at the whole‐brain level and at more conservative voxel‐wise thresholds in the ROI, suggesting that these regions are important for tracking self‐motion during path integration. These results provide insight into how the brain processes the basic translational and rotational components of complex path integration. Both the configural model (whereby the navigator encodes the entire outbound journey) and the homing vector model (whereby the navigator maintains a continuous vector back to the home location) [Chrastil et al., 2015; Loomis et al., 1993; Philbeck et al., 2001; Wiener et al., 2011] of path integration require updating the magnitude of movement from one time point to the next [Benhamou et al., 1990; Fujita et al., 1993, 1990; Muller and Wehner, 1988]. Thus, an understanding of how the brain supports these basic signals that are used for path integration is vital to understanding path integration more broadly, and this study provides that critical link.
The hippocampus has previously been implicated in distance estimation, but only during goal‐directed navigation tasks. Patients with right hippocampal damage had difficulty estimating linear movement when walking to a remembered target location [Philbeck et al., 2004], suggesting that the hippocampus is important for tracking translation during path integration. Several recent neuroimaging studies have reported a relationship between hippocampal activity and distance to a goal location [Chrastil et al., 2015; Howard et al., 2014; Morgan et al., 2011; Sherrill et al., 2013; Spiers and Maguire, 2007; Vass et al., 2016; Viard et al., 2011]. The results of these studies vary, with some reporting that activity increases and others that activity decreases with distance to a goal (see [Spiers and Barry, 2015] for review). Viard et al. [2011] found increasing RSC activity with proximity to a known goal at the start of each trial, which is consistent with our findings relating to distance from the start location, although they did not track changes in signal during movement. In these previous studies, it was unclear whether to interpret the BOLD response associated with distance as anchored to the initial start point or to the final goal location. For example, in a study in our own lab [Sherrill et al., 2013], navigators were shown an overhead map of the environment and then had to navigate to the remembered location. We found increasing hippocampal activation with proximity to the goal, yet we could not be certain that it was not in fact increasing activation with distance from the start, since those factors could not be separated. In contrast, participants in the present study encoded an undetermined distance or rotation as the video progressed, making the start point the only reliable anchor. This key distinction extends previous results to include the online tracking of rotation and translation as they accumulate during navigation.
Behavioral evidence suggests that humans use the accumulation of intrinsic self‐motion information, rather than extrinsic metrics, to gauge distances [Chrastil and Warren, 2014]. Our results build on these behavioral findings by demonstrating that the hippocampus, RSC, and PHC track movement during human path integration, in particular the magnitude of translation and rotation. These findings support previous research that the hippocampus tracks distance, and further suggests that the hippocampus also tracks rotation. These results are also in line with animal research suggesting that the hippocampus tracks distance and path coding more generally [Gothard et al., 1996; Johnson and Redish, 2007; Pfeiffer and Foster, 2013]. To our knowledge, few human studies have shown a relationship between RSC and distance tracking [Chrastil et al., 2015; Viard et al., 2011], and we know of no studies implicating PHC in tracking movement. Together, these results support a systems‐level model of path integration that includes tracking self‐motion information by hippocampus, RSC, and PHC.
Computational models predict that information about the direction and speed of movement could update grid cell responses, which subsequently update hippocampal place cells and the representation of position in the environment [Burgess et al., 2007; Erdem and Hasselmo, 2012; Hasselmo, 2009]. Anatomical connections between RSC, hippocampus, and PHC support these computational models [Aggleton et al., 2012; Sugar et al., 2011]. However, a recent study indicates that passive movement disrupts grid cell coding in the PHC in rodents [Winter et al., 2015], suggesting that self‐motion motor information is key to path integration. Although the present study utilizes passive movement, visual information has been shown to be sufficient for path integration behavior in humans [Kearns et al., 2002; Tcheang et al., 2011], and grid cell‐like representations have been found in the human MTL using purely visual stimuli with control of movement [Doeller et al., 2010; Jacobs et al., 2013]. Thus, motor information is likely very important to human path integration, but greater understanding of the relationship between human and rodent path integration is needed to fully parcellate the relative contributions of vision, motor efference, proprioception, and vestibular input.
Animal recordings have reported cells sensitive to time in hippocampus [MacDonald et al., 2011; Pastalkova et al., 2008]. Separate testing of cells in animals showed some cells were sensitive to either distance or time, but most recorded cells were sensitive to both factors [Kraus et al., 2013]. In the current task, RSC (coupled with posterior cingulate for rotation) was found to be more sensitive to the online tracking of both translation and rotation signals than the tracking of time while hippocampus and PHC were more sensitive to translation only. The greater sensitivity in the RSC for translation and rotation than for time held at more conservative thresholds than those for hippocampus and PHC. Critically, translation and rotation signals were more task‐relevant than time in the current task. These findings suggest that RSC might flexibly track the most relevant information for the task at hand, in this case, the magnitude of translation and rotation. Hippocampus and PHC also flexibly track task‐relevant information but may be more sensitive to translation. These findings also support the idea of mixed selectivity, in which neurons within a defined anatomical region can tune to multiple task‐related aspects. Prefrontal neurons have mixed selectivity for encoding distributed information about all task‐relevant features [Fusi et al., 2016; Rigotti et al., 2013], and neurons with mixed selectivity have been found in rodent hippocampus [McKenzie et al., 2014] and posterior parietal cortex [Raposo et al., 2014]. Applying a mixed selectivity interpretation to the fMRI data reported here helps resolve some of the discrepancies in the fMRI literature with regards to the role of these regions in coding distance, rotation, time, or landmark information by suggesting that the hippocampus, RSC, and PHC could maintain high‐dimensional representations of all of these navigational factors, with mixed selectivity at both the neuronal and regional level, allowing for context‐dependent tracking of relevant information.
Finally, it is important to note that research in both humans and rodents has found that, in addition to the hippocampal system, the striatal system contributes to spatial navigation under certain conditions (see [Chersi and Burgess, 2015] for review). The classic distinction, based on rat studies of place and response learning, suggests that response learning is dependent on the striatum, whereas the hippocampal system is critical for place‐based navigation [McDonald and White, 1994; Packard and Knowlton, 2002; Packard and McGaugh, 1996]. Human neuroimaging studies have also demonstrated striatal activity in well‐learned, response‐based navigational tasks [Hartley et al., 2003; Iaria et al., 2003], and findings from our lab have demonstrated striatal activity under navigational conditions that require the flexible updating of behavioral alternatives or the “disambiguation of actions” [Brown et al., 2012; Brown and Stern, 2014]. Interestingly, in our path integration task we did not find striatal activation in either distance or angle tracking, although we did see activity in the putamen during successful maintenance of distance information and greater putamen activation in the distance task than the angle task during encoding. These results suggest that self‐motion tracking during path integration appears to rely more heavily on the hippocampal system than the striatal system.
Hippocampus, PHC, and RSC Flexibly Support Encoding and Maintenance of Path Integration Signals
The use of a classic DMS design also allowed us to examine encoding and maintenance of translation and rotation signals. Previous work shows that the hippocampus and PHC are important for subsequent memory [Ranganath et al., 2005; Schon et al., 2004] and that activity during delay in a working memory task corresponds to subsequent memory in non‐navigational DMS tasks [Nauer et al., 2015]. Thus, analysis of sample and delay period activity allowed us to test the hypothesis that hippocampus, PHC, and RSC encode and maintain self‐motion information, in addition to the tracking functions discussed above. In both the distance and angle tasks, we found evidence for greater activation for correct trials than for incorrect trials during the encoding and/or delay periods in hippocampus, PHC, and RSC. First considering the hippocampus, during the delay, correct trials in the distance task recruited hippocampal head and body. Although during delay, distance selectively recruited hippocampus bilaterally compared to angle, in the angle task greater hippocampal activation was associated with better performance. Critically, these findings suggest that the hippocampus flexibly maintains the information that is most relevant for the task at hand, whether it is translational or rotational information. Hippocampal activity has been tied to flexible behavior in general [Brown et al., 2014a, 2012; Cohen and Eichenbaum, 1993; Marchette et al., 2011; Rubin et al., 2014]. In other spatial tasks, hippocampal activity has been observed in landmark‐based navigation [Hartley et al., 2003; Howard et al., 2014; Maguire et al., 1998; Wolbers and Büchel, 2005] and in tasks that likely require path integration mechanisms [Sherrill et al., 2013; Wolbers et al., 2007]. Together, these results suggest that the hippocampus plays an essential role in flexibly encoding, updating, and maintaining relevant information, regardless of whether the information necessary for the task is distance, time, or rotational information.
PHC was active during successful encoding of the distance task, but was also more active during encoding for angle than for distance. During delay, increased activation in PHC during the angle task was associated with better performance, a result that held at the most conservative voxel‐wise threshold. Thus, PHC supported successful navigation for both tasks. Both PHC and hippocampus are involved in encoding and maintenance phases of non‐navigational DMS tasks [Newmark et al., 2013; Schon et al., 2005, 2004], and our findings suggest that they further support navigational working memory. PHC is known to be involved in landmark navigation, particularly in the recognition of locations [Epstein, 2008; Epstein and Vass, 2013], identification of navigational decision points in a new environment [Janzen and van Turennout, 2004; Janzen and Weststeijn, 2007], and disambiguation of overlapping routes [Brown et al., 2014b, 2010; Brown and Stern, 2014]. In contrast to these other studies, there were no landmarks to aid navigation in the present experiment. The PHC activation observed here suggests that this region plays a significant role in processing path integration signals. In support of this interpretation, previous research has found significant PHC activation during a navigation task in landmark‐free environments [Doeller et al., 2010; Sherrill et al., 2013]. Together with the present results, these findings suggest that PHC may play a larger role in navigation than its known role in landmark encoding and recognition; our data suggest it may additionally encode and maintain translational and rotational path integration signals.
Results of this study suggest that RSC makes a significant contribution to processing heading information. RSC activation was greater for the angle task than for the distance task during encoding, and RSC activity in the angle task during delay was associated with increased accuracy; the latter result held at the most conservative voxel‐wise threshold. The RSC findings reported here mirror those found in animal and human studies. Head direction cells have been found in rodent RSC [Chen et al., 1994; Cho and Sharp, 2001]. In humans, RSC and nearby occipital cortices are sensitive to heading direction [Baumann and Mattingley, 2010; Doeller et al., 2010; Marchette et al., 2014]. More generally, RSC is active during many navigation tasks [Hartley et al., 2003; Vass and Epstein, 2013; Wolbers and Büchel, 2005]. RSC and nearby posterior parietal cortex (PPC) are important for processing vestibular signals [Seemungal et al., 2008] and coordinating egocentric movements with allocentric information [Galati et al., 2010; Howard et al., 2014]. Lesions to RSC and PPC cause impairments in recalling spatial relationships, including directional information [Aguirre and D'Esposito, 1999; Takahashi et al., 1997], and PPC lesions in rats impair path integration [Save et al., 2001; Save and Poucet, 2009]. Our findings of significant RSC activation during the angle task, and greater activation in that task than in the distance task, support the idea that RSC selectively processes egocentric heading signals that are necessary for path integration. Yet, the tracking of both translational and rotational information by RSC suggests a flexible role for updating self‐motion information.
The two primary findings from our study, together with previous literature, suggest that these regions form the hub of more distributed network supporting spatial navigation [Ekstrom et al., 2014; Miller et al., 2014]. As a hub, these regions receive task‐relevant information from and interact with other brain areas including the PPC, thalamus, insula, and medial prefrontal cortex. Our findings also suggest that these hub regions (Hippocampus, PHC, and RSC) are not simply specialized for coding distance, rotation, or time, but instead suggest these regions can flexibly track the most salient or task‐relevant information for navigation.
In sum, we found hippocampal, parahippocampal, and retrosplenial activations corresponded to increasing translation and rotation, suggesting that these regions track self‐motion. RSC tracked both translation and rotation more so than time, and hippocampus and PHC tracked translation more than time. In addition, we report that the hippocampus, PHC, and RSC all contribute to the encoding and maintenance of path integration signals. These findings provide a neural mechanism for tracking self‐motion information during path integration, and suggest that these regions form the hub of a more distributed network supporting spatial navigation.
ACKNOWLEDGMENT
The authors would like to thank Andrew Whiteman, Rachel Nauer, and Allen Chang for their assistance and Sam Ling for helpful discussions.
Conflict of interest: The authors declare no competing financial interests.
Author Contributions: ERC, KRS, MEH, and CES designed the experiments. ERC and KRS collected data. ERC analyzed the data with input from KRS and CES. ERC, KRS, MEH, and CES wrote the manuscript.
REFERENCES
- Aggleton JP, Wright NF, Vann SD, Saunders RC (2012): Medial temporal lobe projections to the retrosplenial cortex of the macaque monkey. Hippocampus 22:1883–1900. [DOI] [PMC free article] [PubMed] [Google Scholar]
- Aguirre GK, D'Esposito M (1999): Topographical disorientation: A synthesis and taxonomy. Brain 122:1613–1628. [DOI] [PubMed] [Google Scholar]
- Aguirre GK, Detre JA, Alsop DC, D'Esposito M (1996): The parahippocampus subserves topographical learning in Man. Cereb Cortex 6:823–829. [DOI] [PubMed] [Google Scholar]
- Alyan S, McNaughton BL (1999): Hippocampectomized rats are capable of homing by path integration. Behav Neurosci 113:19–31. [DOI] [PubMed] [Google Scholar]
- Aminoff E, Gronau N, Bar M (2007): The parahippocampal cortex mediates spatial and nonspatial associations. Cereb Cortex 17:1493–1503. [DOI] [PubMed] [Google Scholar]
- Andersson JLR, Hutton C, Ashburner J, Turner R, Friston K (2001): Modeling geometric deformations in EPI time series. Neuroimage 13:903–919. [DOI] [PubMed] [Google Scholar]
- Ashburner J (2007): A fast diffeomorphic image registration algorithm. Neuroimage 38:95–113. [DOI] [PubMed] [Google Scholar]
- Barendregt M, Harvey BM, Rokers B, Dumoulin SO (2015): Transformation from a retinal to a cyclopean representation in human visual cortex. Curr Biol 25:1982–1987. [DOI] [PubMed] [Google Scholar]
- Baumann O, Mattingley JB (2010): Medial parietal cortex encodes perceived heading direction in humans. J Neurosci 30:12897–12901. [DOI] [PMC free article] [PubMed] [Google Scholar]
- Benhamou S, Sauve J‐P, Bovet P (1990): Spatial memory in large scale movements: Efficiency and limitation of the egocentric coding process. J Theor Biol 145:1–12. [Google Scholar]
- Brown TI, Whiteman AS, Aselcioglu I, Stern CE (2014a): Structural differences in hippocampal and prefrontal gray matter volume support flexible context‐dependent navigation ability. J Neurosci 34:2314–2320. [DOI] [PMC free article] [PubMed] [Google Scholar]
- Brown TI, Hasselmo ME, Stern CE (2014b): A high‐resolution study of hippocampal and medial temporal lobe correlates of spatial context and prospective overlapping route memory. Hippocampus 24:819–839. [DOI] [PMC free article] [PubMed] [Google Scholar]
- Brown TI, Ross RS, Keller JB, Hasselmo ME, Stern CE (2010): Which way was I going? Contextual retrieval supports the disambiguation of well learned overlapping navigational routes. J Neurosci 30:7414–7422. [DOI] [PMC free article] [PubMed] [Google Scholar]
- Brown TI, Ross RS, Tobyne SM, Stern CE (2012): Cooperative interactions between hippocampal and striatal systems support flexible navigation. Neuroimage 60:1316–1330. [DOI] [PMC free article] [PubMed] [Google Scholar]
- Brown TI, Stern CE (2014): Contributions of medial temporal lobe and striatal memory systems to learning and retrieving overlapping spatial memories. Cereb Cortex 24:1906–1922. [DOI] [PMC free article] [PubMed] [Google Scholar]
- Brun VH, Leutgeb S, Wu H‐Q, Schwarcz R, Witter MP, Moser EI, Moser M‐B (2008): Impaired spatial representation in CA1 after lesion of direct input from entorhinal cortex. Neuron 57:290–302. [DOI] [PubMed] [Google Scholar]
- Burgess N, Barry C, O'Keefe J (2007): An oscillatory interference model of grid cell firing. Hippocampus 17:801–812. [DOI] [PMC free article] [PubMed] [Google Scholar]
- Byrne P, Becker S, Burgess N (2007): Remembering the past and imagining the future: A neural model of spatial memory and imagery. Psychol Rev 114:340–375. [DOI] [PMC free article] [PubMed] [Google Scholar]
- Chen LL, Lin LH, Green EJ, Barnes CA, McNaughton BL (1994): Head‐direction cells in the rat posterior cortex. I. Anatomical distribution and behavioral modulation. Exp Brain Res 101:8–23. [DOI] [PubMed] [Google Scholar]
- Chersi F, Burgess N (2015): The cognitive architecture of spatial navigation: Hippocampal and striatal contributions. Neuron 88:64–77. [DOI] [PubMed] [Google Scholar]
- Cho J, Sharp PE (2001): Head direction, place, and movement correlates for cells in the rat retrosplenial cortex. Behav Neurosci 115:3–25. [DOI] [PubMed] [Google Scholar]
- Chrastil E (2013): Neural evidence supports a novel framework for spatial navigation. Psychon Bull Rev 20:208–227. [DOI] [PubMed] [Google Scholar]
- Chrastil ER, Warren WH (2014): Does the human odometer use an extrinsic or intrinsic metric? Atten Percept Psychophys 76:230–246. [DOI] [PubMed] [Google Scholar]
- Chrastil ER, Sherrill KR, Hasselmo ME, Stern CE (2015): There and back again: Hippocampus and retrosplenial cortex track homing distance during human path integration. J Neurosci 35:15442–15452. [DOI] [PMC free article] [PubMed] [Google Scholar]
- Cohen NJ, Eichenbaum HB (1993): Memory, Amnesia and the Hippocampal System. Cambridge, MA: M.I.T. Press. [Google Scholar]
- Damasio H (2005): Human Brain Anatomy in Computerized Images, 2nd ed. Oxford: Oxford University Press. [Google Scholar]
- Davis T, Xue G, Love BC, Preston AR, Poldrack RA (2014): Global neural pattern similarity as a common basis for categorization and recognition memory. J Neurosci 34:7472–7484. [DOI] [PMC free article] [PubMed] [Google Scholar]
- Doeller CF, Barry C, Burgess N (2010): Evidence for grid cells in a human memory network. Nature 463:657–661. [DOI] [PMC free article] [PubMed] [Google Scholar]
- Ekstrom AD, Kahana MJ, Calpan JB, Fields TA, Isham EA, Newman EL, Fried I (2003): Cellular networks underlying human spatial navigation. Nature 425:184–188. [DOI] [PubMed] [Google Scholar]
- Ekstrom AD, Arnold AEGF, Iaria G (2014): A critical review of the allocentric spatial representation and its neural underpinnings: Toward a network‐based perspective. Front Hum Neurosci 8:803. [DOI] [PMC free article] [PubMed] [Google Scholar]
- Epstein RA (2008): Parahippocampal and retrosplenial contributions to human spatial navigation. Trends Cogn Sci 12:388–396. [DOI] [PMC free article] [PubMed] [Google Scholar]
- Epstein RA, Vass LK (2013): Neural systems for landmark‐based wayfinding in humans. Philos Trans R Soc London B Biol Sci 369:20120533. [DOI] [PMC free article] [PubMed] [Google Scholar]
- Erdem UM, Hasselmo M (2012): A goal‐directed spatial navigation model using forward trajectory planning based on grid cells. Eur J Neurosci 35:916–931. [DOI] [PMC free article] [PubMed] [Google Scholar]
- Fujita N, Klatzky RL, Loomis JM, Golledge RG (1993): The encoding‐error model of pathway completion without vision. Geogr Anal 25:295–314. [Google Scholar]
- Fujita N, Loomis JM, Klatzky RL, Golledge RG (1990): A minimal representation for dead‐reckoning navigation: Updating the homing vector. Geogr Anal 22:326–335. [Google Scholar]
- Fusi S, Miller EK, Rigotti M (2016): Why neurons mix: High dimensionality for higher cognition. Curr Opin Neurobiol 37:66–74. [DOI] [PubMed] [Google Scholar]
- Fyhn M, Hafting T, Treves A, Moser M‐B, Moser EI (2007): Hippocampal remapping and grid realignment in entorhinal cortex. Nature 446:190–194. [DOI] [PubMed] [Google Scholar]
- Fyhn M, Molden S, Witter MP, Moser EI, Moser MB (2004): Spatial representation in the entorhinal cortex. Science 305:1258–1264. (80‐) [DOI] [PubMed] [Google Scholar]
- Galati G, Pelle G, Berthoz A, Committeri G (2010): Multiple reference frames used by the human brain for spatial perception and memory. Exp Brain Res 206:109–120. [DOI] [PubMed] [Google Scholar]
- Gothard KM, Skaggs WE, McNaughton BL (1996): Dynamics of mismatch correction in the hippocampal ensemble code for space: Interaction between path integration and environmental cues. J Neurosci 16:8027–8040. [DOI] [PMC free article] [PubMed] [Google Scholar]
- Hafting T, Fyhn M, Molden S, Moser M‐B, Moser EI (2005): Microstructure of a spatial map in the entorhinal cortex. Nature 436:801–806. [DOI] [PubMed] [Google Scholar]
- Hartley T, Maguire EA, Spiers HJ, Burgess N (2003): The well‐worn route and the path less traveled: Distinct neural bases of route following and wayfinding in humans. Neuron 37:877–888. [DOI] [PubMed] [Google Scholar]
- Harvey BM, Klein BP, Petridou N, Dumoulin SO (2013): Topographic representation of numerosity in the human parietal cortex. Science 341:1123–1126. [DOI] [PubMed] [Google Scholar]
- Hasselmo ME (2009): A model of episodic memory: Mental time travel along encoded trajectories using grid cells. Neurobiol Learn Mem 92:559–573. [DOI] [PMC free article] [PubMed] [Google Scholar]
- Howard LR, Javadi AH, Yu Y, Mill RD, Morrison LC, Knight R, Loftus MM, Staskute L, Spiers HJ (2014): The Hippocampus and Entorhinal Cortex Encode the Path and Euclidean Distances to Goals during Navigation. Curr Biol 24:1331–1340. [DOI] [PMC free article] [PubMed] [Google Scholar]
- Iaria G, Petrides M, Dagher A, Pike B, Bohbot VD (2003): Cognitive strategies dependent on the hippocampus and caudate nucleus in human navigation: Variability and change with practice. J Neurosci 23:5945–5952. [DOI] [PMC free article] [PubMed] [Google Scholar]
- Ino T, Inoue Y, Kage M, Hirose S, Kimura T, Fukuyama H (2002): Mental navigation in humans is processed in the anterior bank of the parieto‐occipital sulcus. Neurosci Lett 322:182–186. [DOI] [PubMed] [Google Scholar]
- Jacobs J, Kahana MJ, Ekstrom AD, Mollison MV, Fried I (2010): A sense of direction in human entorhinal cortex. Proc Natl Acad Sci USA 107:6487–6492. [DOI] [PMC free article] [PubMed] [Google Scholar]
- Jacobs J, Weidemann CT, Miller JF, Solway A, Burke JF, Wei X‐X, Suthana N, Sperling MR, Sharan AD, Fried I, Kahana MJ (2013): Direct recordings of grid‐like neuronal activity in human spatial navigation. Nat Neurosci 16:1188–1190. [DOI] [PMC free article] [PubMed] [Google Scholar]
- Janzen G, van Turennout M (2004): Selective neural representation of objects relevant for navigation. Nat Neurosci 7:673–677. [DOI] [PubMed] [Google Scholar]
- Janzen G, Weststeijn CG (2007): Neural representation of object location and route direction: An event‐related fMRI study. Brain Res 1165:116–125. [DOI] [PubMed] [Google Scholar]
- Johnson A, Redish AD (2007): Neural ensembles in CA3 transiently encode paths forward of the animal at a decision point. J Neurosci 27:12176–12189. [DOI] [PMC free article] [PubMed] [Google Scholar]
- Kearns MJ, Warren WH, Duchon AP, Tarr MJ (2002): Path integration from optic flow and body senses in a homing task. Perception 31:349–374. [DOI] [PubMed] [Google Scholar]
- Kim S, Sapiurka M, Clark RE, Squire LR (2013): Contrasting effects on path integration after hippocampal damage in humans and rats. Proc Natl Acad Sci USA 110:4732–4737. [DOI] [PMC free article] [PubMed] [Google Scholar]
- Kraus BJ, Robinson RJ, White JA, Eichenbaum H, Hasselmo ME (2013): Hippocampal “time cells”: Time versus path integration. Neuron 78:1090–1101. [DOI] [PMC free article] [PubMed] [Google Scholar]
- Loomis JM, Klatzky RL, Golledge RG, Cicinelli JG, Pellegrino JW, Fry PA (1993): Nonvisual navigation by blind and sighted: Assessment of path integration ability. J Exp Psychol Gen 122:73–91. [DOI] [PubMed] [Google Scholar]
- MacDonald CJ, Lepage KQ, Eden UT, Eichenbaum H (2011): Hippocampal “time cells” bridge the gap in memory for discontiguous events. Neuron 71:737–749. [DOI] [PMC free article] [PubMed] [Google Scholar]
- Maguire EA, Burgess N, Donnett JG, Frackowiak RSJ, Frith CD, O'Keefe J (1998): Knowing where and getting there: A human navigation network. Science 280:921–924. [DOI] [PubMed] [Google Scholar]
- Maldjian JA, Laurienti PJ, Kraft RA, Burdette JH (2003): An automated method for neuroanatomic and cytoarchitectonic atlas‐based interrogation of fMRI data sets. NeuroImage 19:1233–1239. [DOI] [PubMed] [Google Scholar]
- Marchette SA, Bakker A, Shelton AL (2011): Cognitive mappers to creatures of habit: Differential engagement of place and response learning mechanisms predicts human navigational behavior. J Neurosci 31:15264–15268. [DOI] [PMC free article] [PubMed] [Google Scholar]
- Marchette SA, Vass LK, Ryan J, Epstein RA (2014): Anchoring the neural compass: Coding of local spatial reference frames in human medial parietal lobe. Nat Neurosci 17:1598–1606. [DOI] [PMC free article] [PubMed] [Google Scholar]
- McDonald RJ, White NM (1994): Parallel information processing in the water maze: Evidence for independent memory systems involving dorsal striatum and hippocampus. Behav Neural Biol 61:260–270. [DOI] [PubMed] [Google Scholar]
- McKenzie S, Frank AJ, Kinsky NR, Porter B, Rivière PD, Eichenbaum H (2014): Hippocampal representation of related and opposing memories develop within distinct, hierarchically organized neural schemas. Neuron 83:202–215. [DOI] [PMC free article] [PubMed] [Google Scholar]
- McNaughton BL, Battaglia FP, Jensen O, Moser EI, Moser M‐B (2006): Path integration and the neural basis of the “cognitive map.” Nat Rev Neurosci 7:663–678. [DOI] [PubMed] [Google Scholar]
- Miller AMP, Vedder LC, Law LM, Smith DM (2014): Cues, context, and long‐term memory: The role of the retrosplenial cortex in spatial cognition. Front Hum Neurosci 8:586. [DOI] [PMC free article] [PubMed] [Google Scholar]
- Miller JF, Neufang M, Solway A, Brandt A, Trippel M, Mader I, Hefft S, Merkow M, Polyn SM, Jacobs J, Kahana MJ, Schulze‐Bonhage A (2013): Neural activity in human hippocampal formation reveals the spatial context of retrieved memories. Science 342:1111–1114. [DOI] [PMC free article] [PubMed] [Google Scholar]
- Morgan LK, Macevoy SP, Aguirre GK, Epstein RA (2011): Distances between real‐world locations are represented in the human hippocampus. J Neurosci 31:1238–1245. [DOI] [PMC free article] [PubMed] [Google Scholar]
- Muller M, Wehner R (1988): Path integration in desert ants, Cataglyphis fortis. Proc Natl Acad Sci USA 85:5287–5290. [DOI] [PMC free article] [PubMed] [Google Scholar]
- Nauer RK, Whiteman AS, Dunne MF, Stern CE, Schon K (2015): Hippocampal subfield and medial temporal cortical persistent activity during working memory reflects ongoing encoding. Front Syst Neurosci 9:30. [DOI] [PMC free article] [PubMed] [Google Scholar]
- Newmark RE, Schon K, Ross RS, Stern CE (2013): Contributions of the hippocampal subfields and entorhinal cortex to disambiguation during working memory. Hippocampus 23:467–475. [DOI] [PMC free article] [PubMed] [Google Scholar]
- O'Doherty JP, Hampton A, Kim H (2007): Model‐based fMRI and its application to reward learning and decision making. Ann N Y Acad Sci 1104:35–53. [DOI] [PubMed] [Google Scholar]
- O'Keefe J, Nadel L (1978): The Hippocampus as a Cognitive Map. Oxford: Clarendon Press. [Google Scholar]
- O'Keefe J, Burgess N (1996): Geometric determinants of the place fields of hippocampal neurons. Nature 381:425–428. [DOI] [PubMed] [Google Scholar]
- Packard MG, McGaugh JL (1996): Inactivation of hippocampus or caudate nucleus with lidocaine differentially affects expression of place and response learning. Neurobiol Learn Mem 65:65–72. [DOI] [PubMed] [Google Scholar]
- Packard MG, Knowlton BJ (2002): Learning and memory functions of the Basal Ganglia. Annu Rev Neurosci 25:563–593. [DOI] [PubMed] [Google Scholar]
- Pastalkova E, Itskov V, Amarasingham A, Buzsaki G (2008): Internally generated cell assembly sequences in the rat hippocampus. Science 321:1322–1327. [DOI] [PMC free article] [PubMed] [Google Scholar]
- Pfeiffer BE, Foster DJ (2013): Hippocampal place‐cell sequences depict future paths to remembered goals. Nature 497:74–79. [DOI] [PMC free article] [PubMed] [Google Scholar]
- Philbeck JW, Behrmann M, Levy L, Potolicchio SJ, Caputy AJ (2004): Path integration deficits during linear locomotion after human medial temporal lobectomy. J Cogn Neurosci 16:510–520. [DOI] [PubMed] [Google Scholar]
- Philbeck JW, Klatzky RL, Behrmann M, Loomis JM, Goodridge J (2001): Active control of locomotion facilitates nonvisual navigation. J Exp Psychol Hum Percept Perform 27:141–153. [PubMed] [Google Scholar]
- Pruessner JC, Li LM, Serles W, Pruessner M, Collins DL, Kabani N, Lupien S, Evans AC (2000): Volumetry of hippocampus and amygdala with high‐resolution MRI and three‐dimensional analysis software: Minimizing the discrepancies between laboratories. Cereb Cortex 10:433–442. [DOI] [PubMed] [Google Scholar]
- Pruessner JC, Köhler S, Crane J, Lord C, Byrne A, Kabani N, Collins DL, Evans AC (2002): Entorhinal and parahippocampal cortex from high‐resolution MR images: Considering the variability of the collateral sulcus. Cereb Corex 12:1342–1353. [DOI] [PubMed] [Google Scholar]
- Ranganath C, Cohen MX, Brozinsky CJ (2005): Working memory maintenance contributes to long‐term memory formation: Neural and behavioral evidence. J Cogn Neurosci 17:994–1010. [DOI] [PubMed] [Google Scholar]
- Raposo D, Kaufman MT, Churchland AK (2014): A category‐free neural population supports evolving demands during decision‐making. Nat Neurosci 17:1784–1792. [DOI] [PMC free article] [PubMed] [Google Scholar]
- Ribas‐Fernandes JJF, Solway A, Diuk C, McGuire JT, Barto AG, Niv Y, Botvinick MM (2011): A neural signature of hierarchical reinforcement learning. Neuron 71:370–379. [DOI] [PMC free article] [PubMed] [Google Scholar]
- Rigotti M, Barak O, Warden MR, Wang X‐J, Daw ND, Miller EK, Fusi S (2013): The importance of mixed selectivity in complex cognitive tasks. Nature 497:585–590. [DOI] [PMC free article] [PubMed] [Google Scholar]
- Rubin RD, Watson PD, Duff MC, Cohen NJ (2014): The role of the hippocampus in flexible cognition and social behavior. Front Hum Neurosci 8:742. [DOI] [PMC free article] [PubMed] [Google Scholar]
- Sargolini F, Fyhn M, Hafting T, McNaughton BL, Witter MP, Moser M‐B, Moser EI (2006): Conjunctive representation of position, direction, and velocity in entorhinal cortex. Science 312:758–762. [DOI] [PubMed] [Google Scholar]
- Save E, Guazzelli A, Poucet B (2001): Dissociation of the effects of bilateral lesions of the dorsal hippocampus and parietal cortex on path integration in the rat. Behav Neurosci 115:1212–1223. [DOI] [PubMed] [Google Scholar]
- Save E, Poucet B (2009): Role of the parietal cortex in long‐term representation of spatial information in the rat. Neurobiol Learn Mem 91:172–178. [DOI] [PubMed] [Google Scholar]
- Schon K, Atri A, Hasselmo ME, Tricarico MD, LoPresti ML, Stern CE (2005): Scopolamine reduces persistent activity related to long‐term encoding in the parahippocampal gyrus during delayed matching in humans. J Neurosci 25:9112–9123. [DOI] [PMC free article] [PubMed] [Google Scholar]
- Schon K, Hasselmo ME, Lopresti ML, Tricarico MD, Stern CE (2004): Persistence of parahippocampal representation in the absence of stimulus input enhances long‐term encoding: A functional magnetic resonance imaging study of subsequent memory after a delayed match‐to‐sample task. J Neurosci 24:11088–11097. [DOI] [PMC free article] [PubMed] [Google Scholar]
- Seemungal BM, Rizzo V, Gresty MA, Rothwell JC, Bronstein AM (2008): Posterior parietal rTMS disrupts human path integration during a vestibular navigation task. Neurosci Lett 437:88–92. [DOI] [PubMed] [Google Scholar]
- Sherrill KR, Erdem UM, Ross RS, Brown TI, Hasselmo ME, Stern CE (2013): Hippocampus and retrosplenial cortex combine path integration signals for successful navigation. J Neurosci 33:19304–19313. [DOI] [PMC free article] [PubMed] [Google Scholar]
- Shibata H, Kondo S, Naito J (2004): Organization of retrosplenial cortical projections to the anterior cingulate, motor, and prefrontal cortices in the rat. Neurosci Res 49:1–11. [DOI] [PubMed] [Google Scholar]
- Shrager Y, Kirwan CB, Squire LR (2008): Neural basis of the cognitive map: Path integration does not require hippocampus or entorhinal cortex. Proc Natl Acad Sci USA 105:12034–12038. [DOI] [PMC free article] [PubMed] [Google Scholar]
- Simon DA, Daw ND (2011): Neural correlates of forward planning in a spatial decision task in humans. J Neurosci 31:5526–5539. [DOI] [PMC free article] [PubMed] [Google Scholar]
- Spiers HJ, Barry C (2015): Neural systems supporting navigation. Curr Opin Behav Sci 1:47–55. [Google Scholar]
- Spiers HJ, Maguire EA (2007): A navigational guidance system in the human brain. Hippocampus 17:618–626. [DOI] [PMC free article] [PubMed] [Google Scholar]
- Stern CE, Corkin S, González RG, Guimaraes AR, Baker JR, Jennings PJ, Carr CA, Sugiura RM, Vedantham V, Rosen BR (1996): The hippocampal formation participates in novel picture encoding: Evidence from functional magnetic resonance imaging. Proc Natl Acad Sci USA 93:8660–8665. [DOI] [PMC free article] [PubMed] [Google Scholar]
- Sugar J, Witter MP, van Strien NM, Cappaert NLM (2011): The retrosplenial cortex: Intrinsic connectivity and connections with the (para)hippocampal region in the rat. An interactive connectome. Front Neuroinform 5:7. [DOI] [PMC free article] [PubMed] [Google Scholar]
- Suzuki WA, Amaral DG (1994): Perirhinal and parahippocampal cortices of the macaque monkey: Cortical afferents. J Comp Neurol 350:497–533. [DOI] [PubMed] [Google Scholar]
- Takahashi N, Kawamura M, Shiota J, Kasahata N, Hirayama K (1997): Pure topographic disorientation due to right retrosplenial lesion. Neurology 49:464–469. [DOI] [PubMed] [Google Scholar]
- Taube JS, Muller RU, Ranck JB (1990): Head‐direction cells recorded from the postsubiculum in freely moving rats. II. Effects of environmental manipulations. J Neurosci 10:436–447. [DOI] [PMC free article] [PubMed] [Google Scholar]
- Taube J (1995): Head direction cells recorded in the anterior thalamic nuclei of freely moving rats. J Neurosci 15:70–86. [DOI] [PMC free article] [PubMed] [Google Scholar]
- Tcheang L, Bülthoff HH, Burgess N (2011): Visual influence on path integration in darkness indicates a multimodal representation of large‐scale space. Proc Natl Acad Sci USA 108:1152–1157. [DOI] [PMC free article] [PubMed] [Google Scholar]
- Vann SD, Aggleton JP, Maguire EA (2009): What does the retrosplenial cortex do? Nat Rev Neurosci 10:792–802. [DOI] [PubMed] [Google Scholar]
- Vass LK, Epstein RA (2013): Abstract representations of location and facing direction in the human brain. J Neurosci 33:6133–6142. [DOI] [PMC free article] [PubMed] [Google Scholar]
- Vass LK, Copara MS, Seyal M, Shahlaie K, Farias ST, Shen PY, Ekstrom AD (2016): Oscillations go the distance: Low‐frequency human hippocampal oscillations code spatial distance in the absence of sensory cues during teleportation. Neuron 89:1180–1186 [DOI] [PMC free article] [PubMed] [Google Scholar]
- Viard A, Doeller CF, Hartley T, Bird CM, Burgess N (2011): Anterior hippocampus and goal‐directed spatial decision making. J Neurosci 31:4613–4621. [DOI] [PMC free article] [PubMed] [Google Scholar]
- Whishaw IQ, McKenna JE, Maaswinkel H (1997): Hippocampal lesions and path integration. Curr Opin Neurobiol 7:228–234. [DOI] [PubMed] [Google Scholar]
- Wiener JM, Berthoz A, Wolbers T (2011): Dissociable cognitive mechanisms underlying human path integration. Exp Brain Res 208:61–71. [DOI] [PubMed] [Google Scholar]
- Winter SS, Mehlman ML, Clark BJ, Taube JS (2015): Passive transport disrupts grid signals in the parahippocampal cortex. Curr Biol 25:2493–2502. [DOI] [PMC free article] [PubMed] [Google Scholar]
- Wolbers T, Büchel C (2005): Dissociable retrosplenial and hippocampal contributions to successful formation of survey representations. J Neurosci 25:3333–3340. [DOI] [PMC free article] [PubMed] [Google Scholar]
- Wolbers T, Wiener JM, Mallot HA, Büchel C (2007): Differential recruitment of the hippocampus, medial prefrontal cortex, and the human motion complex during path integration in humans. J Neurosci 27:9408–9416. [DOI] [PMC free article] [PubMed] [Google Scholar]
- Woo C‐W, Krishnan A, Wager TD (2014): Cluster‐extent based thresholding in fMRI analyses: Pitfalls and recommendations. Neuroimage 91:412–419. [DOI] [PMC free article] [PubMed] [Google Scholar]
- Worsley C (2001): Path integration following temporal lobectomy in humans. Neuropsychologia 39:452–464. [DOI] [PubMed] [Google Scholar]
- Yamamoto N, Philbeck JW, Woods AJ, Gajewski DA, Arthur JC, Potolicchio SJ, Levy L, Caputy AJ (2014): Medial temporal lobe roles in human path integration. Ed. Marc H. E. de Lussanet. PLoS One 9:e96583. [DOI] [PMC free article] [PubMed] [Google Scholar]
- Yushkevich PA, Piven J, Hazlett HC, Smith RG, Ho S, Gee JC, Gerig G (2006): User‐guided 3D active contour segmentation of anatomical structures: Significantly improved efficiency and reliability. Neuroimage 31:1116–1128. [DOI] [PubMed] [Google Scholar]