

Abstract
Huntington's disease (HD) is a progressive neurodegenerative disorder that can be diagnosed with certainty decades before symptom onset. Studies using structural MRI have identified grey matter (GM) loss predominantly in the striatum, but also involving various cortical areas. So far, voxel‐based morphometric studies have examined each brain region in isolation and are thus unable to assess the changes in the interrelation of brain regions. Here, we examined the structural covariance in GM volumes in pre‐specified motor, working memory, cognitive flexibility, and social‐affective networks in 99 patients with manifest HD (mHD), 106 presymptomatic gene mutation carriers (pre‐HD), and 108 healthy controls (HC). After correction for global differences in brain volume, we found that increased GM volume in one region was associated with increased GM volume in another. When statistically comparing the groups, no differences between HC and pre‐HD were observed, but increased positive correlations were evident for mHD, relative to pre‐HD and HC. These findings could be explained by a HD‐related neuronal loss heterogeneously affecting the examined network at the pre‐HD stage, which starts to dominate structural covariance globally at the manifest stage. Follow‐up analyses identified structural connections between frontoparietal motor regions to be linearly modified by disease burden score (DBS). Moderator effects of disease load burden became significant at a DBS level typically associated with the onset of unequivocal HD motor signs. Together with existing findings from functional connectivity analyses, our data indicates a critical role of these frontoparietal regions for the onset of HD motor signs. Hum Brain Mapp 37:67–80, 2016. © 2015 Wiley Periodicals, Inc.
Keywords: Huntington's disease, structural covariance, MRI, grey matter volume, functional networks, Pearson's correlation
INTRODUCTION
Huntington's disease (HD) is a devastating genetic neurodegenerative disorder caused by a CAG repeat expansion in the gene coding for the huntingtin protein and is characterized by progressive deterioration of functioning in motor, cognitive, including working memory and executive control, and affective processing domains [Walker, 2007]. Advances in genetic testing offer the opportunity to reliably determine HD gene mutation carriership many years before the onset of first symptoms. A substantial body of research has confirmed the occurrence of neurodegenerative alterations in structural and functional brain networks in both preclinical HD (pre‐HD) and early manifest HD (mHD) gene carriers, revealing a complex pattern of abnormalities affecting diverse subcortical and cortical regions.
Studies in both pre‐HD and mHD using voxel‐based morphometry (VBM), a mass‐univariate whole‐brain technique enabling the localization of brain volume changes, have consistently reported reductions in grey matter volume not only in the striatum, a key region affected in HD, but also in various other subcortical and cortical areas [Dogan et al., 2013; Scahill et al., 2011]. VBM and cortical thickness analyses have already identified structural changes in well‐established functional cortico‐striatal networks implicated in working memory, motor control, cognitive flexibility, and affective processing. Specifically, working memory is among the first cognitive domains to be affected and dysfunctions are characterized by reduced connectivity in frontostriatal and frontoparietal networks in mHD [Wolf et al., 2008a, 2008b], as well as by volume loss in anterior cingulate cortex, parietal lobe, and striatum [Rosas et al., 2008; Tabrizi et al., 2009]. Also, deficits in executive functions, including motor control [Biglan et al., 2009; Klöppel et al., 2009a], cognitive flexibility [Hanes et al., 1995; O'Rourke et al., 2011; Paulsen et al., 1995], and inhibitory control mechanisms [Georgiou‐Karistianis et al., 2007, 2014; Klöppel et al., 2008; Rao et al., 2014], have been confirmed for both pre‐HD and mHD and are possibly the result of striatal atrophy, as well as of volume loss in prefrontal regions [Lawrence, 1998; Rosas et al., 2003]. Moreover, impairments in striatum, amygdala, pallidum, and insula [Henley et al., 2012; Thieben et al., 2002], all considered to be part of the limbic loop [Douaud et al., 2006], may account for the deficits in emotion recognition that are observed in pre‐HD and mHD [Gray et al., 1997; Henley et al., 2012; Hennenlotter et al., 2004; Milders et al., 2003; Sprengelmeyer et al., 2006, 1996].
While VBM analysis provides whole‐brain results for individual regions, it does not explicitly address the interrelation among different brain regions within the same network. In addition, standard implementations of VBM do not permit to compare the extent of structural damage afflicted to one node of a network with that of another node. These limitations render it difficult to evaluate if a network is homogenously affected. Analyses of structural covariance, on the other hand, focus on the covariation in structural markers, such as regional volume or cortical thickness, between different brain regions and thus offer more insights into their topographical organisation. Previous studies have demonstrated a structural‐functional interplay between distinct anatomical regions that was subject to change due to experience‐related plasticity effects [Draganski et al., 2006; Mechelli et al., 2004]. In healthy aging, brain regions sharing a common function have been shown to vary together in size [Alexander‐Bloch et al., 2013; Li et al., 2013]. Such coordinated variations are possibly the result of mutually trophic influences (i.e. changes in axonal connections or blood supply) or experience‐related plasticity effects [Mechelli et al., 2005], but could also result from disease‐specific changes affecting the structural associations among regions [Seeley et al., 2009; Zhou et al., 2012; Zielinski et al., 2012].
In the present study, we sought to assess the nature of change in topology of pre‐defined functional networks based on structural properties that occurred in individuals with and without the genetic mutation leading to HD. Focusing on motor control, working memory, cognitive flexibility, and affective processing networks, functionally defined by coordinate‐based, activation likelihood estimation (ALE) meta‐analyses [Eickhoff et al., 2012, 2009; Turkeltaub et al., 2002], we here report combined VBM and structural covariance analyses of grey matter changes in the network‐specific nodes. Significant structural loss in each node identified in the node‐specific VBM analysis in the absence of changes in structural covariance will indicate a homogeneous disease effect on the whole network and thus complement existing studies on functional networks [Alexander‐Bloch et al., 2013; Seeley et al., 2009]. To address this issue, we used moderation analysis [Hayes, 2013] to determine whether structural covariance in HD between two brain regions subserving the same function depends on, i.e. interacts with, the individuals' disease burden score [Penney et al., 1997]. We expect to identify differential HD‐specific changes in structural covariance, expressed by an increased covariance across brain regions and networks in mHD individuals when neurodegeneration relatively homogeneously affects the whole group with manifest disease. In contrast, we predict to see a decreased covariance at an earlier stage when the disease effect is much more heterogeneous within and across pre‐HD individuals.
MATERIALS AND METHODS
Participants
MRI data from 313 right‐handed participants, acquired at four different sites (London, Paris, Vancouver, and Leiden) as part of the Track‐HD multicentric study at baseline [Tabrizi et al., 2009], were included in this study. Each participant belonged to one of three groups: mHD patients with an early clinical manifestation of typical motor symptoms, pre‐HD individuals without HD‐typical symptoms but carrying the mutant huntingtin gene, and healthy controls (HC), who were age‐ and gender‐matched to the combined HD gene carrier group (Table 1). To control for environmental factors, HC were either gene‐negative siblings of gene mutation carriers or were selected from the partners or spouses of individuals with HD. On average, HC were 5.3 years older than pre‐HD, but 2.4 years younger than mHD. A detailed description of the cohort's demographics and clinical information is provided elsewhere [Tabrizi et al., 2009]. The study was approved by the local ethics committees and all participants gave a written informed consent according to the Declaration of Helsinki before participation.
Table 1.
Group demographics of the Track‐HD participants at baseline
| HC (n = 108) | pre‐HD (n = 106) | mHD (n = 99) | P | |
|---|---|---|---|---|
| Age (yrs) | 45.50 ± 10.07 (23:63) | 40.96 ± 9.22 (19:64) | 47.67 ± 9.95 (39:59) | <0.001 |
| Gender (F/M) | 61/47 | 57/49 | 53/46 | 0.892 |
| CAG length | — | 43.11 ± 5.93 | 43.93 ± 3.08 | 0.036 |
| Disease burden scorea | — | 293.88 ± 49.19 | 377.80 ± 74.05 | <0.001 |
DBS = age × (CAG length − 35.5) [Penney et al., 1997]. Values are given in means ± SD (range), where applicable.
HC = healthy controls; pre‐HD = presymptomatic HD; mHD = manifest HD; F = female; M = male; CAG = trinucleotide.
MRI Acquisition
Scanning was performed on a 3 T Siemens MAGNETOM TimTrio MR scanner in Paris and London and on a 3 T Philips Achieva MR scanner in Vancouver and Leiden, all using a 32‐channel head coil. High‐resolution three‐dimensional T1‐weighted structural scans were acquired for all participants with a magnetization‐prepared rapid gradient echo (MP‐RAGE) sequence for Siemens and fast‐field echo (FFE) sequence for Philips and using standardized protocols with the following parameters for the two scanner types, respectively (Siemens/Philips): TR = 2,200 ms/7.7 ms; TE = 2.2 ms/3.5 ms; FA = 10°/8°, FOV = 28 cm/24 cm, matrix size of 256 × 256 × 208/224 × 224 × 164, and slice thickness of 1.1 × 1.1 × 1.1 mm, without slice gap. Two T1‐weighted scans were acquired for each participant and the one with the best quality was used for the analysis. Rigorous inspection of the image quality was conducted by IXICO, London, UK (http://www.ixico.com/).
MRI Data Preprocessing
Structural MRI data preprocessing was performed using the VBM8 (r435) toolbox, (http://dbm.neuro.uni-jena.de/vbm/) and SPM8 (Statistical Parametric Mapping, Welcome Trust Centre for Neuroimaging, http://www.fil.ion.ucl.ac.uk/spm), running on MATLAB R2014a (Mathworks, Natick, MA). The T1‐weighted images were first segmented into grey matter (GM), white matter (WM), and cerebrospinal fluid (CSF) using the IXI550_MNI152 template and the tissue probability map of the SPM8 Segment Toolbox based on the Unified Segmentation [Ashburner and Friston, 2005]. Subsequently, the high‐dimensional DARTEL approach [Ashburner, 2007] was used to normalize the GM segments into MNI space. To correct for individual brain size and thus preserve the total amount of GM from the original images, the GM segments were modulated only for the nonlinear components of the deformations in standard space by multiplying each voxel with the Jacobian determinant derived from the spatial normalization [Ashburner and Friston, 2000]. Finally, the resulting nonlinear only modulated and normalized GM maps were smoothed with an isotropic Gaussian kernel of 10 mm FWHM to account for individual anatomical variations. Data were extracted from regions of interest (ROIs) as motivated below, using a sphere with a radius of 6 mm.
Network Selection
Four large‐scale networks, implicated in motor control, working memory, cognitive flexibility, and affective processing, which have repeatedly been shown to be affected in HD, were chosen for assessing patterns of covariance in GM volumes. For this purpose, ROIs were selected separately for each of the predefined cortico‐striatal networks, based on previously published meta‐analyses [Amft et al., 2014; Hardwick et al., 2013; Müller et al., 2014; Rottschy et al., 2012] and extracted using a 6‐mm radius sphere and the coordinates of each ROI as a centre. Coordinate‐based ALE meta‐analyses [Eickhoff et al., 2012, 2009; Turkeltaub et al., 2002] allow for specifying voxels that are less sensitive to noise and are based on activations derived from a multitude of different, domain‐specific neuroimaging studies. A summary of all ROIs and their coordinates is provided in Table 2.
Table 2.
Regions of interest included in the analyses
| Networks and regions | Hemisphere | Abbreviation | MNI coords (mm) | ||
|---|---|---|---|---|---|
| x | y | z | |||
| Motor network | |||||
| Primary motor cortex | L | M1 | −38 | 24 | 56 |
| Primary motor cortex | R | M1 | 38 | 24 | 56 |
| Supplementary motor area | L | SMA | −2 | 12 | 54 |
| Thalamus | L | Thal | −12 | −20 | 10 |
| Thalamus | R | Thal | 12 | −20 | 10 |
| Primary somatosensory cortex | R | S1 | 34 | −40 | 54 |
| Dorsal premotor cortex | L | dPMC1 | −26 | 4 | 62 |
| Dorsal premotor cortex | L | dPMC2 | −36 | −14 | 60 |
| Dorsal premotor cortex | R | dPMC | 38 | 6 | 62 |
| Putamen | L | Put | −26 | 4 | 2 |
| Putamen | R | Put | 26 | 4 | 2 |
| Superior parietal lobe | L | SPL | −30 | −56 | 64 |
| Superior parietal lobe | R | SPL | 44 | −48 | 60 |
| Working memory network | |||||
| Posterior medial frontal cortex | L | pMFC | 0 | 14 | 52 |
| Posterior medial frontal cortex | R | pMFC | 6 | 24 | 42 |
| Middle frontal gyrus | R | MFG | 34 | 44 | 26 |
| Interior frontal gyrus (caudal) | L | IFG/BA45 | −46 | 30 | 20 |
| Inferior frontal gyrus (rostral) | L | IFG/BA44 | −46 | 10 | 26 |
| Inferior frontal gyrus (rostral) | R | IFG/BA44 | 50 | 16 | 26 |
| Anterior insula | L | AI | −36 | 22 | −2 |
| Anterior insula | R | AI | 38 | 24 | 4 |
| Intraparietal gyrus | L | IPG | −44 | −40 | 42 |
| Intraparietal sulcus | R | IPS | 30 | −60 | 50 |
| Cognitive flexibility network | |||||
| Supplementary motor area | L | SMA | −4 | 20 | 44 |
| Anterior insula | L | AI | −34 | 22 | −4 |
| Anterior insula | R | AI | 40 | 22 | −2 |
| Inferior frontal gyrus | L | IFG | −48 | 8 | 30 |
| Inferior frontal gyrus | R | IFG | 50 | 10 | 30 |
| Middle frontal gyrus | R | MFG | 40 | 36 | 20 |
| Inferior parietal cortex | R | IPC | 44 | −44 | 46 |
| Social‐affective network | |||||
| Anterior cingulate cortex | ACC | 0 | 38 | 10 | |
| Subgenual cingulate cortex | L | SCC | −2 | 32 | −8 |
| Dorsomedial prefrontal cortex | L | DMPFC | −2 | 52 | 14 |
| Vetromedial prefrontal cortex | L | VMPFC | −2 | 50 | −10 |
| Temporoparietal junction | L | TPJ | −46 | −66 | 18 |
| Temporoparietal junction | R | TPJ | 50 | −60 | 18 |
| Precuneus | L | Prec | −2 | −52 | 26 |
| Ventral striatum | L | vStr | −6 | 10 | −8 |
| Ventral striatum | R | vStr | 6 | 10 | 8 |
| Amygdala | L | Amy | −24 | −10 | −20 |
| Amygdala | R | Amy | 24 | −8 | −22 |
| Anterior middle temporal gyrus | L | aMFG | −54 | −10 | −20 |
The motor network included the following voxels: bilateral primary motor cortex (M1), left supplementary motor area (SMA), right primary somatosensory cortex (S1), bilateral thalamus (Thal), bilateral dorsal premotor cortex (dPMC), bilateral putamen (Put), and bilateral superior parietal lobe (SPL) [Hardwick et al., 2013]. The following ROIs were selected for the core network active during working memory tasks: bilateral posterior medial frontal cortex (pMFC), left intraparietal gyrus (IPG), right intraparietal sulcus (IPS), bilateral anterior insula (IA), right middle frontal gyrus (MFG), and bilateral inferior frontal gyrus (IFG) divided into caudal lateral prefrontal cortex (IFG/BA44), and rostral lateral prefrontal cortex (IFG/BA45) [Rottschy et al., 2013, 2012]. Additionally, regions involved in cognitive flexibility included the left supplementary motor area (SMA), bilateral anterior insula (AI), bilateral inferior frontal gyrus (IFG), right middle frontal gyrus (MFG), and right inferior parietal cortex (IPC) [Müller et al., 2014]. Finally, the fourth large‐scale network included the following regions involved in an extended social‐affective default network: anterior cingulate cortex (ACC), subgenual cingulate cortex (SCC), dorso‐ and ventromedial prefrontal cortices (DMPFC, VMPFC), bilateral temporoparietal junction (TPJ), bilateral ventral striatum (vStr), bilateral amygdala (Amy), left precuneus (Prec), and left anterior middle temporal gyrus (aMTG) [Amft et al., 2014].
Statistical Analysis
Data from the individual smoothed, nonlinearly modulated and normalized GM maps were extracted from the specified ROIs using a sphere of 6 mm. Individual anatomical differences were accounted for by using a smoothing kernel of 10 mm FWHM. Linear regression analysis was performed on the resulting regional GM volumes to remove the effects of age, gender, and imaging site and the residuals of the regression were used for further analyses. Total intracranial volume was not included as a covariate of no interest, as the nonlinearly modulated and normalized GM maps already included correction for individual brain sizes. To assess structural covariance, Pearson's correlation coefficients were computed for each ROI, thus resulting in an association matrix, separately for each network and group. Descriptive statistics and visual inspection were performed to ensure that correlations were not driven by single outliers.
Within‐group effects were assessed by testing the significance of the correlation coefficients (r), i.e. the likelihood that the observed r values did not occur by chance, for each network and group separately. To test whether a correlation coefficient (r) was significantly different from zero within each group, we used a t‐distribution with sample size n – 2 degrees of freedom, using the following formula:
where r is divided by the square root of 1 – r 2, multiplied by the square root of the sample size n minus 2, which is approximately normally distributed with a mean of zero and a variance of n – 2 [Kenny, 1987]. Bonferroni correction was used to account for the multiple comparisons.
In order to test for significant differences in correlations between the groups, Fisher's r to z transformations were performed and Bonferroni correction (P < 0.05) was used to account for the number of networks and nodes per network. The structural covariance analysis was conducted using in‐house MATLAB routines. Results were visualized using BrainNet Viewer (http://nitrc.org/projects/bnv) [Xia et al., 2013] and MATLAB.
Furthermore, a follow‐up VBM‐based ANCOVA analysis was used to assess the pair‐wise between‐group differences in GM volume for all nodes and networks for which groups differed in structural covariance. Age, gender, and site effects were adjusted for and the analysis was conducted in IBM SPSS Statistics 20.0 (IBM Corp., 2011). An additional whole‐brain VBM analysis was conducted in SPM8, including the three groups HC, pre‐HD, and mHD, as well as age, gender, and site as covariates of no interest. This whole‐brain VBM analysis served to characterize the extent of structural changes in the current sample and as a comparison with existing studies but would not have been necessary for our network‐specific interpretation. The results were visualized using the MRIcron software (http://www.mccauslandcenter.sc.edu/mricro/mricron).
Finally, while the main analyses relied on a categorical distinction of gene mutation carriers as either pre‐HD or mHD, we used an additional moderation analysis, restricted to the HD gene mutation carriers only, to test whether disease burden score (DBS) [Penney et al., 1997] had a continuous modulatory role on the regional structural covariance identified in the between‐group comparisons. Due to the exploratory nature of the moderation analysis, the association was repeated with each ROI included once as a dependent and once as an independent variable. This was to ensure that the moderation (i.e. interaction) effects of DBS were present for each of the two regions included in the model. Age, gender, and site were included as covariates. Analyses were conducted in SPSS using the PROCESS 2.12 macro [Hayes, 2013]. Significant interactions were probed using the Johnson‐Neyman technique [Bauer and Curran, 2005; Johnson and Fay, 1950; Johnson and Neyman, 1936], which identified the range of DBS with significant interactions by giving the regions of significance and confidence bands for the conditional relation between two ROIs as a function of DBS.
RESULTS
Structural Covariance
Within‐group effects
To characterize the interindividual structural covariance between the regions within each network, we first assessed the statistical significance of the observed associations for each group separately. Our results identified only significant positive correlations across all networks and groups, i.e., increased GM volume in one brain region was associated with increased GM volume in another (Figs. 1 and 2). The strongest positive correlations involved homotopic regions (i.e. same areas in opposite hemispheres) in all networks. In the motor network, stronger positive correlations were also found between regions that had close proximity to each other, such as the left supplementary motor area (SMA) and the left dorsal premotor (dPMC) and primary motor (M1) cortices, as well as between the right superior parietal lobe (SPL) and the right primary somatosensory cortex (S1). The same pattern was observed in the working memory network between left caudal (BA45) and rostral (BA44) lateral prefrontal cortices, as well as in the social‐affective network between dorso‐ and ventromedial prefrontal cortices, and between anterior and subgenual cingulate cortices. In addition to homotopic regions, positive (but weaker) correlations were observed in all networks between ipsilateral (i.e. different regions in the same hemisphere) but relatively distant regions, and to a lesser extent between heterotopic regions (i.e. different areas in opposite hemispheres). Correlation matrices for all networks, including the correlation coefficients and the corresponding P values, are provided as a Supporting Information (Fig. S1).
Figure 1.
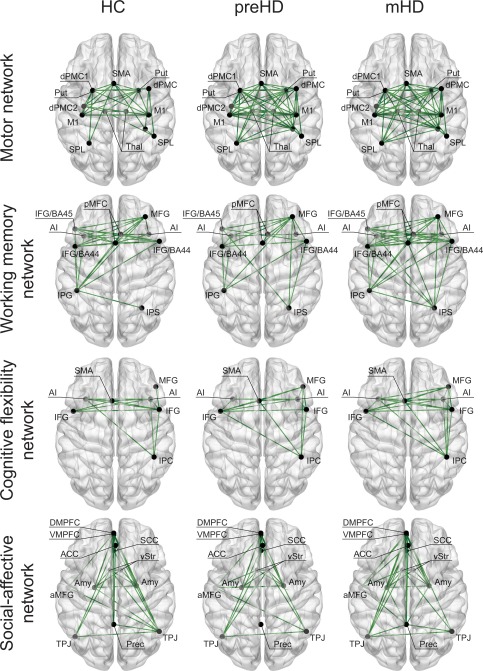
Structural covariance: within‐group effects Each subplot depicts a different network for each group with a visualization of the involved anatomy. Only positive correlations (green) were found significant (P < 0.05), as shown in the figure. HC = healthy controls; pre‐HD = presymptomatic HD; mHD = manifest HD; SMA = supplementary motor area; dPMC = dorsal premotor cortex; M1 = primary motor cortex; SPL = superior parietal lobe; S1 = primary somatosensory cortex; Thal = thalamus; Put = putamen; pMFC = posterior medial frontal cortex; IPG = intraparietal gyrus; IPS = intraparietal sulcus; AI = anterior insula; IFG = inferior frontal gyrus; IFG/BA45 = inferior frontal gyrus (caudal); IFG/BA44 = inferior frontal gyrus (rostral); MFG = middle frontal gyrus; IPC = inferior parietal cortex; ACC = anterior cingulate cortex; SCC = ; Prec = precuneus; TPJ = tempo‐parietal junction; Amy = amygdala; aMFG = anterior middle frontal gyrus; vStr = ventral striatum; DMPFC = dorso‐medial prefrontal cortex; VMPFC = ventromedial prefrontal cortex. [Color figure can be viewed in the online issue, which is available at http://wileyonlinelibrary.com.]
Figure 2.
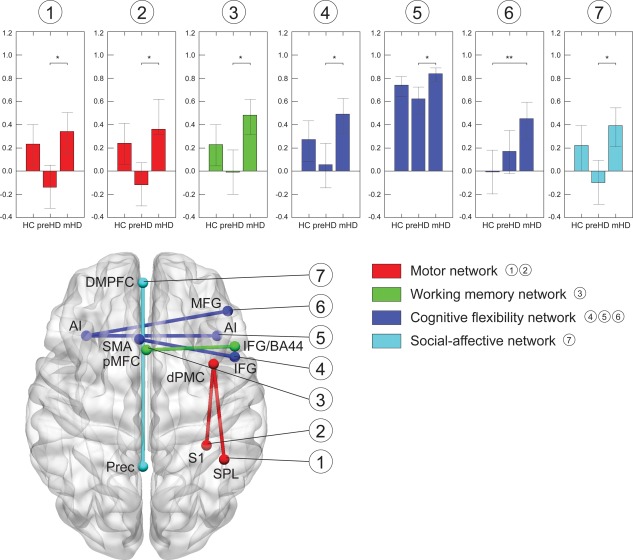
Structural covariance: between‐group differences Only significant correlations and networks are illustrated. A. Motor network (red): correlation between right dorsal premotor cortex (dPMC) and right superior parietal lobe (SPL). B. Working memory (green): left posterior medial frontal cortex (pMFC) and right rostral inferior frontal gyrus (IFG/BA44). C. Cognitive flexibility network (blue): inferior frontal gyrus (IFG) and supplementary motor area (SMA), right and left anterior insula (AI), as well as between left AI and right middle frontal gyrus (MFG). D. Social‐affective network (cyan): left dorsomedial prefrontal cortex (DMPFC) and left precuneus (Prec). Bar plots show the correlation coefficients (y‐axis) for each group (x‐axis). Whiskers represent the confidence intervals. Significant between‐group differences are marked with an asterisk (* P < 0.05, ** P < 0.001, two‐tailed, Bonferroni‐corrected). [Color figure can be viewed in the online issue, which is available at http://wileyonlinelibrary.com.]
Between‐group effects
Most differences were observed between the two HD mutation gene carrier groups, while HC and pre‐HD did not differ in any of the four functional networks. Across all networks, significant between‐group differences were typically explained by stronger positive correlations in mHD, as opposed to weaker or absent correlations in pre‐HD, and weaker positive correlations in HC. Specifically, in the motor network, correlations between the right dPMC and the right SPL, as well as between right dPMC and right S1, were positive in mHD and slightly negative in pre‐HD (P Bonf = 0.03, r pre‐HD = −0.14, r mHD = 0.34, and P Bonf = 0.03, r pre‐HD = −0.12, r mHD = 0.36, respectively). Similarly, in the working memory network, a positive correlation was found between the left posterior medial frontal cortex (pMFC) and the right inferior frontal gyrus (IFG/BA44) in mHD, which was absent in pre‐HD (P Bonf = 0.01, r pre‐HD = −0.04, r mHD = 0.45). Within the social‐affective network, a nonsignificant negative structural covariance between the left precuneus (Prec) and the left dorsomedial prefrontal cortex (DMPFC) in pre‐HD and a strongly positive correlation in mHD led to a significant between‐group difference in the correlation strength (P Bonf = 0.02, r pre‐HD = −0.10, r mHD = 0.37). A similar pattern was observed within the cognitive flexibility network between the right IFG and the supplementary motor area (SMA) (P Bonf = 0.01, r pre‐HD = 0.02, r mHD = 0.49). Also, structural covariance between right and left anterior insula (AI) was positive but weaker in pre‐HD relative to mHD (P Bonf = 0.01, r pre‐HD = 0.50, r mHD = 0.82). However, this pattern was slightly different between the left AI and the right middle frontal gyrus (MFG), where correlations were absent in controls, while strongly positive in mHD (P Bonf = 0.001, r HC = −0.05, r mHD = 0.36). All significant between‐group differences in structural covariance are visualized for each network separately in Figure 2.
VBM analysis
The follow‐up ANCOVA analysis (i.e. node‐specific VBM analysis), assessing the pair‐wise between‐group differences in GM volume, indicated significant volume loss in all nodes. Specifically, GM volumes among the eight regions identified in the structural covariance analysis were significantly lower (P < 0.05 Bonferroni‐corrected) in both HD gene carrier groups compared with HC, as well as in mHD compared with pre‐HD. One exception was the GM volume of the right dPMC, which did not differ between pre‐HD and mHD. The whole‐brain VBM analysis revealed significant GM loss in pre‐HD which was limited to the striatum and especially pronounced in the putamen (Fig. 3A). As expected, a more widespread pattern of GM loss emerged in mHD, extending to cortical motor and parietal areas (Fig. 3B,C). No significant differences were found for either of the following contrasts: mHD > HC, mHD > pre‐HD, and pre‐HD > HC. Peak coordinates are provided in Table 3.
Figure 3.
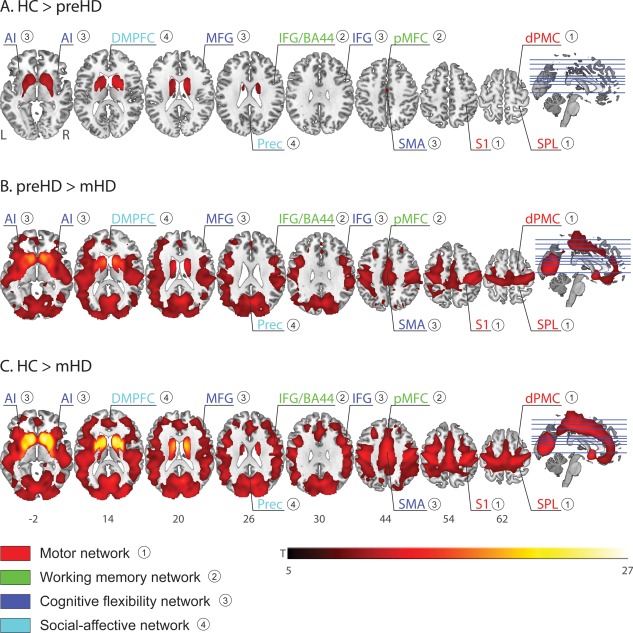
Whole‐brain VBM analysis: between‐group differences. A. HC > pre‐HD. B. Pre‐HD > mHD. C. HC > mHD. Results are reported at P = 0.05 family‐wise error (FWE)‐corrected and a cluster size k = 50. Regions and networks showing significant between‐group differences in structural covariance (see Fig. 2 above) are labeled. HC = healthy controls; pre‐HD = presymptomatic HD; mHD = manifest HD; AI = anterior insula; DMPFC = dorsomedial prefrontal cortex; MFG = middle frontal gyrus; IFG/BA44 = inferior frontal gyrus (rostral); Prec = precuneus; IFG = inferior frontal gyrus; SMA = supplementary motor area; S1 = primary somatosensory cortex; dPMC = dorsal premotor cortex; SPL = superior parietal lobe. [Color figure can be viewed in the online issue, which is available at http://wileyonlinelibrary.com.]
Table 3.
Whole‐brain VBM analysis: Location and peak significance of GMV loss across groups
| Contrast | Region/hemisphere | MNI coords (mm) | Extent (k) | t | Peak‐level P FWE‐corr | |||
|---|---|---|---|---|---|---|---|---|
| x | y | z | ||||||
| HC > pre‐HD | Putamen | R | 22 | 6 | 9 | 6408 | 10.86 | <0.001 |
| Putamen | L | −20 | 3 | 7 | 5418 | 10.26 | <0.001 | |
| pre‐HD > mHD | Caudate | R | 10 | 18 | 3 | 152595 | 16.47 | <0.001 |
| Caudate | L | −12 | 14 | −2 | 16.27 | <0.001 | ||
| Middle frontal gyrus | R | 27 | 36 | 40 | 307 | 5.79 | 0.001 | |
| Parahippocampal gyrus | R | 18 | −34 | −5 | 95 | 5.18 | 0.004 | |
| Precuneus | R | 3 | −51 | 39 | 69 | 4.69 | 0.028 | |
| HC > mHD | Putamen | R | 24 | 9 | 9 | 201424 | 26.78 | <0.001 |
| Putamen | L | −20 | 6 | 7 | 25.54 | <0.001 | ||
| Caudate | R | 10 | 14 | 9 | 25.18 | <0.001 | ||
| Posterior cingulate gyrus | R | 15 | −37 | −2 | 89 | 5.28 | 0.002 | |
No significant differences found for mHD > HC, mHD > pre‐HD, and pre‐HD > HC.
GMV = grey matter volume; HC = healthy controls; pre‐HD = presymptomatic HD; mHD = manifest HD; FWE‐corr = family‐wise error correction.
Moderation analysis: HD gene carriers only
To test for a continuous change in structural covariance with increasing DBS (i.e. a linear interaction), we performed a post hoc moderation analysis with age, gender, and sites as covariates, focusing on the association between the regions found in the between‐group structural covariance analysis. We found moderation effects only for the motor network when testing for the associations irrespective of the regions defined as dependent variable: interaction between DBS and right dPMC (P = 0.02, f 2 = 0.1, small effect size) and interaction between DBS and right SPL (P = 0.01, f 2 = 0.3, medium effect size), as well as interaction between DBS and right S1 (P = 0.02, f 2 = 0.1, small effect size) [Cohen, 1988]. Using the Johnson‐Neyman method, we could show that the interaction was significant only for those participants with DBS above 346 for the conditional indirect effect between rdPMC and rSPL and DBS above 345 between rdPMC and rS1 (Fig. 4, only the former is shown), a score almost exactly in the middle between average scores for the pre‐HD and mHD groups (see Table 1, mean DBS for reference), suggesting that moderation effects were significant at a burden score typically representing motor onset of HD.
Figure 4.
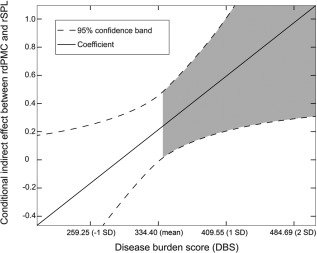
Moderation effects with the Johnson‐Neyman technique x‐axis: disease burden score (DBS), y‐axis: conditional indirect effects between right dorsal premotor cortex (rdPMC) and right superior parietal lobe (rSPL). A significant interaction effect is present when the confidence interval (dotted lines) is completely above (positive interaction) or below (negative interaction) the horizontal line at zero. Shaded area represents the region of significance (P < 0.05), indicating a positive interaction for all HD gene carriers with DBS above 346.
DISCUSSION
In recent years, there has been a wealth of literature dedicated to understanding the neural mechanisms of Huntington's disease. Large‐scale multimodal and multicentre studies, such as PADDINGTON [Hobbs et al., 2013], PREDICT‐HD [Biglan et al., 2013], and TRACK‐HD [Tabrizi et al., 2009], have now revealed a complex pattern of structural and functional abnormalities affecting diverse subcortical and cortical regions in both the pre‐clinical and the early stages of HD.
A previous VBM analysis using the TRACK‐HD data further suggests that there is a relationship between grey matter tissue loss and task performance in HD [Scahill et al., 2011]. Specifically, decreased motor performance, as measured by force tongue and finger tapping tasks, was positively correlated with increased GM loss in the striatum, the precentral gyrus, and the precuneus. On the other hand, tissue loss in frontal and parietal regions was correlated with poorer working memory abilities. Similar findings were observed between poor performance on a negative emotion recognition task and increased GM loss in precuneus and left precentral gyrus, as well as between higher anti‐saccade error rate and tissue loss in frontal, temporal, and occipital regions. In the present structural covariance study, we sought to extend these VBM findings by investigating whether functional networks are homogenously affected in HD, thus, exploring how GM volumes vary between functionally‐related brain regions. We focused on four large‐scale brain networks, implicated in motor functioning, working memory, cognitive flexibility, and emotional processing, which are all affected in HD, even before first onset of motor symptoms. To ensure the unbiased definitions of regions of interests comprising the same functional network, we used voxel coordinates from previous ALE meta‐analyses in healthy individuals, as specified in more detail in the Methods section above.
Our within‐group analyses provided further evidence that regions sharing a mutual functional involvement are also structurally correlated with each other. In the healthy brain, we demonstrated that the grey matter volume of one region was indeed positively correlated with grey volume of another region subserving the same functional network, which is in accordance with previous findings [Mechelli et al., 2005]. Similarly, we found positive associations between homotopic, ipsilateral, and heterotopic regions, characterized by increased GM volume in one area associated with increased GM in another region. In contrast, we did not observe any of the significant negative associations that have previously been reported for a limited number of heterotopic and ipsilateral regions [Mechelli et al., 2005]. It is important to note, however, that our analysis was restricted to pre‐defined regions of interest, without aiming to detect patterns of structural covariance on a whole‐brain level.
Strong positive correlations were also found among regions with high spatial proximity to each other, which may be due to the spatial smoothing of the data. It can also indicate that structural covariance between these regions may result from brain connectivity of some kind, i.e. structural connectivity derived from white matter tracts or functional connectivity resulting from the synchronous signal fluctuations between brain regions. Previous studies in HD have shown that loss in white matter integrity is a hallmark of neurodegenerative changes in presymptomatic and manifest HD and that these structural abnormalities correlate with changes in motor, cognitive, affective, and executive functioning [Bohanna et al., 2011; Klöppel et al., 2008; Novak et al., 2014; Papp et al., 2011; Poudel et al., 2014]. However, while current research supports the network interpretation of changes in structural covariance [Alexander‐Bloch et al., 2013], it is difficult to offer a precise biological interpretation of disease‐related changes due to the lack of a clear understanding of the cellular and molecular mechanisms that lead to the emergence of regional interrelation among distinct brain regions. As mentioned, disease‐specific changes in structural covariance could be mediated by axonal and synaptic loss, affecting diverse behavioral and cognitive functions, as well as by neuronal spreading, systematically affecting functional networks through white matter tracts [Seeley et al., 2009; Zhou et al., 2012].
In the key between‐group analysis, we combined VBM and structural covariance analyses to compare the extent of structural damage afflicted to one node of a network with that of another node. The whole‐brain VBM results showed a more widespread GM loss in manifest HD, relative to pre‐clinical HD and controls, which was limited to the striatum in pre‐HD, relative to controls. For the whole‐brain analysis, we used a conservative statistical threshold of P = 0.05, FWE‐corrected, with a cluster extent of k = 100. Furthermore, we also performed a node‐specific between‐group comparison of GM, with Bonferroni correction accounting for the number of nodes and groups. The results revealed a significant volume loss in all mutation carriers compared with controls, but most severely in mHD. This results are in line with previous VBM findings (for a summary of findings, see a recent meta‐analysis by [Dogan et al., 2013]). However, VBM analyses show whole‐brain morphometric changes but are unable to make inference on the interrelations between regions within the affected areas. Thus, structural covariance between the network‐specific nodes was analysed to clarify if the disease affects all nodes in a network homogeneously, which should not change structural covariance.
When considering all four predefined functional networks, the structural covariance analysis revealed that patterns of regional interrelations identified in the healthy controls were remarkably similar or even stronger in mHD, but not in pre‐HD. One exception was the correlation between the left anterior insula and the right middle frontal gyrus within the cognitive flexibility network, where controls differed from mHD, showing no correlation in contrast to the increased one in the gene mutation carriers. A potential reason why these two regions did not co‐vary in HC might be that the anterior insula is a multifunctional region [Clos et al., 2014]. Furthermore, the multifaceted nature of cognitive flexibility as a network may also contribute to the inconsistency of the results. Still, the increased structural covariance found in mHD is in agreement with previous findings in Alzheimer's dementia (AD), showing that AD patients exhibited increased correlations in cortical shrinking among several regions involved in episodic memory and showing disease‐related breakdown, reflecting shared vulnerability to structural damage [He et al., 2008].
Furthermore, we consider the U‐shaped effect visually observed in our analysis (Fig. 3), expressed by the general trend of high structural covariance among most regions in HC and mHD with an almost absent or weaker structural covariance in pre‐HD, a typical marker of neurodegeneration in HD and probably also in other neurodegenerative disorders. It should be emphasized, however, that the U‐shaped effect mentioned here is of descriptive character, derived from the linear statistical inference employed in this study. A recent longitudinal fMRI study [Poudel et al., 2015], investigating the functional changes in a working memory task in HD, identified a similar inverted U‐shaped pattern, marked by decreased functional connectivity and increased compensatory BOLD signal activity in pre‐HD, relative to mHD and HC. Here, we argue that the more positive structural covariance in mHD indicates that the degenerative process now dominates the normal variability. The pre‐HD phase with reduced or absent correlations is most likely the result of HD affecting some areas and/or some individuals more strongly than others and potentially indicate compensatory responses. Identifying this as a true compensatory effect would require a detailed behavioral characterization and is thus outside the scope of the study.
Interestingly, although the basal ganglia were included in two of the four networks and are typically strongly affected by HD, we did not observe any difference in structural covariance in the motor network involving the putamen and in the social‐affective network between the ventral striatum and other regions. This observation is likely explained by the already low correlation of the volumes in basal ganglia with cortical regions, which meant that a further reduction of correlation strength would not be significant. In the motor network, specifically, the left putamen was only weakly correlated with the left dPMC and M1, which is in agreement with previously published data on structural covariance of the neostriatum in the healthy brain [Soriano‐Mas et al., 2013]. In the social‐affective network, only the left ventral striatum showed weak positive correlations with ipsilateral regions, including the anterior and subgenual cingulate cortex, dorsomedial prefrontal cortex, and parietal regions. This structural covariance was not present in pre‐HD and was increased in mHD, relative to HC, although these effects did not survive the correction for multiple comparisons. We suggest that these regions exhibit higher structural covariance in mHD as a consequence of frequently reported HD‐related effects on frontostriatal and frontoparietal networks [Klöppel et al., 2008; Rosas et al., 2008; Tabrizi et al., 2009].
To characterize how the disease burden in HD affects the observed differential structural covariance pattern, we conducted a moderation analysis, defining the gene mutation carriers as a continuous group, without relying on the categorical distinction between pre‐HD and mHD. Our results revealed moderation effects only for the motor network, specifically, for DBS above 346. This finding is intriguing, since such a level of disease burden normally leads to the onset of typical motor signs and hence the switch from pre‐HD to mHD status. This moderation effect exerted influence on the correlation between the right dPMC and the right SPL, as well as between the right dPMC and right S1, areas critically involved in motor control. Interestingly, we have found the same right hemispheric regions in an effective connectivity analysis based on functional MRI data from a sequential finger tapping task [Klöppel et al., 2009a; Scheller et al., 2013], expressed by increasing influence from dPMC to SPL in pre‐HD far from clinical onset and indicating that this connection could be part of a compensatory mechanism. Furthermore, Scheller et al. [2013] reported a reduced effective connectivity from the right SPL to the right dPMC with approaching clinical onset and increasing task difficulty, indicative of disease‐specific neurodegeneration. This is also in agreement with findings showing reduced cortical thickness of the right SPL in mHD [Rosas et al., 2005] and a longitudinal decrease in glucose metabolism during rest in the parietal cortex bilaterally in both pre‐HD and mHD [Ciarmiello et al., 2006]. Of note, moderation effects were found only for the motor network and only for disease burden score associated with the first occurrence of HD‐specific motor symptoms, which suggests that disease burden score might possibly be less specific as a marker for the other networks.
CONCLUSION
In conclusion, the results of this study are an important step towards understanding the complex pattern of variation among distinct functionally relevant brain regions. Rather than studying regions in isolation, the structural covariance analysis allowed us to investigate the interrelation between regions involved in the same brain network. The results implicate a shared pattern of grey matter structural covariance among regions known to be part of the same functional brain networks. Furthermore, this pattern in structural covariance is differentially altered in Huntington's disease, characterized by lower covariance in pre‐HD compared with mHD. The increase in structural covariance observed at the manifest stage indicates a dominating disease process, i.e. regions equally affected by neurodegeneration exhibit high structural interrelationship. Furthermore, findings from our study fit well with the critical role of frontal‐parietal connections reported in the literature and demonstrate that structural connections of fronto‐parietal motor areas are moderated by the individuals' disease burden with approaching onset of motor symptoms.
Supporting information
Supporting Information Figure 1.
ACKNOWLEDGMENT
The TRACK‐HD study and this data analysis were funded by CHDI/High Q Foundation Inc, a not‐for‐profit organisation dedicated to finding treatments for Huntington's disease.
Track‐HD Investigators: Canada: A. Coleman, R. Dar Santos, J. Decolongon, A. Sturrock (University of British Columbia, Vancouver). France: C. Jauffret, D. Justo, S. Lehericy, C. Marelli, K. Nigaud, R. Valabrègue (ICM and APHP, Pitié‐Salpêtrière University Hospital, Paris). Netherlands: S.J.A. van den Bogaard, E.M. Dumas, J. van der Grond, E.P. 't Hart (Leiden University Medical Centre, Leiden). UK: H. Crawford, R. Scahill, N. Hobbs, N. Lahiri, T. Pepple, J. Read, M. Say, D. Whitehead (University College London, London); G.B. Landwehrmeyer (Ulm University, Ulm); N. Arran, J. Callaghan, D. Craufurd, C. Stopford (Manchester University, Manchester); N. Bechtel, S. Bohlen, R. Reilmann (George Huntington Institute, Munster); C. Frost, R Jones (London School of Hygiene and Tropical Medicine); C. Campbell, S Queller (Indiana University, Indiana); D.M. Cash (IXICO, London).
REFERENCES
- Alexander‐Bloch A, Giedd JN, Bullmore E (2013): Imaging structural co‐variance between human brain regions. Nat Rev Neurosci 14: 322–336. [DOI] [PMC free article] [PubMed] [Google Scholar]
- Amft M, Bzdok D, Laird AR, Fox PT, Schilbach L, Eickhoff SB (2014): Definition and characterization of an extended social‐affective default network. Brain Struct Funct 220:1031–1049. [DOI] [PMC free article] [PubMed] [Google Scholar]
- Ashburner J (2007): A fast diffeomorphic image registration algorithm. Neuroimage 38: 95–113. [DOI] [PubMed] [Google Scholar]
- Ashburner J, Friston KJ (2000): Voxel‐based morphometry‐The methods. Neuroimage 11: 805–821. [DOI] [PubMed] [Google Scholar]
- Ashburner J, Friston KJ (2005): Unified segmentation. Neuroimage 26: 839–851. [DOI] [PubMed] [Google Scholar]
- Bauer DJ, Curran PJ (2005): Probing Interactions in fixed and multilevel regression: Inferential and graphical techniques. Multivar Behav Res 40: 373–400. [DOI] [PubMed] [Google Scholar]
- Biglan KM, Ross CA, Langbehn DR, Aylward EH, Stout JC, Queller S, Carlozzi NE, Duff K, Beglinger LJ, Paulsen JS (2009): Motor abnormalities in premanifest persons with Huntington's disease: The PREDICT‐HD study. Mov Disord 24: 1763–1772. [DOI] [PMC free article] [PubMed] [Google Scholar]
- Biglan KM, Zhang Y, Long J, Geschwind M, Kang G, Killoran A, Lu W, McCusker E, Mills JA, Raymond LA, Testa C, Wojcieszek J, Paulsen JS (2013): Refining the diagnosis of Huntington Disease: The PREDICT‐HD study. Front in Aging Neurosci 5: 12. [DOI] [PMC free article] [PubMed] [Google Scholar]
- Bohanna I, Georgiou‐Karistianis N, Sritharan A, Asadi H, Johnston L, Churchyard A, Egan G (2011): Diffusion tensor imaging in Huntington's disease reveals distinct patterns of white matter degeneration associated with motor and cognitive deficits. Brain Imaging Behav 5: 171–180. [DOI] [PubMed] [Google Scholar]
- Ciarmiello A, Cannella M, Lastoria S, Simonelli M, Frati L, Rubinsztein DC, Squitieri F (2006): Brain white‐matter volume loss and glucose hypometabolism precede the clinical symptoms of Huntington's disease. J Nucl Med 47: 215–222. [PubMed] [Google Scholar]
- Clos M, Rottschy C, Laird AR, Fox PT, Eickhoff SB (2014): Comparison of structural covariance with functional connectivity approaches exemplified by an investigation of the left anterior insula. Neuroimage 99:269–280. [DOI] [PMC free article] [PubMed] [Google Scholar]
- Cohen, J (1988): Statistical Power Analysis for the Behavioral Sciences. Hillsdale, NJ: Lawrence Earlbaum Associates; pp 590. [Google Scholar]
- Dogan I, Eickhoff SB, Schulz JB, Shah NJ, Laird AR, Fox PT, Reetz K (2013): Consistent neurodegeneration and its association with clinical progression in Huntington's disease: A coordinate‐based meta‐analysis. Neurodegener Dis 12: 23–35. [DOI] [PMC free article] [PubMed] [Google Scholar]
- Douaud G, Gaura V, Ribeiro M, Lethimonnier F, Maroy R, Verny C, Krystkowiak P, Damier P, Bachoud‐Levi A, Hantraye P, Remy P (2006): Distribution of grey matter atrophy in Huntington's disease patients: A combined ROI‐based and voxel‐based morphometric study. Neuroimage 32: 1562–1575. [DOI] [PubMed] [Google Scholar]
- Draganski B, Gaser C, Kempermann G, Kuhn HG, Winkler J, Büchel C, May A (2006): Temporal and spatial dynamics of brain structure changes during extensive learning. J Neurosci 26: 6314–6317. [DOI] [PMC free article] [PubMed] [Google Scholar]
- Eickhoff SB, Bzdok D, Laird AR, Kurth F, Fox PT (2012): Activation likelihood estimation meta‐analysis revisited. Neuroimage 59: 2349–2361. [DOI] [PMC free article] [PubMed] [Google Scholar]
- Eickhoff SB, Laird AR, Grefkes C, Wang LE, Zilles K, Fox PT (2009): Coordinate‐based activation likelihood estimation meta‐analysis of neuroimaging data: A random‐effects approach based on empirical estimates of spatial uncertainty. Hum Brain Mapp 30: 2907–2926. [DOI] [PMC free article] [PubMed] [Google Scholar]
- Georgiou‐Karistianis N, Sritharan A, Farrow M, Cunnington R, Stout J, Bradshaw J, Churchyard A, Brawn T‐L, Chua P, Chiu E, Thiruvady D, Egan G (2007): Increased cortical recruitment in Huntington's disease using a Simon task. Neuropsychologia 45:1791–1800. [DOI] [PubMed] [Google Scholar]
- Georgiou‐Karistianis N, Stout JC, Domínguez D JF, Carron SP, Ando A, Churchyard A, Chua P, Bohanna I, Dymowski AR, Poudel G, Egan GF (2014): Functional magnetic resonance imaging of working memory in Huntington's disease: Cross‐sectional data from the IMAGE‐HD study. Hum Brain Mapp 35: 1847–1864. [DOI] [PMC free article] [PubMed] [Google Scholar]
- Gray JM, Young AW, Barker WA, Curtis A, Gibson D (1997): Impaired recognition of disgust in Huntington's disease gene carriers. Brain 120: 2029–2038. [DOI] [PubMed] [Google Scholar]
- Hanes KR, Andrewes DG, Pantelis C (1995): Cognitive flexibility and complex integration in Parkinson's disease, Huntington's disease, and schizophrenia. J Int Neuropsychol Soc 1: 545–553. [DOI] [PubMed] [Google Scholar]
- Hardwick RM, Rottschy C, Miall RC, Eickhoff SB (2013): A quantitative meta‐analysis and review of motor learning in the human brain. Neuroimage 67:283–297. [DOI] [PMC free article] [PubMed] [Google Scholar]
- Hayes AF (2013): Introduction to Mediation, Moderation, and Conditional Process Analysis: A Regression‐Based Approach. Methodology in the Social Sciences. New York: Guilford Publications; pp 507. [Google Scholar]
- Henley SMD, Novak MJU, Frost C, King J, Tabrizi SJ, Warren JD (2012): Emotion recognition in Huntington's disease: A systematic review. Neurosci Biobehav Rev 36: 237–253. [DOI] [PubMed] [Google Scholar]
- Hennenlotter A, Schroeder U, Erhard P, Haslinger B, Stahl R, Weindl A, Einsiedel HG, von, Lange KW Ceballos‐Baumann AO (2004): Neural correlates associated with impaired disgust processing in pre‐symptomatic Huntington's disease. Brain 127: 1446–1453. [DOI] [PubMed] [Google Scholar]
- He Y, Chen Z, Evans A (2008): Structural insights into aberrant topological patterns of large‐scale cortical networks in Alzheimer's disease. J Neurosci 28: 4756–4766. [DOI] [PMC free article] [PubMed] [Google Scholar]
- Hobbs NZ, Cole JH, Farmer RE, Rees EM, Crawford HE, Malone IB, Roos RAC, Sprengelmeyer R, Durr A, Landwehrmeyer B, Scahill RI, Tabrizi SJ, Frost C (2013): Evaluation of multi‐modal, multi‐site neuroimaging measures in Huntington's disease: Baseline results from the PADDINGTON study. Neuroimage Clin 2: 204–211. [DOI] [PMC free article] [PubMed] [Google Scholar]
- Johnson PO, Fay LC (1950): The Johnson‐Neyman technique, its theory and application. Psychometrika 15: 349–367. [DOI] [PubMed] [Google Scholar]
- Johnson PO, Neyman J (1936): Tests of certain linear hypotheses and their application to some educational problems. Stat Res Mem 1:57–93. [Google Scholar]
- Kenny DA (1987): Chapter 16. Testing measures of association In: Kenny DA, editor. Statistics for the Social and Behavioral Sciences. New York: Little, Brown; pp 270–291. [Google Scholar]
- Klöppel S, Draganski B, Golding CV, Chu C, Nagy Z, Cook PA, Hicks SL, Kennard C, Alexander DC, Parker GJM, Tabrizi SJ, Frackowiak RSJ (2008): White matter connections reflect changes in voluntary‐guided saccades in pre‐symptomatic Huntington's disease. Brain 131: 196–204. [DOI] [PubMed] [Google Scholar]
- Klöppel S, Draganski B, Siebner HR, Tabrizi SJ, Weiller C, Frackowiak RSJ (2009a): Functional compensation of motor function in pre‐symptomatic Huntington's disease. Brain 132: 1624–1632. [DOI] [PMC free article] [PubMed] [Google Scholar]
- Lawrence A (1998): Evidence for specific cognitive deficits in preclinical Huntington's disease. Brain 121: 1329–1341. [DOI] [PubMed] [Google Scholar]
- Li X, Pu F, Fan Y, Niu H, Li S, Li D (2013): Age‐related changes in brain structural covariance networks. Front Hum Neurosci 7:98. [DOI] [PMC free article] [PubMed] [Google Scholar]
- Mechelli A, Crinion JT, Noppeney U, O'Doherty J, Ashburner J, Frackowiak RS, Price CJ (2004): Neurolinguistics: Structural plasticity in the bilingual brain. Nature 431: 757. [DOI] [PubMed] [Google Scholar]
- Mechelli A, Friston KJ, Frackowiak RS, Price CJ (2005): Structural covariance in the human cortex. J Neurosci 25: 8303–8310. [DOI] [PMC free article] [PubMed] [Google Scholar]
- Milders M, Crawford JR, Lamb A, Simpson SA (2003): Differential deficits in expression recognition in gene‐carriers and patients with Huntington's disease. Neuropsychologia 41: 1484–1492. [DOI] [PubMed] [Google Scholar]
- Müller VI, Langner R, Cieslik EC, Rottschy C, Eickhoff SB (2014): Interindividual differences in cognitive flexibility: Influence of gray matter volume, functional connectivity and trait impulsivity. Brain Struct Funct 220:2401–2414. [DOI] [PMC free article] [PubMed] [Google Scholar]
- Novak MJU, Seunarine KK, Gibbard CR, Hobbs NZ, Scahill RI, Clark CA, Tabrizi SJ (2014): White matter integrity in premanifest and early Huntington's disease is related to caudate loss and disease progression. Cortex 52:98–112. [DOI] [PubMed] [Google Scholar]
- O'Rourke JJF, Beglinger LJ, Smith MM, Mills J, Moser DJ, Rowe KC, Langbehn DR, Duff K, Stout JC, Harrington DL, Carlozzi N, Paulsen JS, The PREDICT‐HD Investigators (2011): The Trail Making Test in prodromal Huntington disease: Contributions of disease progression to test performance. J Clin Exp Neuropsychol 33:567–579. [DOI] [PMC free article] [PubMed] [Google Scholar]
- Papp KV, Kaplan RF, Snyder PJ (2011): Biological markers of cognition in prodromal Huntington's disease: A review. Brain Cogn 77: 280–291. [DOI] [PubMed] [Google Scholar]
- Paulsen JS, Salmon DP, Monsch AU, Butters N, Swenson MR, Bondi MW (1995): Discrimination of cortical from subcortical dementias on the basis of memory and problem‐solving tests. J Clin Psychol 51: 48–58. [DOI] [PubMed] [Google Scholar]
- Penney JB, Vonsattel JP, MacDonald ME, Gusella JF, Myers RH (1997): CAG repeat number governs the development rate of pathology in Huntington's disease. Ann Neurol 41: 689–692. [DOI] [PubMed] [Google Scholar]
- Poudel GR, Stout JC, Domínguez D JF, Churchyard A, Chua P, Egan GF, Georgiou‐Karistianis N (2014): Longitudinal change in white matter microstructure in Huntington's disease: The IMAGE‐HD study. Neurobiol Dis 74:406–412. [DOI] [PubMed] [Google Scholar]
- Poudel GR, Stout JC, Domínguez D JF, Gray MA, Salmon L, Churchyard A, Chua P, Borowsky B, Egan GF, Georgiou‐Karistianis N (2015): Functional changes during working memory in Huntington's disease: 30‐month longitudinal data from the IMAGE‐HD study. Brain Struct Funct 220: 501–512. [DOI] [PubMed] [Google Scholar]
- Rao JA, Harrington DL, Durgerian S, Reece C, Mourany L, Koenig K, Lowe MJ, Magnotta VA, Long JD, Johnson HJ, Paulsen JS, Rao SM (2014): Disruption of response inhibition circuits in prodromal Huntington disease. Cortex 58:72–85. [DOI] [PMC free article] [PubMed] [Google Scholar]
- Rosas HD, Hevelone ND, Zaleta AK, Greve DN, Salat DH, Fischl B (2005): Regional cortical thinning in preclinical Huntington disease and its relationship to cognition. Neurology 65: 745–747. [DOI] [PubMed] [Google Scholar]
- Rosas HD, Koroshetz WJ, Chen YI, Skeuse C, Vangel M, Cudkowicz ME, Caplan K, Marek K, Seidman LJ, Makris N, Jenkins BG, Goldstein JM (2003): Evidence for more widespread cerebral pathology in early HD: an MRI‐based morphometric analysis. Neurology 60: 1615–1620. [DOI] [PubMed] [Google Scholar]
- Rosas HD, Salat DH, Lee SY, Zaleta AK, Pappu V, Fischl B, Greve D, Hevelone N, Hersch SM (2008): Cerebral cortex and the clinical expression of Huntington's disease: Complexity and heterogeneity. Brain 131: 1057–1068. [DOI] [PMC free article] [PubMed] [Google Scholar]
- Rottschy C, Caspers S, Roski C, Reetz K, Dogan I, Schulz JB, Zilles K, Laird AR, Fox PT, Eickhoff SB (2013): Differentiated parietal connectivity of frontal regions for “what” and “where” memory. Brain Struct Funct 218: 1551–1567. [DOI] [PMC free article] [PubMed] [Google Scholar]
- Rottschy C, Langner R, Dogan I, Reetz K, Laird AR, Schulz JB, Fox PT, Eickhoff SB (2012): Modelling neural correlates of working memory: A coordinate‐based meta‐analysis. Neuroimage 60: 830–846. [DOI] [PMC free article] [PubMed] [Google Scholar]
- Scahill RI, Hobbs NZ, Say MJ, Bechtel N, Henley SM, Hyare H, Langbehn DR, Jones R, Leavitt BR, Roos RA, Durr A, Johnson H, Lehéricy S, Craufurd D, Kennard C, Hicks SL, Stout JC, Reilmann R, Tabrizi SJ (2011): Clinical impairment in premanifest and early Huntington's disease is associated with regionally specific atrophy. Hum Brain Mapp 34:519–529. [DOI] [PMC free article] [PubMed] [Google Scholar]
- Scheller E, Abdulkadir A, Peter J, Tabrizi SJ, Frackowiak RSJ, Klöppel S (2013): Interregional compensatory mechanisms of motor functioning in progressing preclinical neurodegeneration. Neuroimage 75:146–154. [DOI] [PMC free article] [PubMed] [Google Scholar]
- Seeley WW, Crawford RK, Zhou J, Miller BL, Greicius MD (2009): Neurodegenerative diseases target large‐scale human brain networks. Neuron 62: 42–52. [DOI] [PMC free article] [PubMed] [Google Scholar]
- Soriano‐Mas C, Harrison B, Pujol J, Lopez‐Sola M, Hernandez‐Ribas R, Alonso P, Contreras‐Rodriguez O, Gimenez M, Blanco‐Hinojo L, Ortiz H, Deus J, Menchon J, Cardoner N (2013): Structural covariance of the neostriatum with regional gray matter volumes. Brain Struct Funct 218: 697–709. [DOI] [PubMed] [Google Scholar]
- Sprengelmeyer R, Schroeder U, Young AW, Epplen JT (2006): Disgust in pre‐clinical Huntington's disease: A longitudinal study. Neuropsychologia 44: 518–533. [DOI] [PubMed] [Google Scholar]
- Sprengelmeyer R, Young AW, Calder AJ, Karnat A, Lange H, Hömberg V, Perrett DI, Rowland D (1996): Loss of disgust. Perception of faces and emotions in Huntington's disease. Brain 119: 1647–1665. [DOI] [PubMed] [Google Scholar]
- Tabrizi SJ, Langbehn DR, Leavitt BR, Roos RAC, Durr A, Craufurd D, Kennard C, Hicks SL, Fox NC, Scahill RI, Borowsky B, Tobin AJ, Rosas HD, Johnson H, Reilmann R, Landwehrmeyer B, Stout JC (2009): Biological and clinical manifestations of Huntington's disease in the longitudinal TRACK‐HD study: cross‐sectional analysis of baseline data. Lancet Neurol 8:791–801. [DOI] [PMC free article] [PubMed] [Google Scholar]
- Thieben MJ, Duggins AJ, Good CD, Gomes L, Mahant N, Richards F, McCusker E, Frackowiak RSJ (2002): The distribution of structural neuropathology in pre‐clinical Huntington's disease. Brain 125: 1815–1828. [DOI] [PubMed] [Google Scholar]
- Turkeltaub PE, Eden GF, Jones KM, Zeffiro TA (2002): Meta‐analysis of the functional neuroanatomy of single‐word reading: Method and validation. Neuroimage 16: 765–780. [DOI] [PubMed] [Google Scholar]
- Walker FO (2007): Huntington's disease. Lancet 369: 218–228. [DOI] [PubMed] [Google Scholar]
- Wolf RC, Sambataro F, Vasic N, Schönfeldt‐Lecuona C, Ecker D, Landwehrmeyer B (2008a): Aberrant connectivity of lateral prefrontal networks in presymptomatic Huntington's disease. Exp Neurol 213: 137–144. [DOI] [PubMed] [Google Scholar]
- Wolf RC, Sambataro F, Vasic N, Schönfeldt‐Lecuona C, Ecker D, Landwehrmeyer B (2008b): Altered frontostriatal coupling in pre‐manifest Huntington's disease: Effects of increasing cognitive load. Eur J Neurol 15: 1180–1190. [DOI] [PubMed] [Google Scholar]
- Xia M, Wang J, He Y, Csermely P (2013): BrainNet Viewer: A network visualization tool for human brain connectomics. PLoS One 8: e68910. [DOI] [PMC free article] [PubMed] [Google Scholar]
- Zhou J, Gennatas ED, Kramer JH, Miller BL, Seeley WW (2012): Predicting regional neurodegeneration from the healthy brain functional connectome. Neuron 73: 1216–1227. [DOI] [PMC free article] [PubMed] [Google Scholar]
- Zielinski BA, Anderson JS, Froehlich AL, Prigge MBD, Nielsen JA, Cooperrider JR, Cariello AN, Fletcher PT, Alexander AL, Lange N, Bigler ED, Lainhart JE (2012): scMRI reveals large‐scale brain network abnormalities in autism. PLoS One 7: e49172. [DOI] [PMC free article] [PubMed] [Google Scholar]
Associated Data
This section collects any data citations, data availability statements, or supplementary materials included in this article.
Supplementary Materials
Supporting Information Figure 1.