

Abstract
Developmental dyslexia is a reading disorder often characterized by reduced awareness of speech units. Whether the neural source of this phonological disorder in dyslexic readers results from the malfunctioning of the primary auditory system or damaged feedback communication between higher‐order phonological regions (i.e., left inferior frontal regions) and the auditory cortex is still under dispute. Here we recorded magnetoencephalographic (MEG) signals from 20 dyslexic readers and 20 age‐matched controls while they were listening to ∼10‐s‐long spoken sentences. Compared to controls, dyslexic readers had (1) an impaired neural entrainment to speech in the delta band (0.5–1 Hz); (2) a reduced delta synchronization in both the right auditory cortex and the left inferior frontal gyrus; and (3) an impaired feedforward functional coupling between neural oscillations in the right auditory cortex and the left inferior frontal regions. This shows that during speech listening, individuals with developmental dyslexia present reduced neural synchrony to low‐frequency speech oscillations in primary auditory regions that hinders higher‐order speech processing steps. The present findings, thus, strengthen proposals assuming that improper low‐frequency acoustic entrainment affects speech sampling. This low speech‐brain synchronization has the strong potential to cause severe consequences for both phonological and reading skills. Interestingly, the reduced speech‐brain synchronization in dyslexic readers compared to normal readers (and its higher‐order consequences across the speech processing network) appears preserved through the development from childhood to adulthood. Thus, the evaluation of speech‐brain synchronization could possibly serve as a diagnostic tool for early detection of children at risk of dyslexia. Hum Brain Mapp 37:2767–2783, 2016. © 2016 Wiley Periodicals, Inc.
Keywords: auditory entrainment, effective connectivity, developmental dislexia, magnetoencephalography, speech perception
Abbreviations
- AC
Auditory cortex
- CSD
Cross‐spectral density
- HPI
Head position indicator
- MEG
Magnetoencephalography
- MNI
Montreal Neurological Institute
- MRI
Magnetic resonance brain images
- PDC
Partial direct coherence
- RAN
Rapid automatized naming
- VAR
Vector autoregressive
INTRODUCTION
Most individuals with developmental dyslexia present difficulties in identifying and consciously manipulating the sounds of their own language. This phonological awareness deficit is found across ages, as well as across most languages and cultures and hampers the acquisition of the print‐to‐sound conversion rules that are at the root of the acquisition of reading skills. However, the underlying cause of this phonological disorder is still under dispute. Taking advantage of neurophysiological measures with high temporal resolution (i.e., magnetoencephalography, MEG), we firstly identified a set of brain regions that fail to temporally align to the quasi‐rhythmic modulations of speech [Giraud and Poeppel, 2012; Gross et al., 2013; Poeppel et al., 2008] in dyslexia, and secondly documented whether and how the communication dynamics between these regions is impaired.
Several hypotheses have been proposed to account for the phonological deficit with respect to the processing hierarchy of ‘speech perception‐to‐phonological representation’ in dyslexia. The most influential phonological hypothesis of developmental dyslexia [e.g., Snowling, 1981; but see Snowling, 2008] proposes that storage and retrieval of phonological representations in the left perisylvian brain regions are impaired. Specifically, phonological representations could be damaged in dyslexic readers. Studies showing reduced activation in regions involved in high‐level phonological processing, such as the left inferior frontal regions [Kovelman et al., 2012; MacSweeney et al., 2009] are consistent with this hypothesis. In contrast, a phonological access deficit, i.e., problems for high‐order phonological processing regions in automatically accessing and retrieving the phonologically related low‐level acoustic inputs [Ramus and Szenkovits, 2008] could be the underlying cause. Boets et al. [2013; Boets, 2014; Ramus, 2014; Vandermosten et al., 2012] provide supporting neurophysiological evidence for such impairment, suggesting a “disconnection syndrome” in dyslexia. Functional MRI recordings during the performance of a task engaging phonemic awareness showed that (i) dyslexic participants exhibited intact coding and discrimination of task‐relevant acoustic features in their auditory cerebral regions, while (ii) the functional connectivity of these areas with the left inferior frontal gyrus was impaired. This finding was interpreted as demonstrating that the left inferior frontal gyrus was unable to drive top‐down processing [Park et al., 2015] to select low‐level auditory speech inputs in order to process them phonologically.
The aforementioned hypotheses attribute the cause of phonological deficits in dyslexia to difficulties restricted to the language‐specific domain of processing. However, these problems could originate during early perceptual processing of speech comprehension and are therefore likely to affect domain‐general auditory processes. The auditory temporal sampling hypothesis [Goswami, 2011] proposes that phonological disorders are caused by an atypical sensitivity to low frequency auditory bands of the right auditory cortex. Interestingly, these slow brain fluctuations line up with temporal occurrences of non‐phonemic speech information, namely prosody and syllables [<10 Hz; Goswami, 2002]. Furthermore, the processing of the acoustic features of this ‘slow pace’ speech information strongly contributes to reading acquisition [Goswami, 2002, 2011; Goswami et al., 2013]. In support of this hypothesis, it was noted that dyslexic participants exhibited an abnormal phase‐alignment (referred to as neural entrainment) between the neural responses of the auditory cortex to oscillatory non‐speech auditory inputs presented at low frequencies [Hamalainen et al., 2012; Lizarazu et al., 2015; Power et al., 2013]. Importantly, through the neural mechanism of cross‐frequency coupling [Lehongre et al., 2011], slow oscillations can serve as a chunking mechanism to sample phonemic units [Goswami, 2011]. Atypical neural entrainment at slow frequencies could result in atypical synchronization to fast oscillatory speech information [Gross et al., 2013], thus hindering the proper sampling of speech phonemic segments [>30 Hz, see Lehongre et al., 2011, 2013; Lizarazu et al., 2015].
A potential limitation of the aforementioned studies, however, is that they do not provide data to evaluate the different alternative hypotheses proposed. In this regard, methodological choices are crucial regarding (i) the type of stimuli to be processed during brain activity recording and (ii) the brain imaging method and analyses used. With regards to the former, we recorded oscillatory activity during ecologically valid continuous speech perception, based on the consensus that the phonological difficulties, which contribute to dyslexia, stem from atypical neural processing of speech streams [Goswami, 2011; Lallier et al., 2013; Paulesu et al., 1996; Ramus and Szenkovits, 2008]. Previous studies focused either on the processing of isolated lexical or sublexical speech information (such as those engaging the conscious manipulation of phonemes, Boets et al., 2013) or on non‐verbal auditory stimuli [Hamalainen et al., 2012; Lehongre et al., 2011] that may fail to capture high‐level language mechanisms and the involvement of left frontal brain regions. Concerning the second point, Ramus [2014] interpreted the functional connectivity impairment found in the dyslexic participants of Boets et al. [2013] as reflecting problems in the top‐down interaction from phonological (left inferior frontal gyrus) to perceptual (bilateral auditory cortices) processing regions. However, Boets et al. fMRI data do not fully support this claim, since the connectivity analyses these authors performed do not provide information about directionality. It is possible that, against both the phonological access hypothesis [Ramus and Szenkovits, 2008] and the disconnection hypothesis [Boets, 2014], dyslexic readers present impaired bottom‐up connection from low to high‐level phonological regions, which would be more in line with Goswami's [2011] auditory temporal sampling hypothesis. Here, taking advantage of the high temporal resolution of MEG, we provide a detailed account of the impaired oscillatory brain entrainment to continuous speech in dyslexia and test, with effective connectivity measures, causal interaction within the network.
After behavioral assessment, a group of dyslexic and (age‐matched) control participants was presented with a large variety of speech utterances while their electrophysiological brain activity was recorded with MEG. This technique allows us to consider speech‐synchronous neural activity across the whole brain at multiple frequency bands and to evaluate how primary auditory regions interact in time with other perisylvian areas [see Giraud and Poeppel, 2012; Poeppel et al., 2008, for a neuroanatomical model]. Importantly, we assessed for the first time the directionality of interregional communication within the phonological network in dyslexia.
We expected neural auditory entrainment (measured by regional cortical coherence) to occur at low‐frequencies of speech (<10 Hz) for controls [as previously found in Bourguignon et al., 2013; Gross et al., 2013], that should be reduced for the dyslexic group. In contrast to previous studies, we examined more extended brain networks involved in speech processing than the auditory cortices [see Gross et al., 2013; Park et al., 2015]. Crucially, we also analyzed patterns of effective connectivity [Baccalá and Sameshima, 2001] within the speech‐processing network for dyslexic and normal readers. Given the relevance of the developmental perspective in the research on dyslexia, we further tested whether atypical auditory entrainment effects in dyslexia were present independently of age‐related reading experience. Thus, we separately analyzed children (early stage readers) and adult participants (with long‐term reading experience). Lastly, we also determined whether regional coherence and connectivity scores correlated with the reading and phonological performance of the dyslexic participants as assessed by classical diagnostic tasks.
MATERIALS AND METHODS
Participants
Forty participants took part in the present study, including 20 skilled readers (10 males) and 20 dyslexic readers (nine males) matched one by one for age [t(19) = 0.34; see Table 1]. All participants had Spanish as their native language and were not fluent in any other language. They had normal or corrected‐to‐normal vision and reported no hearing impairments. Ten adult readers and 10 children at earlier stages of reading acquisition composed each group (Table 1). The age of our child groups was 11.3 years old on average (from 8 to 14, SD = 2). We selected this time range for our group of children based on previous neurophysiological evidence. Shaw et al. [2008] showed that in this time period the superior temporal regions are maturing. In fact, the age at which peak cortical thickness is reached [the point where increase gives way to decrease in cortical thickness, Magnotta et al., 1999] is 14.9 years old. Similarly, electrophysiological studies have observed that automatic grapheme‐to‐phoneme mapping is attained by this time period on average in healthy children [Froyen et al., 2009]. The BCBL ethical committee approved the experiment (following the principles of the Declaration of Helsinki) and all participants signed the informed consent.
Table 1.
Behavioral assessment for the group factor (dyslexic, control) separated by age group (adults, children)
| Dyslexic group | Control group | |||||||
|---|---|---|---|---|---|---|---|---|
| Adults (N = 10) | Children (N = 10) | Adults (N = 10) | Children (N = 10) | |||||
| Age (years) | 29.75 | (22.2 − 37.3) | 11.08 | (9.6 − 12.5) | 32.5 | (25.7 − 39.2) | 11.6 | (9.25 − 12.8) |
| IQa | 115 | (108.4 − 121.5) | 109.8 | (104.4 − 115.2) | 125.4 | (123.2 − 127.6) | 114.8 | (107.2 − 122.3) |
| WM span | 4.1 | (3.2 − 4.9) | 3.6 | (2.6 − 4.6) | 4.7 | (3.7 − 5.6) | 4.3 | (3.6 − 5) |
| Word reading | ||||||||
| Accuracy (/40) | 38.2 | (37 − 39.4) | 33.2 | (30 − 36.4) | 39.8 | (39.5 − 40.1) | 39.7 | (39.2 − 40.2) |
| Time (sec) | 37.6 | (29 − 46.2) | 92.8 | (51.8 − 133.8) | 23.9 | (20.8 − 27) | 29.7 | (24.2 − 35.2) |
| Pseudoword reading | ||||||||
| Accuracy (/40) | 33.7 | (30.9 − 36.5) | 28 | (24 − 32) | 39 | (38.3 − 39.7) | 37.3 | (36 − 38.6) |
| Time (sec) | 64.6 | (51.9 − 77.3) | 122 | (69.3 − 174.7) | 39.1 | (34.8 − 43.4) | 52 | (45.5 − 58.5) |
| Phonological tasks | ||||||||
| Phonemic fluency (n. words) | 18.6 | (15.2 − 22) | 12 | (9.8 − 14.1) | 20.4 | (17.7 − 23.1) | 13.5 | (11.5 − 15.5) |
| Semantic fluency (n. words) | 22.5 | (19.2 − 25.8) | 19.1 | (14.9 − 23.3) | 26.2 | (22.3 − 30) | 22.6 | (18.8 − 26.3) |
| RAN (time in sec) | ||||||||
| ‐Color | 25.4 | (21.8 − 29) | 51.1 | (27.1 − 75.1) | 19.8 | (17.1 − 22.4) | 29.3 | (23.4 − 35.2) |
| ‐Picture | 32 | (25.3 − 38.6) | 46.1 | (34 − 58.2) | 24 | (21.4 − 26.6) | 28.8 | (24.9 − 32.7) |
| ‐Letter | 15.3 | (14 − 16.6) | 20.6 | (14.7 − 26.5) | 11.9 | (10.3 − 13.5) | 17.3 | (14 − 20.6) |
| ‐Digit | 14.3 | (13.3 − 15.3) | 19.8 | (15.9 − 23.6) | 11.5 | (10 − 13.2) | 13.9 | (11.9 − 15.8) |
| Pseudoword repetition (%)b | 78.6 | (70.2 − 87.1) | 79.4 | (70.5 − 88.4) | 90.6 | (86 − 95) | 84.6 | (78.8 − 90.4) |
| Phonemic deletion (%)b | 80 | (66 − 94) | 65.3 | (40 − 90.7) | 93 | (85.3 − 100) | 91.6 | (85.2 − 98) |
Bold values highlight the tasks in which a significant difference between Controls and Dyslexic readers emerged. No interaction between Group and Age Group was observed.
P‐values (one‐tailed) were computed employing a univariate ANOVA controlling for IQ; U‐Mann Whitney test in case of violation of sphericity.
WAIS standard score for adults and WISC‐R for children.
Missing values for three dyslexic participants and one control participant.
Our inclusion criteria for selecting dyslexic individuals were (1) self‐reported childhood and/or reading difficulties at the time of testing, (2) intelligence quotient superior to 80 on the WAIS (adults) or WISC‐R (children) battery, (3) below‐normal reading performance (−1.5 standard deviation below average) on item reading time and accuracy (pseudowords in particular) and (4) previous formal diagnosis of dyslexia. Exclusion criteria for the selection of the participants were the following: diagnosis of any other learning disability (Speech Language Impairment, ADHD, dyspraxia), a long absence from school for personal reasons, vision and/or audition problems history. Reading performance was evaluated with the word and pseudoword reading lists of the PROLEC‐R battery [Cuetos et al., 2009]. Accuracy and total time to read the list were recorded and z‐scores were computed. For children, we used the PROLEC battery's normative data that goes up to the age of 15 − 16 years old. For adults, z‐scores were computed based on the performance of 46 skilled monolingual Spanish adults matched for age (M = 32.46; SD = 11.57) with the control [t(54) = 0.72, P > 0.05] and dyslexic [t(54) = 0.06, P > 0.05] groups of the present study.
All dyslexic participants, except for three, showed a deficit in pseudoword reading accuracy, whereas none of the control participants did. The three dyslexic participants with good pseudoword reading accuracy (accuracy: z < 1) exhibited a deficit in pseudoword reading time (z < −2), and they were also impaired on word reading time (z < −1.5), a measure on which all control participants showed preserved performance.
Phonological Processing Assessment
Verbal fluency (lexical phonological access)
Lexical phonological access based on a phonemic cue
Participants were presented with the sound/t/and had one minute to produce as many words as possible that started with this phoneme. The number of words produced was recorded.
Lexical phonological access based on a semantic cue
Participants were presented with the semantic category of “animals” and had to produce as many words as possible belonging to this category in 1 minute. The number of words produced was recorded.
Rapid automatized naming—RAN (lexical phonological access)
We used the four RAN subtests of the Comprehensive Test of Phonological Processing [Wagner et al., 1999], measuring rapid picture, color, digit, and letter naming. For each of these tasks, six items were used. Each task was divided into two configurations, which were presented on separate sheets. Each configuration presented four rows of nine items, for a total of 72 items per task. Participants were asked to name aloud each of the items as fast as they could, following the reading direction. The total time to name the 72 items for each of the four tasks was recorded (in seconds).
Pseudoword repetition (phonological short‐term memory)
Participants listened to 24 pseudowords one after the other over headphones and were instructed to repeat them as well as they could. Items varied from two to four syllables (eight of 2, 3, and 4 syllables) and their structure followed Spanish phonotactic rules. None of the pseudowords included repeated phonemes. The number of correctly repeated pseudowords was recorded and converted into percentage. Phonemic errors were then analyzed and assigned to the following categories: phonemic addition (/taØforbegun/→/tasforbegun/), phonemic substitution (/talsomen/→/kalsomen/), phonemic permutation (/musbolife/→/muslobife/) and phonemic omission (/taforbegun/→/taforbeguØ/).
Phonemic deletion (phonemic awareness)
Participants were presented with 24 pseudowords over headphones and were instructed to remove the first sound of the pseudoword to produce what remained. Pseudowords were two syllables long and respected Spanish phonotactic rules. Half of the items started with a consonantal cluster (e.g.,/tr/) and the other half with a simple consonant‐vowel syllable (e.g.,/pa/). The number of correct answers was recorded and converted into percentage. Then, errors were classified into the following categories: phoneme deletions errors (e.g.,/pladi/→/adi/) and phonemic errors occurring outside of the deletion site (e.g.,/pladi/→/lati/).
Data Analysis for Participant Inclusion
ANOVAs with group (dyslexic, control) and age group (adults, children) as the between subject factors were conducted on reading and phonological performance for each of the aforementioned task. Non‐parametric tests (U‐Mann Whitney, one‐tailed, to assess group differences) were used in case of violation of the assumptions to run parametric tests. In order to examine the links between brain responses and both literacy and phonological skills, we conducted robust correlation analyses [Pernet et al., 2013] between these relevant variables (plus partial correlations controlling for age and IQ), within the dyslexic and control group separately (each n = 20).
Behavioral Assessment
Although adult participants exhibited an IQ > 100 on the WAIS battery, and all children an IQ > 100 on the WISC‐R battery, an ANOVA with group (dyslexic, control) and age group (adults, children) as factors on IQ scores showed a main group effect (P < 0.01), illustrating that the dyslexic participants exhibited lower IQ than their peers. All further group analyses (group by age group) conducted on the whole sample were therefore controlled for IQ.
First, the interaction between the two between subject factors considered never reached significance (neither at the behavioral nor at the neural level). Moreover, the dyslexic and the control group differed on all reading measures (for all group effects, P < 0.05).
Phonological Processing
The dyslexic and skilled readers performed similarly on both the phonemic and the semantic fluency tasks. The dyslexic group was slower at performing the RAN tasks on average compared to the controls; this effect was driven by the significantly slower performance for pictures and digits (all P < 0.05).
On the pseudoword repetition task, dyslexic participants were less accurate overall (P < 0.05). The qualitative analysis of the errors showed that the most common errors, for both dyslexic and control participants, were phonemic substitution errors. Lastly, on the task measuring phonological awareness (phonemic deletion), a significant group effect was observed on the accuracy measures (P < 0.01).
Overall, both dyslexic adults and children exhibited phonological processing difficulties that were evident across various phonological constructs: phonological access and retrieval (RAN task), phonological short‐term memory (pseudoword repetition), and phonemic awareness (phonemic deletion).
MEG Session
Stimuli
The stimuli consisted of 40 meaningful sentences, ranging in duration from 7.42 to 12.65 s (M = 9.9; SD = 1.13). Sentences were uttered by a Spanish native female speaker and digitized at 44.1 kHz using a digital recorder (Marantz PMD670). Audio files (*.wav) were segmented using the Praat software.
Procedure
During MEG recording, sentences were presented auditorily to the participants at 75–80 dB sound pressure level (MEG). Sentences were presented binaurally through ear‐inserts. Each sentence was preceded by a 1 sec‐long auditory tone (at 500 Hz tone) followed by a 2 sec‐long silence period. Two seconds after the end of each sentence, a comprehension question was presented auditorily. An example is reported below:
Sentence: Este año empezaremos a estudiar Inglés y cuando estemos en el último curso el colegio organizará una excursión a Londres para conocer chicos de allí y practicar el idioma. Question: ¿Organizará el colegio una excursión a París?
[This year we will start studying English and when we are in the final year the school will organize a trip to London to meet people from there and learn the language. ‐ Will the school organize a trip to Paris?]
During sentence and question presentation, participants were presented with a white fixation cross on the screen. After the question, a Yes/No prompt appeared on the screen. Participants were asked to answer the question by pressing the corresponding button (Yes/No). After they had responded, the next sentence was presented. Response side for Yes/No answers were counterbalanced across participants and the presentation order of the sentences was randomized. Participants were asked to refrain from moving their head and to try to blink only during time periods between sentences. Stimuli were delivered using Presentation software (http://www.neurobs.com/).
For all participants we also recorded a resting state session at the beginning of the experimental session, in which they had to spend 4 minutes in the MEG with eyes open fixating the sticker on the screen. In this time frame they received no stimulation and they were instructed to relax and avoid head or eye movements.
Data Acquisition
MEG data were acquired in a magnetically shielded room using the whole‐scalp MEG system (Elekta‐Neuromag, Helsinki, Finland) installed at the BCBL (Basque center on Cognition, Brain and Language: http://www.bcbl.eu/bcbl-facilitiesresources/meg/). The system is equipped with 102 sensor triplets (each comprising a magnetometer and two orthogonal planar gradiometers), which are uniformly distributed around the head of the participant. Head position inside the helmet was continuously monitored using four head position indicator (HPI) coils. The location of each coil relative to the anatomical fiducials (nasion, left and right preauricular points) was defined with a 3D digitizer (FastrakPolhemus, Colchester, VA). This procedure is critical for head movement compensation during the data recording session. Digitalization of the fiducials plus ∼100 additional points evenly distributed over the scalp of the participant were used during subsequent data analysis to spatially align the MEG sensor coordinates with T1 magnetic resonance brain images (MRI) acquired on a 3T MRI scan (Siemens Medical System, Erlangen, Germany). MEG recordings were acquired continuously with a bandpass filter at 0.01–330 Hz and a sampling rate of 1 kHz. Eye‐movements were monitored with two pairs of electrodes in a bipolar montage placed on the external chanti of each eye (horizontal EOG) and above and below right eye (vertical EOG).
Data Analysis: Preprocessing
Data were preprocessed off‐line using the Signal‐Space‐Separation method [Taulu et al., 2005] implemented in Maxfilter 2.1 (Elekta‐Neuromag) to subtract external magnetic noise from the MEG recordings. The MEG data were also corrected for head movements and bad channels were substituted using interpolation algorithms implemented in the software.
The following analyses were performed using Matlab R2010 (Mathworks, Natick, MA). Broadband amplitude envelope (Env) of the audio signals was obtained from the Hilbert transformed broadband stimulus waveform [Drullman et al., 1994]. The preprocessed auditory stimuli and the corresponding MEG data were segmented into 2.048 ms‐long epochs with 1.024 ms epoch overlap [Bortel and Sovka, 2007; Bourguignon et al., 2013]. Epochs with EOG, MEG magnetometer and MEG gradiometer peak‐to‐peak amplitude larger than 200 µV, 4000 fT or 3000 fT/cm respectively were considered as artifact‐contaminated and rejected from further analysis. On average, the percentage of epochs considered in further analyses was 73.2% (SD: 16.7%) and 74.1% (SD: 15.9%) for the control and the dyslexic participants respectively. These data were used in the following coherence analyses.
Data Analysis: Sensor Level Analysis
Coherence between the MEG gradiometer data and the envelope (Env) of the audio signals was obtained in the 0.5–40 Hz frequency band with ∼0.5 Hz (inverse of the epoch duration) frequency resolution (Speech perception coherence). The data from pairs of gradiometers were linearly combined so as to maximize the coherence according to the following procedure. First, for each MEG sensor (r ϵ {1:102}), signals from gradiometer pairs were linearly combined to estimate the signal of a virtual gradiometer in the orientation θ ϵ [0; π]:
Following Halliday et al [1995], coherence based on the Fourier transform of artifact‐free epochs was then computed between Env and :
where * is the Hermitian conjugate and the mean across epochs. In practice, was estimated from the cross‐spectral density (CSD) matrix formed with , and , and for spanning by steps of . The optimum coherence value were finally obtained as follows:
where F=[0.5–40 Hz] and the arithmetic mean. Thus, a coherence value for each (i) participant, (ii) MEG sensor (combination of gradiometer pairs) and (iii) frequency bin below 40 Hz was obtained. No effects in fact were expected at frequencies > 40 Hz [Bourguignon et al., 2013; Gross et al., 2013; Park et al., 2015].
The coherence spectra were obtained from 0.5 Hz to 40 Hz with a 0.5 Hz frequency resolution separately in each hemisphere for normal and dyslexic readers (Fig. 1, upper panels). For each frequency bin, the difference between the maximum over all sensors (within each hemisphere) of Speech perception coherence value and the maximum over all sensors (in the respective hemisphere) of Baseline coherence value (coherence between the audio signals and resting state MEG signals) was calculated. The statistical significance of Speech perception coherence values (vs. Baseline) was determined at each frequency bin with a non‐parametric permutation test [maximum statistic permutations, m.s.p., Nichols and Holmes, 2001] in both reading groups. The sampling distribution of the maximal difference of coherence values (maximum taken across all sensors) was evaluated using the exhaustive permutation test. Frequencies for which the non‐permuted maximal difference exceeded the 95 percentile of this permutation distribution were defined as frequencies of interest, and the corresponding supra‐threshold sensors were defined as sensors of interest for this frequency band. Contiguous significant frequencies were grouped in frequency “bands of interest” (Fig. 1, lower panels). These frequency bands were selected to compute coherence analysis in the source space. Topographical sensor maps of the coherence were also computed to cross‐validate the distribution of the source‐level effects observed in the following analyses.
Figure 1.
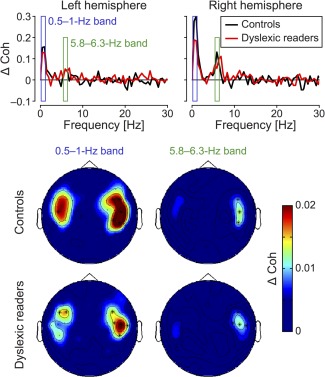
Sensor level analysis of coherence. Upper panel: Coherence spectra calculated from the difference between the Speech perception coherence (speech‐brain coherence while listening) and the Baseline conditions (speech‐brain coherence in resting state conditions) across all frequencies and displayed in the 0–30 Hz frequency range (while analyzed up to 40 Hz) for visualization purposes respectively in the left and the right lateralized sensors for Controls (black line) and Dyslexic readers (red line). After the permutation test, the frequency bands showing significantly larger Speech perception coherence compared to Baseline (P < 0.05) are highlighted. Lower panel: Sensor‐level maps of differential coherence (Speech perception vs. Baseline) for Controls and Dyslexic readers in the two frequency bands of interest. Sensors showing significant difference in coherence are represented with asterisks.
Data Analysis: Source‐Level Analysis MEG Signal
The forward solution was based on the anatomical image (T1) of each individual participant. MRIs were segmented using Freesurfer software [Dale and Sereno, 1993; Fischl et al., 1999]. The forward model was based on a one‐shell boundary element model of the intracranial space. It was computed for three orthogonal directions of sources, which were placed on a 5 mm grid covering the whole brain using MNE suite (Martinos Center for Biomedical Imaging, Massachusetts, USA). For each source (three directions), the forward model was then reduced to its two principal components of highest singular value, which closely correspond to sources tangential to the skull. Dynamic Imaging of Coherent Sources [DICS, Gross et al., 2001] was used to identify brain areas showing relevant Speech perception synchronization. For integrating gradiometers and magnetometers in the source estimation, each sensor signal was normalized by its noise variance estimated from the continuous rest MEG data band‐passed through 1–195 Hz. The CSD matrix of MEG and the speech envelope signals was then computed for each frequency band of interest. Based on the forward model and the real part of the CSD matrix, brain coherence maps were produced using DICS algorithm [Gross et al., 2001], whose spatial filter matrix at frequency f and source position r is given by
where C(f) is the CSD matrix at frequency f, L(r) contains the solution of the forward problem for the two orthogonal tangential unit dipoles at position r; and a superscript T indicates the matrix transpose. A coherence “brain map” was obtained for each possible combination of participant and frequency band of interest.
A non‐linear transformation from individual MRIs to the standard Montreal Neurological Institute (MNI) brain was first computed using the spatial‐normalization algorithm implemented in Statistical Parametric Mapping (SPM8, Wellcome Department of Cognitive Neurology, London, UK). This was then applied to every individual coherence map.
Sources of Interest (SOIs, the source space analogous of sensors of interest) were identified for typical readers employing statistical parametrical mapping (SPM8) with a FDR corrected P < 0.05 threshold and both age and IQ of the participants as covariate. SOIs represented brain regions showing significantly higher coherence for the Speech perception compared to Baseline coherence for control participants. Within those SOIs (selected mask for further analyses), the between‐group comparison (controls vs. dyslexic readers, pFDR < 0.05) determined the grid points showing significant differential coherence values.
Data Analysis: Source‐Level Connectivity Analysis
Source selection for connectivity analysis was based on the spatial overlap between statistical brain maps of coherence (Speech perception vs. Baseline coherence for control participants) in the frequency band of interest and theoretically relevant regions identified by speech processing models [Hickok and Poeppel, 2007; Scott and Johnsrude, 2003]. For each SOI we determined the source seeds showing maximal Speech perception coherence value averaged over the frequency band of interest. As in the source level analysis, source time‐courses from these seeds were obtained with the DICS beamformer (see Formula above). The CSD matrix of MEG data (gradiometers and magnetometers) was calculated for each frequency of the band of interest and the real part of the resulting CSDs were averaged. Finally, a single time‐course was obtained for each source (which comprises two orthogonal tangential dipoles) by selecting the orientation of maximal power in the two‐dimensional space spanned by the pair of dipoles.
Effective connectivity analysis between source signals downsampled to 10 Hz was calculated during periods corresponding to sentence listening using partial direct coherence (PDC). The PDC determines a causal relationship between two signals in the frequency domain [Baccalá and Sameshima, 2001]. PDC is based on the Granger Causality principle (Granger, 1969) and on vector autoregressive (VAR) modeling of the data. The VAR model of order p for x is given by:
where s(t) = (s1(t),…,sm(t))T are the stationary M‐dimensional simultaneously measured source activity; are the M × M coefficient matrices of the model; and is a multivariate Gaussian white noise process. In our case, M = 5 since we calculated the connectivity network formed by five different sources. The model order p was selected with the Schwartz Information Criterion. This criterion selects the model order that optimizes the goodness of fit of the model, while introducing a penalty depending on the complexity of the model.
In the frequency domain the version of Granger‐causality is given by:
The first term of the difference refers to the identity matrix (M‐dimensional) and the second one to the Fourier transform of the VAR coefficients. Then, the PDC from the source j to source i is given by:
The PDC provides a measure of the linear directional coupling strength of on at frequency f. The PDC values vary between zero (no directional coupling) and one (perfect directional coupling). PDC analysis was performed using the Frequency‐Domain Multivariate Analysis toolbox (FDMa, Freiburg Center for Data Analysis and University of Freiburg, Germany) and the model order was computed using algorithms developed in Multivariate Autoregressive Model Fitting (ARfit) software package [Neumaier and Schneider, 2001; Schneider and Neumaier, 2001].
In the PDC analysis, the frequency resolution (Δf) depends on the model order and on the sampling frequency (Δf = Fs/p). The model order varied between participants (M(p) = 11.7, SD(p) = 2.5) while the sampling frequency was invariably 10 Hz. Consequently, PDC and coherence were evaluated with a different frequency resolution. To evaluate the PDC in the 0.5–1‐Hz frequency band, we used the value at the frequency bin closest to the center frequency of this frequency band [M(f) = 0.89 Hz, SD(f) = 0.18 Hz].
The significance of the directional coupling between nodes of the neural networks activated by speech listening in the frequency band of interest ‐ for each experimental group (control and dyslexic readers separately)—was assessed with FDR corrected statistics (age corrected). For each direction, PDC values obtained from Speech perception data were compared with those obtained from the Baseline data (resting state conditions). The same statistical analysis was employed for group comparison (control vs. dyslexic readers, age and IQ corrected). Connections showing significant differential coupling were further contrasted statistically for adults and children.
RESULTS
All participants (20 control and 20 dyslexic participants, half adults and half children in each group) listened to a set of 40 speech utterances of variable length. Their task was to answer a Yes/No comprehension question at the end of each sentence. The coherence between the envelope of speech signal and MEG signals was computed to identify the frequency bands at which neuronal oscillations synchronized with speech. For these frequency bands, we identified the brain regions in which synchronization was impaired for dyslexic participants compared to controls. Finally, we analyzed the effective connectivity between regions that could explain the differential speech‐brain coherence between control and dyslexic participants.
Behavioral Responses
Both control and dyslexic participants responded correctly to the comprehension questions, as illustrated by the high proportion of response hits in the two groups (control group: 0.95, SD: 0.05; dyslexic group: 0.97, SD: 0.03; t(19) = −1.13, P > 0.1, controlled the age of the participants and their IQ scores).
Sensor‐Level Analyses of Coherence
We first analyzed the coherence spectra (0.5 to 40 Hz frequency band) computed separately in the left and the right hemisphere for normal and dyslexic readers (Fig. 1, upper panels). In both groups, two bands of interest were identified in which coherence values were significantly higher for Speech perception than Baseline (i.e., the coherence computed for each participant between the speech signal and the MEG signal measured during resting state conditions). The first frequency band fell within the 0.5–1 Hz range (i.e. the low delta range, sensor‐level distribution in Figure 1, lower panels) and the second band within the 5.8–6.3 Hz range (theta, sensor‐level distribution in Figure 1, lower panels). In both coherence peaks the effect was larger for the right lateralized sensors (Fig. 1, upper panels) than the left lateralized sensors (Fig. 1, upper panels). In the delta band, the coherence in those sensors was higher for the controls than the dyslexic readers (P < 0.05). These analyses were further pursued at the brain‐level.
Source‐Level Analyses of Coherence
The two frequency bands of interest (0.5–1 Hz and 5.8–6.3 Hz) identified by the sensor‐level analyses were further investigated with source reconstruction to highlight the brain regions that show increased coherence for Speech perception compared to Baseline for typical readers.
In the delta band, typical readers revealed a bilateral brain network with a rightward asymmetry as already seen in the sensor‐level analyses (0.5–1 Hz; Fig. 2A). The set of brain regions whose oscillations synchronized with the speech in the delta band (pFDR < 0.05) were the right and the left auditory cortex (AC.R, AC.L), the right superior and middle temporal regions (Temp.R), the left superior temporal gyrus (Temp.L) and the left inferior frontal regions (IFG.L).
Figure 2.

Source level analysis f coherence. Panel A: Brain map (P‐values) showing significantly increased coherence (p FDR < 0.05, age corrected) for Speech perception compared to Baseline in the 0.5–1‐Hz frequency band and in the 5.8–6.3‐Hz frequency band for typical readers. B. Brain map showing significantly increased Speech perception coherence (pFDR < 0.05, age and IQ corrected) for control participants compared to dyslexic participants in the 0.5–1‐Hz frequency band (upper panel). Below the same analysis is reported, performed separately for Adults and Children.
In the theta band, source reconstruction for the same group revealed an effect (p FDR < 0.05) in right primary auditory areas, peaking in superior temporal regions (5.8–6.3 Hz; Fig. 2A). The present findings corroborate the sensor‐level analyses presented above (Fig. 1).
Group comparison (performed within the sources defined in controls, Figure 2A; importantly, similar results were obtained when the mask was defined based on all participants) revealed increased coherence at the source level for the control compared to the dyslexic participants in the lower frequency band (delta, p FDR < 0.05, including age of the participants and IQ as covariates, Figure 2B upper panel), while no difference emerged in the theta band. The reduced coherence in the delta range for dyslexic participants involved a subset of the brain regions identified above for the delta band: the AC.R (including a portion of the posterior superior temporal regions) and the pars opercularis of the IFG.L. In addition, to test whether these group differences were modulated by development, we carried out further analyses for the adults and the children. The comparison between controls and dyslexic readers in the adult group showed reduced coherence in right posterior temporal regions including the AC.R and the pars opercularis of the IFG.L for dyslexic readers (p FDR < 0.05, age and IQ corrected, Fig. 2B). The child groups showed exactly the same trend: reduced coherence for dyslexic readers in right posterior temporal regions including portions of the AC.R and in the posterior portion of the IFG.L largely overlapping with the pars opercularis (p FDR < 0.05, age and IQ corrected, Fig. 2B). Hence, the reduced speech‐brain synchronization in dyslexic readers compared to normal readers appears preserved through the development from childhood to adulthood.
Partial Direct Coherence
The following analyses focused on the group effect found in the delta band at the source level. The cross‐regional causal interactions within the network showing speech‐brain coherence in the delta band were first evaluated for dyslexic readers and controls, separately controlling for age (compared to the connectivity pattern extracted from the resting state MEG recordings, p FDR < 0.05). Following this analysis, a direct contrast between controls and dyslexic participants was performed.
Thus, we isolated a set of seed regions that synchronize with the delta frequency speech component within theoretically relevant brain regions: the left inferior frontal gyrus (IFG.L), bilateral temporal regions (Temp) and the primary auditory cortex bilaterally (AC) [in line with Hickok and Poeppel, 2007, Table 2].
Table 2.
MNI coordinates for the peaks of speech perception coherence in the 0.5–1 Hz delta frequency range for each of the sources of interest
| Hemisphere | Brain region | MNI coordinates | |||
|---|---|---|---|---|---|
| x | y | z | |||
| Right | Auditory cortex | AC.R | 65 | −42 | 18 |
| Temporal regions | Temp.R | 68 | −31 | −4 | |
| Left | Auditory cortex | AC.L | −59 | −42 | 19 |
| Temporal regions | Temp.L | −58 | 1 | −11 | |
| Inferior frontal region | IFG.L | −57 | 10 | 32 | |
Figure 3A depicts the connectivity pattern of the brain regions involved in processing of delta oscillations in speech for the control group. The control group's network presents a larger number of significant connections and stronger coupling between the five seeds than the dyslexic group's network (Fig. 3B). We characterized the activity of the two nodes that revealed reduced regional coherence, i.e., the AC.R and the IFG.L. In Table 3 we report the connectivity profiles of each node based on two graph theory indices, i.e., Degree and Strength [considered separately for inward and outward connections, Brain Connectivity Toolbox, Rubinov and Sporns, 2010]. “Degree” is the number of connections to the node; “Strength” is the sum of weights of the connections to the node.
Figure 3.

Partial direct coherence analysis. Network dynamics for control (panel A) and dyslexic participants (B) among the five seeds in the 0.5–1‐Hz frequency band (during Speech perception compared to Baseline) plotted on both connectivity graphs and dorsal views of the brain renderings. Arrow orientation represents the causal direction of the observed coupling; arrow color and thickness represent the statistical strength of the connection (P‐values). C: Left panel: Differential connection strength between control and dyslexic readers (pFDR < 0.05, age and IQ corrected). Right panel: Strength of RAC→LIFG connection (for dyslexic readers and their control peers) plotted separately for Adults and Children.
Table 3.
Functional network dynamics of the five seeds considered in the PDC analyses performed for the 0.5–1 Hz frequency band of interest for control and dyslexic readers
| Control group | Dyslexic group | |||||||
|---|---|---|---|---|---|---|---|---|
| IN‐degree | IN‐strength | OUT‐degree | OUT‐strength | IN‐degree | IN‐strength | OUT‐degree | OUT‐strength | |
| AC.R | 3 | 2.48 | 2 | 1.79 | 4 | 2.31 | 0 | 0 |
| Temp.R | 2 | 1.44 | 3 | 2.39 | 0 | 0 | 4 | 2.16 |
| AC.L | 3 | 2.24 | 3 | 2.02 | 1 | 0.67 | 1 | 0.56 |
| Temp.L | 1 | 1 | 4 | 2.87 | 1 | 0.57 | 1 | 0.64 |
| IFG.L | 3 | 1.91 | 0 | 0 | 1 | 0.33 | 1 | 0.52 |
Graph theory parameters (degree and strength) were separately computed for inward and outward connections. In bold values are highlighted the two seeds belonging to the brain regions showing differential regional coherence in delta band.
The AC.R has no outward connections and four inward connections in dyslexic readers, while the connectivity profile of the AC.R in controls is more balanced (see Degree values). Importantly, there is a pronounced difference between the two groups in the out‐Strength profile of the AC.R, which is higher for control (1.79) than dyslexic readers (0). This confirms that the AC.R in dyslexic participants is not properly sending outward information to the rest of the network. The IFG.L has three inward connections and no outward connections in controls, while its connectivity profile in dyslexic readers is restrained to a single inward and outward connection. The main group difference for the IFG.L resides in the inward strength profile of this region, which is higher for controls (1.91) compared to dyslexic participants (0.33). This suggests that the collection of information from other regions of the network by the IFG.L is operating more efficiently in the control than the dyslexic readers.
After unraveling the brain network showing speech‐neural entrainment in each group separately, we directly contrasted the causal dynamics between the control and the dyslexic groups. Statistical comparison between the networks of the two groups (pFDR < 0.05, age and IQ corrected, Fig. 3C) revealed that dyslexic participants had significantly reduced connectivity between the AC.R and the IFG.L compared to controls (red arrow for controls in Fig. 3C). This connectivity impairment in the dyslexic group was in the feedforward direction from the AC.R to the IFG.L (AC.R→IFG.L). This group differential strength of connectivity was reliable for both adults and children, as represented in the histogram in Figure 3C (P < 0.05 for both comparisons, age and IQ corrected).
Correlations Between Reading, Phonology and Neural Oscillations During Speech Perception
We considered MEG coherence (individual delta coherence values for AC.R and IFG.L) and inter‐regional coupling (AC.R→IFG.L connectivity values) effects. We computed robust correlations [Pernet et al., 2013] between these physiological measures and the performance of each participant in reading and phonological tasks. Robust correlations (skipped Spearman rho) down‐weight the role of outlier data, providing a better estimate of the true association with accurate false positive control and without loss of power. Table 4 presents the correlation values involving the measures, revealing significant group differences in reading (z scores reflecting time values on the word and pseudoword reading lists) and phonological processing (accuracy in the phonological short‐term memory task, phoneme deletion accuracy and the average time required to perform the RAN tasks). We evaluated these correlations independently for each group (control and dyslexic participants) correcting the P‐values for multiple comparisons within each group (one‐tailed probability FDR corrected). Significant correlations were further tested with partial correlations controlling for both the chronological age (Table 1) and IQ (given the group difference reported in Table 1).
Table 4.
Correlations (Spearman Skipped rho indices) between behavioral (reading and phonological abilities) and physiological measures (local and inter‐regional directed coherence) separately for the dyslexic and control group
| RAC Coh | LIFG Coh | RAC‐to‐LIFG coupling | |
|---|---|---|---|
| Control group | |||
| Word Reading Time (z score) | 0.14 | 0.31 | 0.03 |
| Pseudoword Reading Time (z score) | 0.06 | −0.12 | −0.22 |
| Pseudoword repetition (%) | 0.12 | −0.07 | 0.08 |
| Phonemic deletion (%) | 0.35 | 0.32 | 0.06 |
| RAN (z score) | −0.04 | 0.19 | 0.04 |
| Dyslexic group | |||
| Word Reading Time (z score) | −0.11 | 0.43 | −0.02 |
| Pseudoword Reading Time (z score) | −0.23 | 0.04 | 0.14 |
| Pseudoword repetition (%) | 0.16 | −0.22 | −0.07 |
| Phonemic deletion (%) | −0.20 | 0.27 | 0.41 |
| RAN (z score) | −0.05 | −0.22 | −0.17 |
Bold values represent statistically significant effects (one‐tailed, FDR corrected within groups).
In the control group no significant correlation emerged. In the dyslexic group, word reading time (positive z‐scores reflect faster reading times) was significantly related to the regional coherence observed in the IFG.L (r = 0.43, P < 0.05, plotted in Fig. 4A). Partial correlations confirmed this relation (r = 0.44, P < 0.05). Within the same group, the AC.R→IFG.L connectivity strength positively correlated with accuracy measures in the phoneme deletion task (r = 0.41, P < 0.05, plotted in Fig. 4B). Partial correlations further confirmed this positive relation (r = 0.43, P < 0.05). To sum up, correlation analyses point to a relationship between (i) IFG.L coherence and reading and between (ii) AC.R→IFG.L coupling and phonological awareness.
Figure 4.

Robust correlations between speech–MEG coupling and behavioral assessments. Panel A: Correlation plot (and regression line) involving LIFG coherence values and z scores of word reading time for dyslexic readers. B: Correlation plot (and regression line) involving accuracy in the phonemic deletion task and RAC→LIFG connection strength for dyslexic readers.
DISCUSSION
Reading disorders in dyslexia have been associated with a deficit in encoding phonetic and phonological information in speech streams [Goswami, 2011; Ramus and Szenkovits, 2008]. The present study provides, for the first time, evidence that both abnormal neural entrainment of the speech perception network to natural speech signals and the consequently impaired connectivity within this network are associated with the phonological disorders in dyslexia.
The reduced coherence values we observed for the dyslexic group compared to the control group emerged in a low‐frequency speech component (delta, 0.5–1 Hz). This confirms that neural entrainment to the delta band component of the speech signal (speech envelope in the 0.5–4 Hz spectral domain) is relevant for speech recognition [Ding et al., 2013; Ghitza, 2011; Poeppel et al., 2008]. Our results showing reduced auditory entrainment in the delta band for both adults and children with developmental dyslexia align with others reporting impaired processing of low‐frequency spectral fluctuations in dyslexic adults [Hamalainen et al., 2012; Lizarazu et al., 2015] and in children with poor reading skills [Abrams et al., 2009; Lizarazu et al., 2015].
We also observed an extended brain network sensitive to the speech envelope in typical readers, involving peaks of activity in the auditory cortex [AC.R, Bourguignon et al., 2013] and middle temporal regions (Temp.R) of the right hemisphere. In the left hemisphere, significant coherence values were evident in the auditory cortex (AC.L), anterior temporal regions (Temp.L) and in the pars opercularis of the IFG (IFG.L, see MNI coordinates of peaks of coherence in Table 2). This regional pattern is in line with the speech processing brain network discussed by Giraud and Poeppel [2012]. Interestingly, in this cortical network, dyslexic participants presented reduced coherence in the AC.R and in the IFG.L compared to typical readers. In the asymmetric sampling models [discussed by Giraud and Poeppel, 2012; Poeppel et al., 2008], cytoarchitectonic differences between the two auditory cortices would cause entrainment in the AC.R to be mainly dominated by low‐frequency oscillations (<10 Hz). Such low‐frequency oscillations would serve as a chunking mechanism to properly sample high‐frequency (phonemic) information from the auditory signal [Giraud and Poeppel, 2012; Gross et al., 2013; Park et al., 2015]. The successful coupling of low and high frequency speech signals would then provide the input for further language‐related processes in higher‐order regions [Hickok and Poeppel, 2007; Poeppel et al., 2008]. The impaired entrainment to low‐frequency in the AC.R in our dyslexic participants is consistent with the hypothesis that identifies the source of their phonological and reading problems in their entrainment to slow speech oscillatory components [Goswami, 2002]. This would, in turn, impair the binding between these low frequency speech contours and high frequency phonemic information [Gross et al., 2013; Goswami, 2011]. Abnormal development of the right auditory cortex in dyslexia could undermine the capacity of this region to track low frequency audio modulations [Giraud and Ramus, 2013]. Studies of the postmortem human brain showed pro‐left asymmetries in the size of the planum temporale in approximately 70% of adults and infants [Geschwind and Levitsky, 1968; Witelson and Pappiel, 1973]. Interestingly, these asymmetries in auditory regions contribute to reading abilities in children [Eckert and Leonard, 2003]. Moreover, the seminal studies by Galaburda [1989] and Galaburda et al., [1985] showed an anatomical symmetry of the auditory regions in dyslexia, due to an enlarged planum in the right hemisphere in dyslexic individuals.
The IFG.L also showed reduced coherence at the delta frequency band for the dyslexic group compared to the control group. In contrast to the AC.R, the left frontal region is involved in higher‐order computations, such as predictive processing of speech information [Hickok and Poeppel, 2007; Park et al., 2015]. Speech entrainment in this region may contribute to reading in dyslexics, as suggested by the significant correlation between the regional IFG.L coherence and the word reading speed in our dyslexic group (however, since it did not correlate with reading skills in normal readers it might not represent a general mechanism). Accordingly, a large number of studies have reported the left inferior frontal cortex as contributing to phonological disorders in dyslexia [Kovelman et al., 2012; MacSweeney et al., 2009], and some researchers have advanced the hypothesis that this region could be part of a larger brain network presenting abnormal functionality in dyslexic readers [Boets et al., 2013; Lallier et al., 2013; Vandermosten et al., 2012].
Effective connectivity analyses allow us to disentangle between whether the abnormal IFG.L activity in our dyslexic participants has back‐propagated to the input auditory regions and caused the reduced coherence reported in the AC.R [cf. Boets et al., 2013], or, conversely, whether the reduced coherence in the AC.R causes the low coherence in the IFG.L [cf. Goswami, 2011]. Our data support the second scenario (reduced AC.R→IFG.L connectivity). This result is in line with the auditory temporal sampling hypothesis [Goswami, 2011]. The reduced connectivity found in our dyslexic participants may be caused by the fact that the AC.R does not properly entrain with low‐frequency oscillatory components of the speech input. This effect would determine a chain reaction that affects all of the processing steps that followed, i.e., hampering the communication towards the IFG.L, thus impairing the oscillatory activity in the IFG.L itself. This conclusion is supported by studies reporting similar auditory entrainment effects with non‐speech steady oscillatory signals (amplitude modulated white noise), showing abnormal phase synchronization for both low [Hamalainen et al., 2012] and high [Lehongre et al., 2011; Lizarazu et al., 2015] frequency oscillations exclusively in the auditory cortices of dyslexic participants.
From the anatomical point of view, this connection would be supported by first, the inter‐hemispheric projections through the splenium of the corpus callusum [Vandermosten et al., 2013] and then, long‐distance left‐sided temporal‐frontal white matter tracts such as the left arcuate fasciculus [Saygin et al., 2013; Vandermosten et al., 2012, 2013]. This latter temporal‐frontal projection supports the bi‐directional communication (both feedforward and top‐down) between anterior and posterior language regions. A number of studies have observed reduced white matter volume in dyslexic readers compared to healthy controls [Saygin et al., 2013; Vandermosten et al., 2012, 2013]. Vandermosten et al., [2012] reported a significant relation between phonological awareness and the integrity of the left arcuate fasciculus. In our study, phonological awareness positively correlated with the strength of AC.R→IFG.L feedforward functional coupling in the dyslexic group. Thus, it is possible that the integrity of the left arcuate fasciculus (possibly more so than the integrity of inter‐hemispheric callosal auditory projections) contributed to the defective feedforward functional connectivity that we observed. It should be noted, however, that previous studies [Boets et al., 2013] did not report any relation between the integrity of the arcuate fasciculus and left frontal‐temporal coupling measured with fMRI in dyslexia.
It could be argued that the group effect we report is due to reading experience: because dyslexic participants read less, they train less their speech network. One way to address this issue is to compare dyslexic adults with a reading‐matched control, i.e., the control children: interestingly, dyslexic adults present similar word reading skills as control children but worse phonological proficiency (as evidenced by pseudoword reading, pseudoword repetition and phonemic deletion, Table 1). Neurophysiological speech processing data go in the same direction, showing stronger AC.R→IFG.L connectivity for the control children than for the dyslexic adults (Fig. 3C). This suggests that reading experience does not interact with the impairment in the low‐frequency acoustic entrainment here observed.
Boets et al. [2013] also reported impaired functional connectivity within the phonological processing network of dyslexic readers. They observed reduced coupling between the left inferior frontal cortex and both the right auditory cortex and the left superior temporal gyrus. They argue for the impaired access hypothesis [Boets, 2014; Ramus, 2014; Ramus and Szenkovits, 2008], since they assume an impaired feedback flow of information from inferior frontal to bilateral primary auditory regions [see Fig. 1 in Ramus, 2014]. However, because of methodological constraints, their study does not allow them to evaluate the directionality of the impaired (frontal‐temporal) connectivity found in their dyslexic group. Conversely, our effective connectivity data involving the AC.R do not support the hypothesis of a deficit in feedback access to phonological representations in the auditory regions of the right hemisphere by the IFG.L [see also Park et al., 2015].
Moreover, we did not find evidence for an impaired coupling between the IFG.L and the ipsilateral posterior temporal regions, as reported by Boets et al. [2013] in dyslexia. The definition of the delta speech‐brain brain network in the present study highlighted a significant effect in the primary auditory regions (AC.L, Fig. 2A), but no effect in higher order associative auditory regions in the left posterior temporal cortex [part of the phonological network, Giraud and Poeppel, 2012; Fontolan et al., 2014] as in Boets et al. [2013]. Crucially, Park et al. [2015] recently reported MEG evidence of top‐down coupling in the delta band between left frontal regions and the left superior temporal gyrus (beyond the AC.L considered in the present study) during continuous speech in a healthy population. These data were taken as evidence of dynamically updated predictions of incoming auditory information based on low‐frequency speech information. Interestingly, they reported that slow oscillatory activity in left auditory cortex was also constrained by similar low frequency oscillations in posterior right temporal regions. In addition, no top‐down signals constrained low‐frequency entrainment in the right auditory cortex [Park et al., 2015].
It is possible that in dyslexic readers, the IFG.L does not properly control in a top‐down fashion the synchronization with the left superior temporal regions in the delta band. We hypothesize that while the functional frontal‐to‐temporal coupling [identified by Park et al., 2015] might function properly in dyslexia, the information arriving to the left frontal regions could already be defective. The consequence of such defective input could be the reduced ipsilateral left frontal‐to‐temporal coupling observed by Boets et al. [2013].
In brief, for typical readers, low‐frequency entrainment in the AC.R (driven by prosodic speech contours) would provide chunking cues that parse the speech signal and then facilitate efficient sampling of high frequency oscillatory speech information by the IFG.L. This would constrain the cross‐frequency coupling [hierarchically involving delta‐theta and theta‐gamma oscillations as observed in Gross et al., 2013] of low and high frequency speech information obtained through the interaction between left frontal and posterior superior temporal regions. Successful matching would allow the phonological interpretation of the information processed in posterior temporal regions. Impaired entrainment to prosodic speech contours in the AC.R in dyslexic readers would hinder the following processing steps that we just described. It is possible that the damaged input arriving to the IFG.L (due to the defective incoming information from the AC.R) alters the acquisition of proper phonological processing, thus affecting the ability to identify and manipulate the sounds of the language stored in left posterior temporal regions and, possibly, consequently affecting reading acquisition. Thus, the overall picture would still support the auditory temporal sampling hypothesis [Goswami, 2011]. Also, based on this hypothesis, the cross‐frequency interactions reported by Gross et al. (2013: delta‐theta and theta‐gamma phase amplitude coupling) should not necessarily be affected per se in dyslexia. Atypical delta entrainment in dyslexia could in fact affect higher frequency oscillations just because the delta band is the first level within the hierarchical coupling. We are now working to evaluate this hypothesis.
Overall, the present study provides the first evidence of impaired connectivity from the AC.R to the IFG.L in dyslexia. Our data support the hypothesis that the phonological deficit in dyslexia is subtended by an auditory deficit in neural entrainment to the low‐frequency prosodic contours of the speech signal [Goswami, 2011]. This out‐of‐synchrony sampling in the AC.R would then hinder the following phonological processing steps, possibly engendering a problem when matching contour (low‐frequency speech signals) and content (high‐frequency speech signals). This phenomenon has the strong potential to cause severe consequences for both reading and phonological skills that are monitored by left‐hemisphere higher‐level processing regions in the speech processing hierarchy.
N.M., M.Li., and M.La. contributed equally to this work. We are grateful to Fernando Cuetos and Paz Suárez‐Coalla for support on contacting the participants. We would also like to thank Margaret Gillon‐Dowens, Peter Boddy and Luke Armstrong for comments on previous versions of the manuscript and to all the families taking part in the study.
Correction added on 9 May 2016, after first online publication.
REFERENCES
- Abrams DA, Nicol T, Zecker S, Kraus N (2009): Abnormal cortical processing of the syllable rate of speech in poor readers. J Neurosci 29:7686–7693. [DOI] [PMC free article] [PubMed] [Google Scholar]
- Baccalá L, Sameshima K (2001): Partial directed coherence: A new concept in neural structure determination. BiolCybern 84:463–474. [DOI] [PubMed] [Google Scholar]
- Boets B, Op de Beeck HP, Vandermosten M, Scott SK, Gillebert CR, Mantini D, Bulthé J, Sunaert S, Wouters J, Ghesquiére P (2013): Intact but less accessible phonetic representations in adults with dyslexia. Science 342:1251–1254. [DOI] [PMC free article] [PubMed] [Google Scholar]
- Boets B (2014): Dyslexia: Reconciling controversies within an integrative developmental perspective. Trends CognSci 18:501–503. [DOI] [PubMed] [Google Scholar]
- Bortel R, Sovka P (2007): Approximation of statistical distribution of magnitude squared coherence estimated with segment overlapping. Signal Process 87:1100–1117. [Google Scholar]
- Bourguignon M, De Tiége X, de Beeck MO, Ligot N, Paquier P, Van Bogaert P, Goldman S, Hari R, Jousmaki V (2013): The pace of prosodic phrasing couples the listener's cortex to the reader's voice. Hum Brain Mapp 34:314–326. [DOI] [PMC free article] [PubMed] [Google Scholar]
- Cuetos F, Rodriguez B, Ruano E, Arribas D (2009): Bateria De Evaluacion De Los Procesos Lectores, Revisada. Madrid: TEA Ediciones, S.A. [Google Scholar]
- Dale AM, Sereno MI (1993): Improved localization of cortical activity by combining EEG and MEG with MRI cortical surface reconstruction: A linear approach. J CognNeurosci 5:162–176. [DOI] [PubMed] [Google Scholar]
- Ding N, Chatterjee M, Simon JZ (2013): Robust cortical entrainment to the speech envelope relies on the spectro‐temporal fine structure. Neuroimage 88:41–46. [DOI] [PMC free article] [PubMed] [Google Scholar]
- Drullman R, Festen JM, Plomp R (1994): Effect of temporal envelope smearing on speech reception. J AcoustSoc Am 95:1053–1064. [DOI] [PubMed] [Google Scholar]
- Eckert MA, Leonard CM (2003): Developmental disorders: Dyslexia In: Hugdahl K, Davidson R, editors. Brain Asymmetry. Cambridge MA: MIT Press. [Google Scholar]
- Fischl B, Sereno MI, Dale AM (1999): Cortical surface‐based analysis. II: Inflation, flattening, and a surface‐based coordinate system. Neuroimage 9:195–207. [DOI] [PubMed] [Google Scholar]
- Fontolan L, Morillon B, Liegeois‐Chauvel C, Giraud AL (2014): The contribution of frequency‐specific activity to hierarchical information processing in the human auditory cortex. Nat Commun 5:4694. [DOI] [PMC free article] [PubMed] [Google Scholar]
- Froyen DJW, Bonte ML, van Atteveldt N, Blomert L (2009): The long road to automation: Neurocognitive development of letter–speech sound processing. J Cogn Neurol 21:567–580. doi: 10.1162/jocn.2009.21061 [DOI] [PubMed] [Google Scholar]
- Galaburda AM (1989): Ordinary and extraordinary brain development: Anatomical variation in developmental dyslexia. Ann Dyslexia 39:67–79. [DOI] [PubMed] [Google Scholar]
- Galaburda AM, Sherman GF, Rosen GD, Aboitiz F, Geschwind N (1985): Developmental dyslexia: Four consecutive patients with cortical anomalies. Ann Neurol 18:222–233. [DOI] [PubMed] [Google Scholar]
- Geschwind N, Levitsky W (1968): Human brain: Left‐right asymmetries in temporal speech region. Science 161:186–187. [DOI] [PubMed] [Google Scholar]
- Ghitza O (2011): Linking speech perception and neurophysiology: Speech decoding guided by cascaded oscillators locked to the input rhythm. Front Psychol 2:130. doi: 10.3389/fpsyg.2011.00130 [DOI] [PMC free article] [PubMed] [Google Scholar]
- Giraud AL, Poeppel D (2012): Cortical oscillations and speech processing: Emerging computational principles and operations. Nat Neurosci 15:511–517. [DOI] [PMC free article] [PubMed] [Google Scholar]
- Giraud AL, Ramus F (2013): Neurogenetics and auditory processing in developmental dyslexia. Curr Opin Neurobiol 23:37–42. [DOI] [PubMed] [Google Scholar]
- Goswami U (2002): Phonology, reading development and dyslexia: A cross‐linguistic perspective. Ann Dyslexia 52:1–23. [Google Scholar]
- Goswami U (2011): A temporal sampling framework for developmental dyslexia. Trends CognSci 15:3–10. [DOI] [PubMed] [Google Scholar]
- Goswami U, Huss M, Mead N, Fosker T, Verney JP (2013): Perception of patterns of musical beat distribution in phonological developmental dyslexia: Significant longitudinal relations with word reading and reading comprehension. Cortex 49:1363–1376. [DOI] [PubMed] [Google Scholar]
- Granger CWJ (1969): Investigating causal relations by econometric models and cross‐spectral methods. Econometrica 37:424–438. [Google Scholar]
- Gross J, Kujala J, Hamalainen M, Timmermann L, Schnitzler A, Salmelin R (2001): Dynamic imaging of coherent sources: Studying neural interactions in the human brain. Proc Natl Acad Sci U S A 98:694–699. [DOI] [PMC free article] [PubMed] [Google Scholar]
- Gross J, Hoogenboom N, Thut G, Schyns P, Panzeri S, Belin P, Garrod S (2013): Speech rhythms and multiplexed oscillatory sensory coding in the human brain. PLOS Biol 11:1–14. [DOI] [PMC free article] [PubMed] [Google Scholar]
- Halliday DM, Rosenberg JR, Amjad AM, Breeze P, Conway BA, Farmer SF (1995): A framework for the analysis of mixed time series/point process data. Prog Biophys Mol Biol 64:237–278. [DOI] [PubMed] [Google Scholar]
- Hamalainen JA, Rupp A, Soltesz F, Szucs D, Goswami U (2012): Reduced phase locking to slow amplitude modulation in adults with dyslexia: An MEG study. Neuroimage 59:2952–2961. [DOI] [PubMed] [Google Scholar]
- Hickok G, Poeppel D (2007): The cortical organization of speech processing. Nat Rev Neurosci 8:393–402. [DOI] [PubMed] [Google Scholar]
- Kovelman I, Norton ES, Christodoulou JA, Gaab N, Lieberman DA, Triantafyllou C, Wolf M, Whitfield‐Gabrieli S, Gabrieli JD (2012): Brain basis of phonological awareness for spoken language in children and its disruption in dyslexia. Cereb Cortex 22:754–764. [DOI] [PMC free article] [PubMed] [Google Scholar]
- Lallier M, Thierry G, Tainturier MJ (2013): On the importance of considering individual profiles when investigating the role of auditory sequential deficits in developmental dyslexia. Cognition 126:121–127. [DOI] [PubMed] [Google Scholar]
- Lehongre K, Ramus F, Villiermet N, Schwartz D, Giraud AL (2011): Altered low‐gamma sampling in auditory cortex accounts for the three main facets of dyslexia. Neuron 72:1080–1090. [DOI] [PubMed] [Google Scholar]
- Lehongre K, Morillon B, Giraud AL, Ramus F (2013): Impaired auditory sampling in dyslexia: Further evidence from combined fMRI and EEG. Front Hum Neurosci 7:454. doi: 10.3389/fnhum.2013.00454 [DOI] [PMC free article] [PubMed] [Google Scholar]
- Lizarazu M, Lallier M, Molinaro N, Bourguignon M, Paz‐Alonso P, Lerma‐Usabiaga G, Carreiras M (2015): Developmental evaluation of atypical auditory sampling in dyslexia: Functional and structural evidence. Hum Brain Mapp 36:4986–5002. [DOI] [PMC free article] [PubMed] [Google Scholar]
- MacSweeney M, Brammer MJ, Waters D, Goswami U (2009): Enhanced activation of the left inferior frontal gyrus in deaf and dyslexic adults during rhyming. Brain 132:1928–1940. [DOI] [PMC free article] [PubMed] [Google Scholar]
- Magnotta VA, Andreasen NC, Schultz SK, Harris G, Cizadlo T, Heckel D, Nopoulos P, Flaum M (1999): Quantitative in vivo measurement of gyrification in the human brain: Changes associated with aging. Cereb Cortex 9:151–160. [DOI] [PubMed] [Google Scholar]
- Neumaier A, Schneider T (2001): Estimation of parameters and eigenmodes of multivariate autoregressive models. Trans Math Software 27:27–57. [Google Scholar]
- Nichols TE, Holmes AP (2001): Non‐parametric permutation tests for functional neuroimaging: A Primer with examples. Hum Brain Mapp 15:1–25. [DOI] [PMC free article] [PubMed] [Google Scholar]
- Park H, Ince AAR, Schyns P, Thut G, Gross J (2015): Frontal top‐down signals increase coupling of auditory low‐frequency oscillations to continuous speech in human listeners. CurrBiol 25:1649–1653. [DOI] [PMC free article] [PubMed] [Google Scholar]
- Paulesu E, Frith U, Snowling M, Gallagher A, Morton J, Frackowiak RS, Frith CD (1996): Is developmental dyslexia a disconnection syndrome? Evidence from PET scanning. Brain 119:143–157. [DOI] [PubMed] [Google Scholar]
- Pernet CR, Wilcox R, Rousselet GA (2013): Robust correlation analyses: False positive and power validation using a new open source Matlab toolbox. Front Psychology 3:606. [DOI] [PMC free article] [PubMed] [Google Scholar]
- Poeppel D, Idsardi WJ, van Wassenhove V (2008): Speech perception at the interface of neurobiology and linguistics. Philos Trans R Soc Lond B Biol Sci 363:1071–1086. [DOI] [PMC free article] [PubMed] [Google Scholar]
- Power AJ, Mead N, Barnes L, Goswami U (2013): Neural entrainment to rhythmic speech in children with developmental dyslexia. Front Hum Neurosci 7:777. [DOI] [PMC free article] [PubMed] [Google Scholar]
- Ramus F, Szenkovits G (2008): What phonological deficit? Q J ExpPsychol 61:129–141. [DOI] [PubMed] [Google Scholar]
- Ramus F (2014): Neuroimaging sheds new light on the phonological deficit in dyslexia. Trends CognSci 18:274–275. [DOI] [PubMed] [Google Scholar]
- Rubinov M, Sporns O (2010): Complex network measures of brain connectivity: Uses and interpretations. NeuroImage 52:1059–1069. [DOI] [PubMed] [Google Scholar]
- Saygin ZM, Norton ES, Osher DE, Beach SD, Cyr AB, Ozernov-Palchik O, Yendiki A, Fischl B, Gaab N, Gabrieli JD (2013): Tracking the roots of reading ability: White matter volume and integrity correlate with phonological awareness in prereading and early‐reading kindergarten children. J Neurol 33:13251–13258. [DOI] [PMC free article] [PubMed] [Google Scholar]
- Schneider T, Neumaier A (2001): ARfit—A Matlab package for the estimation of parameters and eigenmodes of multivariate autoregressive models. Trans Math Software 27:58–65. [Google Scholar]
- Scott SK, Johnsrude IS (2003): The neuroanatomical and functional organization of speech perception. Trends Neurosci 26:100–107. [DOI] [PubMed] [Google Scholar]
- Shaw P, Kabani NJ, Lerch JP, Eckstrand K, Lenroot R, Gogtay N, Greenstein D, Clasen L, Evans A, Rapoport JL, Giedd JN, Wise SP (2008): Neurodevelopmental trajectories of the human cerebral cortex. J Neurosci 28:3586–3594. [DOI] [PMC free article] [PubMed] [Google Scholar]
- Snowling MJ (1981): Phonemic deficits in developmental dyslexia. Psychol Res 43:219–234. [DOI] [PubMed] [Google Scholar]
- Snowling MJ (2008): Specific disorders and broader phenotypes: The case of dyslexia. Q J ExpPsychol 61:142–156. [DOI] [PubMed] [Google Scholar]
- Taulu S, Simola J, Kajola M (2005): Applications of the signal space separation method. IEEE Trans Signal Process 53:3359–3372. [Google Scholar]
- Vandermosten M, Boets B, Poelmans H, Sunaert S, Wouters J, Ghesquière P (2012): A tractography study in dyslexia: Neuroanatomic correlates of orthographic, phonological and speech processing. Brain 135:935–948. [DOI] [PubMed] [Google Scholar]
- Vandermosten M, Poelmans H, Sunaert S, Ghesquière P, Wouters J (2013): White matter lateralization and interhemispheric coherence to auditory modulations in normal reading and dyslexic adults. Neuropsychologia 51:2087–2099. [DOI] [PubMed] [Google Scholar]
- Wagner RK, Torgesen JK, Rashotte CA (1999): Comprehensive Test of Phonological Processing (CTOPP). Austin, TX: Pro‐Ed. [Google Scholar]
- Witelson S, Pappiel W (1973): Left hemisphere specialization for language in newborn: Neuroanatomical evidence of asymmetry. Brain 96:641–646. [DOI] [PubMed] [Google Scholar]