

Abstract
Catechol‐O‐methyltransferase (COMT), located on chromosome 22q11.2, encodes an enzyme critical for dopamine flux in the prefrontal cortex. Genetic variants of COMT have been suggested to functionally manipulate prefrontal morphology and function in healthy adults. This study aims to investigate modulative roles of individuals COMT SNPs (rs737865, val158met, rs165599) and its haplotypes in age‐related brain morphology using an Asian sample with 174 adults aged from 21 to 80 years. We showed an age‐related decline in cortical thickness of the dorsal visual pathway, including the left dorsolateral prefrontal cortex, bilateral angular gyrus, right superior frontal cortex, and age‐related shape compression in the basal ganglia as a function of the genotypes of the individual COMT SNPs, especially COMT val158met. Using haplotype trend regression analysis, COMT haplotype probabilities were estimated and further revealed an age‐related decline in cortical thickness in the default mode network (DMN), including the posterior cingulate, precuneus, supramarginal and paracentral cortex, and the ventral visual system, including the occipital cortex and left inferior temporal cortex, as a function of the COMT haplotype. Our results provided new evidence on an antagonistic pleiotropic effect in COMT, suggesting that genetically programmed neural benefits in early life may have a potential bearing towards neural susceptibility in later life. Hum Brain Mapp 37:2068–2082, 2016. © 2016 Wiley Periodicals, Inc.
Keywords: aging, cortical thickness, genetic variant, haplotype, subcortical shape, diffeomorphic mapping
Abbreviations
- AG
Angular gyrus
- CAL
Calcarine sulcus
- COMT
Catechol‐O‐methyltransferase
- CSF
Cerebral spinal fluid
- DMN
Default mode network
- ITC
Inferior temporal cortex
- LDDMM
Large deformation diffeomorphic metric mapping
- MAF
Minor allele frequencies
- MMSE
Mini‐mental state examination
- MPRAGE
Magnetization prepared rapid gradient recalled echo
- MTG
Middle temporal gyrus
- OCC
Occipital
- OFC
Orbitofrontal cortex
- PCC
Posterior cingulate cortex
- PCUN
Precuneus
- SFC
Superior frontal cortex
- SMG
Supramarginal gyrus
- SNP
Single nucleotide polymorphism
INTRODUCTION
Converging data from structural imaging studies suggests that aberrant brain morphology plays an important role in explaining the pathophysiology of aging. For instance, a considerable age‐dependent reduction in hippocampal volumes has been identified as a hallmark of aging [Allen et al., 2005; Geerligs et al., 2014; Goodro et al., 2012; Jernigan et al., 2001; Pruessner et al., 2001; Raz et al., 2010; Scahill et al., 2003; Zhu et al., 2008]. Normal aging is also characterized by prominent cortical thinning in the prefrontal cortex and sparse cortical thinning in the temporal, parietal, and occipital cortices, suggesting an anterior‐to‐posterior gradient of decline in aging [Fjell et al., 2009; Lemaitre et al., 2012; Raz, 2000; Raz et al., 2004; Salat et al., 2004; Wang et al., 2008].
Genetic variants also contribute the variation of hippocampal and subcortical volumes, suggested by several large scale imaging genetic studies [Bis et al., 2011; Hibar et al., 2015]. We hence expect that the association of age and brain morphology might be contingent upon genetic variants [Panizzon et al., 2009; Peper et al., 2007; Thompson et al., 2001]. Catechol‐O‐methyltransferase (COMT), located on chromosome 22q11.2, is well expressed in the brain throughout the cortex, basal ganglia, amygdala etc. COMT is a major enzyme degrading catecholamine, especially dopamine [Mier et al., 2010]. Its functional single nucleotide polymorphism (SNP), COMT val158met, results in the amino acid substitution of valine (val) with methionine (met) at position 158 of COMT [Bray et al., 2003]. The val allele is suggested to determine higher COMT activity in the prefrontal cortex, which presumably leads to lower synaptic dopamine levels through enhanced degradation [Chen et al., 2004]. Thus, COMT has received great attention for understanding how its genetic variants may functionally interact with the brain morphology and function in healthy adults [Aguilera et al., 2008; Cerasa et al., 2008; Dennis et al., 2010b; Diaz‐Asper et al., 2008; Egan et al., 2001; Ehrlich et al., 2010; Honea et al., 2009a; Liao et al., 2009; Papenberg et al., 2014; Sannino et al., 2014; Tunbridge et al., 2004]. By far, studies involving young healthy adults have found that val homozygous showed greater gray matter volumes in the dorsolateral prefrontal cortex (dlPFC), cingulate, temporal and superior parietal lobes as compared to met allele carriers [Cerasa et al., 2008; Dumontheil et al., 2011; Honea et al., 2009a; Raznahan et al., 2011; Rowe et al., 2010]. Nevertheless, one would expect the smaller volumes in the aforementioned brain regions in young adults with val alleles, as val carriers have showed greater enzymatic activity and led greater dopamine degradation when compared to met homozygotes. Together, these could imply that val alleles confer neural benefits for the brain development during early adulthood. There are lack of studies that characterize the alterations in brain morphology due to the genotypes of COMT val158met across lifespan. It hence remains unclear whether val alleles would accelerate neurodegeneration in old adults in comparisons with met alleles.
In addition to COMT val158met, sequence variants lying in other loci within the COMT gene affect gene function, ultimately resulting in altered enzyme activity and adding complexity to the functional implications of COMT variations [Gothelf et al., 2014]. The 3‐SNP haplotype of COMT [upstream SNP in intro 1 (rs737865)‐val158met‐ downstream SNP in the 3’ untranslated region (rs165599)] has been found to alter the COMT expression in the human brain tissue [Bray et al., 2003], suggesting the importance of complex interactions of functional variations in COMT on the human brain. Both rs737865 and rs165599 were found to modulate cognitive functions, such as visuospatial memory, attention [Diaz‐Asper et al., 2008; Xia et al., 2012]. A landmark study has showed stronger statistical power for examining the association between prefrontal responses to working memory and the COMT haplotype than individual COMT SNPs [Meyer‐Lindenberg et al., 2006], suggesting the advantage to using haplotypes over single SNPs to capture the epistastic interactions among the COMT SNPs and hence improve statistical power over the analysis of single SNPs [Lorenz et al., 2010].
In this study, we aimed to examine whether individual COMT SNPs (rs737865, val158met, rs165599) and its haplotype module age effects on subcortical shapes and cortical thickness using a large Chinese sample comprised of adults aged from 21 years and above. We examined the subcortical shapes and group analysis of cortical thickness using an advanced brain mapping technique, large deformation diffeomorphic metric mapping (LDDMM) [Miller and Qiu, 2009]. We predicted that individual SNPs of the COMT gene (rs737865, val158met, and rs165599) would modulate the associations between age and the brain morphology, particularly in dopamine enriched regions, such as the prefrontal cortex and basal ganglia. In conjuction with the previous studies on the brain morphology in young adults [Cerasa et al., 2008; Dumontheil et al., 2011; Honea et al., 2009a; Raznahan et al., 2011; Rowe et al., 2010], our study provided new evidence of effects of COMT SNPs on brain morphology in older adults. We expected effects of COMT on the brain morphology in older adults opposite to those seen in young adults as reported in previous studies [Cerasa et al., 2008; Dumontheil et al., 2011; Honea et al., 2009a; Raznahan et al., 2011; Rowe et al., 2010]. Furthermore, we predicted that haplotype analysis should be superior in detecting such effects in comparison with individual SNPs. For this, the rs737865‐ val158met‐rs165599 haplotype was first estimated for each subject using an expectation‐maximization algorithm [Stephens and Donnelly, 2003]. Haplotype trend regression analysis was employed on cortical thickness and subcortical shapes, where estimated haplotype probabilities were used to increase statistical power and generate findings unbiased to samples with uniquely determined haplotypes. This study provides, to our knowledge, the first direct analysis of the genetic and age interactions associated with brain morphology and evidence that COMT may represent a molecular genetic marker moderating differential sensitivity to aging.
METHODS
Subjects
Two hundred and fourteen healthy Singaporean Chinese volunteers aged 21 to 80 years old were recruited (males: 93; females: 121). Volunteers with the following conditions were excluded from the recruitment: (1) major illnesses/surgery (heart, brain, kidney, lung surgery); (2) neurological or psychiatric disorders; (3) learning disability or attention deficit hyperactive disorder; (4) head injury with loss of consciousness; (5) non‐removable metal objects on/in the body such as a cardiac pacemaker; (8) diabetes or obesity; (9) a mini‐mental state examination (MMSE) score of less than 24 [Murray and Ranganath, 2007]. This study only included 174 subjects with both structural MRI scans and saliva samples. This study was approved by the National University of Singapore Institutional Review Board and all participants provided written informed consent prior to participation.
MRI Data Acquisition and Analysis
The MRI data were acquired using a 3T Siemens Magnetom Trio Tim scanner with a 32‐channel head coil at the Clinical Imaging Research Centre of the National University of Singapore. The image protocol was high‐resolution isotropic T1‐weighted magnetization prepared rapid gradient recalled echo (MPRAGE; 192 slices, 1 mm thickness, sagittal acquisition, field of view 256 × 256 mm, matrix = 256 × 256, repetition time = 2,300 ms, echo time = 1.90 ms, inversion time = 900 ms, flip angle = 9°).
In the structural T 1‐weighted MRI analysis, the gray matter, white matter, cerebral spinal fluid (CSF), lateral ventricles, and subcortical structures (amygdala, hippocampus, caudate, putamen, globus pallidus, thalamus) were automatically segmented from the intensity‐inhomogeneity corrected T1‐weighted MR images [Fischl et al., 2002]. For shape analysis, the subcortical shapes were generated using the prior shape information of an atlas that was created from 41 manually labelled individual structures via a LDDMM atlas generation procedure [Li et al., 2008]. Shape variations of individual subjects relative to the atlas were characterized by the Jacobian determinant of the deformation in the logarithmic scale, where the deformation transformed the atlas shape to be similar to subjects. This measure, termed as the “deformation map,” represents the ratio of each subject's structural volume to the atlas volume in the logarithmic scale: i.e., positive values correspond to expansion, while negative values correspond to compression of the subject's structure relative to the atlas at each anatomical location.
For thickness analysis, an inner surface was constructed at the boundary between the white and gray matter and then propagated to the outer surface at the boundary between the gray matter and CSF. Cortical thickness was measured as the distance between the corresponding points on the inner and outer surfaces [Fischl and Dale, 2000]. LDDMM cortical surface mapping algorithm was then applied to align individual cortical surfaces to an atlas cortical surface for group analysis of cortical thickness [Zhong and Qiu, 2010].
SNP Genotyping
Saliva was collected from each participant through the Oragene DNA Self‐Collection Kit (DNA Genotek Inc., Kanata, Ontario, Canada). Then, the samples were genotyped on Illumina Omni express arrays, recently shown to perform well and have better coverage than competitors in Asian populations [Jiang et al., 2013], and on Illumina Exome arrays as well as Taqman array, following the manufacturer's instructions by Expression Analysis Inc. Data were processed in GenomeStudio Genotyping ModuleTM. Genotyping calls were made by the GenCall software which incorporates a clustering algorithm (GenTrain) and a calling algorithm (Bayesian model). The GenCall Score of each SNP probe and call rate of each sample were generated. The GenCall score is primarily designed as a means by which to rank and filter out failed genotypes [Oliphant et al., 2002]. Scores below 0.15 generally indicate failed genotypes and hence the genotypes with a GenCall score of less than 0.15 were not assigned genotypes [Oliphant et al., 2002]. The SNPs COMT val158met, COMT rs737865, COMT rs165599, and APOE were then extracted and used in this study. Their minor allele frequencies (MAF) were greater than 0.05. The SNPs also did not deviate from the Hardy‐Weinberg equilibrium (HWE, P < 0.001).
Haplotype Estimation
To measure linkage disequilibrium between the COMT SNPs, haplotype frequencies were estimated through use of the expectation‐maximization algorithm on individual genotypes and calculated Lewontin's D: and Pearson's correlation using Haploview software, version 4.2. We then constructed likely three SNP haplotypes in our samples on the basis of the three polymorphisms using PHASE software, version 2.1.1 [Stephens and Donnelly, 2003]. Only haplotypes with an estimated frequency >3% were used in the analysis.
Statistical Analysis
Statistical analyses for cortical thickness and subcortical shapes were performed using SurfStat [Chung et al., 2010]. To examine interaction of age with the genotype of individual SNPs on cortical thickness and subcortical shapes, a regression model included age, SNP genotypes, their interaction as main factors and gender as covariate (brain measure ∼ gender + age + SNP genotypes + age * SNP genotypes). Age was considered as a continuous variable. The genotype of SNPs was considered as a categorical variable. This model was applied to the brain measure at each vertex on the atlas surface (cortical surface for cortical thickness or subcortical surface for subcortical shape). Statistical results at all vertices on the atlas surface were corrected for multiple comparisons at a cluster level of significance, P < 0.05. This statistical analysis was run separately for individual SNPs and individual structural measures. For subcortical volumes, the aforementioned regression analysis was performed using SPSS 18 for windows.
For post hoc analysis, we first examined age effects on cortical thickness and subcortical shapes in each genotype group of individual COMT SNPs. For this, the mean values of structural measures with the significant interaction effects of age and SNP was computed for individual brain regions. Regression analysis was examined on the mean values of structural measures with age as main factor and gender as covariate in each genotype group of individual COMT SNPs. Again, age was considered as a continuous variable. Simple slope analysis was further employed to compare the slopes of age‐related decline in the structural measures among the genotype groups.
For the second post‐hoc analysis, we examined whether individual genotypes of the COMT SNPs play the same roles in young and old adults. For this, the sample was divided into three groups, Young (20–39 years old), Middle (40–54 years old) and Old (55 and above). ANCOVA analysis was performed on the structural measures with the genotypes of COMT SNPs as main factor and gender as covariate in each age group. Bonferroni's correction was applied to correct multiple comparisons in the post hoc analysis. Both analyses were run separately for individual SNPs and individual brain regions.
Haplotype trend regression analysis was used to test for interactive effects of the COMT haplotype and age on cortical thickness, subcortical volumes and shapes [Oliphant et al., 2002]. The COMT haplotype was represented using its estimated probability for individual participants using PHASE software [Stephens and Donnelly, 2003]. The haplotype trend regression model included age, probability of haplotype, and their interaction as main factors and gender as covariate (brain measure ∼ gender + age + probability of haplotype + age * probability of haplotype). Age was considered as a continuous variable. This model was applied to the brain measure at each vertex on the atlas surface (cortical surface for cortical thickness or subcortical surface for subcortical shapes). Statistical results at all vertices on the atlas surface were corrected for multiple comparisons at a cluster level of significance, P < 0.05. This statistical analysis was run separately for individual structural measures.
RESULTS
Demographics
Among 214 recruited subjects, 30 subjects with no genetic data and 32 with missing structural MRI data were excluded, resulting in a final sample size of 174 in this study. Table 1 lists the distribution of gender and MMSE scores for each age group.
Table 1.
Demographics
| Age groups | Young | Middle | Older |
|---|---|---|---|
| 20–39 | 40–54 | 55 and 80 | |
| Mean (SD) | Mean (SD) | Mean (SD) | |
| N | 54 | 42 | 78 |
| Female, % | 50.0 | 69.0 | 56.4 |
| Age | 28.7 (4.67) | 47.4 (4.39) | 64.0 (6.29) |
| MMSE scores | 28.9 (1.28) | 28.0 (1.48) | 27.8 (1.74) |
COMT Genotype Distribution and Haplotype Frequency
The genotype frequencies of individual COMT SNPs and the estimated frequencies of their haplotypes are listed in Table 2. Based on the genotype frequency of the individual SNPs, certain genotypes were grouped together for the purpose of statistical analysis with the brain data.
Table 2.
Genotype frequencies and grouping of each SNPs as well as their haplotype frequency
| SNPs | Genotype frequencies (n) | |||
|---|---|---|---|---|
| AA | AG | GG | Grouping | |
| COMT val158met | 13 | 66 | 95 | ‐met carriers (AA + AG) |
| ‐val homozygotes (GG) | ||||
| COMT rs737865 | 80 | 80 | 14 | ‐G allele carriers(AG + GG) |
| ‐A homozygotes (AA) | ||||
| COMT rs165599 | 49 | 86 | 39 | ‐AA |
| ‐AG | ||||
| ‐GG | ||||
| ε2ε4 | ε3ε2 | ε3ε3 | ε3ε4 | |
| APOE | 5 | 16 | 125 | 28 |
| Haplotype (rs737865‐ val158met‐rs165599) | Estimated Haplotype Frequency mean (SD) % | |||
| A‐met‐A | 21 (0.94) | |||
| A‐val‐A | 10 (0.90) | |||
| A‐val‐G | 37 (1.09) | |||
| G‐met‐A | 5 (0.92) | |||
| G‐val‐A | 17 (0.87) | |||
| G‐val‐G | 9 (1.06) | |||
Interaction Effects of Age With Individual COMT SNPs on Cortical Thickness and Subcortical Shapes
Cortical thickness
Regression analysis revealed significant interaction effects of age with COMT val158met and COMT rs737865 but not with COMT rs165599 on cortical thickness.
Age by COMT val158met interaction effects on cortical thickness were observed predominantly in the left dorsolateral prefrontal cortex (dlPFC), left angular gyrus (AG), right superior frontal cortex (SFC) and right AG (Fig. 1A and Table 3 column 2). Further analysis revealed that age was negatively associated with cortical thickness in the left dlPFC, right SFC and bilateral AG in met carriers (Fig. 1B). In Table 3, val homozygotes also showed that age was negatively associated with cortical thickness in the right AG but not in the left dlPFC, left AG, right SFC. Additional slope analysis showed a faster decline in age‐related cortical thinning of the left dlPFC, right SFC and bilateral AG in met carriers as compared to val homozygotes (Table 3 column 4).
Figure 1.
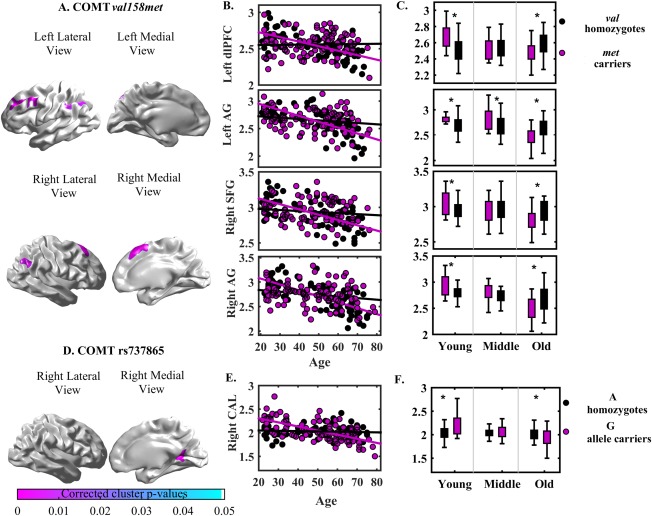
Panels (A) and (D) show the statistical maps of interaction between age and COMT SNPs (val158met, rs737865) on cortical thickness. Scatter plots on panels (B) and (E) illustrate the relationship of age and cortical thickness within each genotype of COMT val158met and COMT rs737865, respectively. Boxplots on panels (C) and (F) illustrate the cortical thickness within genotypes of COMT val158met and rs737865 in each age groups, respectively. Abbreviation: *P < 0.05. [Color figure can be viewed in the online issue, which is available at http://wileyonlinelibrary.com.]
Table 3.
Statistical results
| Age*COMT | Association of age and brain regions | Slope analysis | Post hoc among genotype groups | ||||
|---|---|---|---|---|---|---|---|
| SNP | val158met | rs 737865 | |||||
| Brain regions | Cluster size | P‐valuea | Cluster size | P‐valuea | β | β | P‐value |
| P‐value | P‐value | ||||||
| Left dlPFC | 2,155 | 0.001 | – | – | met: −0.628 (0.001) | −1.092 (0.001) | Y: met > val 0.001 |
| val: 0.030 (0.774) | O: val >met 0.002 | ||||||
| Left AG | 1,545 | 0.013 | – | – | met: −0.723 (0.001) | −1.101 (0.001) | Y: met > val 0.012 |
| val: −0.169 (0.081) | M: met > val 0.02 | ||||||
| O: met < val <0.001 | |||||||
| Right SFG | 1,392 | 0.008 | – | – | met: −0.637 (0.001) | −0.943 (0.001) | Y: met > val 0.007 |
| val: −0.131 (0.208) | O: met < val 0.001 | ||||||
| Right AG | 1,544 | 0.0126 | – | – | met: −0.727 (0.001) | −0.994 (0.001) | Y: met > val 0.008 |
| val: −0.211 (0.031) | O: met < val <0.001 | ||||||
| Right CAL | – | – | 1,403 | G: −0.635 (0.001) | −1.17 (0.001) | Y: G allele>A | |
| 0.046 | A: −0.081 (0.489) | P < 0.001 | |||||
| O: G allele<A 0.025 | |||||||
| Left anterior putamen | 811 | 0.025 | – | – | met: −0.557 (0.001) | −0.617 (0.004) | Y: met > val 0.019 |
| val: −0.259 (0.004) | |||||||
| Right anterior putamen | 1,074 | 0.015 | – | – | met: −0.559 (0.001) | −0.686 (0.001) | Y: met > val 0.010 |
| val: −0.227 (0.011) | |||||||
| Right anterior caudate nucleus | 459 | 0.030 | – | – | met: −0.520 (0.001) | −0.505 (0.031) | Y: met > val 0.032 |
| val: −0.257 (0.008) | |||||||
The columns respectively list brain regions with significant interaction effects of age with COMT SNPs, clusters size and P‐values, β and P‐values for the associations of age and brain regions among genotype groups and the slope analysis, P‐values for post hoc analysis on genotypes in individual age groups.
Note. met = met carriers; val = val homozygotes; G = G allele carriers; A= A homozygotes. Y = Young age adults; M = Middle age adults; O = Old age adults.
Abbreviations. dlPFC—dorsolateral prefrontal cortex; AG—angular gyrus; SFC—superior frontal cortex; CAL—calcarine sulcus.
Corrected cluster P‐value.
A significant interaction of age by COMT rs737865 was observed in the right calcarine sulcus (CAL) (Fig. 1D and Table 3 column 2). Subsequent analysis revealed that cortical thickness in the right CAL was negatively associated with age in the G‐allele carriers of COMT rs737865 but not A‐homozygotes. Moreover, G‐allele carriers showed a faster decline in age‐related cortical thinning in the right CAL as compared to A homozygotes (Fig. 1E and Table 3 column 3 and 4).
Subcortical volumes and shapes
Interaction effects of age with COMT val158met on the subcortical volumes were observed in the same brain regions as drawn using subcortical shape analysis. We thus reported findings on the subcortical volumes in Supporting Information Table S1 of the Supplementary. The results of the shape analysis were described below as it provides detailed anatomical information.
Age by COMT val158met interaction was observed specifically in the bilateral anterior putamen and the right anterior caudate nucleus shapes (Fig. 2A and Table 3 column 2). Further analysis showed that both met carriers and val homozygotes had significant compression in the bilateral anterior putamen as well as right anterior caudate nucleus as age increases (Fig. 2B). The slope analysis revealed that met carriers showed faster compression in all the three subcortical regions as age increases when compared to val homozygotes (Table 3 column 3 and 4).
Figure 2.
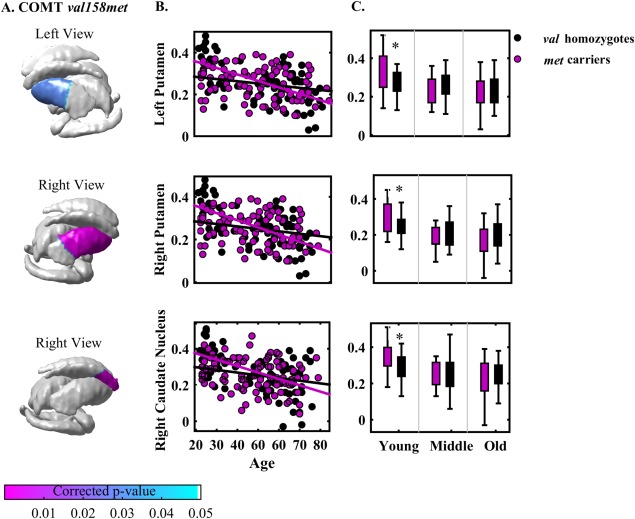
Panels (A) shows the statistical maps of interaction between age and COMT SNPs (val158met, rs737865) on subcortical shapes. The scatter plots on panel (B) illustrate the relationship of age and subcortical shapes within each genotype of COMT val4680met. The boxplot on panel (C) illustrates the subcortical shapes between genotypes of COMT val4680met in each age group. Abbreviation: *P < 0.05. [Color figure can be viewed in the online issue, which is available at http://wileyonlinelibrary.com.]
The comparisons of the genotype groups in each age group shown in Figure 2C revealed that among the young adults, met carriers had greater shapes expansion in the bilateral anterior putamen and the right caudate nucleus as compared to val homozygotes (Table 3 column 5). Among the middle and old groups, met carriers and val homozygotes had comparable bilateral anterior putamen and right anterior caudate nucleus shapes (P > 0.05).
No significant interaction of age with COMT rs165599 as well as COMT rs737865 was found on the subcortical shapes.
Interaction Effects of Age with COMT Haplotype on Cortical Thickness and Subcortical Shapes
Cortical thickness
The haplotype regression analysis adjusted for gender revealed that association between age and cortical thickness were modulated by the rs737865‐ val158met‐rs165599 haplotype. The probability of G‐met‐A haplotype modulated the negative relationship of age and left cortical thickness of the SFC, orbitofrontal cortex (OFC), dlPFC, middle temporal gyrus (MTG), posterior cingulate cortex (PCC) and lingual as well as the right cortical thickness of the SFC, dlPFC, supramarginal gyrus (SMG), AG, paracentral, precuneus (PCUN), occipital (OCC) and CAL (Fig. 3A and Table 4). Similarly, the probability of G‐val‐A haplotype modulated the negative relationship of age and the left inferior temporal cortex (ITC) (Fig. 3B).
Figure 3.
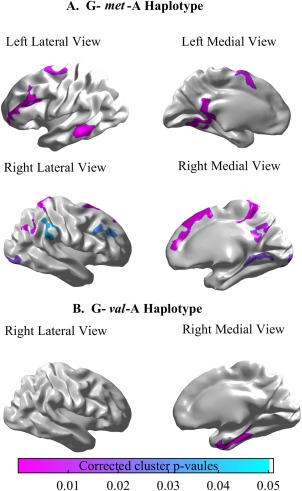
Panels (A) and (B) illustrate statistical maps for the relationship between cortical thickness and age modulated by G‐met‐A haplotype probability and G‐val‐A haplotype probability. [Color figure can be viewed in the online issue, which is available at http://wileyonlinelibrary.com.]
Table 4.
Clusters size and P‐values for significant interaction between age and COMT haplotype
| Brain regions | Cluster size (number of vertices) | Corrected cluster P‐value |
|---|---|---|
| G‐met‐A | ||
| Right SFC | 2,409 | <0.0001 |
| Right PC | 2,264 | <0.0001 |
| Right PCUN | 1,630 | 0.00561 |
| Right CAL | 1,370 | 0.0223 |
| Right OCC | 1,480 | 0.0154 |
| Right AG | 1,905 | 0.00318 |
| Right SMG | 1,237 | 0.0352 |
| Right dlPFC | 1,232 | 0.0280 |
| Left dlPFC | 2,980 | <0.0001 |
| Left PCC and LING | 3,585 | <0.0001 |
| Left MTC | 1,795 | <0.0001 |
| Left SFC | 1,387 | 0.00562 |
| Left OFC | 1,030 | 0.0371 |
| Left amygdala | 429 | 0.00971 |
| A‐met‐A | ||
| Right anterior putamen | 981 | 0.0177 |
| Left anterior putamen | 782 | 0.0274 |
| G‐val‐A | ||
| Right ITC | 1,929 | 0.00695 |
| A‐val‐G | ||
| Right anterior putamen | 909 | 0.0178 |
| Right caudate nucleus | 270 | 0.0411 |
Abbreviations. dlPFC—dorsolateral prefrontal cortex; AG—angular gyrus; SFC—superior frontal cortex; PC—paracentral; PCUN—precuneus; CAL—calcarine sulcus; OCC—occipital; SMG—supramarginal gyrus; PCC—posterior cingulate cortex; LING—lingual; MTC—middle temporal cortex; OFC—orbitofrontal; ITC—inferior temporal cortex.
Subcortical volumes and shapes
Interaction effects of age with A‐met‐A probabilities on the subcortical volumes were observed in the same brain regions as drawn using subcortical shape analysis. We thus reported findings on the subcortical volumes in Supporting Information Table S1.
In subcortical shapes, the probability of A‐met‐A modulated the negative relationship of age and the bilateral putamen, specifically their anterior regions (Fig. 4A and Table 4). Moreover, the probability of G‐met‐A modulated the negative relationship of age and the left amygdala shape (Fig. 4B and Table 4). Lastly, the negative association of age and right anterior caudate nucleus and right anterior putamen shapes was modulate by the probability of A‐val‐G (Fig. 4C and Table 4).
Figure 4.

Panels (A, B and C) illustrate statistical maps for the relationship between subcortical shape and age modulated by A‐met‐A haplotype probability, G‐met‐A haplotype probability and A‐val‐G haplotype probability. [Color figure can be viewed in the online issue, which is available at http://wileyonlinelibrary.com.]
APOE Influence
Given that Apolipoprotein E4 (APOE‐ε4) allele is one of the prominent risk allele in aging [Brown et al., 2011; Honea et al., 2009b; Parasuraman et al., 2002; Plassman et al., 1997], additional analysis was carried out with APOE as covariate in the aforementioned analysis. Interaction effects of age with individual SNPs on the cortical thickness, subcortical volumes and shapes largely remained the same even after controlling for the APOE (Supporting Information Tables S2‐3 and Supporting Information Figure S1–S2). Moreover, significant interaction between age and COMT haplotype on the cortical and subcortical morphology remained the same after adjusting for the APOE (Supporting Information Tables S2‐3 and Supporting Information Figs. S3–S4).
DISCUSSION
This study examined whether individual COMT SNPs (rs737865, val158met, rs165599) and its haplotype modulate age effects on subcortical shapes and cortical thickness using a large Chinese adult sample aged 21 years and above. Our results showed an age‐related decline in cortical thickness of the dorsal pathway and age‐related shape compression in the basal ganglia as a function of the genotypes of the individual COMT SNPs. The haplotype trend regression analysis further revealed an age‐related decline in cortical thickness in the default mode network (DMN), including the PCC, PCUN, SMG and paracentral, and the ventral visual system, including the OCC and left ITC, as a function of the COMT haplotype. We further observed an antagonistic pleiotropic effect in COMT, suggesting that genetically programmed neural benefits in early life may have a potential bearing towards neural susceptibility in later life.
In line with the role of COMT in regulating synaptic dopamine levels [Mier et al., 2010], our findings revealed that individual COMT SNPs modulates the association of age and the morphology of the dopamine‐enriched brain regions, including those in the dorsal pathway and the basal ganglia. We showed that met carriers had greater age‐related neurodegeneration in these brain regions compared to val homozygotes. This is inconsistent with previous findings based on Caucasians [Meyer‐Lindenberg et al., 2006], that is, met allele of COMT val158met was suggested as a “smarter” allele principally due to its positive effects on both intermediate and cognitive endophenotypes when compared to val allele. Several studies based on Chinese samples have found better performances over a range of cognitive processes such as attention, working memory, mental state of intention in val allele carriers [Qian et al., 2009; Wang et al., 2013; Xia et al., 2012; Zhang et al., 2007]. Moreover, healthy adults with val alleles showed a greater hippocampal volume as compared to val homozygotes [Wang et al., 2013]. However, the examination of COMT influence on the brain morphology has thur far been limited to hippocampus volume or prefrontal function in healthy young adults [Meyer‐Lindenberg et al., 2006; Wang et al., 2013]. Our study provided new evidences of the COMT effects on age‐related associations with both the cortical and subcortical brain morphology in a Chinese sample. Interestingly, our findings showed an antagonistic pleiotropy phenomenon, the concept originally from evolutionary biology. It suggests that certain genes may impact fitness differently during different stages of life. It has been substantially supported by the findings of APOE on behavioural and neural endophenotypes across lifespan [Borghesani et al., 2008; Dennis et al., 2010a; Filbey et al., 2010; Hayden et al., 2009; Jochemsen et al., 2012; Lind et al., 2006; Mondadori et al., 2007; Xu et al., 2009]. Young adults with APOE ε4 showed better cognitive performances than their non‐carriers counterparts. Moreover, young adults with APOE ε4 also showed more bilaterally activity in the medial temporal lobe, medial frontal cortex and hippocampus [Dennis et al., 2010a; Filbey et al., 2010; Filbey et al., 2006; Jochemsen et al., 2012; Mondadori et al., 2007]. On the other hand, old adults with APOE ε4 showed poorer cognitive performance and less activity in the hippocampus and frontal cortex than non‐carriers of APOE ε4 [Borghesani et al., 2008; Hayden et al., 2009; Lind et al., 2006; Xu et al., 2009]. We provided new evidence of the COMT antagonistic pleiotropy phenomenon on the brain morphology across lifespan. Our results suggested a genetically programmed COMT‐related neural benefits, such as thicker cortex in young adults and a potential bearing towards neural susceptibility in older adults. Moreover, the observed antagonistic pleiotropy phenomenon appears to be more apparent in the cortical regions than the basal ganglia regions.
Most notably, haplotypes analysis, compared to analysis on individual SNPs, showed improved statistical power in detecting effects of COMT genetic variants on the association between age and brain morphology. The haplotypes analysis provided the findings consistent with those derived from the individual SNPs but considerably stronger in terms of the cluster size (see Tables 3 and 4). Moreover, in addition to the dorsal visual system detected from COMT val158met, the haplotype analysis also uncovered the age X COMT haplotype effects on cortical thickness in the brain regions part of the DMN and the ventral visual system.
The dorsal and ventral systems are involved in working memory [Ungerleider et al., 1998]. Previous studies suggested that both systems are vulnerable to age [Hof and Mobbs, 2001]. The ventral visual system comprises of the visual cortex that projects in the ITC, which eventually terminates in the ventral prefrontal cortex [Murray and Wallace, 2011]. It is critical for providing information on object's representation. Older adults, as compared to young adults, showed decreased object recognition accuracy [Nobre and Kastner, 2014]. Additionally, during route encoding task, older subjects also showed reduced activity in the fusiform as compared to young adults. The dorsal pathway, on the other hand, comprises of the visual cortex that projects in the posterior parietal cortex, which eventually terminates in the dlPFC. The pathway has been found to be critical for processing spatial information on objects [Murray and Wallace, 2011]. Deficit in encoding spatial information was shown in older adults [Meulenbroek et al., 2004; Schiavetto et al., 2002]. Decreased involvement of the inferior parietal cortex was in relation to deficit in object location processing in older adults when compared to younger adults. Beyond age effects on both systems, young adults showed that dlPFC‐related working memory performance [Honea et al., 2009a; Mier et al., 2010; Nyberg et al., 2014; Roffman et al., 2008] and functional activation to working memory in the inferior parietal cortex [Gibbs and D'Esposito, 2005] are as a function of COMT val158met. While dopamine is well expressed in both brain regions, one expects that the COMT manipulation of the functions of these brain regions may be via its regulation of dopamine availability. Our study employed haplotype analysis and further uncovered that genetic variants of COMT modulate the association of age and brain morphology in both dorsal and visual systems, which may suggest a crucial molecular mechanism via dopamine system in aging.
Likewise, the DMN was identified as major brain regions influenced by the interaction of age and COMT haptotype. The DMN is primarily associated with monitoring of self‐related mental processes such as recollection of past experiences, imagining future‐related events known as episodic memory as well as working memory [Addis et al., 2007; Buckner and Carroll, 2007]. It is also highly implicated in aging [Bluhm et al., 2008; Damoiseaux et al., 2008; Esposito et al., 2008]. Previous studies have found that decreased connectivity strength between the PCC and mPFC confers a detrimental impact on episodic memory, working memory and executive functions in the elderly [Damoiseaux et al., 2008; Mevel et al., 2013; Sambataro et al., 2010; Spreng and Grady, 2010]. Moreover, the pivotal structures in the DMN, such as the precuneus and PCC, were highly susceptible to the effect of dopamine during working memory task in young healthy adults [Braskie et al., 2008; Stokes et al., 2011]. Although there is evidence for a role of COMT in regulating age‐related episodic memory, working memory [Lisman and Grace, 2005; Nagel et al., 2008], putative impacts of the COMT genetic variants on intermediate endophenotype have thus far been limited to the examination using resting state fMRI. The examination of COMT influence on the functional connectivity in healthy young adults, however, is relatively unclear. While there was a study which observed a stronger functional connectivity between PCC and prefrontal regions in the val homozygous as compared to their met allele carriers counterparts [Jang et al., 2012], several others found no or decreased connectivity between prefrontal regions and the PCC in the val homozygous [Liu et al., 2010; Tian et al., 2013; Tunbridge et al., 2013]. The inconsistency might be due to the use of single SNP for analysis and samples of different age groups. This warrants more investigation of COMT effect on the DMN. To our best of knowledge, none has looked at the influence of the COMT haplotype on the structural basis of aging brain. Our study provided new evidence of a modulative role of the COMT gene on age‐related associations with structural brain regions involved in the DMN. Overall, the study of COMT haplotype, which characterize the linkage disequilibrium structure of several SNP markers, showed stronger association with phenotypic regions that are highly involved in aging and under the influence of dopamine availability than individual markers. Furthermore, it is also superior in identifying potential complex interactions of variants in COMT on cortical and subcortical regions that may not be easily inferred from single SNP analysis alone.
Our study employed the advanced brain mapping technique, LDDMM, and examined the subcortical shapes as a function of interaction between COMT and age. Using shape analysis, we were able to provide additional information with respect to the detailed anatomical information, which is beyond volumetric analysis. Our study highlighted that the shape variations of the anterior segment of the caudate nucleus and putamen can be explained by the interaction of age with COMT val158met and its haplotype. Previous study has shown that the anterior caudate nucleus played a role in goal‐directed decision‐making by integrating performance information and demand of cognitive control during instrumental learning. The anterior putamen plays a role in tracking conditions that would lead to correct responses [Brovelli et al., 2011]. Interestingly, we also observed a role of COMT haplotype on the shapes of amygdala in our sample. The amygdala was also highly susceptible to age and an age–related decrease of amygdala volume was associated with poor socioemotional memory score in the old adults [Cassidy and Gutchess, 2012]. Moreover, the dopamine D1 and D2 are expressed in amygdala in addition to numerous innervation of dopaminergic fibers [Asan, 1998; Ito et al., 2008]. A previous study had further showed a positive correlation between dopamine release and amygdala signal change in response to affective stimuli [Takahashi et al., 2010], suggesting an influential effect of dopamine on amygdala function. Thus by examining subcortical shapes, specific regions and their function contributing to the molecular basis of aging can be better defined and understood.
The strength of this study includes a unique opportunity to examine individual SNPs as well as its haplotype of COMT on brain morphology, including cortical thickness, subcortical volumes and shapes, in adults aged across the lifespan. Using estimated haplotype probability in statistical analysis on imaging data increases statistical power and generates results unbiased to samples with uniquely determined haplotypes. Perhaps one major limitation of our study, and one common to most studies of imaging genetics, is that our current lack of knowledge of the relation between the genetic variants and region‐specific variation in COMT gene expression and dopamine signaling and also their temporal patterns. Nevertheless, our findings are consistent with the apparent increased level of dopamine signaling in the prefrontal cortex and basal ganglia [Braskie et al., 2008]. In addition, our study did not examine gene and gene interaction on the brain morphology in aging, which is most likely present. Furthermore, due to the limited sample in this study, certain genotypes were grouped based on their frequency for the purpose of statistical analysis with the brain data. This may reduce the opportunity to explore effects of individual genotypes on aging brain. Finally, our statistical models were limited to linear, which may not be true in reality. Hence, we also presented the post‐hoc analysis where age was considered as a discrete variable. This partially solved the problem of the linearity assumption but the cutoff of the age intervals may drive the results.
In conclusion our results showed that genetic variants of COMT modulate the association of age and brain morphology of the dorsal visual pathway and basal ganglia that are dopaminergically rich. Additionally, COMT shows an antagonistic pleiotropy phenomenon that confers a differential impact of COMT on an aging brain. We further highlighted the advantages of relating probabilistic haplotype to brain morphology where results further revealed that both ventral visual pathway and DMN were also modulated by COMT. Studying the COMT genetic variations with aging alterations of brain anatomy provides a better understanding of the molecular mechanism in the aging brain morphology.
Supporting information
Supporting Information
REFERENCES
- Addis DR, Wong AT, Schacter DL (2007): Remembering the past and imagining the future: Common and distinct neural substrates during event construction and elaboration. Neuropsychologia 45:1363–1377. [DOI] [PMC free article] [PubMed] [Google Scholar]
- Aguilera M, Barrantes‐Vidal N, Arias B, Moya J, Villa H, Ibanez MI, Ruiperez MA, Ortet G, Fananas L (2008): Putative role of the COMT gene polymorphism (Val158Met) on verbal working memory functioning in a healthy population. Am J Med Genet Part B, Neuropsychiatr Genet 147b:898–902. [DOI] [PubMed] [Google Scholar]
- Allen JS, Bruss J, Brown CK, Damasio H (2005): Normal neuroanatomical variation due to age: The major lobes and a parcellation of the temporal region. Neurobiol Aging 26:1245–1260. discussion 1279‐82. [DOI] [PubMed] [Google Scholar]
- Asan E (1998): The catecholaminergic innervation of the rat amygdala. Adv Anat Embryol Cell Biol 142:1–118. [DOI] [PubMed] [Google Scholar]
- Bis JC, Kavousi M, Franceschini N, Isaacs A, Abecasis GR, Schminke U, Post WS, Smith AV, Cupples LA, Markus HS, Schmidt R, Huffman JE, Lehtimaki T, Baumert J, Munzel T, Heckbert SR, Dehghan A, North K, Oostra B, Bevan S, Stoegerer EM, Hayward C, Raitakari O, Meisinger C, Schillert A, Sanna S, Volzke H, Cheng YC, Thorsson B, Fox CS, Rice K, Rivadeneira F, Nambi V, Halperin E, Petrovic KE, Peltonen L, Wichmann HE, Schnabel RB, Dorr M, Parsa A, Aspelund T, Demissie S, Kathiresan S, Reilly MP, Taylor K, Uitterlinden A, Couper DJ, Sitzer M, Kahonen M, Illig T, Wild PS, Orru M, Ludemann J, Shuldiner AR, Eiriksdottir G, White CC, Rotter JI, Hofman A, Seissler J, Zeller T, Usala G, Ernst F, Launer LJ, D'Agostino RB, Sr. , O'Leary DH, Ballantyne C, Thiery J, Ziegler A, Lakatta EG, Chilukoti RK, Harris TB, Wolf PA, Psaty BM, Polak JF, Li X, Rathmann W, Uda M, Boerwinkle E, Klopp N, Schmidt H, Wilson JF, Viikari J, Koenig W, Blankenberg S, Newman AB, Witteman J, Heiss G, Duijn C, Scuteri A, Homuth G, Mitchell BD, Gudnason V, O'Donnell CJ, Consortium CA (2011): Meta‐analysis of genome‐wide association studies from the CHARGE consortium identifies common variants associated with carotid intima media thickness and plaque. Nat Genet 43:940–947. [DOI] [PMC free article] [PubMed] [Google Scholar]
- Bluhm RL, Osuch EA, Lanius RA, Boksman K, Neufeld RW, Theberge J, Williamson P (2008): Default mode network connectivity: Effects of age, sex, and analytic approach. Neuroreport 19:887–891. [DOI] [PubMed] [Google Scholar]
- Borghesani PR, Johnson LC, Shelton AL, Peskind ER, Aylward EH, Schellenberg GD, Cherrier MM (2008): Altered medial temporal lobe responses during visuospatial encoding in healthy APOE*4 carriers. Neurobiol Aging 29:981–991. [DOI] [PMC free article] [PubMed] [Google Scholar]
- Braskie MN, Wilcox CE, Landau SM, O'Neil JP, Baker SL, Madison CM, Kluth JT, Jagust WJ (2008): Relationship of striatal dopamine synthesis capacity to age and cognition. J Neurosci 28:14320–14328. [DOI] [PMC free article] [PubMed] [Google Scholar]
- Bray NJ, Buckland PR, Williams NM, Williams HJ, Norton N, Owen MJ, O'Donovan MC (2003): A haplotype implicated in schizophrenia susceptibility is associated with reduced COMT expression in human brain. Am J Hum Genet 73:152–161. [DOI] [PMC free article] [PubMed] [Google Scholar]
- Brovelli A, Nazarian B, Meunier M, Boussaoud D (2011): Differential roles of caudate nucleus and putamen during instrumental learning. NeuroImage 57:1580–1590. [DOI] [PubMed] [Google Scholar]
- Brown JA, Terashima KH, Burggren AC, Ercoli LM, Miller KJ, Small GW, Bookheimer SY (2011): Brain network local interconnectivity loss in aging APOE‐4 allele carriers. Proc Natl Acad Sci U S A 108:20760–20765. [DOI] [PMC free article] [PubMed] [Google Scholar]
- Buckner RL, Carroll DC (2007): Self‐projection and the brain. Trend Cognit Sci 11:49–57. [DOI] [PubMed] [Google Scholar]
- Cassidy BS, Gutchess AH (2012): Structural variation within the amygdala and ventromedial prefrontal cortex predicts memory for impressions in older adults. Front Psychol 3:319 [DOI] [PMC free article] [PubMed] [Google Scholar]
- Cerasa A, Gioia MC, Labate A, Liguori M, Lanza P, Quattrone A (2008): Impact of catechol‐O‐methyltransferase Val(108/158) Met genotype on hippocampal and prefrontal gray matter volume. Neuroreport 19:405–408. [DOI] [PubMed] [Google Scholar]
- Chen J, Lipska BK, Halim N, Ma QD, Matsumoto M, Melhem S, Kolachana BS, Hyde TM, Herman MM, Apud J, Egan MF, Kleinman JE, Weinberger DR (2004): Functional analysis of genetic variation in catechol‐O‐methyltransferase (COMT): Effects on mRNA, protein, and enzyme activity in postmortem human brain. Am J Hum Genet 75:807–821. [DOI] [PMC free article] [PubMed] [Google Scholar]
- Chung MK, Worsley KJ, Nacewicz BM, Dalton KM, Davidson RJ (2010): General multivariate linear modeling of surface shapes using SurfStat. Neuroimage 53:491–505. [DOI] [PMC free article] [PubMed] [Google Scholar]
- Damoiseaux JS, Beckmann CF, Arigita EJ, Barkhof F, Scheltens P, Stam CJ, Smith SM, Rombouts SA (2008): Reduced resting‐state brain activity in the “default network” in normal aging. Cereb Cortex 18:1856–1864. [DOI] [PubMed] [Google Scholar]
- Dennis NA, Browndyke JN, Stokes J, Need A, Burke JR, Welsh‐Bohmer KA, Cabeza R (2010a): Temporal lobe functional activity and connectivity in young adult APOE varepsilon4 carriers. Alzheimers Dement 6:303–311. [DOI] [PMC free article] [PubMed] [Google Scholar]
- Dennis, N.A. , Need, A.C. , LaBar, K.S. , Waters‐Metenier, S. , Cirulli, E.T. , Kragel, J. , Goldstein, D.B. , Cabeza, R. (2010b) COMT val108/158 met genotype affects neural but not cognitive processing in healthy individuals. Cerebral Cortex (New York, N.Y.: 1991) 20:672–683. [DOI] [PMC free article] [PubMed] [Google Scholar]
- Diaz‐Asper CM, Goldberg TE, Kolachana BS, Straub RE, Egan MF, Weinberger DR (2008): Genetic variation in catechol‐O‐methyltransferase: Effects on working memory in schizophrenic patients, their siblings, and healthy controls. Biol Psychiatry 63:72–79. [DOI] [PMC free article] [PubMed] [Google Scholar]
- Dumontheil I, Roggeman C, Ziermans T, Peyrard‐Janvid M, Matsson H, Kere J, Klingberg T (2011): Influence of the COMT genotype on working memory and brain activity changes during development. Biol Psychiatry 70:222–229. [DOI] [PubMed] [Google Scholar]
- Egan MF, Goldberg TE, Kolachana BS, Callicott JH, Mazzanti CM, Straub RE, Goldman D, Weinberger DR (2001): Effect of COMT Val108/158 Met genotype on frontal lobe function and risk for schizophrenia. Proc Natl Acad Sci U S A 98:6917–6922. [DOI] [PMC free article] [PubMed] [Google Scholar]
- Ehrlich S, Morrow EM, Roffman JL, Wallace SR, Naylor M, Bockholt HJ, Lundquist A, Yendiki A, Ho BC, White T, Manoach DS, Clark VP, Calhoun VD, Gollub RL, Holt DJ (2010): The COMT Val108/158Met polymorphism and medial temporal lobe volumetry in patients with schizophrenia and healthy adults. NeuroImage 53:992–1000. [DOI] [PMC free article] [PubMed] [Google Scholar]
- Esposito F, Aragri A, Pesaresi I, Cirillo S, Tedeschi G, Marciano E, Goebel R, Di Salle F (2008): Independent component model of the default‐mode brain function: Combining individual‐level and population‐level analyses in resting‐state fMRI. Magn Reson Imaging 26:905–913. [DOI] [PubMed] [Google Scholar]
- Filbey FM, Slack KJ, Sunderland TP, Cohen RM (2006): Functional magnetic resonance imaging and magnetoencephalography differences associated with APOEepsilon4 in young healthy adults. Neuroreport 17:1585–1590. [DOI] [PubMed] [Google Scholar]
- Filbey FM, Chen G, Sunderland T, Cohen RM (2010): Failing compensatory mechanisms during working memory in older apolipoprotein E‐epsilon4 healthy adults. Brain Imaging Behav 4:177–188. [DOI] [PMC free article] [PubMed] [Google Scholar]
- Fischl B, Dale AM (2000): Measuring the thickness of the human cerebral cortex from magnetic resonance images. Proc Natl Acad Sci U S A 97:11050–11055. [DOI] [PMC free article] [PubMed] [Google Scholar]
- Fischl B, Salat DH, Busa E, Albert M, Dieterich M, Haselgrove C, van der Kouwe A, Killiany R, Kennedy D, Klaveness S, Montillo A, Makris N, Rosen B, Dale AM (2002): Whole brain segmentation: Automated labeling of neuroanatomical structures in the human brain. Neuron 33:341–355. [DOI] [PubMed] [Google Scholar]
- Fjell AM, Westlye LT, Amlien I, Espeseth T, Reinvang I, Raz N, Agartz I, Salat DH, Greve DN, Fischl B, Dale AM, Walhovd KB (2009): High consistency of regional cortical thinning in aging across multiple samples. Cereb. Cortex 19:2001–2012. [DOI] [PMC free article] [PubMed] [Google Scholar]
- Geerligs L, Renken RJ, Saliasi E, Maurits NM, Lorist MM. (2014): A brain‐wide study of age‐related changes in functional connectivity. Cerebral cortex (New York, N.Y.: 1991). [DOI] [PubMed] [Google Scholar]
- Gibbs SE, D'Esposito M (2005): Individual capacity differences predict working memory performance and prefrontal activity following dopamine receptor stimulation. Cognit Affect Behav Neurosci 5:212–221. [DOI] [PubMed] [Google Scholar]
- Goodro M, Sameti M, Patenaude B, Fein G (2012): Age effect on subcortical structures in healthy adults. Psychiatry Res 203:38–45. [DOI] [PMC free article] [PubMed] [Google Scholar]
- Gothelf D, Law AJ, Frisch A, Chen J, Zarchi O, Michaelovsky E, Ren‐Patterson R, Lipska BK, Carmel M, Kolachana B, Weizman A, Weinberger DR (2014): Biological effects of COMT haplotypes and psychosis risk in 22q11.2 deletion syndrome. Biol Psychiatry 75:406–413. [DOI] [PMC free article] [PubMed] [Google Scholar]
- Hayden KM, Zandi PP, West NA, Tschanz JT, Norton MC, Corcoran C, Breitner JC, Welsh‐Bohmer KA (2009): Effects of family history and apolipoprotein E epsilon4 status on cognitive decline in the absence of Alzheimer dementia: The Cache County Study. Arch Neurol 66:1378–1383. [DOI] [PMC free article] [PubMed] [Google Scholar]
- Hibar DP, Stein JL, Renteria ME, Arias‐Vasquez A, Desrivieres S, Jahanshad N, Toro R, Wittfeld K, Abramovic L, Andersson M, Aribisala BS, Armstrong NJ, Bernard M, Bohlken MM, Boks MP, Bralten J, Brown AA, Chakravarty MM, Chen Q, Ching CR, Cuellar‐Partida G, den Braber A, Giddaluru S, Goldman AL, Grimm O, Guadalupe T, Hass J, Woldehawariat G, Holmes AJ, Hoogman M, Janowitz D, Jia T, Kim S, Klein M, Kraemer B, Lee PH, Olde Loohuis LM, Luciano M, Macare C, Mather KA, Mattheisen M, Milaneschi Y, Nho K, Papmeyer M, Ramasamy A, Risacher SL, Roiz‐Santianez R, Rose EJ, Salami A, Samann PG, Schmaal L, Schork AJ, Shin J, Strike LT, Teumer A, van Donkelaar MM, van Eijk KR, Walters RK, Westlye LT, Whelan CD, Winkler AM, Zwiers MP, Alhusaini S, Athanasiu L, Ehrlich S, Hakobjan MM, Hartberg CB, Haukvik UK, Heister AJ, Hoehn D, Kasperaviciute D, Liewald DC, Lopez LM, Makkinje RR, Matarin M, Naber MA, McKay DR, Needham M, Nugent AC, Putz B, Royle NA, Shen L, Sprooten E, Trabzuni D, van der Marel SS, van Hulzen KJ, Walton E, Wolf C, Almasy L, Ames D, Arepalli S, Assareh AA, Bastin ME, Brodaty H, Bulayeva KB, Carless MA, Cichon S, Corvin A, Curran JE, Czisch M, de Zubicaray GI, Dillman A, Duggirala R, Dyer TD, Erk S, Fedko IO, Ferrucci L, Foroud TM, Fox PT, Fukunaga M, Gibbs JR, Goring HH, Green RC, Guelfi S, Hansell NK, Hartman CA, Hegenscheid K, Heinz A, Hernandez DG, Heslenfeld DJ, Hoekstra PJ, Holsboer F, Homuth G, Hottenga JJ, Ikeda M, Jack CR, Jr ., Jenkinson M, Johnson R, Kanai R, Keil M, Kent JW, Jr ., Kochunov P, Kwok JB, Lawrie SM, Liu X, Longo DL, McMahon KL, Meisenzahl E, Melle I, Mohnke S, Montgomery GW, Mostert JC, Muhleisen TW, Nalls MA, Nichols TE, Nilsson LG, Nothen MM, Ohi K, Olvera RL, Perez‐Iglesias R, Pike GB, Potkin SG, Reinvang I, Reppermund S, Rietschel M, Romanczuk‐Seiferth N, Rosen GD, Rujescu D, Schnell K, Schofield PR, Smith C, Steen VM, Sussmann JE, Thalamuthu A, Toga AW, Traynor BJ, Troncoso J, Turner JA, Valdes Hernandez MC, van 't Ent D, van der Brug M, van der Wee NJ, van Tol MJ, Veltman DJ, Wassink TH, Westman E, Zielke RH, Zonderman AB, Ashbrook DG, Hager R, Lu L, McMahon FJ, Morris DW, Williams RW, Brunner HG, Buckner RL, Buitelaar JK, Cahn W, Calhoun VD, Cavalleri GL, Crespo‐Facorro B, Dale AM, Davies GE, Delanty N, Depondt C, Djurovic S, Drevets WC, Espeseth T, Gollub RL, Ho BC, Hoffmann W, Hosten N, Kahn RS, Le Hellard S, Meyer‐Lindenberg A, Muller‐Myhsok B, Nauck M, Nyberg L, Pandolfo M, Penninx BW, Roffman JL, Sisodiya SM, Smoller JW, van Bokhoven H, van Haren NE, Volzke H, Walter H, Weiner MW, Wen W, White T, Agartz I, Andreassen OA, Blangero J, Boomsma DI, Brouwer RM, Cannon DM, Cookson MR, de Geus EJ, Deary IJ, Donohoe G, Fernandez G, Fisher SE, Francks C, Glahn DC, Grabe HJ, Gruber O, Hardy J, Hashimoto R, Hulshoff Pol HE, Jonsson EG, Kloszewska I, Lovestone S, Mattay VS, Mecocci P, McDonald C, McIntosh AM, Ophoff RA, Paus T, Pausova Z, Ryten M, Sachdev PS, Saykin AJ, Simmons A, Singleton A, Soininen H, Wardlaw JM, Weale ME, Weinberger DR, Adams HH, Launer LJ, Seiler S, Schmidt R, Chauhan G, Satizabal CL, Becker JT, Yanek L, van der Lee SJ, Ebling M, Fischl B, Longstreth WT, Jr ., Greve D, Schmidt H, Nyquist P, Vinke LN, van Duijn CM, Xue L, Mazoyer B, Bis JC, Gudnason V, Seshadri S, Ikram MA, Alzheimer's Disease Neuroimaging I Consortium C, Epigen Imagen, Sys , Martin NG, Wright MJ, Schumann G, Franke B, Thompson PM, Medland SE (2015): Common genetic variants influence human subcortical brain structures. Nature 520:224–229. [DOI] [PMC free article] [PubMed] [Google Scholar]
- Hof PR, Mobbs CV (2001) Functional Neurobiology of Aging. San Diego: Academic Press. [Google Scholar]
- Honea R, Verchinski BA, Pezawas L, Kolachana BS, Callicott JH, Mattay VS, Weinberger DR, Meyer‐Lindenberg A (2009a): Impact of interacting functional variants in COMT on regional gray matter volume in human brain. NeuroImage 45:44–51. [DOI] [PMC free article] [PubMed] [Google Scholar]
- Honea RA, Vidoni E, Harsha A, Burns JM (2009b): Impact of APOE on the healthy aging brain: A voxel‐based MRI and DTI study. J Alzheimer Dis 18:553–564. [DOI] [PMC free article] [PubMed] [Google Scholar]
- Ito H, Takahashi H, Arakawa R, Takano H, Suhara T (2008): Normal database of dopaminergic neurotransmission system in human brain measured by positron emission tomography. NeuroImage 39:555–565. [DOI] [PubMed] [Google Scholar]
- Jang JH, Yun JY, Jung WH, Shim G, Byun MS, Hwang JY, Kim SN, Choi CH, Kwon JS (2012): The impact of genetic variation in COMT and BDNF on resting‐state functional connectivity. Int J Imaging Syst Technol 22:97–102. [Google Scholar]
- Jernigan TL, Archibald SL, Fennema‐Notestine C, Gamst AC, Stout JC, Bonner J Hesselink JR (2001): Effects of age on tissues and regions of the cerebrum and cerebellum. Neurobiol Aging 22:581–594. [DOI] [PubMed] [Google Scholar]
- Jiang L, Willner D, Danoy P, Xu H, Brown MA (2013): Comparison of the performance of two commercial genome‐wide association study genotyping platforms in Han Chinese samples. G3 (Bethesda, Md.) 3:23–29. [DOI] [PMC free article] [PubMed] [Google Scholar]
- Jochemsen HM, Muller M, van der Graaf Y, Geerlings MI (2012): APOE epsilon4 differentially influences change in memory performance depending on age. The SMART‐MR study. Neurobiol Aging 33:832.e15–822. [DOI] [PubMed] [Google Scholar]
- Lemaitre H, Goldman AL, Sambataro F, Verchinski BA, Meyer‐Lindenberg A, Weinberger DR, Mattay VS (2012): Normal age‐related brain morphometric changes: Nonuniformity across cortical thickness, surface area and gray matter volume? Neurobiol Aging 33:617.e1–619. [DOI] [PMC free article] [PubMed] [Google Scholar]
- Li XM, Dong XP, Luo SW, Zhang B, Lee DH, Ting AK, Neiswender H, Kim CH, Carpenter‐Hyland E, Gao TM, Xiong WC, Mei L (2008): Retrograde regulation of motoneuron differentiation by muscle beta‐catenin. Nat Neurosci 11:262–268. [DOI] [PubMed] [Google Scholar]
- Liao SY, Lin SH, Liu CM, Hsieh MH, Hwang TJ, Liu SK, Guo SC, Hwu HG, Chen WJ (2009): Genetic variants in COMT and neurocognitive impairment in families of patients with schizophrenia. Genes, Brain, and Behav 8:228–237. [DOI] [PubMed] [Google Scholar]
- Lind J, Persson J, Ingvar M, Larsson A, Cruts M, Van Broeckhoven C, Adolfsson R, Backman L, Nilsson LG, Petersson KM, Nyberg L (2006): Reduced functional brain activity response in cognitively intact apolipoprotein E epsilon4 carriers. Brain 129:1240–1248. [DOI] [PubMed] [Google Scholar]
- Lisman JE, Grace AA (2005): The hippocampal‐VTA loop: Controlling the entry of information into long‐term memory. Neuron 46:703–713. [DOI] [PubMed] [Google Scholar]
- Liu B, Song M, Li J, Liu Y, Li K, Yu C, Jiang T (2010): Prefrontal‐related functional connectivities within the default network are modulated by COMT val158met in healthy young adults. J Neurosci 30:64–69. [DOI] [PMC free article] [PubMed] [Google Scholar]
- Lorenz AJ, Hamblin MT, Jannink JL (2010): Performance of single nucleotide polymorphisms versus haplotypes for genome‐wide association analysis in barley. PloS One 5:e14079 [DOI] [PMC free article] [PubMed] [Google Scholar]
- Meulenbroek O, Petersson KM, Voermans N, Weber B, Fernandez G (2004): Age differences in neural correlates of route encoding and route recognition. NeuroImage 22:1503–1514. [DOI] [PubMed] [Google Scholar]
- Mevel K, Landeau B, Fouquet M, La Joie R, Villain N, Mezenge F, Perrotin A, Eustache F, Desgranges B, Chetelat G (2013): Age effect on the default mode network, inner thoughts, and cognitive abilities. Neurobiol Aging 34:1292–1301. [DOI] [PubMed] [Google Scholar]
- Meyer‐Lindenberg A, Nichols T, Callicott JH, Ding J, Kolachana B, Buckholtz J, Mattay VS, Egan M, Weinberger DR (2006): Impact of complex genetic variation in COMT on human brain function. Mol Psychiatry 11:867–877, 797. [DOI] [PubMed] [Google Scholar]
- Mier D, Kirsch P, Meyer‐Lindenberg A (2010): Neural substrates of pleiotropic action of genetic variation in COMT: A meta‐analysis. Mol Psychiatry 15:918–927. [DOI] [PubMed] [Google Scholar]
- Miller MI, Qiu A (2009): The emerging discipline of computational functional anatomy. NeuroImage 45:S16–S39. [DOI] [PMC free article] [PubMed] [Google Scholar]
- Mondadori CR, de Quervain DJ, Buchmann A, Mustovic H, Wollmer MA, Schmidt CF, Boesiger P, Hock C, Nitsch RM, Papassotiropoulos A, Henke K (2007): Better memory and neural efficiency in young apolipoprotein E epsilon4 carriers. Cerebral cortex (New York, N.Y.: 1991) 17:1934–1947. [DOI] [PubMed] [Google Scholar]
- Murray LJ, Ranganath C (2007): The dorsolateral prefrontal cortex contributes to successful relational memory encoding. J Neurosci 27:5515–5522. [DOI] [PMC free article] [PubMed] [Google Scholar]
- Murray MM, Wallace MT (2011): The Neural Bases of Multisensory Processes. Boca Raton, FL: CRC Press. [PubMed] [Google Scholar]
- Nagel IE, Chicherio C, Li SC, von Oertzen T, Sander T, Villringer A, Heekeren HR, Backman L, Lindenberger U (2008): Human aging magnifies genetic effects on executive functioning and working memory. Front Hum Neurosci 2:1 [DOI] [PMC free article] [PubMed] [Google Scholar]
- Nobre AC, Kastner S. (2014): The Oxford Handbook of Attention. Oxford: OUP. [Google Scholar]
- Nyberg L, Andersson M, Kauppi K, Lundquist A, Persson J, Pudas S, Nilsson LG (2014): Age‐related and genetic modulation of frontal cortex efficiency. J Cognit Neurosci 26:746–754. [DOI] [PubMed] [Google Scholar]
- Oliphant A, Barker DL, Stuelpnagel JR, Chee MS (2002): BeadArray technology: Enabling an accurate, cost‐effective approach to high‐throughput genotyping. BioTechniques Suppl:56–58. 60‐1. [PubMed] [Google Scholar]
- Panizzon MS, Fennema‐Notestine C, Eyler LT, Jernigan TL, Prom‐Wormley E, Neale M, Jacobson K, Lyons MJ, Grant MD, Franz CE, Xian H, Tsuang M, Fischl B, Seidman L, Dale A, Kremen WS (2009): Distinct genetic influences on cortical surface area and cortical thickness. Cereb. Cortex 19:2728–2735. [DOI] [PMC free article] [PubMed] [Google Scholar]
- Papenberg G, Backman L, Nagel IE, Nietfeld W, Schroder J, Bertram L, Heekeren HR, Lindenberger U, Li SC (2014): COMT polymorphism and memory dedifferentiation in old age. Psychol Aging 29:374–383. [DOI] [PubMed] [Google Scholar]
- Parasuraman R, Greenwood PM, Sunderland T (2002): The apolipoprotein E gene, attention, and brain function. Neuropsychology 16:254–274. [DOI] [PMC free article] [PubMed] [Google Scholar]
- Peper JS, Brouwer RM, Boomsma DI, Kahn RS, Hulshoff Pol HE (2007): Genetic influences on human brain structure: A review of brain imaging studies in twins. Hum Brain Mapp 28:464–473. [DOI] [PMC free article] [PubMed] [Google Scholar]
- Plassman BL, Welsh‐Bohmer KA, Bigler ED, Johnson SC, Anderson CV, Helms MJ, Saunders AM, Breitner JC (1997): Apolipoprotein E epsilon 4 allele and hippocampal volume in twins with normal cognition. Neurology 48:985–989. [DOI] [PubMed] [Google Scholar]
- Pruessner JC, Collins DL, Pruessner M, Evans AC (2001): Age and gender predict volume decline in the anterior and posterior hippocampus in early adulthood. J Neurosci 21:194–200. [DOI] [PMC free article] [PubMed] [Google Scholar]
- Qian QJ, Wang YF, Yang L, Li J, Guan LL, Chen Y, Ji N, Liu L (2009): [Association study of intelligence of attention deficit hyperactivity disorder children in China]. Beijing da xue xue bao. Yi xue ban = Journal of Peking University. Health Sci 41:285–290. [PubMed] [Google Scholar]
- Raz, N. (2000) Aging of the brain and its impact on cognitive performance: Integration of structural and functional findings In: Salthouse FIMCTA, editor. The Handbook of Aging and Cognition, 2nd ed Mahwah, NJ, US: Lawrence Erlbaum Associates Publishers; pp 1–90. [Google Scholar]
- Raz N, Rodrigue KM, Head D, Kennedy KM, Acker JD (2004): Differential aging of the medial temporal lobe: A study of a five‐year change. Neurology 62:433–438. [DOI] [PubMed] [Google Scholar]
- Raz N, Ghisletta P, Rodrigue KM, Kennedy KM, Lindenberger U (2010): Trajectories of brain aging in middle‐aged and older adults: Regional and individual differences. NeuroImage 51:501–511. [DOI] [PMC free article] [PubMed] [Google Scholar]
- Raznahan A, Greenstein D, Lee Y, Long R, Clasen L, Gochman P, Addington A, Giedd JN, Rapoport JL, Gogtay N (2011): Catechol‐o‐methyl transferase (COMT) val158met polymorphism and adolescent cortical development in patients with childhood‐onset schizophrenia, their non‐psychotic siblings, and healthy controls. NeuroImage 57:1517–1523. [DOI] [PMC free article] [PubMed] [Google Scholar]
- Roffman JL, Gollub RL, Calhoun VD, Wassink TH, Weiss AP, Ho BC, White T, Clark VP, Fries J, Andreasen NC, Goff DC, Manoach DS (2008): MTHFR 677C –> T genotype disrupts prefrontal function in schizophrenia through an interaction with COMT 158Val –> Met. Proc Natl Acad Sci U S A 105:17573–17578. [DOI] [PMC free article] [PubMed] [Google Scholar]
- Rowe JB, Hughes L, Williams‐Gray CH, Bishop S, Fallon S, Barker RA, Owen AM (2010): The val158met COMT polymorphism's effect on atrophy in healthy aging and Parkinson's disease. Neurobiol Aging 31:1064–1068. [DOI] [PMC free article] [PubMed] [Google Scholar]
- Salat DH, Buckner RL, Snyder AZ, Greve DN, Desikan RS, Busa E, Morris JC, Dale AM, Fischl B (2004): Thinning of the cerebral cortex in aging. Cereb Cortex 14:721–730. [DOI] [PubMed] [Google Scholar]
- Sambataro F, Murty VP, Callicott JH, Tan HY, Das S, Weinberger DR, Mattay VS (2010): Age‐related alterations in default mode network: Impact on working memory performance. Neurobiol Aging 31:839–852. [DOI] [PMC free article] [PubMed] [Google Scholar]
- Sannino S, Gozzi A, Cerasa A, Piras F, Scheggia D, Manago F, Damiano M, Galbusera A, Erickson LC, De Pietri Tonelli D, Bifone A, Tsaftaris SA, Caltagirone C, Weinberger DR, Spalletta G, Papaleo F (2014): COMT Genetic Reduction Produces Sexually Divergent Effects on Cortical Anatomy and Working Memory in Mice and Humans. Cerebral Cortex (New York, N.Y.: 1991). [DOI] [PMC free article] [PubMed] [Google Scholar]
- Scahill RI, Frost C, Jenkins R, Whitwell JL, Rossor MN, Fox NC (2003): A longitudinal study of brain volume changes in normal aging using serial registered magnetic resonance imaging. Arch Neurol 60:989–994. [DOI] [PubMed] [Google Scholar]
- Schiavetto A, Kohler S, Grady CL, Winocur G, Moscovitch M (2002): Neural correlates of memory for object identity and object location: Effects of aging. Neuropsychologia 40:1428–1442. [DOI] [PubMed] [Google Scholar]
- Spreng RN, Grady CL (2010): Patterns of brain activity supporting autobiographical memory, prospection, and theory of mind, and their relationship to the default mode network. J Cognit Neuroscience 22:1112–1123. [DOI] [PubMed] [Google Scholar]
- Stephens M, Donnelly P (2003): A comparison of bayesian methods for haplotype reconstruction from population genotype data. Am J Hum Genet 73:1162–1169. [DOI] [PMC free article] [PubMed] [Google Scholar]
- Stokes PR, Rhodes RA, Grasby PM, Mehta MA (2011): The effects of the COMT Val108/158Met polymorphism on BOLD activation during working memory, planning, and response inhibition: A role for the posterior cingulate cortex? Neuropsychopharmacology 36:763–771. [DOI] [PMC free article] [PubMed] [Google Scholar]
- Takahashi H, Takano H, Kodaka F, Arakawa R, Yamada M, Otsuka T, Hirano Y, Kikyo H, Okubo Y, Kato M, Obata T, Ito H, Suhara T (2010): Contribution of dopamine D1 and D2 receptors to amygdala activity in human. J Neurosci 30:3043–3047. [DOI] [PMC free article] [PubMed] [Google Scholar]
- Thompson PM, Cannon TD, Narr KL, van Erp T, Poutanen VP, Huttunen M, Lonnqvist J, Standertskjold‐Nordenstam CG, Kaprio J, Khaledy M, Dail R, Zoumalan CI, Toga AW (2001): Genetic influences on brain structure. Nat Neurosci 4:1253–1258. [DOI] [PubMed] [Google Scholar]
- Tian T, Qin W, Liu B, Wang D, Wang J, Jiang T, Yu C (2013): Catechol‐O‐methyltransferase Val158Met polymorphism modulates gray matter volume and functional connectivity of the default mode network. PloS One 8:e78697 [DOI] [PMC free article] [PubMed] [Google Scholar]
- Tunbridge EM, Bannerman DM, Sharp T, Harrison PJ (2004): Catechol‐o‐methyltransferase inhibition improves set‐shifting performance and elevates stimulated dopamine release in the rat prefrontal cortex. J Neurosci 24:5331–5335. [DOI] [PMC free article] [PubMed] [Google Scholar]
- Tunbridge EM, Farrell SM, Harrison PJ, Mackay CE (2013): Catechol‐O‐methyltransferase (COMT) influences the connectivity of the prefrontal cortex at rest. NeuroImage 68:49–54. [DOI] [PMC free article] [PubMed] [Google Scholar]
- Ungerleider LG, Courtney SM, Haxby JV (1998): A neural system for human visual working memory. Proc Natl Acad Sci U S A 95:883–890. [DOI] [PMC free article] [PubMed] [Google Scholar]
- Wang Q, Zhang B, Wang YE, Xiong WC, Mei L (2008): The Ig1/2 domain of MuSK binds to muscle surface and is involved in acetylcholine receptor clustering. Neurosignals 16:246–253. [DOI] [PubMed] [Google Scholar]
- Wang Y, Li J, Chen C, Chen C, Zhu B, Moysis RK, Lei X, Li H, Liu Q, Xiu D, Liu B, Chen W, Xue G, Dong Q (2013): COMT rs4680 Met is not always the 'smart allele': Val allele is associated with better working memory and larger hippocampal volume in healthy Chinese. Genes, Brain, Behav 12:323–329. [DOI] [PubMed] [Google Scholar]
- Xia H, Wu N, Su Y (2012): Investigating the genetic basis of theory of mind (ToM): The role of catechol‐O‐methyltransferase (COMT) gene polymorphisms. PloS One 7:e49768 [DOI] [PMC free article] [PubMed] [Google Scholar]
- Xu G, McLaren DG, Ries ML, Fitzgerald ME, Bendlin BB, Rowley HA, Sager MA, Atwood C, Asthana S, Johnson SC (2009): The influence of parental history of Alzheimer's disease and apolipoprotein E epsilon4 on the BOLD signal during recognition memory. Brain 132:383–391. [DOI] [PMC free article] [PubMed] [Google Scholar]
- Zhang K, Zheng Z, Gao X, Li J, Zhang F (2007): Possible relationship between the COMT gene ValMet polymorphism and psychometric IQ in girls of the Qinba region in China. Neuropsychobiology 56:98–103. [DOI] [PubMed] [Google Scholar]
- Zhong J, Qiu A (2010): Multi‐manifold diffeomorphic metric mapping for aligning cortical hemispheric surfaces. Neuroimage 49:355–365. [DOI] [PubMed] [Google Scholar]
- Zhu D, Yang Z, Luo Z, Luo S, Xiong WC, Mei L (2008): Muscle‐specific receptor tyrosine kinase endocytosis in acetylcholine receptor clustering in response to agrin. J Neurosci 28:1688–1696. [DOI] [PMC free article] [PubMed] [Google Scholar]
Associated Data
This section collects any data citations, data availability statements, or supplementary materials included in this article.
Supplementary Materials
Supporting Information