

Abstract
Diffusion models are advantageous for examining brain microstructure non‐invasively and their validation is important for transference into the clinical domain. Neurite Orientation Dispersion and Density Imaging (NODDI) is a promising model for estimating multiple diffusion compartments from MRI data acquired in a clinically feasible time. As a relatively new model, it is necessary to examine NODDI under certain experimental conditions, such as change in magnetic field‐strength, and assess it in relation to diffusion tensor imaging (DTI), an established model that is largely understood by the neuroimaging community. NODDI measures (intracellular volume fraction, ν ic, and orientation distribution, OD) were compared with DTI at 1.5 and 3 T data in healthy adults in whole‐brain tissue masks and regions of white‐ and deep grey‐matter. Within‐session reproducibility and between‐subject differences of NODDI with field‐strength were also investigated. Field‐strength had a significant effect on NODDI measures, suggesting careful interpretation of results from data acquired at 1.5 and 3 T. It was demonstrated that NODDI is feasible at 1.5 T, but with lower ν ic in white‐matter regions compared with 3 T. Furthermore, the advantages of NODDI over DTI in a region of complex microstructure were shown. Specifically, in the centrum‐semiovale where FA is typically as low as in grey‐matter, ν ic was comparable to other white‐matter regions yet accompanied by an OD similar to deep grey‐matter. In terms of reproducibility, NODDI measures varied more than DTI. It may be that NODDI is more susceptible to noisier parameter estimates when compared with DTI, conversely it may have greater sensitivity to true within‐ and between‐subject heterogeneity. Hum Brain Mapp 37:4550–4565, 2016. © 2016 Wiley Periodicals, Inc.
Keywords: neurite density, orientation dispersion, magnetic field strength, diffusion tensor, reproducibility
Abbreviations
- CS
centrum semiovale
- CV
coefficient of variation
- OD
orientation dispersion
- νic
intracellular volume fraction
- νiso
extracellular volume fraction
INTRODUCTION
Diffusion magnetic resonance imaging (MRI) enables non‐invasive investigation of brain microstructure. This is achieved by measuring the bulk displacement of water molecules diffusing in the brain in any direction in space. The diffusion scatter‐patterns of water molecules are dictated by the underlying brain architecture. For example, myelinated white matter axons result in preferential diffusion in the orientation of the white matter pathways, whilst hindering diffusion perpendicular to the tracts. In contrast, the ventricles of the brain allow water molecules to diffuse freely in any direction. Thus, the underlying tissue structure can be inferred from measuring the displacement of diffusing water molecules. The advent of diffusion MRI prompted a number of techniques to model brain microstructure. The earliest model was the diffusion tensor, (DTI, diffusion tensor imaging), a 3 × 3 symmetric matrix characterising diffusion as a Gaussian distribution in three orthogonal directions [Basser et al., 1994]. The most commonly used DTI measures are mean diffusivity (MD, the average displacement of water molecules) and fractional anisotropy (FA, the degree of directionality exhibited by diffusing molecules) [Pierpaoli and Basser, 1996a]. A simple yet powerful model, DTI is able to detect significant structural deficits in a number of patient groups [Ciumas et al., 2014; Mahoney et al., 2014; Zarei et al., 2009] as well as quantitatively measure microstructural change in the brain with age [Lebel and Beaulieu, 2011; Yoshida et al., 2013]. Although prevalent in neurological research, DTI is not sufficient for modelling non‐Gaussian diffusion scatter‐patterns, and therefore more complex configurations of tissue structure [Alexander et al., 2002; Seunarine and Alexander, 2009]. Furthermore, as a general model, it lacks specificity: a decrease in FA may be attributed to either or both: (1) a loss in structural integrity (such as demyelination, or reduction in axonal density) and (2) an increase in complexity of tissue structure by way of increase in axonal size, packing density, or change in the degree of axonal dispersion and alignment. To address this, several models have been developed to describe diffusion as a series of compartments representing different pools of water that independently contribute to the overall diffusion MRI signal [Assaf and Basser, 2005; Assaf et al., 2008; Behrens et al., 2003; Clark and Le Bihan, 2000].
One such model is Neurite Orientation Dispersion and Density Imaging (NODDI) [Zhang et al., 2012], a multicompartment diffusion model with particular advantage in providing useful microstructural indices from multishell diffusion MRI data that can be acquired in a clinically feasible time. NODDI output parameters are intracellular volume fraction, ν ic, orientation dispersion index (OD) and the extracellular volume fraction, ν iso. The intracellular volume is considered a measure of neurite density, representing the space bound within the neuronal membrane. It is modelled by a collection of sticks which can be coherently aligned in a single direction as in white matter, exhibit dispersion around the mean fibre orientation to model more complex diffusion patterns from fanning or bending fibres, or distributed uniformly on a sphere to reflect the disperse structural properties of deep and cortical grey matter tissue. High values of ν ic represent greater neurite density or packing of neuronal tissue. OD measures the dispersion of the modelled sticks. Regions of highly organised white matter such as the corpus callosum will have low OD values, whereas grey matter will have high OD. The extracellular component models the free water compartment. These NODDI output parameters have been found to be associated with FA. Specifically, FA is a composite of both ν ic and OD, thus NODDI is able to depict brain microstructure as two separate disentangled facets of FA [Kunz et al., 2014; Zhang et al., 2012]. In epilepsy patients, focal cortical dysplasia were clearly identified by a decrease in ν ic when the affected areas were more difficult to detect on DTI and anatomical images [Winston et al., 2014]. In spinal cord imaging for a multiple sclerosis study, NODDI demonstrated a significant decrease in patient ν ic compared with controls [Grussu et al., 2013]. NODDI has also shown promise at determining significantly different measures of ν ic and OD between white matter regions at varying stages of the myelination process in neonatal brain development [Kunz et al., 2014]. In addition, neocortical OD has been found to significantly decrease with age in normal adults [Nazeri et al., 2015].
A long‐term goal for neuroimaging techniques is to be able to confidently utilise them in a clinical setting. Thus, it is important to validate diffusion models and understand how they may vary with changes in experimental or acquisition conditions which may impact how one interprets results. One such condition is the magnetic field strength of the MRI scanner. Previous investigations of field strength effect on DTI have produced variable results. Some studies found no significant change in DTI measures with field strength [Ding et al., 2007; Hunsche et al., 2001]. Many, however, have found field strength to significantly alter DTI measures in normal brain. That is, an increase in FA, decrease in MD and an increase in the precision of dominant orientation estimates in white matter (the tensor's principal eigenvector, ε1) at higher field strength as signal‐to‐noise (SNR) increases [Chung et al., 2013; Fushimi et al., 2007; Huisman et al., 2006; Qin et al., 2009]. In addition, a decrease in SNR has been shown to cause an upward bias in FA, particularly if the true FA is low as in grey matter [Farrell et al., 2007; Pierpaoli and Basser, 1996a], and reduce the certainty in ε1 estimates [Alexander and Barker, 2005; Farrell et al., 2007]. Given that field strength can significantly impact DTI measures and that associations between FA and NODDI have been found, we sought to determine the effect, if any, of magnetic field strength on estimated NODDI parameters.
The work presented here has two general aims: (1) to determine the effect of magnetic field strength on the NODDI model in whole brain tissue masks and in selected white and grey matter regions of interest (ROI), and (2) to assess the within‐session reproducibility and between‐subject variability of NODDI in a cohort of healthy subjects. In this work, we consider NODDI and DTI derived measures.
MATERIALS AND METHODS
Subjects
Eight healthy subjects (five males and three females; age range 23–27 years; median age 26) with no history of neurologic or other systemic diseases were scanned. Subjects were scanned according to local ethics approval and all gave written informed consent.
Image Acquisition
Data were acquired on a 1.5 T (Avanto, Siemens, Erlangen, Germany) and 3 T MRI scanner (Trio, Siemens, Erlangen, Germany). Both systems have a maximal gradient strength of 40 mT/m. The same, identical diffusion MRI protocol was applied on both 1.5 and 3 T systems. Images were acquired with a double refocused pulsed diffusion‐weighted echo‐planar sequence [Reese et al., 2003]. Sequence parameters were: TR = 4,100 ms; TE = 112 ms; matrix size = 96 × 96; field of view (FOV) = 240 × 240 mm2; number of averages = 2. Voxel dimensions were 2.5 × 2.5 × 5 mm3, with 25 axial slices for full brain coverage. Diffusion gradients were applied in 20 non‐collinear directions at b‐values 1,000, 2,000 and 3,000 s/mm2, following a single non‐diffusion weighted acquisition. Increasing diffusion‐weighting was achieved by increasing gradient amplitude whilst the diffusion time remained fixed and was unchanged. Four repeats of the acquisition protocol were performed for each volunteer within the same scanning session (i.e., four b = 0 s/mm2 acquisitions and 240 diffusion‐weighted volumes). Magnetic field homogeneity was maintained by including a shimming routine prior to scanning a subject, and in between each of the four repeats. T1‐weighted images were also acquired with a 3D FLASH sequence and parameters are as follows: For 1.5 T: TR/TE = 11/5 ms, flip angle 15°, matrix = 256 × 224, 256 sagittal slices were acquired with voxel dimensions = 1 × 1 × 1 mm3. For 3 T: TR/TE = 1,500/2.9 ms, flip angle = 10°, FOV = 211 × 211 mm2, matrix size = 192 × 192, 208 sagittal slices were acquired with voxel dimensions = 1.1 × 1.1 × 1.1 mm3. Subject movement was minimised by strapping the subject's head into place and using sponges for additional support. A scan session lasted approximately 40 minutes, and subjects were scanned 2 weeks apart between their 1.5 and 3 T scan.
Image Registration
Diffusion‐weighted data were co‐registered as follows [Hall and Barrick, 2012]: For each of the four repeats, the acquired twenty directions of diffusion data were averaged on a per b‐value basis (thus giving an averaged volume of diffusion‐weighted images at b = 1,000, 2,000 and 3,000 s/mm2, i.e., a total of three volumes for each repeat). Each averaged b volume was registered to its respective b = 0 image using FMRIB Linear Image Registration Tool, FLIRT [Jenkinson and Smith, 2001; Jenkinson et al., 2002] and the relevant transformation matrix applied to the original, corresponding b‐value diffusion‐weighted volumes. Visual inspection of all b = 0 data revealed no discernible subject motion differences between repeats. To register all diffusion acquisitions into a common space, the b = 0 volume from acquisitions 2–4 were registered to the first acquired b = 0 volume and the transformation matrices applied to corresponding diffusion‐weighted volumes [Jenkinson and Smith, 2001; Jenkinson et al., 2002]. The ‘master’ diffusion dataset was the average of all four acquisitions. This registration protocol was applied on each subject's data at 1.5 and 3 T.
Defining Tissue Masks and ROI
T1‐weighted acquisitions were skull‐stripped (Brain Extraction Tool [Smith, 2002]) and segmented into white, grey and CSF (cerebral spinal fluid) masks using FMRIB's Automated Segmentation Tool, FAST [Zhang et al., 2001]. The master b = 0 volume was registered to T1‐weighted image space [Jenkinson and Smith, 2001; Jenkinson et al., 2002]. The inverse warp was then calculated and applied to the binarised segmentations to transfer them into diffusion space. Regions of deep grey matter structure were erroneously included in the white matter segment defined by FAST due to their similarity in signal intensities on T1‐weighted images. The following steps were performed to ensure deep grey matter voxels were omitted from white matter and instead included in the grey matter mask. Bilateral ROI of the thalamus, putamen, caudate and pallidum were extracted from T1‐weighted images (FMRIB's Integrated Registration and Segmentation Tool [FIRST] [Patenaude et al., 2011]), mapped to b = 0 space and masked out of the white matter segment. All deep grey ROI were next eroded by a single voxel and added to the grey matter segment. Masks were defined for each subject on 1.5 and 3 T data.
White matter ROIs were manually drawn in the genu and splenium of the corpus callosum, and bilaterally in the centrum semiovale (CS). These regions were identified for each subject on the master b = 0 volume. Deep grey matter ROI were defined on T1‐weighted images using FIRST [Patenaude et al., 2011] to automatically segment bilateral regions of the thalamus and putamen. These ROI were eroded (to ensure coverage was strictly within the deep grey matter structures) and mapped into diffusion space by applying the inverse to the transform that registered the average b = 0 image to T1‐weighted image space. All ROI were identified at 1.5 and 3 T in native space. (See Supporting Information Table S1 for information on the size of all ROI.)
Diffusion Model Fitting
The diffusion tensor was calculated using linear least squares fitted to the log of the signals at b = 0 and 1,000 s/mm2 in the master dataset [Basser et al., 1994]. FA and MD maps were then computed [Pierpaoli and Basser, 1996a]. For NODDI, intra‐, extracellular volume fraction and orientation dispersion maps were computed (NODDI Matlab Toolbox http://www.nitrc.org/projects/noddi_toolbox) using all four diffusion averages concatenated into a single file, that is, not the master dataset. Default NODDI settings were used [Zhang et al., 2012], specifically, the isotropic and intrinsic diffusivities of the intra‐neurite compartments were set to 3.00 and 1.70 µm2/ms, respectively. These models were fitted to both field strength data. Mean FA, MD, ν ic, OD and ν iso values were extracted from white and grey matter masks and all ROI. For the remainder of this article, all NODDI and DTI measures are collectively termed as diffusion measures.
Calculating SNR Change with Field Strength
The SNR was calculated at each field strength using a single‐ROI, multiple b = 0 acquisition technique implemented in Camino [Cook et al., 2006]. For an ROI with N voxels, and K number of b = 0 acquisitions (in our dataset, K = 4), σ i is the standard deviation of the signal at voxel i in the ROI across all b = 0 volumes:
where i = 1, … N and S i1 is the signal at voxel i in the first b = 0 acquisition. The average standard deviation over all voxels in the ROI is determined as:
The SNR is then calculated as the mean signal in the ROI across all averages, divided by the average standard deviation:
SNR was calculated for all subjects at 1.5 and 3 T in the genu and splenium of the corpus callosum ROI.
Experiment A: Magnetic Field Strength Effect on NODDI
To test the association between NODDI parameters and FA, Spearman's correlation was performed across all subjects on all voxels in white and grey matter masks (see Supporting Information Fig. S1 for scatter plots of NODDI measures vs. FA). To investigate the relationship between ν ic and OD in terms of FA, voxels within each tissue mask were stratified according to FA. Pearson's correlation coefficients were calculated at each FA strata. All tests were performed on both 1.5 and 3 T data.
The distribution of each NODDI parameter was analysed with frequency histograms for each subject, both tissue masks and both field strengths. Histogram frequencies were normalised by the number of voxels in each mask. Diffusion measure changes were compared between field strength using paired t‐tests on median values and two histogram parameters: diffusion measure at peak height and the normalised frequency at peak height (NFPH). Mean FA and NODDI measures calculated from ROI were compared between field strengths with paired t‐tests. Percentage change was calculated for all tests for ease of comparison.
Experiment B: NODDI Reproducibility
Within‐session reproducibility
DTI and NODDI were fitted to each of the four diffusion‐weighted repeats acquired, that is, four FA, MD, ν ic, OD, ν iso volumes were computed for each subject, at 1.5 and 3 T. Mean diffusion measures for all ROI were calculated from each of the four acquisition volumes. To test for significant within‐session variations of DTI and NODDI parameters, one‐way ANOVA with main factor acquisition number were performed. The coefficient of variation, CV = (standard deviation/mean) × 100, of all mean ROI diffusion measures across the four acquisitions was also calculated for each subject and field strength.
Between‐subject variability
Two between‐subject coefficients of variations were determined: ‘CVMaster’ was calculated using mean ROI diffusion measures across subjects, derived from fitting DTI and NODDI to the master dataset. ‘CVSingle’ was calculated using mean ROI diffusion measures across subjects, derived from fitting DTI and NODDI to a single acquisition. The inter‐subject CV was computed for each of the four acquisitions, and CVSingle denotes the mean of all four CV. To test field strength effect on between‐subject variability, paired t‐tests were performed on inter‐subject CV computed from each of the four acquisitions (i.e., CVSingle).
RESULTS
SNR Change with Field Strength
The SNR calculated at 1.5 and 3 T are in Table 1. SNR was greater at 3 T, compared with 1.5 T by a ratio of 1:1.35 and 1:1.56 in the genu and splenium, respectively.
Table 1.
Group mean SNR calculated on 1.5 and 3 T b = 0 s/mm2 volumes in the genu and splenium ROI
| 1.5 T | 3 T | |
|---|---|---|
| Genu | 10.85 ± 5.94 | 14.60 ± 6.47 |
| Splenium | 15.54 ± 8.54 | 24.28 ± 9.40 |
Mean ± standard deviation.
Experiment A: Magnetic Field Strength Effect on NODDI
Axial slices of FA and NODDI parameters at 1.5 and 3 T are presented in Figure 1 for a representative subject (another example candidate can be found in Supporting Information Fig. S2). Similar to FA, OD intensities varied in multi‐fibre regions to reflect microstructural complexity whereas ν ic intensities remained fairly homogeneous (see the fronto‐pericallosal region, Fig. 1b,c). Spurious voxels with high OD were also noticeable in tissue boundary regions (Fig. 1a). Regions containing complex white matter configuration, as in the centrum semiovale, showed slightly elevated ν iso values compared with regions of high anisotropy such as the genu of the corpus callosum. Interestingly, elevated ν iso values were also apparent in the posterior limb of the internal capsule, and are particularly noticeable at 3 T (Fig. 1b).
Figure 1.
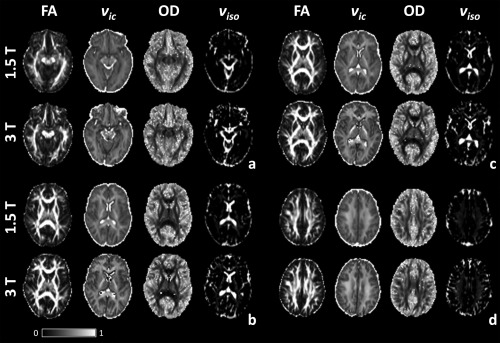
FA, ν ic, OD and ν iso maps at 1.5 and 3 T for four axial slices (a = slice 9, b = 12, c = 13 and d = 17).
There were differences in all NODDI measures in relation to field strength. ν ic maps at 3 T showed greater definition between white and grey matter, for example in the posterior region of the superior longitudinal fasciculus extending out to the gyri in Figure 1b,c. White matter in ν ic maps also had greater intensity at 3 T than at 1.5 T. This was most apparent in the posterior limb of the internal capsule (Fig. 1b,c). OD maps contained greater contrast between white and grey tissues with increasing field strength. ν iso demonstrated greater intensities at 3 T than at 1.5 T, particularly in regions of complex fibre configurations such as the centrum semiovale (Fig. 1d).
Whole Brain Tissue Mask Analysis
Correlations between each NODDI parameter with FA revealed greater association in white matter than in grey for both field strengths (Table 2). OD exhibited the largest association with FA in both tissues, followed by ν ic. 1.5 T data generally showed greater correlation coefficients than at 3 T (with the exception of grey matter ν iso).
Table 2.
Spearman's correlation coefficient, r, between NODDI parameters and FA in whole brain white and grey matter masks for all subjects
| 1.5 T | 3 T | ||
|---|---|---|---|
| White matter | ν ic | r = 0.6962 | r = 0.6154 |
| OD | r = −0.9067 | r = −0.8559 | |
| ν iso | r = 0.1965 | r = 0.1198 | |
| Grey matter | ν ic | r = 0.5433 | r = 0.5206 |
| OD | r = −0.8032 | r = −0.6835 | |
| ν iso | r = −0.1742 | r = −0.2434 |
All correlations were significant with P‐value <0.0001.
Figure 2 plots ν ic versus OD for voxels stratified by FA in white and grey matter at 1.5 and 3 T. The plots revealed positive correlations between ν ic and OD for both tissue types within each FA strata (except for FA below 0.2 and 0.1 in white and grey matter, respectively). As field strength increased, there was an upward spread of data in the direction of greater ν ic with more data points at the 0.7–1.0 FA range in white matter. For both field strengths and tissue masks, the correlation coefficient steadily rose with increasing FA with greater associations found between NODDI measures at 1.5 T compared with 3 T for all FA strata (Table 3).
Figure 2.

Scatter plots of ν ic versus OD (y‐ and x‐axis, respectively) in white and grey matter (top and bottom row, respectively), at 1.5 and 3 T (left and right column, respectively) for all subjects. Each data point is coloured according to its FA value. Legends show FA stratas in white and grey matter, respectively. [Color figure can be viewed at http://wileyonlinelibrary.com]
Table 3.
Pearson's correlation coefficient, r, between ν ic and OD for each FA strata in whole brain white and grey matter masks, for all subjects
| FA strata | 1.5 T | 3 T | |
|---|---|---|---|
| White matter | 0.0–0.2 | r = −0.0935 | r = −0.0857 |
| 0.2–0.3 | r = 0.2715 | r = 0.2619 | |
| 0.3–0.4 | r = 0.3554 | r = 0.3426 | |
| 0.4–0.5 | r = 0.4721 | r = 0.4246 | |
| 0.5–0.6 | r = 0.4808 | r = 0.4818 | |
| 0.6–0.7 | r = 0.5463 | r = 0.4997 | |
| 0.7–1.0 | r = 0.7308 | r = 0.5124 | |
| Grey matter | 0.0–0.1 | r = 0.0564 | r = −0.0562 |
| 0.1–0.2 | r = 0.1094 | r = 0.0515 | |
| 0.2–0.3 | r = 0.2624 | r = 0.2776 | |
| 0.3–0.4 | r = 0.4191 | r = 0.4509 | |
| 0.4–0.6 | r = 0.6638 | r = 0.6580 |
All correlations were significant with P < 0.0001.
Figure 3 shows mean normalised histograms across all subjects. A table of the corresponding histogram measures, and results from statistical tests with field strength are in Supporting Information Table S2. White matter median FA, ν ic and ν iso were significantly greater and OD significantly smaller at 3 T versus 1.5 T (all P < 0.004, Supporting Information Table S2). In grey matter, both DTI and NODDI trends varied with increasing field strength. The frequency peaks observed between OD values 0.9 and 1.0 stem from voxels at grey and white tissue boundaries.
Figure 3.
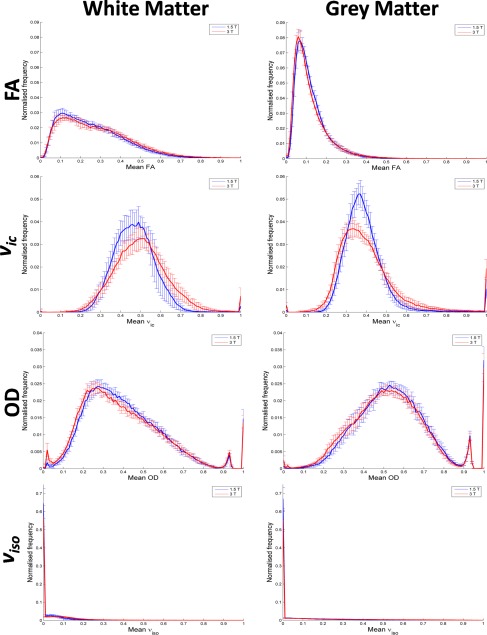
Mean normalised frequency histograms for FA and NODDI parameters in white and grey matter (left and right column, respectively). Histograms plot the mean across all eight subjects. 1.5 and 3 T data are in blue and red, respectively. Error bars represent standard deviations. [Color figure can be viewed at http://wileyonlinelibrary.com]
ROI Analysis of NODDI
Figure 4 are boxplots of FA and NODDI parameters at 1.5 and 3 T in tested ROI across all subjects. FA and ν ic had significantly greater values at 3 T versus 1.5 T in all white matter ROI and the thalamus (only the centrum semiovale FA increase was not significant), and significantly lower in the putamen (Fig. 4a,b, Table 4).
Figure 4.
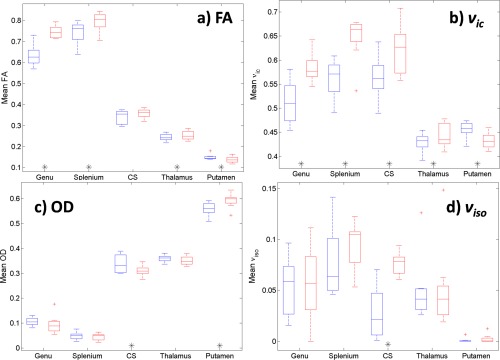
Boxplots of mean (a) FA, (b) ν ic, (c) OD and (d) ν iso for each ROI tested across all subjects. 1.5 T and 3 T data are in blue and red, respectively. Paired t‐tests significance at the level P < 0.05 for measures between field strengths are denoted by ‘*’ along the x‐axis beneath the corresponding ROI. [Color figure can be viewed at http://wileyonlinelibrary.com]
Table 4.
Mean (standard deviation) diffusion measures across all subjects at 1.5 and 3 T for all ROI
| 1.5 T | 3 T | Mean % change with increasing field strength | P‐value | ||
|---|---|---|---|---|---|
| Genu | FA | 0.633 (0.0510) | 0.745 (0.0293) | 17.72 | <0.001*† |
| ν ic | 0.512 (0.0447) | 0.584 (0.0296) | 14.00 | 0.004* | |
| OD | 0.106 (0.0161) | 0.095 (0.0385) | −10.62 | 0.311 | |
| ν iso | 0.054 (0.0291) | 0.057 (0.0378) | 5.70 | 0.870 | |
| Splenium | FA | 0.743 (0.0535) | 0.794 (0.0472) | 6.96 | 0.018* |
| ν ic | 0.561 (0.0420) | 0.646 (0.0479) | 15.02 | 0.001*† | |
| OD | 0.049 (0.0158) | 0.044 (0.0143) | −8.79 | 0.202 | |
| ν iso | 0.077 (0.0343) | 0.094 (0.0240) | 22.41 | 0.236 | |
| Centrum semiovale | FA | 0.341 (0.0331) | 0.358 (0.0221) | 5.14 | 0.067 |
| ν ic | 0.564 (0.0440) | 0.622 (0.0516) | 10.26 | 0.033* | |
| OD | 0.338 (0.0362) | 0.310 (0.0211) | −8.34 | 0.012* | |
| ν iso | 0.028 (0.0260) | 0.076 (0.0110) | 176.18 | 0.003* | |
| Thalamus | FA | 0.244 (0.0167) | 0.253 (0.0215) | 3.96 | 0.046* |
| ν ic | 0.429 (0.0195) | 0.443 (0.0252) | 3.39 | 0.023* | |
| OD | 0.360 (0.0138) | 0.351 (0.0182) | −2.38 | 0.075 | |
| ν iso | 0.050 (0.0324) | 0.051 (0.0417) | 2.70 | 0.834 | |
| Putamen | FA | 0.150 (0.0129) | 0.138 (0.0156) | −8.24 | 0.029* |
| ν ic | 0.456 (0.0171) | 0.432 (0.0167) | −5.15 | <0.001*† | |
| OD | 0.559 (0.0272) | 0.592 (0.0295) | 6.03 | 0.012* | |
| ν iso | 0.001 (0.0023) | 0.002 (0.0043) | 140.37 | 0.107 |
Paired t‐test results testing diffusion measures between field strengths are presented. ‘*’ indicates significance of P < 0.05. ‘†’ indicates significance following Bonferroni correction for multiple comparisons testing (P < 0.05/20 t‐tests).
OD decreased with increasing field strength in all white matter ROI and thalamus, only the centrum semiovale was statistically significant. The putamen OD exhibited an opposite, significant trend compared to all other ROI (Fig. 4c). ν iso was highly variable between ROI and field strengths, particularly in white matter regions (Fig. 4d), and generally increased with field strength. White matter and thalamus ROI had larger ν iso than in the putamen for both field strengths (Table 4).
Experiment B: NODDI Reproducibility
One‐way ANOVA analysis showed no significant effect of acquisition number on mean DTI and NODDI parameters in all ROI at both field strengths (all F(3,28) < 2.947, P > 0.15), with the exception of ν ic in the genu at 3 T (F = 4.19, P = 0.01). Thus the majority of diffusion parameters analysed did not significantly change across our four repeated acquisitions. It should be noted that the co‐registration of acquisitions 2 through 4 to acquisition 1 means datasets 2 through 4 were smoothed. Thus a difference in diffusion measure is observable in acquisition 1 versus all other acquisitions. Post‐hoc one‐way ANOVA analysis on acquisitions 2, 3 and 4 showed no significant effect of acquisition number on mean DTI and NODDI parameters for all ROI at both field strengths (all F(2,21) < 3.467, P > 0.17). As such, within‐session coefficient of variation analysis is performed on acquisitions 2 through 4 only.
Within‐Session Reproducibility
Figure 5 shows variance maps for each diffusion measure across acquisitions 2–4 for a subject (another example candidate can be found in Fig. S3 of Supporting Information). There is greater variance throughout the brain in ν ic and OD compared with DTI measures at both field strengths. OD has greatest variance in cortical grey matter regions and the putamen (Fig. 5b,c). All remaining diffusion parameters have greatest variance in white matter or tissue/CSF boundaries. High regions of variance in ν ic can be seen in the corpus callosum and internal capsules (Fig. 5b,c).
Figure 5.
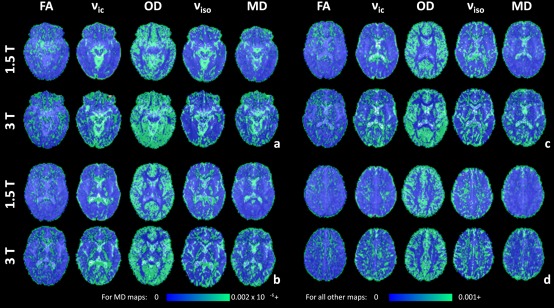
Variance maps of FA, ν ic, OD, ν iso and MD across acquisitions 2 to 4, overlaid on the master b = 0 s/mm2 images. Variance maps are shown for 1.5 and 3 T for the same axial slices (6a to 6d) and subject as in Figure 1. The maximum intensity of all variance maps has been fixed to 0.001, with the exception of MD which has a maximum intensity of 0.002 × 10⁻⁶. [Color figure can be viewed at http://wileyonlinelibrary.com]
Group averaged within‐session coefficients of variations plotted by ROI and diffusion measures for both field strengths are presented in Figure 6. Actual values along with statistical test results can be found in the Supporting Information Table S3. In terms of NODDI versus DTI, ν ic and OD had greater CV compared with FA in the genu and splenium ROI for both field strengths. Conversely, in the CS and grey matter regions, the CV for ν ic and OD were smaller than for FA (Fig. 6a). The CV for ν iso was consistently the largest of all diffusion measures. MD was generally stable, showing a lower CV compared with NODDI parameters with the exception of the thalamus ROI at 3 T.
Figure 6.
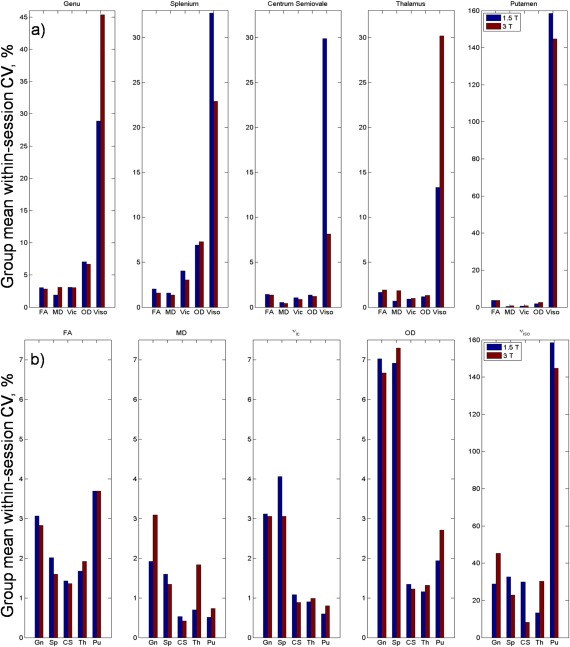
Group‐averaged within‐session coefficient of variation for each (a) diffusion measure grouped by ROI and (b) ROI grouped by diffusion measure at 1.5 and 3 T. Gn, Genu; Sp, Splenium; CS, Centrum semiovale; Th, Thalamus; Pu, Putamen. [Color figure can be viewed at http://wileyonlinelibrary.com]
In terms of change with increasing field strength, no differences in CV reached significance after corrections for multiple comparisons. Although not significant, CV for FA and ν ic in white matter ROI was lower at 3 T than at 1.5 T. Conversely, CV for FA and ν ic in grey matter ROI was greater at 3 T than at 1.5 T (Fig. 6b).
From Figure 6b, ν ic trends with ROI resembled that of MD (excluding MD in the thalamus at 3 T). That is, a large CV in highly organised white matter and a lower CV in deep grey matter. OD trends across ROI are similar to FA with greatest CV in the genu, splenium and the putamen.
Between‐Subject Variability
Between‐subject CVMaster plotted by ROI and diffusion measures for both field strengths are presented in Figure 7. CV values for both CVMaster and CVSingle along with statistical test results can be found in the Supporting Information Table S3. Compared with their corresponding within‐session CV, all between‐subject CV were larger. Between‐subject CV generally behaved similarly to within‐session CV with increasing field strength. Between‐subject variability decreased with increasing field strength in the genu and splenium ROI for DTI measures and ν ic. In grey matter ROI, the opposite trend is observed for all measures with the exception of putamen ν iso. That is, an increase in between‐subject variation with increasing field strength (Fig. 7a). In contrast to within‐session reproducibility, a number of these trends were significant for several DTI and NODDI measures, several surviving multiple comparisons correction (Supporting Information Table S3).
Figure 7.
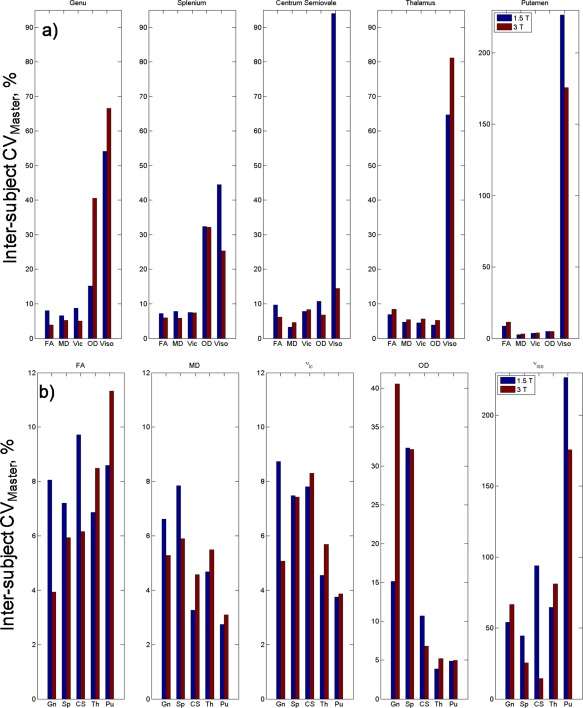
Between‐subject coefficient of variation calculated from the master dataset for each (a) diffusion measure grouped by ROI and (b) ROI grouped by diffusion measure at 1.5 and 3 T. Gn, Genu; Sp, Splenium; CS, Centrum semiovale; Th, Thalamus; Pu, Putamen. [Color figure can be viewed at http://wileyonlinelibrary.com]
Generally, NODDI parameters had larger between‐subject variation than DTI measures in white matter ROI, for both field strengths. Diffusion measures in grey matter exhibited an opposite trend with larger between‐subject CV in DTI compared with ν ic and OD (with the exception of MD in the putamen). OD had greater variability in comparison to FA and ν ic in white matter regions, but to a lesser extent when compared with ν iso. ν iso was unstable across all ROI (Fig. 7b).
Comparing group variation of diffusion measures in terms of number of datasets, the majority of between‐subject CV were larger when calculated from a single acquisition versus the master dataset (CVSingle > CVMaster), for both field strengths. There were some exceptions, such as measurements in the thalamus and OD in the genu and splenium ROI at 3 T.
DISCUSSION
This work is an investigation into the effect of magnetic field strength on NODDI measures in whole brain tissue masks and specific ROI for a cohort of normal, healthy subjects. Within‐session and between‐subject variability of NODDI parameters are also analysed.
The increase of SNR in our data of 35% and 53% in white matter from 1.5 to 3 T is comparable with other studies [Fushimi et al., 2007; Hunsche et al., 2001; Kuhl et al., 2005]. Theoretically, SNR is linearly proportional to B0 [Schick, 2005]; however, its increase from 1.5 to 3 T can range from 20% to 70% [Ding et al., 2007; Fushimi et al., 2007; Huisman et al., 2006; Hunsche et al., 2001; Kuhl et al., 2005; Qin et al., 2009]. There are a number of reasons for this non‐linear SNR gain such as an increase in B0 inhomogeneity, magnetic susceptibility, physiologic noise, and differences in MRI systems and sequences. As such, SNR can differ within an acquisition. Many have demonstrated SNR to also vary across white matter regions considerably [Ding et al., 2007; Farrell et al., 2007; Fushimi et al., 2007; Polders et al., 2011]. This is in part due to different T2 relaxation properties across white matter [Cox and Gowland, 2010]. Furthermore, increasing field strength has the effect of shortening T2 [Cox and Gowland, 2010; Crooks et al., 1984], thus the SNR gain from 1.5 to 3 T will differ depending on the location the measurement is made. Lastly, physiologic noise from cardiac pulsation has been shown to affect the signal between diffusion volumes in the genu and splenium of the corpus callosum [Jones and Pierpaoli, 2005; Pierpaoli et al., 2003]. All these factors may contribute towards the different SNR gains between our two ROI.
Experiment A: Magnetic Field Strength Effect on NODDI
Our results suggest magnetic field strength has a significant effect on estimated NODDI parameters. The improvement in SNR that accompanies increasing field strength has been shown to increase the estimation of FA in regions of highly organised white matter where diffusion is predominantly in a single orientation [Alexander and Barker, 2005; Fushimi et al., 2007; Huisman et al., 2006; Jones and Basser, 2004]. Thus given the positive correlation between ν ic and FA, estimation of ν ic in white matter was found to be greater at 3 T than at 1.5 T, for both whole brain and ROI white matter analyses. Our results also showed OD values in whole brain white matter to significantly decrease from 1.5 to 3 T. Analysing OD in white matter ROI revealed the same trend, however the change was not statistically significant except for the centrum semiovale. Zhang et al. found OD to be a stable and robust measure irrespective of the diffusion‐weighting or number of b‐value shells applied [Zhang et al., 2012], which suggests that field strength may not have a strong effect in highly organised white matter regions. The effect of low SNR on grey matter is an upward bias in estimated anisotropy [Armitage and Bastin, 2000; Jones and Basser, 2004; Pierpaoli and Basser, 1996b], thus with an increase in field strength FA decreases in such regions [Huisman et al., 2006]. This supports our findings of significant decrease in ν ic in whole brain grey matter and also in the putamen ROI (which was also accompanied by an increase in OD). These results reflect the dispersion of neuronal structure in grey matter with no clear dominant orientation of diffusion on a voxel scale. These findings also suggest 3 T to be advantageous for improving the estimation of NODDI measures in deep grey matter. ROI analysis of ν iso revealed it to increase with field strength in all regions tested. Overall, ν iso was highly variable with a lack of significance in the majority of ROI tested. Interestingly, NODDI parameter values at 1.5 T had stronger correlations with FA than at 3 T in whole brain tissue masks, particularly at high FA. This is because of the increase in ν ic at high FA strata with field strength. The increase in ν ic with field strength may enable NODDI to capture further microstrutural nuances when modelling complex tissue configurations, compared with the DTI model.
It should be noted that in the original assessment of NODDI by Zhang et al. data was acquired at 3 T with a maximal gradient strength of 65 mT/m. Both our MRI scanners had a maximal gradient strength of 40 mT/m which is more typical of current clinical scanners. The TE in our experiment was also longer than that in [Zhang et al., 2012] (112 vs. 78 ms). These differences may contribute towards noisier results. However, we aimed to maintain equal sequence parameters for both field strengths: both scanners had the same maximal gradient strength and TE remained a constant 112 ms for all b‐values which was the minimum TE allowable for both scanners to accommodate the diffusion gradients. Thus the changes observed in NODDI measures between field strengths could be predominantly attributed to the effects of change in B0 field and physiologic noise [Krüger et al., 2001]. In terms of B0, an increase in field strength shortens the transverse relaxation time resulting in faster dephasing of the transverse magnetisation of diffusing water molecules [Cox and Gowland, 2010; Crooks et al., 1984], as well as increasing local non‐uniformity in the B0 field [Bernstein et al., 2006]. Our finding of increased ν ic at 3 T versus 1.5 T may be attributed to these inherent features of increasing magnetic field strength. An increase in field strength shortens T2 relaxation time in white and grey matter on average by 15% between 1.5 and 3 T [Ding et al., 2007]. The difference in transverse relaxation time leads to different populations of spins contributing to the signal for each field strength as spins with short T2 will dephase faster at 3 T than at 1.5 T. Moreover, the T2 signal decay is ‘multi‐component’, comprised of pools with different T2 relaxation times, each potentially representing distinct tissue subdomains such as CSF, intra‐ and extracellular pools and myelin water [MacKay et al., 1994, 2006; Menon et al., 1991]. To determine the extent to which T2 relaxation differences at 1.5 and 3 T influences estimated NODDI parameters, future work would involve repeating the experiment with data acquired at multiple TEs with diffusion time fixed at both field strengths. In addition, the unfavourable effect of T2 and T2* shortening at 3 T can be mitigated with parallel imaging to shorten the EPI echo train and thus TE [Jaermann et al., 2004]. Irrespective of the significant differences in diffusion measures with field strength, our results show NODDI to be viable at 1.5 T.
ROI analysis on the centrum semiovale showed a clear difference between DTI and NODDI for modelling complex microstructure. As DTI is unable to capture the complex diffusion pattern within the centrum semiovale due to crossing fibres, FA values were similar to deep grey matter regions. NODDI was able to represent the white matter complexity within this region by estimating ν ic values similar to those in the genu and splenium of the corpus callosum. Centrum semiovale OD was also greater compared with corpus callosum ROI, as would be expected in a multi‐fibre region. The thalamus is a highly compact region rich in reciprocal connections with the cerebral cortex. Although a deep grey structure, diffusion is organised with distinct regions identifiable using local diffusion properties and tractography [Behrens and Johansen‐Berg, 2005; Behrens et al., 2003]. Thus the thalamus often has higher anisotropy than other deep grey structures. Our observed ν ic and OD trends in the thalamus ROI with increasing field strength was akin to those in white matter regions, also exhibiting the smallest percentage changes with NODDI values between that of white matter ROI and the putamen. These may be distinguishing NODDI features characterising the thalamus from white matter and other deep or cortical grey matter.
In terms of whole brain grey matter analysis, NODDI trends were variable and contradictory with increasing field strength when investigated with histograms and mask medians. FA trends were as expected with field strength in all analysis (histograms, mask median and ROI) and were significant. An advantage of DTI is its simplicity, ‘smoothing’ over regions of complex microstructure in grey matter regions (such as deep grey matter, or areas of partial effects/boundary cases). In this respect, whole brain grey matter analysis is more suitable for FA, but only for capturing a general measurement of the tissue. In addition, whole brain tissue analysis may not be suitable for NODDI without first differentiating deep grey matter from cortical grey matter, as we have shown there are differences in NODDI parameters even between the thalamus and the putamen. It is visible from OD histograms and maps that there are a number of voxels with an OD value of 1. These voxels are predominantly located between tissues (particularly in the cortical regions) and CSF boundaries. Post‐hoc analysis removing OD voxels equalling to 1 did not significantly alter the trends or results in Experiment A. A spinal cord study also found outlying voxels with OD equal to 1 and attributed such voxels to noise [Grussu et al., 2013].
In synthetic data, Zhang et al. [2012] showed an increasing bias in the estimation of ν iso with decreasing true ν ic. This is due to an increase in extracellular space as ν ic reduces, making the CSF compartment difficult to disentangle from other neurite components, thus ν iso is overestimated. Our experiments found ν iso to be highly variable with no significant difference across field strengths in all ROI tested except for the centrum semiovale. That is, the improvement of SNR with increasing field strength did not result in a decrease in ν iso estimation with increasing ν ic. As mentioned, a unique combination of high ν ic in the CS (comparable to the genu and splenium) accompanied by high OD (similar to the thalamus) allows NODDI to distinguish complex fibre regions. Perhaps the significant increase in CS ν iso with increasing SNR is a further feature of NODDI modelling complex fibre configurations. This could explain the non‐zero ν iso values in other white matter regions with multi‐fibre configurations such as the fronto‐ and posterior pericallosal regions where the superior longitudinal fasciculus meets the anterior of the corpus callosum (most noticeable at 3 T, Fig. 5.1c). One would expect ν iso to be large in isotropic regions and smaller in highly organised white matter. It would therefore be expected for regions such as the posterior limb of the internal capsule to have smaller ν iso than the putamen, but neither our images nor ROI analysis reflected this. It may be that white matter regions with large axonal diameter have greater perpendicular diffusion (whilst maintaining large anisotropy in the direction of the axons) that is being modelled by the ν iso component. This would explain the large ν iso values in white matter ROI (compared with the putamen) and in particular within the posterior limb of the internal capsules, a region of axons with large diameters forming part of the motor pathways [Innocenti et al., 2013].
Experiment B: NODDI reproducibility
It is important to investigate the reliability and variability of indices from methodologies under different experimental conditions, particularly for newer models such as NODDI. Determining the reproducibility and behaviour of NODDI measures in normal subjects can provide references for planning future clinical studies. Given the variability of comparing NODDI measures in whole brain tissue masks with field strength, we opted to perform regional analysis to assess within‐session reproducibility and inter‐subject variability of NODDI parameters. This ensures our results were not affected by the heterogeneity of tissue microstructure found within an entire brain matter mask.
Our findings of greater inter‐subject variability for all diffusion measures compared with their corresponding within‐session CV is in accordance with other DTI‐based reproducibility studies [Heiervang et al., 2006; Veenith et al., 2013]. This result is expected as there will be greater microstructural heterogeneity in a localised region across a population compared with multiple observations within the same subject. NODDI measures showed greater variation within‐ and between‐subjects compared with DTI (DTI: within‐session CV = 0.5%–3.7%, inter‐subject CV = 2.7%–11.3%. NODDI: within‐session CV = 0.6%–7.3%, inter‐subject CV = 3.8%–40%, not including ν iso). Specifically, both within‐session and between‐subject CV for ν ic and OD were greater than that of FA CV in highly organised white matter ROI, and conversely lower in regions of deep grey matter and the centrum semiovale. Larger NODDI within‐session CV compared with DTI in white matter has been previously found [Tariq et al., 2013]. It may be that being a more complex model and requiring high b‐value data, NODDI measures are inherently noisier than DTI for modelling white matter. This may explain the variability of the ν iso component throughout our analysis, which also consistently had the largest CV in all tests even in white matter, as it is used to improve the fitting of the remaining two NODDI measures.
Although not significant, much like FA, there were trends of decreasing within‐session ν ic CV with increasing field strength in white matter ROI. Conversely, ν ic CV increased with field strength in deep grey matter ROI, as did FA CV. As SNR improves with increasing field strength, the certainty in measurements of FA and ν ic ought to increase. Thus, these changes with field strength in FA and ν ic in ROI tested reveal trends that given a larger sample size could reach significance. Generally, inter‐subject CV behaved similarly to within‐session CV with increasing field strength. However, more diffusion measures were significantly different between 1.5 to 3 T, with several tests surviving multiple comparisons correction. The large inter‐subject CV (compared with within‐session CV) demonstrates the tissue heterogeneity in our normal cohort, making the significance of these field strength changes difficult to interpret as they occur in different diffusion measures and ROI. The effect of increased SNR via increasing number of data averages also reduced inter‐subject variation for the majority of diffusion measures tested (inter‐subject CVSingle was larger than CVMaster), which has been similarly found elsewhere for DTI [Heiervang et al., 2006].
It should be noted that the reproducibility of a diffusion measure is not necessarily indicative of its potential sensitivity to physiological differences in a clinical study. For example, the low CV found from DTI measures indicate it to be a robust model, thus requiring smaller sample sizes for a study and in that respect is preferable to NODDI. However, the large variability exhibited by NODDI in normal data might mean it is far more sensitive to microstructural changes, particularly when applied to a clinical study. In addition, compared with the simple Gaussian DTI model, NODDI is more complex and also requires high b‐value data which is inherently noisier with low SNR as opposed to the commonly used DTI b‐values between 700 and 1000 s/mm2 [Chung et al., 2013]. These are additional factors which may contribute towards greater CV in NODDI parameters.
A factor that can affect diffusion data and in turn the CV measures in this study is cardiac pulsation [Nunes et al., 2005; Skare and Andersson, 2001]. This physiologic effect leads to intra‐voxel dephasing and inaccurate estimates of anisotropy and tensor orientation, even in the genu and splenium of the corpus callosum [Jones and Pierpaoli, 2005; Pierpaoli et al., 2003]. Cardiac pulsation may have a similar effect on NODDI as we found OD within‐session and inter‐subject CV was greatest in the genu and splenium ROI. This may be a limitation in our study and it is possible to mitigate this physiological artefact by employing cardiac gating during scanning; however, this is rarely practiced as it extends image acquisition time.
It is worth noting that the diffusion‐weighted data used in this experiment differs from that suggested by Zhang et al. [2012]. Staying within the confines of a 30 minute sequence and only acquiring data at two b‐value shells, Zhang et al calculated the optimised NODDI protocol to consist of 9 b = 0 s/mm2, 30 gradient directions at b = 711 s/mm2 and 60 gradient directions at b = 2,855 s/mm2. They compared this NODDI protocol against a gold standard (which had the addition of 30 gradient directions at b = 1,000 s/mm2 and 60 gradient directions at b = 2,000 s/mm2) as well as the NODDI protocol with half and a third of the number of gradient directions at each b‐value (reduced‐orientation‐sampling, ROS protocols, i.e., with 15 and 30 directions at low and high b, respectively, and also at 10 and 20 directions at low and high b). Zhang et al. found no significant differences in the estimated ν ic and ν iso values between NODDI and ROS protocols and that greater b‐values were favourable in a sequence. For accurate measures of OD and principal orientation of diffusion the number of gradient directions was important for grey matter regions. Thus our diffusion‐weighted data should be sufficient for computing ν ic and ν iso, although grey matter OD may be underestimated. However, our data has the additional benefit of 3 b‐value shells, and increased SNR by way of four repeated acquisitions which would improve principal orientation and OD estimates.
CONCLUSION
In summary, we have applied the NODDI model to a cohort of normal, healthy subjects and showed the advantages of increasing SNR with magnetic field strength in terms of significant changes in intracellular volume fraction and orientation distribution index in specific white and grey matter regions. As with the diffusion tensor, NODDI results computed from data acquired at different field strengths need to be carefully interpreted. Even so, we found NODDI to be feasible at 1.5 T. In addition, by analysing NODDI parameters alongside FA in localised brain regions, we demonstrated its advantages over DTI particularly in regions of complex tissue structure. Our experiments on the reproducibility and variability of diffusion measures across a normal cohort revealed greater variance of NODDI measures in relation to DTI. It may be that as a more complex model, NODDI is susceptible to noisier parameter estimates when compared with DTI but it may also be indicative of NODDI having greater sensitivity to true subject variability.
Supporting information
Supporting Information
ACKNOWLEDGMENTS
The Wellcome Trust provided funding for the 3 T system used in this study. The authors wish to thank Dr David L Thomas and Professor Roger J. Ordidge for their assistance with the 3 T system, and for Tina Banks for the 1.5 T system.
Ai Wern Chung is currently at Division of Imaging Sciences & Biomedical Engineering, King's College London, St Thomas' Hospital, London, SE1 7EH, United Kingdom.
REFERENCES
- Alexander DC, Barker GJ (2005): Optimal imaging parameters for fiber‐orientation estimation in diffusion MRI. NeuroImage 27:357–367. [DOI] [PubMed] [Google Scholar]
- Alexander DC, Barker GJ, Arridge SR (2002): Detection and modeling of non‐Gaussian apparent diffusion coefficient profiles in human brain data. Magn Reson Med 48:331–340. [DOI] [PubMed] [Google Scholar]
- Armitage PA, Bastin ME (2000): Selecting an appropriate anisotropy index for displaying diffusion tensor imaging data with improved contrast and sensitivity. Magn Reson Med Off J Soc Magn Reson Med Soc Magn Reson Med 44:117–121. [DOI] [PubMed] [Google Scholar]
- Assaf Y, Basser PJ (2005): Composite hindered and restricted model of diffusion (CHARMED) MR imaging of the human brain. NeuroImage 27:48–58. [DOI] [PubMed] [Google Scholar]
- Assaf Y, Blumenfeld‐Katzir T, Yovel Y, Basser PJ (2008): AxCaliber: A method for measuring axon diameter distribution from diffusion MRI. Magn Reson Med Off J Soc Magn Reson Med Soc. Magn Reson Med 59:1347–1354. [DOI] [PMC free article] [PubMed] [Google Scholar]
- Basser PJ, Mattiello J, LeBihan D (1994): Estimation of the effective self‐diffusion tensor from the NMR spin echo. J Magn Reson B 103:247–254. [DOI] [PubMed] [Google Scholar]
- Behrens TEJ, Johansen‐Berg H (2005): Relating connectional architecture to grey matter function using diffusion imaging. Philos Trans R Soc Lond B Biol Sci 360:903–911. [DOI] [PMC free article] [PubMed] [Google Scholar]
- Behrens TEJ, Woolrich MW, Jenkinson M, Johansen‐Berg H, Nunes RG, Clare S, Matthews PM, Brady JM, Smith SM (2003): Characterization and propagation of uncertainty in diffusion‐weighted MR imaging. Magn Reson Med Off J Soc Magn Reson Med Soc Magn Reson Med 50:1077–1088. [DOI] [PubMed] [Google Scholar]
- Bernstein MA, Huston J 3rd, Ward HA (2006): Imaging artifacts at 3.0T. J Magn Reson Imaging JMRI 24:735–746. [DOI] [PubMed] [Google Scholar]
- Chung AW, Thomas DL, Ordidge RJ, Clark CA (2013): Diffusion tensor parameters and principal eigenvector coherence: Relation to b‐value intervals and field strength. Magn Reson Imaging 31:742–747. [DOI] [PubMed] [Google Scholar]
- Ciumas C, Saignavongs M, Ilski F, Herbillon V, Laurent A, Lothe A, Heckemann RA, de Bellescize J, Panagiotakaki E, Hannoun S, Marinier DS, Montavout A, Ostrowsky‐Coste K, Bedoin N, Ryvlin P (2014): White matter development in children with benign childhood epilepsy with centro‐temporal spikes. Brain J Neurol 137:1095–1106. [DOI] [PubMed] [Google Scholar]
- Clark CA, Le Bihan D (2000): Water diffusion compartmentation and anisotropy at high b values in the human brain. Magn Reson Med Off J Soc Magn Reson Med Soc Magn Reson Med 44:852–859. [DOI] [PubMed] [Google Scholar]
- Cook PA, Bai Y, Nedjati‐Gilani S, Seunarine KK, Hall MG, Parker GJ, Alexander DC (2006): Camino: Open‐Source Diffusion‐MRI Reconstruction and Processing. 14th Sci. Meet. Int. Soc. Magn. Reson. Imaging Med. p. 2759.
- Cox EF, Gowland PA (2010): Simultaneous quantification of T2 and T'2 using a combined gradient echo‐spin echo sequence at ultrahigh field. Magn Reson Med Off J Soc Magn Reson Med Soc Magn Reson Med 64:1440–1445. [DOI] [PubMed] [Google Scholar]
- Crooks LE, Arakawa M, Hoenninger J, McCarten B, Watts J, Kaufman L (1984): Magnetic resonance imaging: Effects of magnetic field strength. Radiology 151:127–133. [DOI] [PubMed] [Google Scholar]
- Ding XQ, Finsterbusch J, Wittkugel O, Saager C, Goebell E, Fitting T, Grzyska U, Zeumer H, Fiehler J (2007): Apparent diffusion coefficient, fractional anisotropy and t2 relaxation time measurement. Clin Neuroradiol 17:230–238. [Google Scholar]
- Farrell JAD, Landman BA, Jones CK, Smith SA, Prince JL, van Zijl PCM, Mori S (2007): Effects of signal‐to‐noise ratio on the accuracy and reproducibility of diffusion tensor imaging‐derived fractional anisotropy, mean diffusivity, and principal eigenvector measurements at 1.5 T. J Magn Reson Imaging JMRI 26:756–767. [DOI] [PMC free article] [PubMed] [Google Scholar]
- Fushimi Y, Miki Y, Okada T, Yamamoto A, Mori N, Hanakawa T, Urayama SI, Aso T, Fukuyama H, Kikuta KI, et al. (2007): Fractional anisotropy and mean diffusivity: Comparison between 3.0‐T and 1.5‐T diffusion tensor imaging with parallel imaging using histogram and region of interest analysis. NMR Biomed 20:743–748. [DOI] [PubMed] [Google Scholar]
- Grussu F, Schneider T, Kearney H, Zhang H, Miller DH, Ciccarelli O, Alexander DC, Wheeler‐Kingshott CA (2013): Towards spinal cord microstructure mapping with the neurite orientation dispersion and density imaging. In ISMRM 21st Annual Meeting, p. 2095.
- Hall MG, Barrick TR (2012): Two‐step anomalous diffusion tensor imaging. NMR Biomed 25:286–294. [DOI] [PubMed] [Google Scholar]
- Heiervang E, Behrens TEJ, Mackay CE, Robson MD, Johansen‐Berg H (2006): Between session reproducibility and between subject variability of diffusion MR and tractography measures. NeuroImage 33:867–877. [DOI] [PubMed] [Google Scholar]
- Huisman TAGM, Loenneker T, Barta G, Bellemann ME, Hennig J, Fischer JE, Il'yasov KA (2006): Quantitative diffusion tensor MR imaging of the brain: Field strength related variance of apparent diffusion coefficient (ADC) and fractional anisotropy (FA) scalars. Eur Radiol 16:1651–1658. [DOI] [PubMed] [Google Scholar]
- Hunsche S, Moseley ME, Stoeter P, Hedehus M (2001): Diffusion‐tensor MR imaging at 1.5 and 3.0 T: Initial observations1. Radiology 221:550–556. [DOI] [PubMed] [Google Scholar]
- Innocenti GM, Vercelli A, Caminiti R (2013): The diameter of cortical axons depends both on the area of origin and target. Cereb Cortex 24:2178–2188. [DOI] [PubMed] [Google Scholar]
- Jaermann T, Crelier G, Pruessmann KP, Golay X, Netsch T, van Muiswinkel AMC, Mori S, van Zijl PCM, Valavanis A, Kollias S, et al. (2004): SENSE‐DTI at 3 T. Magn Reson Med Off J Soc Magn Reson Med Soc Magn Reson Med 51:230–236. [DOI] [PubMed] [Google Scholar]
- Jenkinson M, Smith S (2001): A global optimisation method for robust affine registration of brain images. Med Image Anal 5:143–156. [DOI] [PubMed] [Google Scholar]
- Jenkinson M, Bannister P, Brady M, Smith S (2002): Improved optimization for the robust and accurate linear registration and motion correction of brain images. NeuroImage 17:825–841. [DOI] [PubMed] [Google Scholar]
- Jones DK, Basser PJ (2004): “Squashing peanuts and smashing pumpkins”: how noise distorts diffusion‐weighted MR data. Magn Reson Med Off J Soc Magn Reson Med Soc Magn Reson Med 52:979–993. [DOI] [PubMed] [Google Scholar]
- Jones DK, Pierpaoli C (2005): Contribution of cardiac pulsation to variability of tractography results. In ISMRM 13th Annual Meeting, p. 225.
- Krüger G, Kastrup A, Glover GH (2001): Neuroimaging at 1.5 T and 3.0 T: Comparison of oxygenation‐sensitive magnetic resonance imaging. Magn Reson Med Off J Soc Magn Reson Med Soc Magn Reson Med 45:595–604. [DOI] [PubMed] [Google Scholar]
- Kuhl CK, Textor J, Gieseke J, von Falkenhausen M, Gernert S, Urbach H, Schild HH (2005): Acute and subacute ischemic stroke at high‐field‐strength (3.0‐T) diffusion‐weighted MR imaging: Intraindividual comparative study. Radiology 234:509–516. [DOI] [PubMed] [Google Scholar]
- Kunz N, Zhang H, Vasung L, O'Brien KR, Assaf Y, Lazeyras F, Alexander DC, Hüppi PS (2014): Assessing white matter microstructure of the newborn with multi‐shell diffusion MRI and biophysical compartment models. NeuroImage 96:288–299. [DOI] [PubMed] [Google Scholar]
- Lebel C, Beaulieu C (2011): Longitudinal development of human brain wiring continues from childhood into adulthood. J Neurosci 31:10937–10947. [DOI] [PMC free article] [PubMed] [Google Scholar]
- MacKay A, Whittall K, Adler J, Li D, Paty D, Graeb D (1994): In vivo visualization of myelin water in brain by magnetic resonance. Magn Reson Med Off J Soc Magn Reson Med Soc Magn Reson Med 31:673–677. [DOI] [PubMed] [Google Scholar]
- MacKay A, Laule C, Vavasour I, Bjarnason T, Kolind S, Mädler B (2006): Insights into brain microstructure from the T2 distribution. Magn Reson Imaging 24:515–525. [DOI] [PubMed] [Google Scholar]
- Mahoney CJ, Ridgway GR, Malone IB, Downey LE, Beck J, Kinnunen KM, Schmitz N, Golden HL, Rohrer JD, Schott JM, et al. (2014): Profiles of white matter tract pathology in frontotemporal dementia. Hum Brain Mapp 35:4163–4179. [DOI] [PMC free article] [PubMed] [Google Scholar]
- Menon RS, Rusinko MS, Allen PS (1991): Multiexponential proton relaxation in model cellular systems. Magn Reson Med 20:196–213. [DOI] [PubMed] [Google Scholar]
- Nazeri A, Chakravarty MM, Rotenberg DJ, Rajji TK, Rathi Y, Michailovich OV, Voineskos AN (2015): Functional consequences of neurite orientation dispersion and density in humans across the adult lifespan. J Neurosci Off J Soc Neurosci 35:1753–1762. [DOI] [PMC free article] [PubMed] [Google Scholar]
- Nunes RG, Jezzard P, Clare S (2005): Investigations on the efficiency of cardiac‐gated methods for the acquisition of diffusion‐weighted images. J Magn Reson (San Diego Calif 1997) 177:102–110. [DOI] [PubMed] [Google Scholar]
- Patenaude B, Smith SM, Kennedy DN, Jenkinson M (2011): A Bayesian model of shape and appearance for subcortical brain segmentation. NeuroImage 56:907–922. [DOI] [PMC free article] [PubMed] [Google Scholar]
- Pierpaoli C, Basser PJ (1996a): Toward a quantitative assessment of diffusion anisotropy. Magn Reson Med Off J Soc Magn Reson Med Soc Magn Reson Med 36:893–906. [DOI] [PubMed] [Google Scholar]
- Pierpaoli C, Basser PJ (1996b): Toward a quantitative assessment of diffusion anisotropy. Magn Reson Med 36:893–906. [DOI] [PubMed] [Google Scholar]
- Pierpaoli C, Marenco S, Rohde GK, Jones DK, Barnett AS (2003): Analyzing the contribution of cardiac pulsation to the variability of quantities derived from the diffusion tensor. In ISMRM 11th Annual Meeting, p. 70.
- Polders DL, Leemans A, Hendrikse J, Donahue MJ, Luijten PR, Hoogduin JM (2011): Signal to noise ratio and uncertainty in diffusion tensor imaging at 1.5, 3.0, and 7.0 Tesla. J Magn Reson Imaging JMRI 33:1456–1463. [DOI] [PubMed] [Google Scholar]
- Qin W, Yu CS, Zhang F, Du XY, Jiang H, Yan YX, Li KC (2009): Effects of echo time on diffusion quantification of brain white matter at 1.5 T and 3.0 T. Magn Reson Med Off J Soc Magn Reson Med Soc Magn Reson Med 61:755–760. [DOI] [PubMed] [Google Scholar]
- Reese TG, Heid O, Weisskoff RM, Wedeen VJ (2003): Reduction of eddy‐current‐induced distortion in diffusion MRI using a twice‐refocused spin echo. Magn Reson Med Off J Soc Magn Reson Med Soc Magn Reson Med 49:177–182. [DOI] [PubMed] [Google Scholar]
- Schick F (2005): Whole‐body MRI at high field: Technical limits and clinical potential. Eur Radiol 15:946–959. [DOI] [PubMed] [Google Scholar]
- Seunarine KK, Alexander DC (2009): Multiple fibers: Beyond the diffusion tensor In: Johansen‐Berg H, Behrens TEJ, editors. Diffusion MRI: From Quantitative Measurement to in Vivo Neuroanatomy. New York: Academic Press; p 55. [Google Scholar]
- Skare S, Andersson JL (2001): On the effects of gating in diffusion imaging of the brain using single shot EPI. Magn Reson Imaging 19:1125–1128. [DOI] [PubMed] [Google Scholar]
- Smith SM (2002): Fast robust automated brain extraction. Hum Brain Mapp 17:143–155. [DOI] [PMC free article] [PubMed] [Google Scholar]
- Tariq M, Schneider T, Alexander DC, Wheeler‐Kingshott CAM, Zhang H (2013): Assessing scan‐rescan reproducibility of the parameter estimates from NODDI. In ISMRM 21st Annual Meeting, p 3187.
- Veenith TV, Carter E, Grossac J, Newcombe VFJ, Outtrim JG, Lupson V, Williams GB, Menon DK, Coles JP (2013): Inter subject variability and reproducibility of diffusion tensor imaging within and between different imaging sessions. PLoS ONE 8:e65941. [DOI] [PMC free article] [PubMed] [Google Scholar]
- Winston GP, Micallef C, Symms MR, Alexander DC, Duncan JS, Zhang H (2014): Advanced diffusion imaging sequences could aid assessing patients with focal cortical dysplasia and epilepsy. Epilepsy Res 108:336–339. [DOI] [PMC free article] [PubMed] [Google Scholar]
- Yoshida S, Oishi K, Faria AV, Mori S (2013): Diffusion tensor imaging of normal brain development. Pediatr Radiol 43:15–27. [DOI] [PMC free article] [PubMed] [Google Scholar]
- Zarei M, Damoiseaux JS, Morgese C, Beckmann CF, Smith SM, Matthews PM, Scheltens P, Rombouts SARB, Barkhof F (2009): Regional white matter integrity differentiates between vascular dementia and Alzheimer disease. Stroke J Cereb Circ 40:773–779. [DOI] [PubMed] [Google Scholar]
- Zhang Y, Brady M, Smith S (2001): Segmentation of brain MR images through a hidden Markov random field model and the expectation‐maximization algorithm. IEEE Trans Med Imaging 20:45–57. [DOI] [PubMed] [Google Scholar]
- Zhang H, Schneider T, Wheeler‐Kingshott CA, Alexander DC (2012): NODDI: Practical in vivo neurite orientation dispersion and density imaging of the human brain. NeuroImage 61:1000–1016. [DOI] [PubMed] [Google Scholar]
Associated Data
This section collects any data citations, data availability statements, or supplementary materials included in this article.
Supplementary Materials
Supporting Information