

Abstract
Physical activity has been positively associated with gray‐matter integrity. In contrast, pro‐inflammatory cytokines seem to have negative effects on the aging brain and have been related to dementia. It was investigated whether an inactive lifestyle and high levels of inflammation resulted in smaller gray‐matter volumes and predicted cognitive decline across 6 years in a population‐based study of older adults (n = 414). Self‐reported physical activity (fitness‐enhancing, health‐enhancing, inadequate) was linked to gray‐matter volume, such that individuals with inadequate physical activity had the least gray matter. There were no overall associations between different pro‐and anti‐inflammatory markers (IL‐1β, IL‐6, IL‐10, IL‐12p40, IL‐12p70, G‐CSF, and TNF‐α) and gray‐matter integrity. However, persons with inadequate activity and high levels of the pro‐inflammatory marker IL‐12p40 had smaller volumes of lateral prefrontal cortex and hippocampus and declined more on the Mini‐Mental State Examination test over 6 years compared with physically inactive individuals with low levels of IL‐12p40 and to more physically active persons, irrespective of their levels of IL‐12p40. These patterns of data suggested that inflammation was particularly detrimental in inactive older adults and may exacerbate the negative effects of physical inactivity on brain and cognition in old age. Hum Brain Mapp 37:3462–3473, 2016. © 2016 Wiley Periodicals, Inc.
Keywords: inflammation, aging, cognition, gray matter, physical activity
INTRODUCTION
There is considerable heterogeneity in cognitive and brain aging [e.g., Fandakova et al., 2014; Lindenberger et al., 2013; Rönnlund et al., 2005]. Increasing evidence supports the brain‐maintenance hypothesis, which states that individual differences in lifestyle factors may result in better preserved brain structure and cognition in senescence [Nyberg et al., 2012]. Here, we examine potential interactive effects of physical activity and inflammatory biomarkers on gray‐matter volumes and global cognitive decline in older adults sampled from the community.
Association Between Physical Activity and Gray‐Matter Integrity
It is well documented that physical activity is positively associated with overall brain integrity [for review, see Voelcker‐Rehage and Niemann, 2013], with beneficial effects of physical activity being more frequently reported for gray‐matter than white‐matter volume. In terms of regional specificity, cardiorespiratory fitness has been associated with larger volumes in frontal cortex and medial temporal lobe [for review see Erickson et al., 2014]. For instance, intervention studies have documented that cardiovascular training has beneficial effects on frontal areas [e.g., anterior frontal cortex; Colcombe et al., 2006; left prefrontal cortex; Ruscheweyh et al., 2011]. Similarly, increased fitness has been associated with larger gray‐matter volume within the medial temporal lobe, particularly the hippocampus [e.g., Maass et al., 2015; Erickson et al., 2009].
Self‐reported measures of physical activity typically assess activities more broadly, beyond cardiovascular exercise, and are a useful tool to assess physical activity in large‐scale population‐based studies. Again, the available data suggest that self‐reported physical activity and gray matter are positively related and most consistently so with respect to frontal cortex [Floel et al., 2010; McEwen et al., 2015; Rovio et al., 2010; Walhovd et al., 2014] and hippocampus [Brown et al., 2014; Demirakca et al., 2014; Killgore et al., 2013].
Association Between Blood Markers of Inflammation and Brain Integrity
Links between inflammation‐related cytokines and brain integrity have also been documented [Lim et al., 2013]. Indeed, inflammatory markers show potential as blood plasma biomarkers that may predict Alzheimer's disease [e.g., Ray et al., 2007; Schneider et al., 2009]. In healthy middle‐aged and elderly persons, higher levels of the pro‐inflammatory marker interleukin‐6 (IL‐6) were associated with smaller overall gray‐matter volume and hippocampal volume [Marsland et al., 2015; Satizabal et al., 2012], as well as lower cognitive performance [Elderkin‐Thompson et al., 2012; Marsland et al., 2006, 2015]. Moreover, two pro‐inflammatory markers tumor necrosis factor‐α (TNF‐α) and interleukin‐1β (IL‐1β) were recently associated with smaller gray‐matter volume in occipital and temporal brain areas, with TNF‐α being additionally associated with less gray‐matter volume in the prefrontal cortex [Zhang et al., 2015]. In general, it is assumed that inflammation has a systemic effect on the brain. However, similar to physical activity, the prefrontal cortex and hippocampus may be particularly vulnerable to inflammation [see Lim et al., 2013 for discussion). Animal data suggest that elevated levels of peripheral inflammation suppress neurogenesis and synaptic plasticity [for review, see McAfoose and Baune, 2009]. By contrast, higher levels of the granulocyte‐colony stimulating factor (G‐CSF), which is an important cytokine involved in the inflammatory response, are associated with reduced amyloid burden in hippocampus and entorhinal cortex [Sanchez‐Ramos et al., 2009; Sopova et al., 2014]. In addition, G‐CSF modulates the immune system by down‐regulating pro‐inflammatory cytokines and up‐regulating anti‐inflammatory cytokines [Hartung, 1998; Sanchez‐Ramos et al., 2009]. Animal data also demonstrate detrimental effects of the pro‐inflammatory cytokine subunit IL‐12p40 on brain aging. Specifically, genetic ablation of IL‐12p40 or its receptor complex resulted in decreased cerebral amyloid load [Tan et al., 2014; Vom Berg et al., 2012], reduced synaptic and neuronal loss, as well as improved spatial memory [Tan et al., 2014].
Interactive Effects Between Physical Activity and Inflammatory Markers
Inflammation may be lower in individuals who are physically fit and active than in more sedentary adults [Shanely et al., 2013]. Further, animal studies show that mice that exercise regularly have lower concentrations of IL‐6, IL‐12p40 and G‐CSF 5 days after an influenza infection compared with those that do not exercise [Sim et al., 2009]. Also, middle‐aged individuals who increased their physical activity over time had lower levels of IL‐6 at follow‐up 10 years later [Hamer et al., 2012]. Similarly, more physically active adults have higher levels of G‐CSF and more preserved gray‐matter in prefrontal and cingulate cortex [Floel et al., 2010]. Thus, it is plausible to hypothesize that physical inactivity interacts with inflammation in exerting detrimental effects on brain structure.
Aims of Study
We explore whether physical activity interacts with inflammation‐related cytokines in affecting gray‐matter volumes and global cognitive decline (Mini‐Mental State Examination; MMSE) in a population‐based study sample of older adults (n = 414). Using structural equation modeling (SEM), we extend research on the effects of physical activity on gray‐matter integrity. Furthermore, we investigate whether different commonly investigated inflammatory biomarkers (IL‐1β, IL‐6, IL‐10, IL‐12p40, IL‐12p70, G‐CSF, TNF‐α) interact with physical activity, contributing to inter‐individual differences in brain structure and cognitive decline in old age. We focused our analyses on these particular interleukins, given their documented relevance to brain and cognition, as suggested in the cited studies above. So far, however, no study in humans has focused on IL‐12p40 and IL‐12p70 and their associations with cognition or indicators of brain integrity.
METHODS
Participants
The original sample consisted of 555 participants (rangeage = 60–87 years; M age = 71.8 years; SDage = 9.0 years) from a population‐based epidemiological study, the Swedish National Study on Aging and Care in Kungsholmen (SNAC‐K). The basic SNAC‐K sample (n = 3,363) was stratified on age (60, 66, 72, 78, 81, 84, 87, 90, 93, 96, and 99+ years) at baseline. The cohort age differences are 6 years for younger cohorts (60–78 years old) and 3 years for older cohorts (78+ years old) due to more rapid changes in brain and behavior in older ages. A subsample was randomly selected to further undergo magnetic resonance imaging (MRI) from participants who were eligible for scanning. Participants with a diagnosis of dementia, schizophrenia, bipolar disorder, self‐reported stroke, stroke observed on the MR images, Parkinson's disease, epilepsy, or brain tumors were excluded from the sample. Further, participants older than 87 years were excluded to have more homogenous age groups in the analyses. The effective sample of this study was derived from the MRI sample and consisted of 414 participants.
Physical Activity
Rate and level of physical activity was determined from a self‐administered questionnaire, as previously described [Rydwik et al., 2013]. Participation in physical activities was self‐reported for the past 12 months and categorized according to level of intensity (light exercise such as short bike rides or usual paced walks or moderate to intense exercise such as brisk walks or jogging) and frequency (never, <2–3 times/month, 2–3 times/month, several times/week, and every day). To further quantify level of physical activity, based on intensity and frequency of the activities [Lindwall et al., 2007; Rennemark et al., 2009], three categories were created following the recommendations from the World Health Organization and American College of Sports Medicine [Nelson et al., 2007; World Health Organization, 2010]: (a) inadequate (≤2–3 times per month of light and/or moderate/intense exercise); (b) health‐enhancing (light exercise several times per week or every day); or (c) fitness‐enhancing (moderate/intense exercise several times per week or every day).
Dementia Diagnosis
Diagnosis of dementia was made according to the Diagnostic and Statistical Manual of Mental Disorders, 4th edition (DSM‐IV; American Psychiatric Association, 1994), using a three‐step procedure. The preliminary diagnosis made by the examining physician was compared with a second independent diagnosis based on computerized data. In cases of disagreement, a supervising physician made a third and final diagnosis. The cognitive assessment used for diagnostic purposes included the MMSE [Folstein et al., 1975], the Clock test [Manos and Wu, 1994], and questions regarding memory, orientation, executive functioning, interpretation of proverbs, and problem solving.
Blood Serum Markers of Inflammation
Venous blood samples were taken at baseline (fasting was not compulsory) and serum aliquots were stored at −80°C until analysis. IL‐1β, IL‐6, IL‐10, IL‐12p40, IL‐12p70, G‐CSF, and TNF‐α were analyzed with a multiplex suspension array system using the Bioplex Luminex 200 instrument (Bio‐Rad Laboratories, Hercules, CA) and the MILLIPLEX® MAP Human Cytokine/Chemokine panel (Merck Millipore, Darmstadt, Germany).
The assays were performed in one batch, and sample preparation and setting of the system running protocol were done following the manufacturer's instructions.
In brief, 96‐well plates were pre‐wet with a 200 µL assay buffer (provided by the manufacturer) for 10 minutes and then aspirated using a vacuum manifold. Standards and serum samples (25 µL) were added to appropriate wells, followed by the addition of assay beads. Plates were incubated for 3 hours with mild agitation at 4°C; the fluid was then removed by vacuum and the wells were washed twice with a wash buffer. Detection antibodies were added to each well, and incubated for 1 hour at room temperature; the fluorescent conjugate Streptavidin–Phycoerythrin was then added to each well and plates incubated for 30 minutes at room temperature. Finally, the fluid was removed by vacuum and wells were washed twice.
All samples and standards were run in duplicate and were measured as pg/mL. Quality controls were performed according to the manufacturer guidelines to ensure accuracy of measurements. The intra‐assay coefficient of variability (CV) for the different compounds ranged from 1% to 2%. The detection limits were the following: IL‐1β: 0.8 pg/mL; IL‐6: 0.9 pg/mL; IL‐10: 1.1 pg/mL; IL‐12p40: 7.4 pg/mL; IL12‐p70: 0.6 pg/mL; G‐CSF: 1.8 pg/mL; and TNF‐α: 0.7 pg/mL. All sample results below the lower limit of quantitation were classified as missing data. After the plate reading, the result files were generated using Bio‐Plex Manager software 4 (Bio‐Rad Laboratories, Hercules, CA). For further analyses, cytokine data were log‐transformed due to the non‐Gaussian distribution of the values.
MRI Acquisition
All MRI measurements were conducted using a whole‐body clinical 1.5 T MRI scanner (Philips Intera, The Netherlands). The 3D FFE (fast field echo) T1, Axial SE (spin echo) PD/T2, Axial FLAIR (fluid‐attenuated inversion recovery) and axial diffusion tensor imaging were acquired. In this study, the axial 3D FFE T1 images (TR = 15 ms, TE = 7 ms, flip angle = 5°, number of slices = 128, slice thickness = 1.5 mm, in‐plane resolution = 0.94 × 0.94 mm2, no gap, FOV = 240, matrix = 256 * 256) were used to derive volumetric data.
VBM Analyses
To quantify gray‐matter volumes, T1‐weighted images were first segmented into gray matter, white matter, and cerebrospinal fluid using the unified segmentation approach [Ashburner and Friston, 2005] in SPM12b (Statistical Parametric Mapping, Wellcome Trust Centre for Neuroimaging, http://www.fil.ion.ucl.ac.uk/spm/) implemented in Matlab 10 (The Mathworks, Inc). Moreover, the “light clean up” option was used to remove odd voxels from the segments. The gray‐matter images were further analyzed using DARTEL in SPM12b (Diffeomorphic Anatomical Registration Through Exponentiated Lie Algebra, Ashburner, 2007]. The gray‐matter segments were imported into DARTEL space, and a final customized template was created as well as subject‐specific flow fields containing the individual spatial‐normalization parameters (diffeomorphic non‐linear image registration). Gray‐matter segments were further warped into standard MNI space, by incorporating an affine transformation that were mapped from the DARTEL template to MNI space. In addition, the normalized gray‐matter volumes were modulated by scaling them with Jacobian determinants from the registration step to preserve local‐tissue volumes. Volumes were smoothed with a full‐width at half‐maximum Gaussian kernel of 9 mm in the three directions.
To prepare the data for SEM, we produced masks of eight regions of interest in each hemisphere. These 16 masks (8 regions × 2 hemispheres) were used to extract mean‐modulated volumes from each individual's smoothed images. Specifically, we defined masks for eight regions of interest: lateral prefrontal cortex (LPFC), orbito‐frontal cortex (OFC), inferior parietal lobule (IPL), inferior temporal cortex (ITC), primary visual cortex (VC), hippocampus (Hc), caudate (Cd), and putamen (Pt). Based on previous research [e.g., Raz et al., 2004], neocortical masks were defined according to Brodmann areas from the MRIcron atlas (http://www.mccauslandcenter.sc.edu/mricro/mricron/index.html) for LPFC (Brodmann areas 8, 9, 10, 45, and 46), OFC (Brodmann areas 11 and 47), IPL (Brodmann area 40), and ITC (Brodmann area 20). The remaining masks were based on the WFU Pickatlas AAL.
Next, we visually inspected the fit of each mask to the mean gray‐matter mask and optimized each mask's fit in terms of clear separations between masks. Note that the mask is identical for all subjects, so that this procedure does not introduce any between‐subject error, but rather increases the anatomical validity of the masks. The resulting masks were then used to extract mean regional volumes for each participant. Volumetric data were adjusted for intracranial volume (ICV) using the analysis of covariance approach: adjusted volume = raw volume × b (ICV – mean ICV), where b is the slope of regression of volume on ICV [e.g., Raz et al., 2005]. All variables displayed acceptable skewness and kurtosis [Kline, 2005].
Analyses
Analyses were conducted within the SEM framework, using AMOS 7.0 [Arbuckle, 2006]. We estimated a model specifying region‐specific latent gray‐matter factors that represent individual differences common across hemispheres for a given brain region (Fig. 1). To standardize the regional factors, one unstandardized loading on each factor was fixed to 1. The model was first fitted as a multiple‐group model, comparing younger (aged 60–72 years) and older (aged 78–87 years) adults, to test whether the same model would hold across age. We included chronological age as a predictor of the gray‐matter factors to covary out the effect that age heterogeneity within age groups may have on variances and covariances. We evaluated whether the model provided an acceptable representation of the data, using the root mean square error of approximation (RMSEA) and the comparative fit index [CFI; Kline, 2005]. Measurement equivalence over age groups was investigated by comparing the reference model to a nested model that assumes all unstandardized loadings on the regional volume factors to be equal across groups. A non‐significant difference in fit (i.e., the χ 2 difference) between these models indicates that loadings are equivalent across age groups, which is an important methodological prerequisite for using the same model for persons of different ages [Meredith, 1993]. The alpha level for statistical decisions regarding differences in χ 2 fit statistics was set to 0.05.
Figure 1.
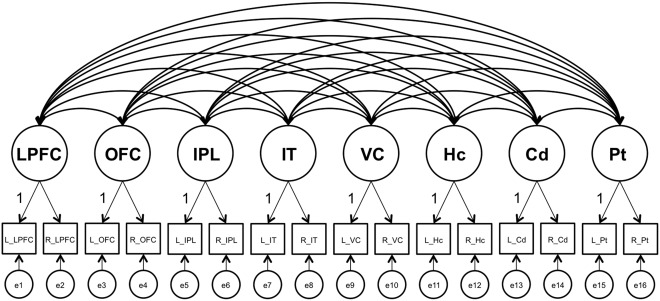
Factor model used in analyses. Latent factors are depicted with circles, observed variables with rectangles, regressions with one‐headed arrows, and covariances with two‐headed arrows. According to the analyses specified in the text, physical activity, inflammatory markers (IL‐1β, IL‐6, IL‐10, IL‐12p40, IL‐12p70, G‐CSF, TNF‐α), as well as their interactions were included in the analyses as regressors on all latent factors, but are not shown in the figure. In addition, covariates were included in the model as regressors on all latent factors. LPFC, lateral prefrontal cortex; OFC, orbitofrontal cortex; IPL, inferior parietal lobule; IT, inferior temporal cortex; VC, visual cortex; Hc, hippocampus; Cd, caudate; Pt, putamen; L, left; R, right; e, error.
To examine effects of physical activity on gray‐matter volumes, a variable representing physical activity (0 = fitness‐enhancing, 1 = health‐enhancing, 2 = inadequate) was included as a regressor on the latent factors. These analyses were conducted in the total sample, with age included as an additional predictor, covarying out its effect on variances and covariances. In addition, other potential confounders were included as regressors: education, cardiovascular burden as defined by Welmer et al. [2013], sex, and instrumental activities of daily living (IADL), assessing independence regarding activities such as cooking, housekeeping, using appliances, and shopping. Two aggregated sum scores were used for cardiovascular burden, namely cardiovascular risk factors (CRFs) and diseases (CVDs). The aggregated CRFs included stage‐2 hypertension, high cholesterol (i.e., fasting cholesterol level ≥6.5 mmol/L), obesity (≥30 kg/m2), diabetes, and smoking. The aggregated score for CVDs included occurrence of ischemic heart diseases, atrial fibrillation, and heart failure [see Welmer et al., 2013, for details on assessment of CRFs and CVDs].
To investigate associations between the inflammatory biomarkers and gray‐matter volumes, we added variables representing the growth‐factor G‐CSF, the pro‐inflammatory markers (IL‐1β, IL‐6, IL‐12p40, IL‐12p70, TNF‐α), and the anti‐inflammatory marker IL‐10 as predictors in the analyses. As before, effects of age, sex, education, CRFs, and CVDs were included as regressors. In addition, analyses were adjusted for c‐reactive protein (CRP) levels, an indicator of acute inflammation, which was measured following standard procedures [Buckley et al., 2009]. In a final model, we added regressors representing interactive effects between physical activity and the inflammatory biomarkers.
RESULTS
Background Variables
Descriptive data across physical‐activity groups are presented in Table 1. Overall, participants in the fitness‐enhancing group were younger, had higher levels of education, and fewer CRFs than those who were less active (i.e., health‐enhancing and inadequate groups). Notably, individuals with inadequate activity only differed with respect to CRFs from individuals in the health‐enhancing group.
Table 1.
Demographic variables, cardiovascular burden, white‐matter integrity, and cytokines across physical activity groups
| Physical activity | |||
|---|---|---|---|
| Fitness‐enhancing | Health‐enhancing | Inadequate | |
| n = 113 | n = 222 | n = 79 | |
| Age | 67.2 (7.5) | 69.8 (8.5) | 69.7 (8.5)a |
| Women/Men | 50/63 | 86/136 | 34/45b |
| Education | 13.79 (4.0) | 12.79 (4.2) | 12.39 (4.8)c |
| MMSE | 29.2 (0.98) | 29.3 (0.95) | 29.1 (0.98)d |
| Aggregated CRFs | 0.75 (0.73) | 0.93 (0.90) | 1.18 (0.84)e |
| Aggregated CVDs | 0.19 (0.47) | 0.33 (0.62) | 0.34 (0.70)d |
| Global WMHs, mL | 4.2 (7.3) | 5.1 (8.5) | 5.2 (6.7)d |
| Global WM, mL | 509.3 (44.5) | 510.8 (41.8) | 521.3 (46.3)d |
| CRP | 5.43 (1.74) | 6.53 (7.75) | 6.41 (4.93)d |
| IL‐1β | 2.90 (0.66) | 3.03 (0.87) | 2.8 (0.80)d |
| IL‐6 | 1.36 (1.39) | 1.50 (1.33) | 1.22 (1.38)d |
| IL‐10 | 2.59 (0.72) | 2.59 (0.84) | 2.60 (0.80)d |
| IL‐12p40 | 4.70 (0.56) | 4.80 (0.75) | 4.74 (0.67)d |
| IL‐12p70 | 2.59 (0.51) | 2.70 (0.73) | 2.62 (0.57)d |
| G‐CSF | 5.45 (0.54) | 5.47 (0.57) | 5.55 (0.53)d |
| TNF‐α | 2.6 (0.81) | 2.68 (0.80) | 2.58 (0.73)d |
Note. Values in table indicate frequencies for gender and means (standard deviations) for all other variables. Global WMHs and WM volume were adjusted for intracranial volume (ICV) using the analysis of covariance approach: adjusted volume = raw volume × b (ICV – mean ICV), where b is the slope of regression of volume on ICV [e.g., Raz et al., 2005].
ANOVA: Age, F(1,413) = 4.0, P < 0.05, with the fitness‐enhancing group being younger than the health‐enhancing (t = 2.7) and inadequate activity groups (t = 2.9).
Chi‐square test = n.s.
ANOVA: Years of Education, F(1,413) = 3.0, P < 0.05, with individuals in the fitness‐enhancing group having higher values than in the health‐enhancing (t = 2.1) and inadequate activity groups (t = 2.2).
ANOVAs = n.s.
ANOVA: CRFs, F(1,413) = 5.9, P < 0.05, with significant differences when comparing the inadequate activity group to the fitness‐enhancing (t = 3.7) and health‐enhancing group (t = 2.2).
Structural Equation Model for Regional Gray‐Matter Volumes
Figure 1 depicts the model used for SEM. Multiple‐group analyses indicated very good model fit, χ 2 (192, n = 414) = 258.44, CFI = 0.991, RMSEA = 0.031. Constraining the factor loadings to be equal across age groups did not result in worse model fit, χ 2 (184, n = 414) = 273.83, CFI = 0.990, RMSEA = 0.032, Δχ 2 = 15.39, df = 8, P > 0.05, indicating metric factorial invariance across younger (aged 60–72 years) and older (aged 78–87 years) adults. Collapsing across the two age groups, we found that age was negatively associated with seven latent gray‐matter factors (LPFC, β = −0.54; OFC, β = −0.64; IPL, β = −0.49; IT, β = −0.65; Vc, β = −0.44; Hc, β = −0.74; Cd, β = −0.32). There was no reliable association between age and Pt, β = −0.06. This finding contradicts previous data [e.g., Gunning‐Dixon et al., 1998], and needs to be probed in future studies. Fitting an alternative model with only one latent variable, assuming that individual differences generalize across regions of interest, resulted in poor model fit, χ2 (94, n = 414) = 3,965.31, CFI = 0.520, RMSEA = 0.177. The standardized factor loadings and factor correlations for the regional gray‐matter model with age included as regressor are reported in Supporting Information Tables A1 and A2, respectively.
Associations Between Physical Activity and Regional Gray‐Matter Volumes
In line with previous work [e.g., Voelcker‐Rehage and Niemann, 2013], individual differences in physical activity were consistently associated with all latent gray‐matter factors, with less physically active individuals having smaller gray‐matter volumes (Table 2, Model 1). These associations were still reliable after all potential confounders had been entered into the analyses (Table 2, Model 2). Based on this model, individuals in the inadequate activity group had smaller gray‐matter volumes than those in the fitness‐enhancing group (LPFC, β = −0.10; OFC, β = −0.09; IPL, β = −0.08; IT, β = −0.08; Vc, β = −0.08; Hc, β = −0.08; Cd, β = −0.10; Pt, β = −0.08). The health‐enhancing group did not differ in gray‐matter volumes from the two extreme groups.
Table 2.
Associations (βs) between physical activity and regional gray‐matter volumes in the total sample (n = 414; Model 1 and 2) and in the subsample after exclusion of diseases that affect physical activity (n = 276; Model 3)
| Model 1 Adjusted for age | Model 2 Adjusted for age, education, IADL, sex, CRFs, CVDs | Model 3 Adjusted for age, education, IADL, sex, CRFs, CVDs | |
|---|---|---|---|
| Lateral prefrontal cortex | −0.139 | −0.126 | −0.125 |
| Orbitofrontal cortex | −0.150 | −0.138 | −0.113 |
| Inferior parietal lobule | −0.135 | −0.131 | −0.110 |
| Inferior temporal cortex | −0.131 | −0.128 | −0.099 |
| Primary visual cortex | −0.126 | −0.141 | −0.103 |
| Hippocampus | −0.080 | −0.076 | −0.099 |
| Caudate | −0.129 | −0.112 | −0.123 |
| Putamen | −0.137 | −0.120 | −0.098 |
Note. IADL, instrumental activities of daily living score; CVDs, aggregated cardiovascular diseases; CRFs, aggregated cardiovascular risk factors. All associations were significant at P < 0.05.
This pattern is also reflected in the raw volumetric data (see Supporting Information Table A3). Moreover, we determined whether the associations between physical activity and gray‐matter volumes would remain, once individuals with conditions that may affect their physical activity were excluded from the sample. Here, we excluded participants that had different types of fractures (e.g., shoulder, leg), pain (e.g., joints, back), arthritis, implants, gout, rheumatism, disorders affecting the muscles, and polio. After excluding these individuals (n = 138), the associations between physical activity and gray‐matter volumes were numerically weaker, but still reliable (n = 276; Table 2, Model 3). Notably, physical activity was unrelated to volume of white‐matter hyperintensities (WMHs) and global white matter (WM; see Table 1).
Associations Between Inflammatory Biomarkers and Regional Gray‐Matter Volumes
In the total sample (n = 414), there were no reliable associations between any inflammatory biomarker and regional gray‐matter volumes (all Ps > 0.05). However, physical activity interacted with two biomarkers, namely IL‐12p40 and G‐CSF, in affecting volumes of LPFC (IL‐12p40: β = −1.330; G‐CSF: β = 1.739) and Hc (IL‐12p40: β = −1.985; G‐CSF: β = 2.055). Again, this pattern did not change after exclusion of participants with the above‐mentioned list of ailments (n = 138). In the fitness‐enhancing (n = 113) and health‐enhancing (n = 222) groups, biomarkers were not associated with regional brain volumes (all Ps > 0.05). However, reliable associations were present in the group with inadequate physical activity (n = 79; Table 3). Higher levels of the pro‐inflammatory marker IL‐12p40 were associated with smaller gray‐matter volumes in LPFC and Hc. By contrast, higher levels of G‐CSF were associated with larger gray‐matter volumes in the same brain regions (Table 3).
Table 3.
Associations (βs) of IL‐12p40 and G‐CSF with Gray‐Matter Volumes in the Three Physical‐Activity Groups (n = 414)
| Fitness‐enhancing | Health‐enhancing | Inadequate | |
|---|---|---|---|
| IL‐12p40 | |||
| Lateral prefrontal cortex | 0.04 | 0.01 | −0.63* |
| Hippocampus | 0.07 | 0.12 | −0.72* |
| G‐CSF | |||
| Lateral prefrontal cortex | 0.06 | 0.05 | 0.79* |
| Hippocampus | 0.01 | −0.02 | 0.56* |
Note. * P < 0.05.
To test for independence of these relationships, we constrained the associations between IL‐12p40 and LPFC to zero in the group with inadequate physical activity. After this constraint, the association between Il‐12p40 and Hc remained reliable (β = −0.56). Similarly, after constraining the association between IL‐12p40 and Hc, the link between IL‐12p40 and LPFC was still reliable (β = −0.37). The same pattern was evident for G‐CSF. After equating the associations between G‐CSF and LPFC to zero, the association between G‐CSF and Hc remained (β = 0.33). The association between G‐CSF and LPFC was also independent of the G‐CSF‐Hc link (β = 0.46). Notably, we conducted the same analyses using the general factor model, which extracts the common variance across all regions of interest. The results remained the same as reported above, suggesting that the effects may largely generalize across the brain, but are particularly strong for LPFC and Hc. The analyses further revealed that the effects of G‐CSF suggest suppression effects, as they were not observable without including the other inflammation‐related markers in the model. As with physical activity, none of the inflammatory markers were related to volume of WMHs or global WM and there were no interactive effects between physical activity and the inflammatory biomarkers on those measures.
Finally, we investigated whether individuals with inadequate physical activity and higher IL‐12p40 levels are characterized by smaller gray‐matter volume of LPFC and Hc than individuals carrying only one risk factor. To address this issue, we contrasted individuals in the lower and upper tertile of the IL‐12p40 distribution. For these analyses, individuals with health‐enhancing and fitness‐enhancing activity were grouped together, as a separation did not change the pattern of results. Compared with the reference group of physically active individuals with low levels of IL‐12p40 (n = 92), active individuals with high inflammation (n = 89) and inactive individuals with low inflammation (n = 20) did not differ with respect to gray‐matter volume of Hc and LPFC. In contrast, persons with inadequate activity and high levels of IL‐12p40 (n = 19) had smaller gray‐matter volumes of Hc (β = −0.12) and LPFC (β = −0.13).
Higher Blood Levels of IL‐12p40 and Inadequate Physical Activity are Associated with Cognitive Decline
In addition to the associations among IL‐12p40, physical activity, and gray‐matter integrity, we investigated whether physical inactivity and high levels of IL‐12p40 are associated with global cognitive decline across 6 years, as assessed by the MMSE test. Using SPSS for Windows 15.0 (SPSS, Chicago, IL), we conducted a repeated‐measures analysis of covariance with cognitive performance (baseline, 6‐year follow‐up) as dependent variable and physical‐activity group (low, high) and inflammation group (low, high) as between‐subjects factors. Again, the high physical‐activity group included individuals involved in fitness as well as health‐enhancing activities. The low‐ and high‐inflammation groups contrasted individuals in the lower and upper tertile of the IL‐12p40 distribution. As before, the analyses were adjusted for age, sex, education, CRFs, CVDs, and the remaining blood markers of inflammation.
The analyses revealed a significant main effect of inflammation, F(1, 186) = 10.5, P < 0.05, partial eta squared = 0.05, and a significant inflammation × time of assessment interaction, F(1, 184) = 4.7, P < 0.05, partial eta squared = 0.03, indicating worse overall cognition and more decline for individuals with high inflammation. Critically, the triple interaction among inflammation, physical activity, and time was significant, F(1, 184) = 5.3, P < 0.05, partial eta squared = 0.03. To trace the source of this interaction, a series of follow‐up tests was carried out. There were no mean differences in MMSE performance among groups at baseline (P > 0.10). However, inactive individuals with high levels of IL‐12p40, who also had less gray matter of Hc and LPFC, showed more cognitive decline after 6 years compared with individuals who were inactive and had low inflammation (P < 0.05) and to those characterized by high levels of activity irrespective of inflammation level (Ps < 0.05; see Fig. 2). Moreover, the latter three groups did not differ from each other with respect to MMSE at follow‐up (P > 0.1). Mean performance and standard deviation at baseline in the different group were: fitness/health‐enhancing group with low IL‐12p40 (M = 29.3; SD = 0.92), fitness/health‐enhancing group with high IL‐12p40 (M = 29.1; SD = 1.0), inadequate activity with low IL‐12p40 (M = 29.3; SD = 0.75), and inadequate activity with high IL‐12p40 (M = 29.1; SD = 0.92). The corresponding values for the 6‐year follow up were: fitness/health‐enhancing group with low IL‐12p40 (M = 28.7; SD = 1.3), fitness/health‐enhancing group with high IL‐12p40 (M = 28.5; SD = 1.5), inadequate activity with low IL‐12p40 (M = 28.9; SD = 0.85), and inadequate activity with high IL‐12p40 (M = 27.7; SD = 1.2).
Figure 2.
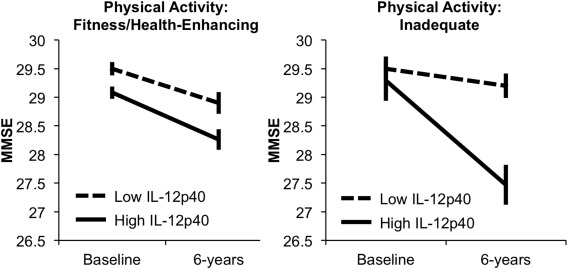
MMSE performance, adjusted for covariates, at baseline and 6‐year follow‐up as a function of physical activity and inflammation group. Error bars represent standard errors around the means.
DISCUSSION
We investigated relationships of physical activity and biomarkers of inflammation (IL‐1β, IL‐6, IL‐10, IL‐12p40, IL‐12p70, G‐CSF, TNF‐α) to gray‐matter integrity and cognitive functioning in a population‐based sample of older adults. Of particular interest was whether higher levels of physical activity in old age might counteract potential negative effects of pro‐inflammatory biomarkers on gray‐matter volume and cognitive decline in aging. Notably, analyses were conducted using SEM and the latent variables approach, which reduces measurement error and results in more reliable estimation of constructs and associations.
Higher levels of physical activity were associated with larger gray‐matter volumes in all regions of interest. Importantly, these links remained after excluding participants with diseases that might affect their physical activity levels. This pattern is in line with evidence of beneficial effects of staying active in old age on gray‐matter volume. As in previous studies, effects were more pronounced for gray‐matter than white‐matter volumes [see Voelcker‐Rehage and Niemann, 2013 for review]. In terms of regional specificity, the stronger association between physical activity and certain brain regions, such as prefrontal cortex and Hc, observed in previous studies were only present for the interactive effects between physical activity and inflammation. Thus, our data also suggest that prefrontal cortex and Hc may be particularly sensitive to effects of physical activity in relation to other individual‐differences factors. Unfortunately, we were not able to investigate the effects of physical activity and inflammation on white‐matter microstructure. Indeed, studies have shown that cardiorespiratory fitness also affects white‐matter integrity [e.g., Johnson et al., 2012; Voss et al., 2012], which may consequently have positive effects on functional brain activity in old age [Burzynska et al., 2015].
With respect to blood markers of inflammation, there were no overall relationships of the pro‐and anti‐inflammatory cytokines and the growth factor to gray‐matter integrity. Physical activity interacted with two cytokines, IL‐12p40 and G‐CSF, in affecting gray‐matter of LPFC and Hc, the two brain regions showing the strongest negative associations with age in our study as well as in previous work [for review, see Nyberg et al., 2012]. Of chief importance, the negative effects of IL‐12p40 on brain volume were present only in the group with inadequate activity levels. In addition, low physical activity and high levels of IL‐12p40 were associated with global cognitive decline after 6 years. Thus, our data suggest that negative effects of this particular pro‐inflammatory cytokine on brain volume may serve as an early marker for impending cognitive deterioration in dementia‐free older adults who are physically inactive.
Interestingly, other cytokines (IL‐6, IL‐10, IL‐1β, TNF‐α) that have been associated with brain and cognition [e.g., Marsland et al., 2015; Zhang et al., 2015] were not linked to brain volume in our study. In contrast, the current data suggest that IL‐12p40, which has been recently linked to AD‐pathology in animal work [Vom Berg et al., 2012; Tan et al., 2014], may be a more sensitive biomarker in detecting individual differences in brain integrity and cognitive decline among older adults under certain conditions, such as physical inactivity. The detrimental effects on brain and cognition were specific to IL‐12p40, and were unrelated to IL‐12p70, which is composed of the two subunits IL‐12p40 and IL‐12p35 [Langrish et al., 2004]. As compared with IL‐12p35, IL‐12p40 is expressed in greater quantities than necessary for IL‐12p70 formation. In line with our findings, animal studies examining IL‐12p40 in relation to cognitive and brain decline did not find any detrimental effects of IL‐12p35 [Tan et al., 2014; Vom Berg et al., 2012].
Moreover, our finding is in line with animal and human data suggesting that physical activity modulates inflammatory reactions [Hamer et al., 2012; Sim et al., 2009]. However, other mechanisms may also underlie the beneficial effects of physical activity on brain structure, including lowering levels of oxidative stress [Marosi et al., 2012; Sim et al., 2009], increasing neurogenesis [Kempermann, 2008], angiogenesis [Lista and Sorrentino, 2010; Maass et al., 2015], as well as decreasing amyloid burden [Head et al., 2012]. Conceivably, these processes are interrelated [see Cotman et al., 2007 for review]. Given that the physical‐activity groups did not differ with respect to overall inflammatory levels, it is likely that the beneficial effects of physical activity on inflammation are mediated through many different pathways. Alternatively, inflammation may impact brain and cognition especially among physically inactive older adults, who are also more vulnerable to the effects of inflammation due to different reasons [e.g., more CRFs, more CVDs; Rizzuto and Fratiglioni, 2014]. That said, we controlled for many potentially confounding factors, including diseases that may affect physical activity, but the effects of physical activity and IL‐12p40 on brain integrity in inactive elderly persons remained. Notably, one study, which focused on self‐reported physical activity and IL‐12p40 in old age, also failed to find modulation of inflammation as a function of physical activity [Kitahara et al., 2014]. Thus, physical activity may not necessarily lower inflammation levels, but rather act through different pathways as described above and inflammation may only become detrimental to brain and cognition once a particular threshold of inactivity is reached.
Additionally, there was a positive association between G‐CSF and gray‐matter volumes in the low‐activity group. This finding is sensible, given the role of this growth factor in down‐regulating inflammation [Sanchez‐Ramos et al., 2009]. Of note, however, this relationship was only revealed once the other inflammatory markers were adjusted for, indicating suppression effects. Given that G‐CSF and other inflammatory cytokines are upregulated together [Bendall and Bradstock, 2014], high levels of G‐CSF may thus actually reflect a higher state of inflammation. Hence, beneficial effects of G‐CSF might only be revealed after statistical adjustment of other inflammation‐related markers.
The effects observed were confined to LPFC and Hc. In general, inflammation, as measured in the periphery, is assumed to have a systemic effect on the brain [e.g., Lim et al., 2013]. Although a structural equation model with regional latent gray‐matter factors had a better fit than a model assuming that individual differences generalize across brain regions with only one latent variable, we found the same interactive effects for the latter model. One way of understanding these patterns is to assume that the effects may generalize across the brain, but are particularly strong for LPFC and Hc. Further, the associations between cytokines and gray‐matter volume of LPFC and Hc seem to be partially independent, as the associations were attenuated, but remained reliable, after controlling for each other. Thus, in those two brain regions, the systemic effects may interact with other individual‐difference factors. For instance, animal work suggests that dopamine D2 receptors regulate neural inflammation, such that lower receptor densities are linked to increased IL‐12p40 [Shao et al., 2013]. Given different distributions of D2 receptors in the brain [Shohamy and Adcock, 2010], with higher receptor densities in Hc than in LPFC, dopaminergic neuromodulation may be such an individual‐differences variable that contributes to the independent IL‐12p40 effects across these two brain regions.
One of the main limitations of our study is the lack of an objective measure for physical activity. Objective and subjective measures of physical activity have been shown to differ, in particular with respect to the self‐reported estimation of frequency data [e.g., Burzynska et al., 2015]. This may partly explain why only individuals in the fitness‐enhancing and inadequate group differed reliably from each other with respect to gray‐matter volumes of LPFC and Hc. Furthermore, it should be acknowledged that the cross‐sectional nature of the physical activity, inflammation, and volumetric data is a major limitation of the present study. The classification according to self‐rated physical activity and inflammation is likely to change longitudinally. It would be desirable to assess all variables longitudinally, which would allow directly relating changes in lifestyle to changes in inflammatory markers, brain volumes, and cognition. Moreover, such an approach could address whether increases in inflammatory markers precede and predict changes in brain and cognition. Finally, our assessment of global cognitive decline is based on MMSE, a screening tool for dementia. Future studies should address how physical inactivity and high levels of IL‐12p40 influence different cognitive constructs related to LPFC and Hc, in particular executive functioning and episodic memory.
Taken together, our findings extend the positive effects of staying active in old age on brain integrity. The negative effects of the pro‐inflammatory cytokine IL‐12p40 on gray‐matter volumes and cognitive decline were only observed in inactive elderly persons. This pattern suggests that elevated levels of IL‐12p40 are particularly detrimental in inactive older adults and may exacerbate the negative effects of physical inactivity on brain and cognition.
Supporting information
Supporting Information
ACKNOWLEDGMENTS
We thank the SNAC‐K nurses, medical doctors, and psychologists for their contribution to data collection. This research has made use of the SMILE medical imaging laboratory at Karolinska University Hospital, Stockholm, Sweden.
The authors declare no competing financial interests.
The authors declare that there is no conflict of interest.
REFERENCES
- American Psychiatric Association . (1994). Diagnostic and statistical manual of mental disorders (4th ed.). Washington, DC: Author.
- Arbuckle, J. L. (2006). Amos (Version 7.0) [Computer Program]. Chicago: SPSS.
- Ashburner J (2007): A fast diffeomorphic image registration algorithm. NeuroImage 38:95–113. [DOI] [PubMed] [Google Scholar]
- Ashburner J, Friston KJ (2005): Unified segmentation. NeuroImage 26:839–851. [DOI] [PubMed] [Google Scholar]
- Bendall LJ, Bradstock KF (2014): G‐CSF: From granulopoietic stimulant to bone marrow stem cell mobilizing agent. Cytokine Growth Factor Rev 25:355–367. [DOI] [PubMed] [Google Scholar]
- Buckley DI, Fu R, Freeman M, Rogers K, Helfand M (2009): C‐reactive protein as a risk factor for coronary heart disease: A systematic review and meta‐analyses for the U.S. Preventive Services Task Force. Ann Intern Med 151:483–495. [DOI] [PubMed] [Google Scholar]
- Burzynska AZ, Wong CN, Voss MW, Cooke GE, Gothe NP, Fanning J, McAuley E, Kramer AF (2015): Physical activity is linked to greater moment‐to‐moment variability in spontanous brain activity in older adults. Plos One 10:e0134819. [DOI] [PMC free article] [PubMed] [Google Scholar]
- Brown BM, Bourgeat P, Peiffer JJ, Burnham S, Laws SM, Rainey‐Smith SR, Bartrés‐Faz D, Villemagne VL, Taddei K, Rembach A, Bush A, Ellis KA, Macaulay SL, Rowe CC, Ames D, Masters CL, Maruff P, Martins RN (2014): Influence of BDNF Val66Met on the relationship between physical activity and brain volume. Neurology 83:1345–1352. [DOI] [PubMed] [Google Scholar]
- Colcombe SJ, Erickson KI, Scalf PE, Kim JS, Prakash R, McAuley E, Elavsky S, Marquez DX, Hu L, Kramer AF (2006): Aerobic exercise training increasesbrain volume in aging humans. J Gerontol a Biol Sci Med Sci 61:1166–1170. [DOI] [PubMed] [Google Scholar]
- Cotman CW, Berchtold NC, Christie LA (2007): Exercise builds brain health: Key roles of growth factor cascades and inflammation. Trends Neurosci 30:464–472. [DOI] [PubMed] [Google Scholar]
- Demirakca T, Brusniak W, Tunc‐Skarka N, Wolf I, Meier S, Matthäus F, Ende G, Schulze TG, Diener C (2014): Does body shaping influence brain shape? Habitual physical activity is linked to brain morphology independent of age. World J Biol Psychiatry 15:387–396. [DOI] [PubMed] [Google Scholar]
- Elderkin‐Thompson V, Irwin MR, Hellemann G, Kumar A (2012): Interleukin‐6 and memory functions of encoding and recall in healthy and depressed elderly adults. Am J Geriatr Psychiatry 20:753–763. [DOI] [PMC free article] [PubMed] [Google Scholar]
- Erickson KI, Leckie RL, Weinstein AM (2014): Physical activity, fitness, and gray matter volume. Neurobiol Aging 35:S20–S28. [DOI] [PMC free article] [PubMed] [Google Scholar]
- Erickson KI, Prakash RS, Voss MW, Chaddock L, Hu L, Morris KS, White SM, Wojcicki TR, McAuley E, Kramer AF (2009): Aerobic fitness is associated with hippocampal volume in elderly humans. Hippocampus 19:1030–1039. [DOI] [PMC free article] [PubMed] [Google Scholar]
- Fandakova Y, Lindenberger U, Shing YL (2014): Maintenance of youth‐like processing protects against false memory in later adulthood. Neurobiol Aging 36:933–941. [DOI] [PubMed] [Google Scholar]
- Folstein MF, Folstein SE, McHugh PR (1975): Mini‐Mental State: A practical method for grading the cognitive state of patients for the clinician. J Psychiatr Res 12:189–198. [DOI] [PubMed] [Google Scholar]
- Floel A, Ruscheweyh R, Kruger K, Willemer C, Winter B, Volker K, Lohmann H, Zitzmann M, Mooren F, Breitenstein C, Knecht S (2010): Physical activity and memory functions: Are neurotrophins and cerebral gray matter volume the missing link? Neuroimage 49:2756–2763. [DOI] [PubMed] [Google Scholar]
- Gunning‐Dixon FM, Head D, McQuain J, Acker JD, Raz N (1998): Differential aging of the human striatum: A prospective MR imaging study. AJNR Am J Neuroradiol 19:501–1507. [PMC free article] [PubMed] [Google Scholar]
- Hamer M, Sabia S, Batty GD, Shipley MJ, Tabak AG, Singh‐Manoux A, Kivimaki M (2012): Physical activity and inflammatory markers over 10 years: Follow‐up in men and women from the Whitehall II cohort study. Circulation 126:928–933. [DOI] [PMC free article] [PubMed] [Google Scholar]
- Hartung T (1998): Anti‐inflammatory effects of granulocyte colony‐stimulating factor. Curr Opin Hematol 5:221–225. [DOI] [PubMed] [Google Scholar]
- Head D, Bugg JM, Goate AM, Fagan AM, Mintun MA, Benzinger T, Holzmann DM, Morris JC (2012): Exercise engagement as a moderator of APOE effects on amyloid deposition. Arch Neurol 69:636–643. [DOI] [PMC free article] [PubMed] [Google Scholar]
- Johnson NF, Kim C, Clasey JL, Bailey A, Gold BT (2012): Cardiorespiratory fitness is positively correlated with cerebral white matter integrity in healthy seniors. NeuroImage 59:1514–1523. [DOI] [PMC free article] [PubMed] [Google Scholar]
- Kempermann G (2008): The neurogenic reserve hypothesis: What is adult hippocampal neurogenesis good for? Trends Neurosci 31:163–169. [DOI] [PubMed] [Google Scholar]
- Kline RB (2005): Principles and Practice of Structural Equation Modeling, 3rd ed New York: Guilford Press. [Google Scholar]
- Killgore WD, Olson EA, Weber M (2013): Physical exercise habits correlate with gray matter volume of the hippocampus in healthy adult humans. Sci Rep 3:3457. [DOI] [PMC free article] [PubMed] [Google Scholar]
- Kitahara CM, Trabert B, Katki HA, Chaturvedi AK, Kemp TJ, Pinto LA, Moore SC, Purdue MP, Wentzensen N, Hildesheim A, Shiels MS (2014): Body mass index, physical activity, and serum markers of inflammation, immunity, and insulin resistance. Cancer Epidemiol Biomarkers Prev 23:2840–2849. [DOI] [PMC free article] [PubMed] [Google Scholar]
- Langrish CL, McKenzie BS, Wilson NJ, de Waal Malefyt R, Kastelein RA, Cua DJ (2004): IL‐12 and IL‐23: master regulators of innate and adaptive immunity. Immunol Rev 202:96–105. [DOI] [PubMed] [Google Scholar]
- Lim A, Krajina K, Marsland AL (2013): Peripheral inflammation and cognitive aging. Mod Trends Pharmacopsychiatry 28:175–187. [DOI] [PubMed] [Google Scholar]
- Lindenberger U, Burzynska AZ, Nagel IE (2013): Heterogeneity in frontal lobe aging In Stuss DT, Knight RT, editors. Principles of Frontal Lobe Functions, 2nd ed New York: Oxford University Press. [Google Scholar]
- Lindwall M, Rennemark M, Halling A, Berglund J, Hassmen P (2007): Depression and exercise in elderly men and women: Findings from the Swedish national study on aging and care. J Aging Phys Act 15:41–55. [DOI] [PubMed] [Google Scholar]
- Lista I, Sorrentino G (2010): Biological mechanisms of physical activity in preventing cognitive decline. Cell Mol Neurobiol 30:493–503. [DOI] [PMC free article] [PubMed] [Google Scholar]
- Maass A, Düzel S, Goerke M, Becke A, Sobieray U, Neumann K, Lövden M, Lindenberger U, Bäckman L, Braun‐Dullaeus R, Ahrens D, Heinze HJ, Müller NG, Düzel E (2015): Vascular hippocampal plasticity after aerobic exercise in older adults. Mol Psychiatry 20:585–593. [DOI] [PubMed] [Google Scholar]
- Manos PJ, Wu R (1994): The ten point clock test: A quick screen and grading method for cognitive impairment in medical and surgical patients. Int J Psychiatry Med 24:229–244. [DOI] [PubMed] [Google Scholar]
- Marosi K, Bori Z, Hart N, Sárga L, Koltai E, Radák Z, Nyakas C (2012): Long‐term exercise treatment reduces oxidative stress in the hippocampus of aging rats. Neuroscience 226:21–28. [DOI] [PubMed] [Google Scholar]
- Marsland AL, Petersen KL, Sathanoori R, Muldoon MF, Neumann SA, Ryan C, Flory JD, Manuck SB (2006): Interleukin‐6 covaries inversely with cognitive performance among middle‐aged community volunteers. Psychosom Med 68:895–903. [DOI] [PubMed] [Google Scholar]
- Marsland AL, Gianaros PJ, Kuan DC, Sheu LK, Krajina K, Manuck SB (2015): Brain morphology links systemic inflammation to cognitive function in midlife adults. Brain Behav Immun 48:195–204. [DOI] [PMC free article] [PubMed] [Google Scholar]
- McAfoose J, Baune BT (2009): Evidence for a cytokine model of cognitive function. Neurosci Biobehav Rev 33:355–366. [DOI] [PubMed] [Google Scholar]
- McEwen SC, Hardy A, Ellingson BM, Jarrahi B, Sandhu N, Subotnik KL, Ventrura J, Nuechterlein KH (2015): Prefrontal and hippocampal brain volume deficits: Role of low physical activity on brain plasticity in first‐episode schizophrenia patients. J Int Neuropsychol Soc 21:868–879. [DOI] [PMC free article] [PubMed] [Google Scholar]
- Meredith W (1993): Measurement invariance, factor‐analysis and factorial invariance. Psychometrika 58:525–543. [Google Scholar]
- Nelson ME, Rejeski WJ, Blair SN, Duncan PW, Judge JO, King AC, Macera CA, Castaneda‐Sceppa C (2007): Physical activity and public health in older adults: Recommendation from the American College of Sports Medicine and the American Heart Association. Med Sci Sports Exerc 39:1435–1445. [DOI] [PubMed] [Google Scholar]
- Nyberg L, Lövdén M, Riklund K, Lindenberger U, Bäckman L (2012): Memory aging and brain maintenance. Trends Cogn Sci 16:292–305. [DOI] [PubMed] [Google Scholar]
- Raz N, Gunning‐Dixon F, Head D, Rodrigue KM, Williamson A, Acker JD (2004): Aging, sexual dimorphism, and hemispheric asymmetry of the cerebral cortex: Replicability of regional differences in volume. Neurobiol Aging 25:377–396. [DOI] [PubMed] [Google Scholar]
- Raz N, Lindenberger U, Rodrigue KM, Kennedy KM, Head D, Williamson A, Dahle C, Gerstorf D, Acker JD (2005): Regional brain changes in aging healthy adults: General trends, individual differences and modifiers. Cereb Cortex 15:1676–1689. [DOI] [PubMed] [Google Scholar]
- Ray S, Britschgi M, Herbert C, Takeda‐Uchimura Y, Boxer A, Blennow K, Friedman LF, Galasko DR, Jutel M, Karydas A, Kaye JA, Leszek J, Miller BL, Minthon L, Quinn JF, Rabinovici GD, Robinson WH, Sabbagh MN, So YT, Sparks DL, Tabaton M, Tinklenberg J, Yesavage JA, Tibshirani R, Wyss‐Coray T (2007): Classification and prediction of clinical Alzheimer's diagnosis based on plasma signaling proteins. Nat Med 13:1359–1362. [DOI] [PubMed] [Google Scholar]
- Rizzuto D, Fratiglioni L (2014): Lifestyle factors related to mortality and survival: A mini‐review. Gerontology 60:327–335. [DOI] [PubMed] [Google Scholar]
- Rennemark M, Lindwall M, Halling A, Berglund J (2009): Relationships between physical activity and perceived qualities of life in old age. Results of the SNAC study. Aging Ment Health 13:1–8. [DOI] [PubMed] [Google Scholar]
- R Ruscheweyh, C Willemer, K Krüger, T Duning, T Warnecke, J Sommer, K Völker, HV Ho, F Mooren, S Knecht, A Flöel (2011): Physical activity and memory functions: an interventional study. Neurobiol Aging 32:1304–1319. [DOI] [PubMed] [Google Scholar]
- Rönnlund M, Nyberg L, Bäckman L, Nilsson LG (2005): Stability, growth, and decline in adult life span development of declarative memory: Cross‐sectional and longitudinal data from a population‐based study. Psychol Aging 20:3–18. [DOI] [PubMed] [Google Scholar]
- Rovio S, Spulber G, Nieminen LJ, Niskanen E, Winblad B, Tuomilehto J, Nissinen A, Soininen H, Kivipelto M (2010): The effect of midlife physical activity on structural brain changes in the elderly. Neurobiol Aging 31:1927–1936. [DOI] [PubMed] [Google Scholar]
- Rydwik E, Welmer AK, Kareholt I, Angleman S, Fratiglioni L, Wang HX (2013): Adherence to physical exercise recommendations in people over 65–the SNAC‐Kungsholmen study. Eur J Public Health 23:799–804. [DOI] [PubMed] [Google Scholar]
- Sanchez‐Ramos J, Song S, Sava V, Catlow B, Lin X, Mori T, Cao C, Arendash GW (2009): Granulocyte colony stimulating factor decreases brain amyloid burden and reverses cognitive impairment in Alzheimer's mice. Neuroscience 163:55–72. [DOI] [PMC free article] [PubMed] [Google Scholar]
- Satizabal CL, Zhu YC, Mazoyer B, Dufouil C, Tzourio C (2012): Circulating IL‐6 and CRP are associated with MRI findings in the elderly: The 3C‐Dijon Study. Neurology 78:720–727. [DOI] [PubMed] [Google Scholar]
- Schneider P, Hampel H, Buerger K (2009): Biological marker candidates of Alzheimer's disease in blood, plasma, and serum. CNS Neurosci Ther 15:358–374. [DOI] [PMC free article] [PubMed] [Google Scholar]
- Shanely RA, Nieman DC, Henson DA, Jin F, Knab AM, Sha W (2013): Inflammation and oxidative stress are lower in physically fit and active adults. Scand J Med Sci Sports 23:215–223. [DOI] [PubMed] [Google Scholar]
- Shao W, Zhang SZ, Tang M, Zhang XH, Zhou Z, Yin YQ, Zhou QB, Huang YY, Liu YJ, Wawrousek E, Chen T, Li SB, Xu M, Zhou JN, Hu G, Zhou JW (2013): Suppression of neuroinflammation by astrocytic dopamine D2 receptors via alphaB‐crystallin. Nature 494:90–94. [DOI] [PubMed] [Google Scholar]
- Shohamy D, Adcock RA (2010): Dopamine and adaptive memory. Trends Cogn Sci 14:464–472. [DOI] [PubMed] [Google Scholar]
- Sopova K, Gatsiou K, Stellos K, Laske C (2014): Dysregulation of neurotrophic and haematopoietic growth factors in alzheimer's disease: From pathophysiology to novel treatment strategies. Curr Alzheimer Res 11:27–39. [DOI] [PubMed] [Google Scholar]
- Sim YJ, Yu S, Yoon KJ, Loiacono CM, Kohut ML (2009): Chronic exercise reduces illness severity, decreases viral load, and results in greater anti‐inflammatory effects than acute exercise during influenza infection. J Infect Dis 200:1434–1442. [DOI] [PMC free article] [PubMed] [Google Scholar]
- Tan MS, Yu JT, Jiang T, Zhu XC, Guan HS, Tan L (2014): IL12/23 p40 inhibition ameliorates Alzheimer's disease‐associated neuropathology and spatial memory in SAMP8 mice. J Alzheimers Dis 38:633–646. [DOI] [PubMed] [Google Scholar]
- Voelcker‐Rehage C, Niemann C (2013): Structural and functional brain changes related to different types of physical activity across the life span. Neurosci Biobehav Rev 37:2268–2295. [DOI] [PubMed] [Google Scholar]
- Vom Berg J, Prokop S, Miller KR, Obst J, Kalin RE, Lopategui‐Cabezas I, Wegner A, Mair F, Schipke CG, Peters O, Winter Y, Becher B, Heppner FL (2012): Inhibition of IL‐12/IL‐23 signaling reduces Alzheimer's disease‐like pathology and cognitive decline. Nat Med 18:1812–1819. [DOI] [PubMed] [Google Scholar]
- Voss MW, Heo S, Prakash RS, Erickson KI, Alves H, Chaddock L, Szabo AN, Mailey EL, Wojcicki TR, White SM, Gothe N, McAuley E, Sutton BP, Kramer AF (2012): The influence of aerobic fitness on cerebral white matterintegrity and cognitive function in older adults: Results of a one‐year exerciseintervention. Hum Brain Mapp 34:2972–2985. [DOI] [PMC free article] [PubMed] [Google Scholar]
- Walhovd KB, Storsve AB, Westlye LT, Drevon CA, Fjell AM (2014): Blood markers of fatty acids and vitamin D, cardiovascular measures, body mass index, and physical activity relate to longitudinal cortical thinning in normal aging. Neurobiol Aging 35:1055–1064. [DOI] [PubMed] [Google Scholar]
- Welmer AK, Angleman S, Rydwik E, Fratiglioni L, Qui C (2013): Association of cardiovascular burden with mobility limitation among elderly people: A population‐based study. PLoS ONE 8:e65815. [DOI] [PMC free article] [PubMed] [Google Scholar]
- World Health Organization (2010): Global recommendations on physical activity for health. Retrieved from http://whqlibdoc.who.int/publications/2010/9789241599979_eng.pdf [PubMed]
- Zhang H, Sachdev PS, Wen W, Crawford JD, Brodaty H, Baune BT, Kochan NA, Slavin M, Reppermund S, Kang K, Troller JN (2015): The relationship between inflammatory markers and voxel‐based gray matter volumes in nondemented older adults. Neurobiol Aging 37:138–146. [DOI] [PubMed] [Google Scholar]
Associated Data
This section collects any data citations, data availability statements, or supplementary materials included in this article.
Supplementary Materials
Supporting Information