

Abstract
Failure to recognize insular cortex seizures has recently been identified as a cause of epilepsy surgeries targeting the temporal, parietal, or frontal lobe. Such failures are partly due to the fact that current noninvasive localization techniques fare poorly in recognizing insular epileptic foci. Our group recently demonstrated that magnetoencephalography (MEG) is sensitive to epileptiform spikes generated by the insula. In this study, we assessed the potential of distributed source imaging and functional connectivity analyses to distinguish insular networks underlying the generation of spikes. Nineteen patients with operculo‐insular epilepsy were investigated. Each patient underwent MEG as well as T1‐weighted magnetic resonance imaging (MRI) as part of their standard presurgical evaluation. Cortical sources of MEG spikes were reconstructed with the maximum entropy on the mean algorithm, and their time courses served to analyze source functional connectivity. The results indicate that the anterior and posterior subregions of the insula have specific patterns of functional connectivity mainly involving frontal and parietal regions, respectively. In addition, while their connectivity patterns are qualitatively similar during rest and during spikes, couplings within these networks are much stronger during spikes. These results show that MEG can establish functional connectivity‐based signatures that could help in the diagnosis of different subtypes of insular cortex epilepsy. Hum Brain Mapp 37:3250–3261, 2016. © 2016 Wiley Periodicals, Inc.
Keywords: brain disorders, epilepsies, partial, brain imaging, cortical phase synchronization, nonparametric statistics
INTRODUCTION
The Insula as Cause of Epilepsy Surgery Failure
Epilepsy is a chronic condition characterized by recurrent seizures (or “ictus”) resulting from abnormal and excessive neuronal discharges. The most common form of treatment is long‐term medication to which 30% of patients are unfortunately refractory [Kwan and Brodie, 2000]. These latter patients with drug resistant epilepsy undergo epilepsy surgery evaluation [Wiebe et al., 2001], which aims at localizing the main epileptogenic foci to be removed. Standard evaluations include minimally invasive tests (video‐scalp EEG, ictal SPECT, PET, and MRI) that provide complementary information on the localization of the epileptogenic foci. However, when inconclusive, this evaluation must be complemented with invasive EEG recordings (icEEG) with intracranial electrodes to confirm the involvement of suspected brain regions. Since electrode implantation involves serious risks for patients, only a portion of brain activity can be sampled with icEEG. It is thus crucial that presurgical evaluation be optimized such that electrodes implantation accurately targets the possible epileptogenic foci. Otherwise, epileptic activity triggered in the epileptogenic foci can rapidly propagate to remotely connected brain areas (composing the epileptogenic “network”) that may be falsely targeted during surgery [Lachaux et al., 2003; Nguyen et al., 2009; Harroud et al., 2012].
Work by our group and others has shown that failing to detect foci in the insular cortex is responsible for some surgical failures [Aghakhani et al., 2004; Isnard et al., 2004; Kaido et al., 2006]. The insula, lesser known and less accessible than other lobes of the brain, is located in the depths of the Sylvian fissure. Cumulative work over the years has revealed that the insula is a complex structure densely connected to surrounding lobes [Cerliani et al., 2012; Cloutman and Lambon Ralph, 2012; Jakab et al., 2012] and is involved in a large array of processes, such as viscerosensory and somatosensory stimuli, some special senses (smell, taste, and hearing) as well as vestibular, pain, autonomic, language, and limbic networks [Augustine, 1996; Boucher et al., 2015]. This may explain why insular seizures may mimic frontal, temporal, and parietal lobe seizures [Harroud et al., 2012; Nguyen et al., 2009]. Current challenges in treating insular epilepsy include limited knowledge of this entity, lack of clinical and paraclinical data to help physicians identify it, and incomplete understanding of the insular epileptic network.
MEG Identification of Insular Epilepsy
Noninvasive magnetoencephalography (MEG) of interictal epileptiform discharges (IEDs aka spikes), which are transient electromagnetic waveforms, has the potential to provide noninvasive biomarkers of insular epilepsy since their generators largely overlap seizure onset zones [Mégevand et al., 2014]. Indeed, MEG was shown to be highly sensitive to spikes originating from the insula and localize their source accurately with single equivalent current dipole (sECD) modeling [Kakisaka et al., 2013]. In addition, sECD modeling of insular IEDs recorded with MEG could localize subtle anatomical abnormalities (2 patients out of 3), the surgical resection of which yielded good outcomes [Heers et al., 2012]. Moreover, MEG was able to discriminate anterior and posterior insular foci in 9/14 patients, and selective resection of these foci provided complete seizure freedom in all patients for whom complete resection was possible [Mohamed et al., 2013].
Good localization by sECD modeling requires careful selection of IEDs and analysis time window, so that there is a unique [Alarcon et al., 1994] and focal [Park et al., 2012] underlying source. Since serial propagation does not violate these conditions, it can be studied using sECD modeling [Kakisaka et al., 2013]. However, since the insula is densely connected to surrounding frontal, temporal, and parietal cortices, insular IEDs frequently propagate within distributed cortical networks [Nguyen et al., 2009]. As many components of these networks can be spiking simultaneously, the spatial discrimination of sECD modeling can be severely hampered [Alarcon et al., 1994]. Taken together, the studies reviewed above suggest that although sECD modeling can provide valuable information with carefully selected IEDs, it cannot address insular epileptic networks.
MEG Identification of Insular Epileptic Networks
As opposed to sECD, distributed source modeling (DSM) attempts to explain a given observed magnetic field by the distribution of source intensities in the brain instead of a single source. The main advantage of this technique is that it does not require assumptions about the number of active sources or their temporal propagation. Provided that IEDs are generated by a patch of sources with sufficient spatial extent (between 4 cm2 [Mikuni et al., 1997] and 8 cm2 [Pataraia et al., 2002]), DSM yields source time courses with excellent temporal (up to the millisecond scale) and good spatial resolutions. Interestingly, neural interactions within the brain, also called functional connectivity (FC), can be quantified through the assessment of statistical coupling among estimated source time series. To date, few have attempted to study FC during IEDs. Using a combination of independent components analysis (ICA) and DSM, Malinowska et al. [2014] recently showed that most cortical FC networks of various focal epilepsy types could be reliably extracted by MEG. It was further demonstrated that the structure of connectivity networks extracted from band pass filtered (beta band) MEG data provides useful information for the identification and surgical resection of seizure onset zones in temporal and frontal epilepsies [Dai et al., 2012]. Interestingly, it was shown that coherent neural activity in the beta band might be causally involved in epilepsy [Heers et al., 2014], which calls for frequency‐resolved functional connectivity analyses.
Many authors have suggested that these networks could serve as neural substrates for spike propagation within the cortex. With DSM of EEG recordings in temporal and frontal epilepsy patients, Lantz et al. [2001, 2003] reported that IED propagation could be dissected into microstates [Pascual‐Marqui et al., 1995], as confirmed by intracranial EEG. Similarly, employing cross‐correlation, Tanaka et al. [2010] determined that the propagation patterns of frontotemporal spikes detected with MEG are consistent with those discerned by intracranial EEG. In addition, they established that these propagation patterns are correlated with patient surgical outcome, seizure‐freedom being consistently achieved when propagation is restricted to temporal structures [Tanaka et al., 2014].
To date, the only study on insular functional networks and the propagation of electrical activity was reported recently by Almashaikhi et al. [2014]. Using intracranial electrical stimulation, they proposed a subdivision of the insula into three regions—anterior, posterior, and inferior—based on their FC networks. However, it is still unknown to what extent these networks are involved in insular IED generation. The objectives of the this article were thus (1) to extract FC networks of the anterior, posterior, and inferior insula regions and (2) to study patterns of insular IED propagation. These new insights have the potential to define FC‐based signatures of epileptic activity in insula subregions, with the aim of better guiding intracranial investigation of this region in presurgical evaluations. In addition, we identified sensor space patterns that might be suggestive for insular cortex epilepsy.
METHODS
Patients
In our institution, potential epilepsy surgery candidates undergo comprehensive presurgical assessment which includes detailed history and physical examination, neuropsychological evaluation, 3T structural MRI, long‐term video‐EEG monitoring, combined EEG/MEG recordings, ictal SPECT, and 18F‐fluorodeoxyglucose PET. In this study, 18 patients (8 females; average age 39 years; range 9–60 years) with insular or operculo‐insular epilepsy were selected based on the presence of IEDs in MEG signals in addition to 1 (or more) of the following criteria: (i) favorable surgical outcome for at least 1 year after insular or operculo‐insular corticectomy (N = 15, 12 with Engel I score); (ii) epileptogenic lesions involving the insula (N = 4); or (iii) confirmation of seizure initiation in the insula using intracerebral EEG (N = 12). Detailed clinical information is provided in Table 1. The research protocol was approved by our local ethics committee.
Table 1.
Clinical information on patients of our cohort
| Patient no. | Age | Gender | Duration (years) | Semiology: early/late | MEG spikes: number/iROI | icEEG: present/insula | Resection: insula/opercula | Seizure outcome (Engel) | F‐U (years) |
|---|---|---|---|---|---|---|---|---|---|
| 1 | 23 | F | 15 | Viscerosensory, auditory, dizziness/dyscognitive, oral + manual automatisms, tonic posturing | 57/inf | N | rad/FTP | IB | 2 |
| 2 | 54 | M | 32 | Experiential aura/simple motor, autonomic sz | 22/inf | Y/Y | rad/‐ | IA | 5 |
| 3 | 35 | F | 6 | Somatosensory and experiential aura/dyscognitive, verbal automatism | 2/inf | Y/Y | rad/T | IA | 9 |
| 4 | 51 | M | 11 | No aura/dyscognitive, manual automatisms | 42/inf | N/N | inf/T | IID | 1.5 |
| 5 | 60 | F | 2 | Somatosensory/simple motor | 20/post | N/N | pending | ‐ | ‐ |
| 6 | 22 | M | 10 | Somatosensory, dysphasia/dyscognitive | 4/inf | Y/Y | pending | ‐ | ‐ |
| 7 | 9 | F | 5 | Somatosensory/complex motor | 54/post | Y/N | post/PT | IA | 2 |
| 8 | 39 | M | 10 | No aura/dyscognitive ± GTCS | 81/ant | Y/Y | ant/‐ | IC | 5 |
| 9 | 45 | F | 12 | Dyscognitive, somatosensory, dysphasia/dyscognitive | 5/inf | Y/Y | inf/T | IC | 5 |
| 10 | 50 | M | 9 | Anxiety/dyscognitive | 14/ant | Y/N | ant/F | IIA | 2.5 |
| 11 | 25 | M | 7 | Dizziness, dysgueusia/dyscognitive, manual automatisms, minor agitation | 32/inf | N/N | inf/T | IA | 3 |
| 12 | 41 | M | 13 | Auditory, olfactory, face somatosensory, gustatory/dyscognitive ± GTCS | 10/post | Y/Y | rad/T | SUDEP | 0.3 |
| 13 | 51 | M | 31 | Viscerosensory, visceromotor/somatosensory ± dysguesia | 3/inf | Y/Y | inf/T (TL) | IA | 10 |
| 14 | 47 | F | 38 | Somatosensory/complex motor | 8/post | Y/Y | post (radiosurgery) | IIC | 6 |
| 15 | 40 | M | 14 | Affective aura/dyscognitive, manual and verbal automatisms | 30/ant | Y/Y | ant/F | IA | 4 |
| 16 | 32 | F | 30 | Somatosensory/hypertonia, complex motor; no aura, dyscognitive/± GTCS | 4/post | Y/Y | post/P | IA | 3 |
| 17 | 27 | F | 17 | No aura/gelastic, dyscognitive | 62/ant | Y/Y | ant/orb | IA | 4 |
| 18 | 47 | M | 31 | Somatosensory/complex motor | 10/post | Y/Y | post/PT | IA | 3 |
For each patient, we indicate the age at surgery, gender, duration of epilepsy, early and late symptoms during seizures, the number of MEG spikes, and the insular region of interest in which they cluster, whether they had icEEG recordings and whether those recordings identified an insular focus, the extent of insular and extrainsular resections, seizures outcome and follow‐up period (GTCS: generalized tonic‐clonic seizures, inf: inferior, ant: anterior, post: posterior, rad: radical, F: frontal, T: temporal, P: parietal, orb: orbitofrontal, SUDEP: sudden unexpected death in epilepsy, F‐U: follow‐up).
MEG‐EEG Data
Extracerebral magnetic signals were recorded by a CTF‐VSM (Coquitlam, BC, Canada) whole‐head 275‐sensor MEG system in a magnetically shielded room. Data were acquired at a 480 Hz sampling rate. In addition, scalp electrical potentials were recorded by either 19 electrodes or a 64‐channel head cap.
Simultaneous MEG‐EEG recording sessions were conducted when patients were admitted for long‐term video‐EEG monitoring. To enhance epileptic activity during recording sessions, patients were mildly sleep‐deprived and antiepileptic drugs were frequently tapered or lowered. Sessions typically lasted 45 min, during which patients were first instructed to remain awake with eyes closed, and then went to sleep.
Insular Origin of Spikes
A sample of suitable IEDs was selected for each patient and submitted to equivalent current dipole (sECD) analysis. The spike selection criteria and sECD methodology have been described extensively by Mohamed et al. [2013]. Briefly, spikes were marked on MEG and EEG traces by an expert epileptologist, who then selected those showing a clear dipolar magnetic field; this criterion ensures selected spikes have focal generators. For each spike, a dipole was selected based on the following criteria: residual error <30%, dipole moment 50–300 nAm and stable topography for at least 10 ms. Dipole location was then projected in the MNI template space using Brainstorm [Tadel et al., 2011].
We then pooled the IEDs into 6 insular regions of interest (iROIs) based on sECD analysis: left anterior (28 spikes), left posterior (40 spikes), left inferior (53 spikes), right anterior (85 spikes), right posterior (22 spikes), and right inferior (62 spikes). Each sECD was assigned with the label of the closest ROI, computed as the average distance between the dipole and the vertices of each ROI. Figure 1 displays the spatial distribution of spikes and iROIs. The insular regions were drawn manually on the MNI template brain and had similar areas. Cortical generators of iROI‐labeled spikes were then localized, and source time courses used for FC analysis. We note here that data from 11 patients were reported in a previous publication on the ability of MEG to detect insular and peri‐insular epileptic discharges [Mohamed et al., 2013].
Figure 1.
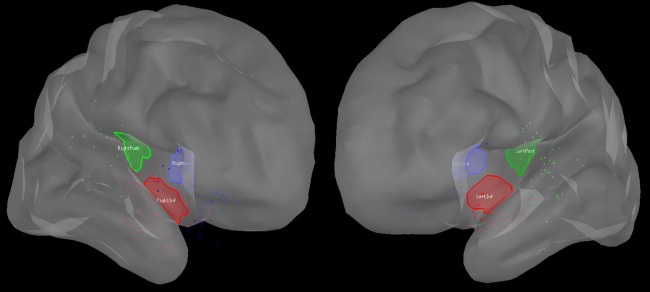
Representation of the spatial distribution of analyzed interictal insular spikes labeled with sECD for further analysis. Each spike is represented by a dot, the color of which indicates if it is labeled as an anterior (blue), posterior (green), or inferior (red) insular spike. Left panel: right hemisphere, right panel: left hemisphere.
Localization of MEG Sources
MEG recordings were imported in Brainstorm, corrected using third‐order gradient compensation, epoched around markers from −500 to 200 ms, then band‐pass filtered in the theta (4–7 Hz), alpha (8–12 Hz), and beta (12–30 Hz) bands using null‐phase FIR filters. Sensor signals were projected onto the cortical surface to obtain source time courses using the nonlinear Maximum Entropy on the Mean (MEM) algorithm [Amblard et al., 2004] which inverts the following forward model:
| (1) |
where represents the additive noise and matrix is an overlapping‐sphere forward model [Huang et al., 1999] linking magnetic fields generated by 15,000 dipoles distributed on the cortex surface to the sensors. Matrix was computed in Brainstorm based on scalp and cortical surfaces segmented from individual T1‐weighted MRI with Brainvisa [Cointepas et al., 2010]. Noise covariance of was estimated from empty‐room MEG recordings.
Functional Connectivity of Sources
We obtained analytical source signals by considering the Hilbert transform of estimated source signal . The Hilbert transform was computed as
| (2) |
where p.v. denotes the Cauchy principal value. We then computed instantaneous phase of the source signals. For each iROI ( is all iROIs), we defined as the set of epileptic spikes generated in , and as the set of sources in . were taken as seeds for connectivity analysis. Phase–phase couplings between sources in and the remaining cortex during epileptic spikes were computed respectively as
| (3) |
Coupling values were then averaged across spikes and sources within each region to obtain coupling vectors representing average connectivity with the remaining cortical sources.
Statistical Thresholds for Connectivity
We designed a nonparametric statistical testing procedure aimed at revealing iROI‐specific FC. We tested if the connectivity of each region computed with spikes , was significantly stronger than random connectivity , computed with spikes . More specifically, we iteratively selected subsets of spikes and computed:
| (4) |
Coupling values were then averaged across spikes and sources to obtain random coupling vectors and for each iteration. We computed random coupling vectors, which yielded a robust estimate of coupling values distribution under the null hypothesis. We then used the False Discovery Rate technique [Benjamini and Hochberg, 1995] to set a threshold on coupling values. This technique consists of modeling the distribution of random and true coupling values with beta functions. Starting from maximal distribution values, the threshold was decreased until the ratio between the area under beta distribution fitted on random couplings and the area under beta distribution fitted on true couplings reached a predefined p‐value, set here to 5%.
Propagation Patterns
To better understand the propagation of epileptic activity generated within the insula, we separately computed the propagation patterns of epileptic spikes generated by each insular subregion. Analysis was carried out in the sensors space to help clinicians recognize propagation patterns of insular MEG spikes based on visual analysis. Based on sensor signal for each spike , where is the set of spikes generated by a given insular region , we determined the local maximum closest to the spike marker (time 0 of epochs) and measured the latency corresponding to half the maximum value of that peak for each sensor (as detailed in Tanaka et al. [2014]). We then converted latencies into ranks for noise reduction purposes. In addition, we retained absolute value of local maximum amplitude and computed average propagated spike amplitude .
Significant spike propagation. We then sought significant propagation by thresholding spike amplitudes . For each sensor , we computed the amplitudes of 1,000 randomly selected local maxima within the 2 s baseline preceding the spikes and generated distribution of random peak amplitudes. Spike amplitudes were statistically significant with p < 0.05 if they were larger than 950 random amplitude . Propagation ranks of nonsignificant sensors were set to 0 and did not contribute to propagation patterns.
Propagation patterns. Ranks described the propagation sequences of each epileptic spike generated within iROI over the scalp surface. Because of high activation sequence variability across spikes, we did not average ranks over spikes but rather sought propagation patterns that were reproducible over a subsample of spikes. We thus applied Euclidian distance‐based hierarchical clustering on columns of using built‐in Matlab functions (The Mathworks, Inc., Natick, MA). The hierarchical clustering tree was cut at 80% of its range. Propagation ranks within the largest class were then averaged to produce propagation patterns.
RESULTS
Functional Connectivity During Spikes
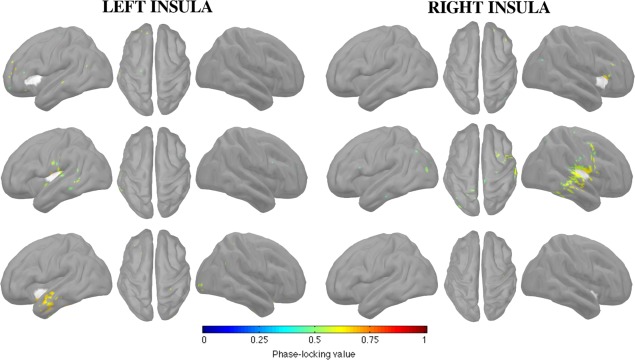
We applied source‐level phase–phase coupling measures , as described in the section titled “Statistical Thresholds for Connectivity.” Figure 2 presents the functional networks detected in the beta band and involving each iROI (anterior, posterior, and inferior) and hemisphere (left, right). We observed specific networks involving anterior and posterior iROIs bilaterally, but no network specific to inferior iROIs.
Figure 2.

FC of insular subregions in the beta band (12–30 Hz) during interictal spikes. Each insular subregion is represented in 3 panels (left, top, and right views), with insular seeds appearing in white. Top row: anterior subregion; middle row: posterior subregion; bottom row: inferior subregion. The color scale encodes the strength of coupling between insular seeds and the rest of the cortex, after statistical thresholding.
The network that was specific to the anterior region of the insula mainly involved ipsilateral areas, namely, the inferior frontal, inferior orbito‐frontal, mid‐frontal, superior frontal and precentral gyri, and mid‐cingulate sulcus. We also observed the contribution of contralateral orbitofrontal gyri and sparse connectivity with the contra‐lateral calcarine fissure.
The network that was specific to the posterior region of the insula also involved primarily ipsilateral areas, namely, the inferior angular, inferior supramarginal, caudal part of the superior temporal and inferior postcentral gyri.
To compare connectivity within different frequency bands, we applied the same analysis to theta (4–7 Hz), alpha (8–12 Hz), and broad (4–30 Hz) bands. Supporting Information, Figures 1–3 report the results of those analyses. We observed connectivity patterns with narrow‐band signals very similar to those with broader bands (4–30 Hz).
Functional Connectivity During Rest
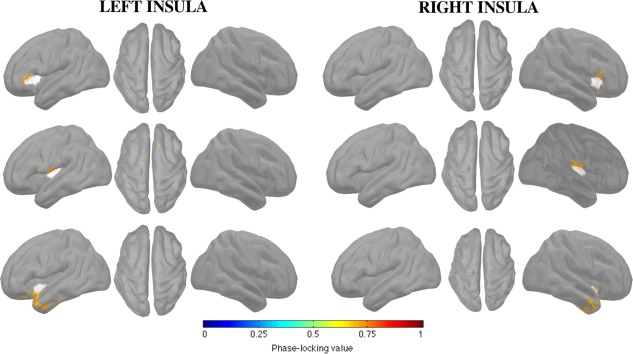
We applied the same methodology as in the previous section, except that the markers were randomly placed in the resting state MEG signal (Figure 3). We note here that this procedure yielded a minimal percentage of overlap between spike and random epochs (2.0 ± 1.8%). Globally, the connectivity networks observed with resting state signals resembled those seen during spikes, but with weaker coupling between the insula and cortex.
Figure 3.
FC of insular subregions in the beta band (12–30 Hz) during rest. Each insular subregion is represented in 3 panels (left, top, and right views), with the insular seeds appearing in white.
The network that was specific to the anterior insula was sparse and included the anterior part of middle and superior frontal gyri, for both left and right insulae. The network that was specific to the posterior insula mainly and bilaterally involved the inferior part of the post‐central gyrus and the posterior part of superior and mid‐temporal gyri. Finally, we noted a specific network for the left inferior insula, mainly encompassing the anterior parts of superior and mid‐temporal gyri.
We assessed differences between FC during spikes and rest. We found that coupling within insular connectivity networks was stronger during spikes than during rest for all iROIs, as revealed by nonparametric t‐tests (Bonferroni‐corrected). These results are illustrated in Figure 4.
Figure 4.
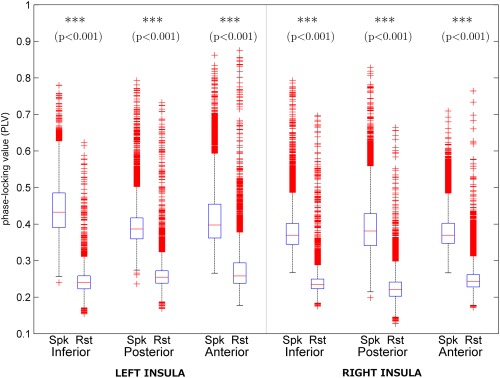
Comparison of unthresholded coupling strengths within insular connectivity subnetworks observed during interictal spikes in the beta band. Significance levels were Bonferroni‐corrected for multiple comparisons.
Spurious Connectivity
To gauge bias of the source‐imaging algorithm on measured FC, we applied the same methodology as in the sections “Functional Connectivity of Sources” and “Statistical Thresholds for Connectivity” but on shuffled data (spatial randomization of MEG sensors).
We showed that spurious functional networks are spatially restricted to the close neighborhood of iROIs (Figure 5). For the anterior insula, spurious networks were limited bilaterally to the ventral part of the ipsilateral frontal operculum. For the posterior insula, spurious networks were restricted to the ventral part of the central operculum. Finally, the inferior insula showed a spurious functional network extending bilaterally from the anterior part of superior and mid‐temporal gyri and to the polar temporal lobe.
Figure 5.
FC of insular subregions in the beta band (12–30 Hz) during shuffled spike epochs. Shuffling was done at the sensor level to disrupt spatial structure of the data.
Propagation Patterns
Hierarchical clustering using a fixed cut‐off yielded one dominant class for each insular ROI. Percentage of spikes included in the dominant class was 85%, 88%, and 75% for anterior, inferior, and posterior ROIs, respectively, averaged over both hemispheres.
We observed distinct propagation patterns of spikes originating from the anterior, inferior, and posterior regions of the insula (Figure 6). Anterior insular spikes occurred first over the inferior frontal and anterior temporal sensors, and then propagated posteriorly to parietal and parieto‐occipital sensors. Typical propagation delays varied between 4 and 6 ms.
Figure 6.
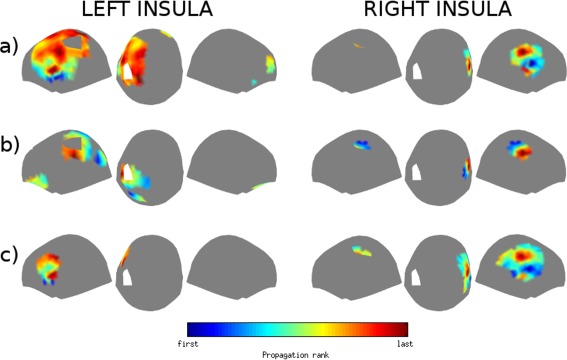
Propagation patterns observed at the scalp level of interictal spikes generated by (a) anterior, (b) posterior, and (c) inferior subregions of the insula. Left panel: left insula; right panel: right insula. The color scale encodes propagation rank and is scaled to the local maxima and minima of each map.
Inferior insular spikes were first detected over ipsilateral inferior frontal sensors and propagated dorsally to the superior frontal sensors. Typical propagation delays varied between 4 and 8 ms.
Posterior insular spikes were first detected over posterior parietal sensors and then propagated anteriorly to fronto‐parietal sensors. Typical propagation delays between 4 and 8 ms.
DISCUSSION
This is the first report on the FC of different anatomical regions of the insula with the remaining cortex in the context of spontaneous epileptic activity. Since insular cortex epilepsy is still a rarely detected disease, noninvasive neuroimaging data on ICE are rare and our MEG data are unique. Our database is thus a unique opportunity to study the large‐scale network correlates of insular interictal spikes.
Functional Connectivity Correlates of Insular Spikes
The insular regions we studied were shown to have different networks of FC during resting‐state periods. In addition to spontaneous resting‐state activity, electrical stimulation of the insula in epileptic patients showed that those 3 insular regions are connected to different subsets of cortical and subcortical regions [Almashaikhi et al., 2014]. Recent work by our group also demonstrated similar networks with diffusion MRI data [Ghaziri et al., 2015]. Taken together, these studies indicate that the anterior insula is primarily connected functionally to frontal and orbitofrontal cortices, while the posterior insula is mainly linked to the paracentral, parietal, and temporo‐parietal cortices. These networks were consistently seen across studies. In turn, the inferior insula was found to be functionally connected mainly to deeper areas, such as the pregenual anterior cingulate cortex [Deen et al., 2011; Margulies et al., 2007] and the amygdala [Flynn, 1999; Mesulam and Mufson, 1982; Mufson et al., 1981].
To our knowledge, our results are the first to demonstrate that these functional networks are brought into play during epileptiform spikes. Indeed, the reported functional networks specific to anterior and posterior insulae are consistent with those observed by diffusion imaging [Deen et al., 2011] and resting‐state functional MRI [Cauda et al., 2012] studies. We note slight bilateral asymmetries in anterior and posterior functional connectivity patterns (Figure 2). However, those differences are small and do not alter the dissociation between anterior and posterior insular connectivity patterns. We thus believe they might be due to intrinsic variability in the data rather than to asymmetries in insular functional connectivity.
It should be noted here that we found no functional network specific to the inferior region of the insula. One possible explanation of this result is the extensive connections of that region with deeper areas, which are hard to assess with MEG because of a lower signal‐to‐noise ratio [Hillebrand and Barnes, 2002]. In addition, the spatial distribution of spikes labeled as inferior insular spikes shows higher variability than the other 2 insular regions. Consequently, the inferior region may, in fact, include spikes from functionally different insular subregions. More data are needed to restrict the analysis to purely inferior spikes. Last, even though the number of recorded spikes differs among iROIs, we do not think this could explain the lack of significant results for the inferior region. Indeed, we observed significant connectivity for the anterior insula both when it had more (right hemisphere) and less (left hemisphere) spikes than the inferior insula.
Insular Networks and the Semiology of Seizures
During the last decade, the epilepsy community shifted from a zonal definition of epileptogenic tissues to distributed epileptogenic networks. In the latter view, epileptic activity results from an imbalance in the interactions of distributed brain regions forming a functional network, and any node of these networks can theoretically trigger such activity [Spencer, 2002]. Importantly, components of a patient's network are very reproducible features of its epileptic activity while its temporal features could be highly variable. In other words, although epileptic activity involves a consistent set of regions, the timing or onset of such activity can vary across interictal spikes and seizures.
This view is consistent with the variety of symptoms associated with insular cortex epilepsy. Indeed, nocturnal hypermotor seizures (NHS), which are typical manifestations of nocturnal frontal lobe epilepsy, are mainly observed in patients with anterior insular epilepsy [Dobesberger et al., 2008; Ryvlin et al., 2006]. In patients with electrodes sampling the insula, intracerebral EEG recordings demonstrate that epileptic activity is initiated in the insula in an early asymptomatic phase, then spreads to the frontal regions where it consistently triggers NHS, with the anterior insular network we observed. In other patients, seizures start synchronously over insular and frontal contacts. Similarly, it has been shown that patients in whom insular seizures propagate to temporal and parietal regions display typical temporal and parietal seizures, respectively [Nguyen et al., 2009], which is consistent with our postero‐insular network. Our results thus support the hypothesis that insular seizures can mimic other types of seizures through the propagation of epileptic activity within its connectivity network.
In addition, we showed that coupling within these networks is significantly stronger during spikes than during resting‐state periods. This result suggests that hypersynchrony, which is readily observable within epileptogenic regions in absence of epileptiform activity [Schevon et al., 2007], is exacerbated during interictal spikes, as was previously shown during seizures [Bartolomei et al., 2008; Spencer, 2002; Burns et al., 2014].
Spurious Connectivity
Several authors have pointed out that FC analysis, based on source signals inferred from electromagnetic (MEG/EEG) data, is deemed corrupted by spurious connectivity. This is due to the fact that any solution of the MEG/EEG source inference problem is affected by so‐called source signal leakage. Source leakage refers to the fact that inferred source activity is usually more extended spatially than the actual active brain region observed through simulation. Consequently, MEG/EEG source inference introduces spurious coupling among neighboring sources.
In this work, we adopted 2 strategies to control the effect of source leakage on estimated FC. First, the MEM algorithm infers source intensity with better estimation of spatial extent compared to other standard methods. The ability of the MEM algorithm to recover the spatial extent of inferred sources has been demonstrated with both EEG [Grova et al., 2006; Heers et al., 2015] and MEG data [Chowdhury et al., 2013; Heers et al., 2015]. Also, the spatial extent of the sources reconstructed with the MEM was shown to match the extent of the most significant cluster of BOLD activation [Heers et al., 2014], which makes this method a good tool for reducing the source leakage effect. Second, statistical thresholding removes spurious connectivity due to source leakage. Indeed, we applied this method on spike epochs with shuffled sensors, which amounted to disrupting the spatial structure of spike networks. In these shuffled epochs, very little spurious connectivity survives statistical thresholding. In addition, none of the long‐range connections observed with spike data survived statistical thresholding with shuffled data, indicating that our results on spikes were not contaminated by spurious connectivity.
Spike Propagation Networks
Previous studies have shown that interictal spike propagation patterns are indicative of the hierarchical structure of epileptic networks. By labeling early spiking sources as “driving” nodes, it has been found that their surgical removal is correlated with good surgical outcomes while failure to eradicate them is associated with poor outcomes [Alarcon et al., 1997]. In the same vein, one study found that successful resection of the main driving node during interictal spikes, as revealed by the directed transfer function, is correlated with good surgical outcome [Dai et al., 2012]. In this study, we could not correlate propagation patterns with surgical outcome because the majority of our patients had a favorable outcome after surgery, thus limiting the range of surgical outcomes.
We investigated propagation patterns with the aim of providing visual clues on the insular origin of epileptiform spikes based on inspection of MEG traces. At the sensors level, spike propagation patterns can be indicative of the insular region generating them. Indeed, spikes generated in anterior, inferior, and posterior insulae propagate along antero‐posterior, ventro‐dorsal, and postero‐anterior axes, respectively. These patterns still need to be compared against those of extrainsular spikes to assess their specificity to insular cortex epilepsy and thus to validate their clinical potential as a diagnostic tool of insula cortex epilepsy. We note here that the observed propagation patterns might reflect both changes in source orientation and spatial distribution. In addition, similar analysis on the source level did not yield consistent propagation patterns (data not shown). One possible explanation is that source reconstruction can introduce jitters in spike peaks because of noise, which can compromise propagation analysis. Even though source‐level propagation was successfully analyzed using sECD modeling, its usefulness for studying insular spikes propagation might be questionable given that the dense insular connectivity might hamper the accuracy of sECD modeling. Last, it is noteworthy that FC and propagation analyses reveal grossly overlapping networks. However, differences between the 2 analyses might be attributed to the fact that they exploit orthogonal informations (phase vs amplitude), thus they might reflect the complementary rather than contradictory nature of these analyses.
CONCLUSION
In this work, we showed that the anterior and posterior insular regions are involved in distinct functional networks during epileptiform spikes. The reported networks are concordant with structural connectivity of the insula, which supports the hypothesis that epileptiform activity results from dysfunctional brain networks. In addition, we observed that spikes generated within those regions display distinct propagation patterns on MEG sensors, which might serve to flag possible cases of insular cortex epilepsy, and thus help improve the detection rate of this disease. Comparison with propagation patterns in other forms of epilepsy is needed to verify this possibility.
Supporting information
Supporting Information Figure 1.
Supporting Information Figure 2.
Supporting Information Figure 3.
REFERENCES
- Aghakhani Y, Rosati A, Dubeau F, Olivier A, Andermann F (2004): Patients with temporoparietal ictal symptoms and inferomesial EEG do not benefit from anterior temporal resection. Epilepsia 45:230–236. [DOI] [PubMed] [Google Scholar]
- Alarcon G, Garcia Seoane JJ, Binnie CD, Martin Miguel MC, Juler J, Polkey CE, Elwes RD, Ortiz Blasco JM (1997): Origin and propagation of interictal discharges in the acute electrocorticogram. Implications for pathophysiology and surgical treatment of temporal lobe epilepsy. Brain 120:2259–2282. [DOI] [PubMed] [Google Scholar]
- Alarcon G, Guy CN, Binnie CD, Walker SR, Elwes RD, Polkey CE (1994): Intracerebral propagation of interictal activity in partial epilepsy: Implications for source localisation. J Neurol Neurosurg Psychiatry 57:435–449. [DOI] [PMC free article] [PubMed] [Google Scholar]
- Almashaikhi T, Rheims S, Jung J, Ostrowsky‐Coste K, Montavont A, De Bellescize J, Arzimanoglou A, Keo Kosal P, Guénot M, Bertrand O, Ryvlin P (2014): Functional connectivity of insular efferences. Hum Brain Mapp 35:5279–5294. [DOI] [PMC free article] [PubMed] [Google Scholar]
- Amblard C, Lapalme E, Lina JM (2004): Biomagnetic source detection by maximum entropy and graphical models. IEEE Trans Biomed Eng 51:427–442. [DOI] [PubMed] [Google Scholar]
- Augustine JR (1996): Circuitry and functional aspects of the insular lobe in primates including humans. Brain Res Brain Res Rev 22:229–244. [DOI] [PubMed] [Google Scholar]
- Bartolomei F, Chauvel P, Wendling F (2008): Epileptogenicity of brain structures in human temporal lobe epilepsy: A quantified study from intracerebral EEG. Brain J Neurol 131:1818–1830. [DOI] [PubMed] [Google Scholar]
- Benjamini Y, Hochberg Y (1995): Controlling the false discovery rate: A practical and powerful approach to multiple testing. J Roy Stat Soc Ser B 57:289–300. [Google Scholar]
- Boucher O, Rouleau I, Escudier F, Malenfant A, Denault C, Charbonneau S, Finet P, Lassonde M, Lepore F, Bouthillier A, Nguyen DK (2015): Neuropsychological performance before and after partial or complete insulectomy in patients with epilepsy. Epilepsy Behav EB 43:53–60. [DOI] [PubMed] [Google Scholar]
- Burns SP, Santaniello S, Yaffe RB, Jouny CC, Crone NE, Bergey GK, Anderson WS, Sarma SV (2014): Network dynamics of the brain and influence of the epileptic seizure onset zone. Proc Natl Acad Sci 111:E5321–E5330. [DOI] [PMC free article] [PubMed] [Google Scholar]
- Cauda F, Costa T, Torta DME, Sacco K, D'Agata F, Duca S, Geminiani G, Fox PT, Vercelli A (2012): Meta‐analytic clustering of the insular cortex: Characterizing the meta‐analytic connectivity of the insula when involved in active tasks. NeuroImage 62:343–355. [DOI] [PMC free article] [PubMed] [Google Scholar]
- Cerliani L, Thomas RM, Jbabdi S, Siero JCW, Nanetti L, Crippa A, Gazzola V, D'Arceuil H, Keysers C (2012): Probabilistic tractography recovers a rostrocaudal trajectory of connectivity variability in the human insular cortex. Hum Brain Mapp 33:2005–2034. [DOI] [PMC free article] [PubMed] [Google Scholar]
- Chowdhury RA, Lina JM, Kobayashi E, Grova C (2013): MEG source localization of spatially extended generators of epileptic activity: Comparing entropic and hierarchical Bayesian approaches. Ed. Gareth Robert Barnes. PLoS ONE 8:e55969. [DOI] [PMC free article] [PubMed] [Google Scholar]
- Cloutman LL, Lambon Ralph MA (2012): Connectivity‐based structural and functional parcellation of the human cortex using diffusion imaging and tractography. Front Neuroanat 6:34. [DOI] [PMC free article] [PubMed] [Google Scholar]
- Cointepas Y, Geffroy D, Souedet N, Denghien I, Rivière D (2010): The BrainVISA project: a shared software development infrastructure for biomedical imaging research. In: Proc. 16th HBM. Paris.
- Dai Y, Zhang W, Dickens DL, He B (2012): Source connectivity analysis from MEG and its application to epilepsy source localization. Brain Topogr 25:157–166. [DOI] [PMC free article] [PubMed] [Google Scholar]
- Deen B, Pitskel NB, Pelphrey KA (2011): Three systems of insular functional connectivity identified with cluster analysis. Cereb Cortex 21:1498–1506. [DOI] [PMC free article] [PubMed] [Google Scholar]
- Dobesberger J, Ortler M, Unterberger I, Walser G, Falkenstetter T, Bodner T, Benke T, Bale R, Fiegele T, Donnemiller E, Gotwald T, Trinka E (2008): Successful surgical treatment of insular epilepsy with nocturnal hypermotor seizures. Epilepsia 49:159–162. [DOI] [PubMed] [Google Scholar]
- Flynn FG (1999): Anatomy of the insula functional and clinical correlates. Aphasiology 13:55–78. [Google Scholar]
- Ghaziri J, Tucholka A, Girard G, Houde JC, Boucher O, Gilbert G, Lippé S, Descoteaux M, Rainville P, Nguyen DK (2015): The corticocortical structural connectivity of the human insula. Cereb Cortex. [DOI] [PubMed] [Google Scholar]
- Grova C, Daunizeau J, Lina J‐M, Bénar CG, Benali H, Gotman J (2006): Evaluation of EEG localization methods using realistic simulations of interictal spikes. NeuroImage 29:734–753. [DOI] [PubMed] [Google Scholar]
- Harroud A, Bouthillier A, Weil AG, Nguyen DK (2012): Temporal lobe epilepsy surgery failures: A review. Epilepsy Res Treat 2012:201651. [DOI] [PMC free article] [PubMed] [Google Scholar]
- Heers M, Chowdhury RA, Hedrich T, Dubeau F, Hall JA, Lina JM, Grova C, Kobayashi E (2015): Localization accuracy of distributed inverse solutions for electric and magnetic source imaging of interictal epileptic discharges in patients with focal epilepsy. Brain Topogr [DOI] [PubMed] [Google Scholar]
- Heers M, Hedrich T, An D, Dubeau F, Gotman J, Grova C, Kobayashi E (2014): Spatial correlation of hemodynamic changes related to interictal epileptic discharges with electric and magnetic source imaging. Hum Brain Mapp 35:4396–4414. [DOI] [PMC free article] [PubMed] [Google Scholar]
- Heers M, Rampp S, Stefan H, Urbach H, Elger CE, von Lehe M, Wellmer J (2012): MEG‐based identification of the epileptogenic zone in occult peri‐insular epilepsy. Seizure 21:128–133. [DOI] [PubMed] [Google Scholar]
- Hillebrand A, Barnes GR (2002): A quantitative assessment of the sensitivity of whole‐head MEG to activity in the adult human cortex. NeuroImage 16:638–650. [DOI] [PubMed] [Google Scholar]
- Huang MX, Mosher JC, Leahy RM (1999): A sensor‐weighted overlapping‐sphere head model and exhaustive head model comparison for MEG. Phys Med Biol 44:423–440. [DOI] [PubMed] [Google Scholar]
- Isnard J, Guénot M, Sindou M, Mauguière F (2004): Clinical manifestations of insular lobe seizures: A stereo‐electroencephalographic study. Epilepsia 45:1079–1090. [DOI] [PubMed] [Google Scholar]
- Jakab A, Molnár PP, Bogner P, Béres M, Berényi EL (2012): Connectivity‐based parcellation reveals interhemispheric differences in the insula. Brain Topogr 25:264–271. [DOI] [PubMed] [Google Scholar]
- Kaido T, Otsuki T, Nakama H, Kaneko Y (2006): Hypermotor seizure arising from insular cortex. Epilepsia 47:1587–1588. [DOI] [PubMed] [Google Scholar]
- Kakisaka Y, Alkawadri R, Wang ZI, Enatsu R, Mosher JC, Dubarry A‐S, Alexopoulos AV, Burgess RC (2013): Sensitivity of scalp 10‐20 EEG and magnetoencephalography. Epileptic Disord Int Epilepsy J Videotape 15:27–31. [DOI] [PMC free article] [PubMed] [Google Scholar]
- Kwan P, Brodie MJ (2000): Epilepsy after the first drug fails: Substitution or add‐on? Seizure 9:464–468. [DOI] [PubMed] [Google Scholar]
- Lachaux JP, Rudrauf D, Kahane P (2003): Intracranial EEG and human brain mapping. J Physiol Paris 97:613–628. [DOI] [PubMed] [Google Scholar]
- Lantz G, Michel C, Seeck M, Blanke O, Spinelli L, Thut G, Landis T, Rosén I (2001): Space‐oriented segmentation and 3‐dimensional source reconstruction of ictal EEG patterns. Clin Neurophysiol 112:688–697. [DOI] [PubMed] [Google Scholar]
- Lantz G, Spinelli L, Seeck M, de Peralta Menendez RG, Sottas CC, Michel CM (2003): Propagation of interictal epileptiform activity can lead to erroneous source localizations: A 128‐channel EEG mapping study. J Clin Neurophysiol Off Publ Am Electroencephalogr Soc 20:311–319. [DOI] [PubMed] [Google Scholar]
- Malinowska U, Badier J‐M, Gavaret M, Bartolomei F, Chauvel P, Bénar C‐G (2014): Interictal networks in magnetoencephalography. Hum Brain Mapp 35:2789–2805. [DOI] [PMC free article] [PubMed] [Google Scholar]
- Margulies DS, Kelly AMC, Uddin LQ, Biswal BB, Castellanos FX, Milham MP (2007): Mapping the functional connectivity of anterior cingulate cortex. NeuroImage 37:579–588. [DOI] [PubMed] [Google Scholar]
- P Mégevand, L Spinelli, M Genetti, V Brodbeck, S Momjian, K Schaller, CM Michel, S Vulliemoz, M Seeck (2014): Electrical source imaging of interictal activity accurately localizes the seizure onset zone. J Neurol Neurosurg Psychiatry 85:38–43. [DOI] [PubMed] [Google Scholar]
- Mesulam MM, Mufson EJ (1982): Insula of the old world monkey. III: Efferent cortical output and comments on function. J Comp Neurol 212:38–52. [DOI] [PubMed] [Google Scholar]
- M Mikuni, T Nagamine, A Ikeda, K Terada, W Taki, J Kimura, H Kikuchi, H Shibasaki (1997): Simultaneous recording of epileptiform discharges by MEG and subdural electrodes in temporal lobe epilepsy. NeuroImage 5:298–306. [DOI] [PubMed] [Google Scholar]
- Mohamed IS, Gibbs SA, Robert M, Bouthillier A, Leroux J‐M, Khoa Nguyen D (2013): The utility of magnetoencephalography in the presurgical evaluation of refractory insular epilepsy. Epilepsia 54:1950–1959. [DOI] [PubMed] [Google Scholar]
- Mufson EJ, Mesulam MM, Pandya DN (1981): Insular interconnections with the amygdala in the rhesus monkey. Neuroscience 6:1231–1248. [DOI] [PubMed] [Google Scholar]
- Nguyen DK, Nguyen DB, Malak R, Leroux J‐M, Carmant L, Saint‐Hilaire J‐M, Giard N, Cossette P, Bouthillier A (2009): Revisiting the role of the insula in refractory partial epilepsy. Epilepsia 50:510–520. [DOI] [PubMed] [Google Scholar]
- Park H‐M, Nakasato N, Tominaga T (2012): Localization of abnormal discharges causing insular epilepsy by magnetoencephalography. Tohoku J Exp Med 226:207–211. [DOI] [PubMed] [Google Scholar]
- Pascual‐Marqui RD, Michel CM, Lehmann D (1995): Segmentation of brain electrical activity into microstates: Model estimation and validation. IEEE Trans Biomed Eng 42:658–665. [DOI] [PubMed] [Google Scholar]
- E Pataraia, C Baumgartner, G Lindinger, L Deecke (2002): Magnetoencephalography in presurgical epilepsy evaluation. Neurosurg Rev 25:141–159. [DOI] [PubMed] [Google Scholar]
- Ryvlin P, Rheims S, Risse G (2006): Nocturnal frontal lobe epilepsy. Epilepsia 47:83–86. [DOI] [PubMed] [Google Scholar]
- Schevon CA, Cappell J, Emerson R, Isler J, Grieve P, Goodman R, Mckhann G, Weiner H, Doyle W, Kuzniecky R, Devinsky O, Gilliam F (2007): Cortical abnormalities in epilepsy revealed by local EEG synchrony. NeuroImage 35:140–148. [DOI] [PMC free article] [PubMed] [Google Scholar]
- Spencer SS (2002): Neural networks in human epilepsy: Evidence of and implications for treatment. Epilepsia 43:219–227. [DOI] [PubMed] [Google Scholar]
- Tadel F, Baillet S, Mosher JC, Pantazis D, Leahy RM (2011): Brainstorm: A user‐friendly application for MEG/EEG analysis. Comput Intell Neurosci 2011:1–13. [DOI] [PMC free article] [PubMed] [Google Scholar]
- Tanaka N, Hämäläinen MS, Ahlfors SP, Liu H, Madsen JR, Bourgeois BF, Lee JW, Dworetzky BA, Belliveau JW, Stufflebeam SM (2010): Propagation of epileptic spikes reconstructed from spatiotemporal magnetoencephalographic and electroencephalographic source analysis. NeuroImage 50:217–222. [DOI] [PMC free article] [PubMed] [Google Scholar]
- Tanaka N, Peters JM, Prohl AK, Takaya S, Madsen JR, Bourgeois BF, Dworetzky BA, Hämäläinen MS, Stufflebeam SM (2014): Clinical value of magnetoencephalographic spike propagation represented by spatiotemporal source analysis: Correlation with surgical outcome. Epilepsy Res 108:280–288. [DOI] [PMC free article] [PubMed] [Google Scholar]
- Wiebe S, Blume WT, Girvin JP, Eliasziw M, Effectiveness and Efficiency of Surgery for Temporal Lobe Epilepsy Study Group (2001): A randomized, controlled trial of surgery for temporal‐lobe epilepsy. N Engl J Med 345:311–318. [DOI] [PubMed] [Google Scholar]
Associated Data
This section collects any data citations, data availability statements, or supplementary materials included in this article.
Supplementary Materials
Supporting Information Figure 1.
Supporting Information Figure 2.
Supporting Information Figure 3.