

Abstract
Fast cancellation or switching of action plans is a critical cognitive function. Rapid signal transmission is key for quickly executing and inhibiting responses, and the structural integrity of connections between brain regions plays a crucial role in signal transmission speed. In this study, we used the search‐step task, which has been used in nonhuman primates to measure dynamic alteration of saccade plans, in combination with functional and diffusion‐weighted MRI. Functional MRI results were used to identify brain regions involved in the reactive control of gaze. Probabilistic tractography was used to identify white matter pathways connecting these structures, and the integrity of these connections, as indicated by fractional anisotropy (FA), was correlated with search‐step task performance. Average FA from tracts between the right frontal eye field (FEF) and both right supplementary eye field (SEF) and the dorsal striatum were associated with faster saccade execution. Average FA of connections between the dorsal striatum and both right SEF and right inferior frontal cortex (IFC) as well as between SEF and IFC predicted the speed of inhibition. These relationships were largely behaviorally specific, despite the correlation between saccade execution and inhibition. Average FA of connections between the IFC and both SEF and the dorsal striatum specifically predicted the speed of inhibition, and connections between the FEF and SEF specifically predicted the speed of execution. In addition, these relationships were anatomically specific; correlations were observed after controlling for global FA. These data suggest that networks supporting saccade initiation and inhibition are at least partly dissociable. Hum Brain Mapp 37:2811–2822, 2016. © 2016 Wiley Periodicals, Inc.
Keywords: executive function, diffusion tensor imaging, eye movements, frontal lobe, striatum, diffusion tractography
INTRODUCTION
Fast cancellation or switching of action plans is a critical cognitive function, allowing us to adapt our ongoing behavior in a dynamic environment. Paradigms developed to study such dynamic alteration of motor plans generally require subjects to make a rapid response to a GO stimulus. On a minority of trials, however, a second signal is presented that instructs the subject to inhibit or both inhibit and change the prepared action plan [Lappin and Eriksen, 1966; Logan and Burkell, 1986]. Performance on such tasks can be modeled as a race between competing GO and STOP processes, and based on this model the covert time needed to inhibit a response (stop signal reaction time; SSRT) can be estimated [Logan and Cowan, 1984].
There is a rich literature in both humans and nonhuman primates describing the neural network involved in reactive control of movement. One major difference between the studies using neurophysiological single unit recordings performed on nonhuman primates and human neuroimaging studies is the effector with which participants were required to respond. The former used mainly oculomotor responses [but see Chen et al., 2010; Mirabella et al., 2011; Scangos and Stuphorn, 2010; Scangos et al., 2013],whereas the human studies have used mainly manual responses.
Single unit recording and human functional MRI (fMRI) studies have shown that activity within the frontal eye fields (FEF) and supplementary eye fields (SEF), couched within the supplementary motor complex (SMC), is modulated when saccades are correctly inhibited [Curtis et al, 2005; Schall and Boucher, 2007; Thakkar et al., 2014]. Based on the timing of this modulation, neurophysiology studies have argued that mounting saccade‐related activity in FEF movement neurons must quickly decrease upon the signal to stop in order for the planned saccade to be inhibited. Precisely how these FEF movement neurons are modulated is still up for debate; however, one possibility is via connections between frontal cortex and the dorsal striatum. Through the direct and indirect pathways, the dorsal striatum can either facilitate or inhibit, respectively, cortical movement activity via the thalamus [Hikosaka et al., 2000]. Indeed, human fMRI studies using both oculomotor [Thakkar et al., 2014] and manual responses [Jahfari et al., 2010; Zandbelt and Vink, 2010] have provided evidence for a role of the dorsal striatum in reactive action control.
SEF neurons in nonhuman primates performing oculomotor reactive inhibition tasks modulate later than FEF (and after SSRT), leading to the conclusion that SEF plays a role in response monitoring and optimizing future responding [Emeric et al., 2010; Stuphorn et al., 2010, 2000], rather than being directly involved in the control of action. These neurophysiology findings have been supported by a recent study applying transcranial magnetic stimulation to SMC in healthy human subjects [Sharika et al., 2013]. By and large, however, human studies have argued for a more central role of the SMC in rapidly inhibiting hand movements [Chao et al., 2009; Duann et al., 2009; Hsu et al., 2011; Hu and Li, 2012; Li et al., 2006; Nachev et al., 2007; Sharp et al., 2010; Swick et al., 2011], potentially by influencing M1 activity via basal ganglia [e.g., Duann et al., 2009; Zandbelt et al., 2013]. Human neuroimaging, stimulation, and lesion studies have further highlighted a role of a right inferior frontal cortex (IFC) in reactive inhibition and have argued that these regions play a direct role in directly implementing reactive control of action [Aron et al., 2004, 2014], also via basal ganglia connections. More recently, it has been suggested to play an indirect role in inhibition by orienting attention to the signal to stop or change an action [Duann et al., 2009; Hampshire et al., 2010; Schall and Godlove, 2012; Sharp et al., 2010].
Rapid signal transmission is key for quickly and successfully executing and inhibiting responses, and the structural integrity of axonal connections between critical brain regions plays a crucial role in the speed of signal transmission [Waxman and Bennett, 1972]. Indeed, increasing white matter integrity within the right IFC and SMC [Madsen et al., 2010], as well as fronto‐basal and fronto‐fronto axonal bundles [Coxon et al., 2012; King et al., 2012; Liston et al., 2006; Rae et al., 2015], have been associated with manual inhibition efficiency. To our knowledge, however, there have been no studies assessing the effect of white matter microstructure on reactive inhibition in the oculomotor domain. In this study, we used the saccadic search‐step task, an oculomotor task that has been used in both human and nonhuman primates [Camalier et al., 2007; Murthy et al., 2007; Thakkar et al., 2014] and requires saccade plans to be rapidly and reactively changed, in combination with diffusion tensor imaging on 38 participants. We set out to examine whether the structural integrity of tracts between areas used in reactive control tasks (FEF, SEF, IFC, and dorsal striatum) can predict individual differences in the speed of executing and/or inhibiting saccades.
Based on previous work, we made several predictions. First, given findings that faster inhibition is associated with greater activation in the dorsal striatum [Thakkar et al., 2014], as well as general reports of the importance of fronto‐striatal connections in cognitive control, we expected that the integrity of tracts between the dorsal striatum and our cortical regions of interest would be associated with faster inhibition of saccades. In addition, our previous fMRI study showed significant activation in IFC and SEF when saccades were inhibited and redirected but not during basic visually guided saccades. Thus, we hypothesized that connections with these cortical regions would be associated faster stopping. Finally, given the role of the FEF in both saccade execution and inhibition, we hypothesized that greater structural integrity of pathways involving the FEF would be associated with the speed of both of these processes. These results have the potential to bridge human and monkey work by highlighting the structural contributions to the rapid control of eye movements.
METHODS
Overview
Subjects performed a saccadic search‐step task during fMRI and with concurrent eye tracking. Diffusion weighted imaging was also performed. Putative white matter tracts connecting our regions of interest (ROIs) were ascertained using probabilistic tractography, an analysis technique that constructs anatomical pathways between brain regions that are associated with a certain probability [Behrens et al., 2003]. Striatal ROIs were defined anatomically and cortical ROIs were defined based on group‐level fMRI results during search‐step task performance that have been published elsewhere [Thakkar et al., 2014]. We chose to limit our tract tracing to the right hemisphere only, largely because fMRI studies of reactive inhibition highlight a right‐lateralized network for inhibition [e.g., Aron et al., 2014; Duann et al., 2009; Sharp et al., 2010]. Consistent with those findings, in our fMRI study, activation within some of our cortical ROIs, namely the IFC, was only observed in the right hemisphere, and hence we were only able to assess right‐hemispheric networks that include IFC.
Each single subject probabilistic tract in native space was normalized into a common space, averaged across participants, and thresholded. Fractional anisotropy (FA), a well‐established index of white matter tract integrity [Beaulieu, 2002], averaged within each of the group‐thresholded tracts was calculated for each participant and was correlated with individuals' GO and STOP latencies, as estimated based on performance in the search‐step task.
Participants
Thirty‐eight healthy volunteers (mean age 29.3 years, range 19–48; 20 females) participated in this study. Written informed consent was obtained from all participants, and the procedures were approved by the Medical Ethical Committee of the University Medical Center Utrecht. Handedness was assessed using the Edinburgh Handedness Inventory [Oldfield, 1971; mean = 0.67, 30 right‐handed, 5 left‐handed, 3 ambidextrous]. Participants reported no history of psychiatric of neurological illness and had normal or corrected to normal vision. Participants were compensated monetarily for their time.
Saccadic Search Step Task
The saccadic search step task [Fig. 1; Camalier et al., 2007; Murthy et al., 2007] consisted of three randomly interleaved trial types: no‐step (30% of trials), redirect (40% of trials), and follow (30% of trials; control condition). Each trial was 4 s and began with a variable fixation period between 1,000 and 2,000 ms. The array elements subtended 0.7° visual angle and were isoluminant and equidistant from the center (9° visual angle). On no‐step and redirect trials, an eight‐element search array consisting of a red singleton among green distractors appeared following the fixation period. On no‐step trials, this array remained on the screen for the remainder of the trial. On redirect trials, however, the red target jumped to a new location via an isoluminant color change at some delay following the initial array presentation (target step delay; TSD). On follow trials, the array appeared with two red targets; this array was visible until the end of the trial. On no‐step and redirect trials, subjects were instructed to saccade to the red target (T1) as quickly as possible. They were instructed that if the target jumped to a new location (redirect trials), they should try to inhibit the saccade to T1 and look as quickly as possible to the new target location (T2). On follow trials, participants were instructed to look at each red target in succession (the order was irrelevant). Redirect trials in which the subject successfully looked immediately toward T2 were referred to as compensated trials. Redirect trials in which the subject first erroneously made a saccade first to T1 were referred to as noncompensated trials. Inhibition of the saccade to T1 becomes more difficult with increasing TSDs [Camalier et al., 2007; Logan and Cowan, 1984]. The TSDs were dynamically adjusted with a 1‐up/1‐down tracking procedure, thereby ensuring successful inhibition on approximately 50% of the redirect trials. The initial TSD was set at 100 ms and increased or decreased by 67 ms when the subject succeeded or failed to inhibit, respectively. TSDs were multiples of the screen refresh rate to minimize timing inaccuracy. To minimize the occurrence of averaging saccades landing midway between T1 and T2, target locations were constrained on redirect and follow trials such that there was at least 90° between T1 and T2 [reviewed in Van der Stigchel and Nijboer, 2011].
Figure 1.
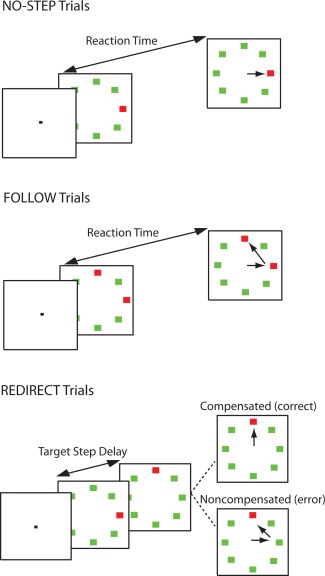
Search‐step task. All trials began after a variable fixation length. In no‐step trials, a red target was presented among green distractors, and the participant was instructed to look as quickly as possible to the target. On follow trials, two red targets were presented simultaneously among six green distractors, and the participant was instructed to look at each of the targets, one after the other (order was irrelevant). On redirect trials, a red target was presented among green distractors. At some delay following the array presentation (TSD), the red target reappeared at a new location in the array, and the old location became a distractor. Participants were instructed to inhibit the gaze shift to the old target location and look immediately at the new location of the target. Trials in which participants were successful in looking immediately at the new target location were referred to as compensated, and trials in which the participant erroneously looked first toward the old location of the target were referred to as noncompensated. The probability of correctly compensating becomes more difficult with longer TSD; thus, TSD was dynamically altered using a staircase procedure to ensure approximately 50% accuracy on redirect trials. [Color figure can be viewed in the online issue, which is available at http://wileyonlinelibrary.com.]
Trials were presented in four 5‐minute experimental sessions consisting of 60 trials. In total, 72 no‐step trials, 72 follow trials, and 96 redirect trials were presented. Participants were trained on the search‐step task before the fMRI experiment. We instructed participants that speed on the no‐step and follow trials was equally important as successfully inhibiting a saccade to T1 on redirect trials and that it would not always be possible to inhibit the saccade to T1 on redirect trials. Participants were not explicitly instructed about the relative frequency of trial types.
Stimulus Display and Eye Tracking
Task stimuli were displayed using Presentation software (Neurobehavioral Systems) and presented on an MR compatible LED screen at the rear of the bore that was viewed by the participant via a mirror on the head coil. Eye movements were recorded during scanning using an MR compatible infrared camera (Nordic Neuro Lab, Bergen, Norway). Eye position was sampled at a rate of 60 Hz. Acquisition was controlled by ViewPoint eyetracking software (Arrington Research). Accuracy of redirect trials was determined online for the purpose of the adaptive procedure for adjusting TSD, using positional criteria. For more details, see Thakkar et al. [2014].
Analysis of Eye Movement Data
Saccades detection was achieved with a partially automated procedure [see Thakkar et al., 2014 for details]. Trials in which saccades were produced less than 100 ms following array onset were considered anticipatory and excluded from further analysis. Saccade accuracy was determined using an automated procedure. On redirect trials, trials were classified as compensated if the saccade landed closer to T2 than T1 and as noncompensated if the saccade landed closer to T1 than T2. The speed of saccade execution—the GO process—can be observed directly from RT on no‐step trials, which was calculated as the time between array onset and saccade onset. The speed of saccade inhibition—the covert STOP process—can be inferred according to a model that assumes a race between parallel processes associated with executing the saccade to T1 (GO1), executing the saccade to T2 (GO2), and inhibiting (STOP) the saccade to T1 [Camalier et al., 2007; Logan and Cowan, 1984]. Following from this race model logic, the time needed to respond to the target step and cancel the planned saccade to T1 (target step reaction time, TSRT) can be estimated. This is an analogous measure to SSRT in the standard stop‐signal paradigm. TSRT was calculated according to the quantile method [Band et al., 2003].
Image Acquisition
All MRI data were acquired at the University Medical Center Utrecht on a Philips Achieva 3T scanner (Philips Medical Systems, Best, The Netherlands) equipped with an eight‐channel head coil allowing parallel imaging. Two diffusion images were acquired using single‐shot echoplanar imaging sequences, consisting of 30 diffusion‐weighted scans (b = 1,000 s/mm2) with noncollinear gradient directions and one image without diffusion weighting, b = 0 s/mm2), covering the entire brain (Repetition Time (TR) = 7,057 ms; Echo Time (TE) = 68 ms; field of view = 240 mm × 240 mm × 150 mm; in plane resolution = 1.875 mm × 1.875 mm; slice thickness = 2 mm; no slice gap; 75 axial slices; matrix size 128 mm × 99 mm). The diffusion weighted scans were measured twice, once with phase encoding direction reversed (first scan posterior–anterior, second scan anterior–posterior), in order to correct for susceptibility induced spatial distortions [Andersson and Skare, 2002]. For registration purposes, a whole‐brain three‐dimensional T1‐weighted scan (200 slices; TR = 10 ms; TE = 4.6 ms; flip angle = 8°; field of view, 240 mm × 240 mm × 160 mm; voxel size: 0.75 mm × 0.8 mm × 0.75 mm) was acquired.
Data Analysis
Regions of interest
The dorsal striatum comprises the caudate nucleus (CN) and putamen (PUT). These two nuclei were manually drawn on the mean normalized T1‐weighted image of all subjects. As the frontal ROIs (FEF, SEF, and IFC) do not have clear anatomical boundaries, the group‐level fMRI activation maps from a previous fMRI study conducted in the same sample [Thakkar et al., 2014] were used to define these regions. This has the added advantage that the voxels within the ROIs were used during the task in the same individuals from which the present diffusion tensor imaging (DTI) data were obtained. The cortical ROIs were created based on areas that showed greater activation on compensated versus no‐step trials (threshold P < 0.001 uncorrected) at the group level.
Preprocessing
The diffusion‐weighted scans were preprocessed and analyzed using FSL 5.0 (FMRIB's Software Library, http://www.fmrib.ox.ac.uk/fsl). As DTI scans suffer from spatial distortions along the phase encoding direction, two diffusion‐weighted scans were acquired with reversed phase encoding blips, resulting in pairs of images with distortions going in opposite directions. From these two images, the off‐resonance field was estimated using a method similar to that described by Andersson and Skare [2002] as implemented in FSL [Smith et al., 2004]. Next, the 30 diffusion‐weighted images from each phase‐encoding direction were realigned to the b0 image using affine registration, and eddy current correction was applied. The eddy‐corrected scans with opposite phase encoding blips were then combined into a single corrected image using the previously estimated off‐resonance field. A brain mask was created for the mean b0 image and applied to all diffusion‐weighted images.
DTI analyses must be performed in native space as diffusion gradients are specified in this space; however, ROIs were created in standard (Montreal neuroimaging; MNI) space. To transform the ROIs into each subject's native space, the anatomical T 1‐weighted volume was realigned to the mean b0‐weighted image and subsequently normalized to MNI‐space using the unified segmentation algorithm as implemented in SPM8 [Ashburner and Friston, 2005]. The inverse warping parameters from this step were used to transform ROIs from MNI space to native space [see Neggers et al., 2015 for detailed methods].
Probabilistic tractography
Probabilistic tractography [Behrens et al., 2007, 2003] was run between all ROIs, using each ROI as both a seed (start point) and a target (end point). The rationale for this was that diffusion MRI cannot distinguish between forward and backward projections. The analysis iteratively samples from the distributions of voxel‐wise principal diffusion directions, each time computing a streamline through these local samples, to generate a probabilistic connectivity distribution. The target ROI was used both as a waypoint and a termination mask, meaning that only streamlines that reached the target were considered and that streamlines did not continue after reaching the target ROI. All of the tractography analyses included the mid‐sagittal plane as an exclusion mask to avoid spurious streamlines travelling into the other hemisphere, as they cannot be reliably detected due to crossing fibers near the corpus callosum when using standard acquisition parameters [Landman et al., 2012; Mori and van Zijl, 2002; Mori and Zhang, 2006]. The procedure was executed with the default parameters: two allowed crossing fibers per voxel, automatic relevance determination weight of one, burn in period 1,000, 5,000 iterations, sample every 25 jumps.
The single‐subject results for each of the probabilistic tracts contain, for each voxel in the brain, the number of streamlines that passed through this voxel, or “connectivity value,” thereby showing the probabilistic location of the tract between seed and target. To perform group analyses, these results were transformed to MNI space using normalization parameters obtained from unified segmentation and subsequently averaged over all subjects.
The connectivity values are not only determined by actual structural connectivity but also by other factors. For example, the size of the seed ROI plays an important role in determining connectivity values. About 5,000 streamlines are sent out from each voxel in the seed; therefore, more streamlines are sent out from larger seeds. Therefore, a change in the connectivity values does not necessary reflect the likelihood of a structural connection. Thus, we opted to not use the same value for thresholding each of the group‐averaged tracts. Rather, the threshold was set at the 97th percentile for all voxels, thereby including only the 3% of voxels with the highest values. These thresholded group tracts were binarized into masks per tract. As DTI cannot distinguish between forward and backward connections, these masks from the tractography results in both directions (e.g., FEF to IFC and IFC to FEF) were considered equally accurate. Therefore, union of the binarized masks in each direction was obtained to arrive at a single mask for each pair of ROIs. Inspection of the masks revealed a substantial overlap between projections between the cortex and the two parts of the dorsal striatum (CN and PUT) (70%, 53%, and 67% for the connections between the dorsal striatum and FEF, SEF, and IFC, respectively). Interestingly, this overlap in connections between cortex and PUT and CN dovetails with a recent study from Neggers et al. [2015] who found that DTI tracts from the FEF terminated both in PUT and CN (with a dominance for PUT in humans), a finding contradicting the classically held view of the CN as oculomotor striatum [Alexander et al., 1986]. Using FA measurements from both CN and PUT tracts would, next to being uninformative with respect to the source of a potential relationship, introduce high multicollinearity in statistical models we use to assess our hypotheses. Therefore, CN and PUT were combined into a single dorsal striatum ROI. This lead to a total of six tracts within the right hemisphere: (1) between FEF and the dorsal striatum (FEF‐STR); (2) between the SEF and dorsal striatum (SEF‐STR); (3) between the IFC and dorsal striatum (IFC‐STR); (4) between the FEF and SEF (FEF‐SEF); (5) between the FEF and IFC (FEF‐IFC); and (6) between the SEF and IFC (SEF‐IFC). For each subject, mean FA within each of the group‐thresholded tracts was extracted. FA describes the degree of structural coherence within each voxel, ranging from 0 (completely isotropic, with no restriction or equal restriction in each direction) to 1 (completely anisotropic, indicating that diffusion occurs along a single axis and is fully restricted in any other direction). FA is affected by fiber density, axonal diameter, myelination, and fiber coherence [Alexander et al., 2007; Pierpaoli and Basser, 1996].
Statistical analyses
Statistical analyses were performed using IBM SPSS Statistics 20.0 (IBM, Armonk, NY). To assess the role of the connections within the oculomotor network and their contribution to the speed of latent GO and STOP processes, we investigated whether microstructural integrity of these connections, as indexed by FA, could predict GO latency (RT on no‐step trials) and STOP latency (TSRT). Since we were interested in the specific influence of microstructural integrity of specific tracts on behavior, mean FA over the whole brain was regressed out of the tract FA measurements. These standardized residuals were used for the remainder of the analyses. These “standardized FA values” are 0 when equal to the whole brain FA average, higher for more anisotropic voxels and lower for more isotropic voxels.
We performed a multivariate regression, using the standardized FA from the six tracts as independent variables, and the two behavioral measures (GO and STOP latency) as DVs. If the multivariate test statistic reaches significance, subsequent univariate tests are protected from an inflated type I error rate [Bock, 1975]. Individual univariate linear regression analyses were performed testing the effect of FA on behavior.
The relationship between STOP and GO latency was examined using Pearson's correlation coefficient. For each of the tracts that showed a univariate effect of FA on either of the behavioral measures, we also asked whether there was a specific relationship with STOP or GO speed in each tract by performing repeated‐measures analyses of variance (ANOVAs) on tract FA including both STOP and GO as within‐subject factors. That is, we considered the relationship between average FA in a tract and a behavioral measure (e.g. GO), corrected for the other behavioral parameter (e.g., STOP).
RESULTS
Behavior
GO latency for one subject fell more than three standard deviations above the mean, so this subject was discarded from further analyses. Mean GO latency (no‐step RTs) was 308 ms (SD = 75 ms), and mean STOP latency (TSRT) was 167 ms (SD = 31 ms), similar to a previous study in healthy human subjects [Camalier et al., 2007]. GO and STOP latency were moderately correlated (r = 0.39, P = 0.02).
DTI
The six spatially normalized, group‐averaged, and statistically thresholded probabilistic tracts are shown in Figure 2. This method provides a means for calculating FA along white matter tracts in a spatially consistent manner across subjects.
Figure 2.
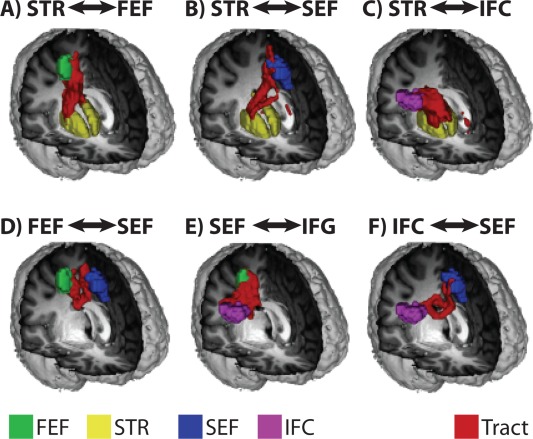
Tractography group results. 3D‐rendered representations of the group‐averaged and thresholded white matter tracts projected onto a standard‐space brain: (A) FEF‐striatum; (B) SEF‐striatum; (C) IFC‐striatum; (D) FEF‐SEF; (E) FEF‐IFC; (F) SEF‐IFC. ROIs are color‐coded as follows: FEF‐green; SEF‐blue; IFC‐magenta; striatum‐yellow. Fiber tract reconstructions are depicted in red. [Color figure can be viewed in the online issue, which is available at http://wileyonlinelibrary.com.]
We performed a multivariate regression analysis using six predictor variables (residual FA values in FEF‐STR, SEF‐STR, IFC‐STR, FEF‐SEF, FEF‐IFC, SEF‐IFC tracts) and two dependent variables (DVs) (GO and STOP latency). We observed a significant effect of tract FA on behavior in the search‐step task (Pillai's trace = 0.58, F(12,60) = 2.02, P = 0.04). Follow‐up univariate linear regression analyses revealed that significant predictors of GO latency were FEF‐SEF (F(1,35) = 6.51, P = 0.02) and FEF‐STR (F(1,35) = 4.45, P = 0.04). GO latency was not predicted by FA in any of the other tracts (all P‐values > 0.30). On the other hand, STOP latency was associated with FA in SEF‐IFC (F(1,36) = 9.60, P = 0.004) and IFC‐STR (F(1,36) = 5.01, P = 0.03). There was also a borderline‐significant relationship between FA in the SEF‐STR tract and STOP latency (F(1,36) = 4.08, P = 0.051). No significant relationship between STOP latency and FA in any of the remaining tracts was observed (all P‐values > 0.10). All relationships between FA and latency measures were negative, indicating that higher white matter integrity predicts faster execution or inhibition. The significant relationships are depicted in Figure 3.
Figure 3.
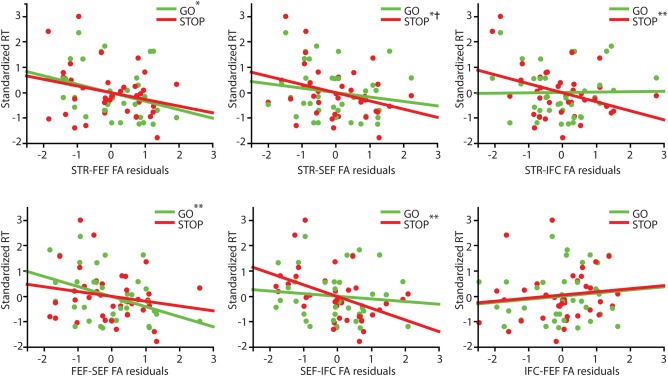
Relationships between FA residuals (after controlling for global FA) and both GO and STOP latency. Standardized RTs are shown here to show GO and STOP latencies in the same scale. One asterisk (*) denotes a significant relationship between tract FA and one type of RT, not controlling for the other (i.e., relationship with GO speed, without considering STOP speed). Two asterisks (**) denotes a significant relationship between tract FA and one type of RT, controlling for the other RT (i.e., relationship with GO speed, controlling for STOP speed). A cross (†) denotes a statistical trend level relationship between tract FA and RT, controlling for the other RT. [Color figure can be viewed in the online issue, which is available at http://wileyonlinelibrary.com.]
As GO and STOP latencies were moderately correlated, we assessed for each of the tracts in which FA was significantly related to either STOP or GO latency whether there was a specific relationship with either the speed of response execution or inhibition. We performed multiple regression analysis and including both behavioral measures, to look at the relationship between tract FA and one latency measure (e.g., GO), corrected for the other latency measure (e.g., STOP). Interestingly, we observed that FA in some white matter tracts specifically predicted either GO or STOP latency, despite the moderate correlation between these two measures. Correcting for the effect of STOP latency, we found a significant relationship between GO latency and FA in FEF‐SEF (F(1,34) = 4.944, P = 0.03). However, after correcting for the effect of STOP, there was no longer a relationship between FA in FEF‐STR and GO (F(1,34) = 2.505, P = 0.12). On the other hand, correcting for the effect of GO, we found a significant relationship between STOP latency and SEF‐IFC (F(1,24) = 8.991, P = 0.005) and IFC‐STR (F(1,34) = 6.229, P = 0.02). The relationship between SEF‐STR and STOP latency trended towards significance when corrected for the effect of GO (F(1,34) = 2.962, P = 0.09).
DISCUSSION
In this study, individual differences in the speed of saccade execution and inhibition were investigated with respect to the structural integrity of connections within a right‐lateralized network of fronto‐striatal regions with known oculomotor functions. Microstructural integrity of the connections between FEF and both SEF and the dorsal striatum were associated with faster saccade execution. On the other hand, connections between the dorsal striatum and both SEF and IFC as well as between SEF and IFC predicted the speed of inhibition. Interestingly, these relationships were largely behaviorally specific, despite the correlation between the speed of saccade execution and inhibition. Structural connections between the IFC and both SEF and the dorsal striatum specifically predicted the speed of inhibition and connections between the FEF and SEF specifically predicted the speed of execution. In addition, these relationships were also anatomically specific; these correlations were observed despite removing the variance explained by global FA. Results are largely consistent with previous literature and extend our understanding of the brain–behavior relationships related to cognitive control in important directions. Namely, these data suggest that the networks supporting saccade initiation and inhibition are at least partly dissociable.
A handful of previous DTI studies have reported a correlation between structural integrity of various cortico‐cortical and cortico‐subcortical networks and more efficient cognitive control. The majority of these studies have used the manual stop signal task as a measure of response inhibition. In these tasks, a prepared key press must be inhibited upon presentation of a stop cue. SSRT [Logan and Cowan, 1984], which is analogous to TSRT and reflects the speed of response inhibition, can be derived from overt performance measures [Camalier et al., 2007; Logan and Cowan, 1984]. Using this task, a previous study has shown that increased integrity of white matter near both IFC and SMC was related to faster SSRT in children [Madsen et al., 2010]. Further, the integrity of WM tracts connecting the subthalamic nucleus (STN), a small basal ganglia structure implicated in response inhibition, to both SMC [Coxon et al., 2012; King et al., 2012; Rae et al., 2015] and IFC [King et al., 2012; Rae et al., 2015] as well as those connecting IFC and SMC [Coxon et al., 2012; King et al., 2012], predicted faster SSRT. The importance of structural connections between frontal cortex and the dorsal striatum for efficient cognitive control have also been highlighted. In particular, greater integrity of connections between the striatum and both SMC [King et al., 2012] and frontal cortex broadly [Liston et al., 2006] have been related to more efficient implementation of cognitive control. Thus, our findings that connections between SMA, IFC, and the dorsal striatum are associated with cognitive control efficiency fit neatly within this body of work and reinforces the importance of this fronto‐striatal network in the ability to reactively adjust action plans. Given recent work from Boekel et al. [2015] who failed to replicate several published structural brain–behavior relationships, the striking consistency between our findings and previous studies is noteworthy.
With regard to our correlations between tract integrity and the speed of saccade execution, we must first consider what processes may contribute to slower no‐step trial latency. Slower RTs could simply indicate slower visually guided response latencies. However, slower RTs could also reflect a strategic attempt to minimize errors on step trials. Indeed, proactive adjustments in response speed have been reported using the stop‐signal task. For example, RTs increase as the probability of having to stop or change a response increases [Emeric et al., 2007; Logan and Burkell, 1986; Verbruggen and Logan, 2009]. In studies examining the structural correlates of stop‐signal task performance, few studies have reported correlations between tract white matter integrity and the speed of response execution. Those that did reported no correlation with structural connectivity between nodes in a right lateralized network of IFC, SMC, and the striatum [King et al., 2012]. Using DTI in combination with behavioral modeling, Forstmann et al. [2010] showed that increased white matter connections between the striatum and SMC were associated with better flexibility between response speed and response caution depending on task demands—that is, more strategic adjustments in response speed. In this study, we did not observe a correlation between the speed of response execution and SEF‐dorsal striatum connections. We did however observe a correlation between response speed and FEF‐dorsal striatum and SEF‐FEF connections. Studies investigating structural correlates of saccadic latencies are limited. Manoach et al. [2007] found that FA in white matter underlying the FEF was associated with visually guided saccade latency in a neuropsychiatric population. These findings are partially consistent with the current results; although based on the findings of Manoach et al. [2007], we might have expected to find an effect of all tracts involving the FEF on saccade latency.
Our study extends upon previous findings in two important ways. First, in examining the speed of response inhibition, we statistically controlled for the speed of response execution. Likewise, we controlled for the speed of inhibition when examining correlations between brain structure and response execution. Thus, these data provide more direct evidence for structural pathways that are specifically implicated in going versus stopping.
Second, we investigated the structural pathways involved in the inhibition and execution of eye movements, rather than hand movements, for the first time. This is important because it allows us to (1) examine potential effector‐related differences in the relationship between brain structure and cognitive control; and, perhaps more importantly, (2) allows us to bridge findings between humans and monkeys (since oculomotor responses are most often used in primate studies), thus allowing us to interpret the functional significance of our results in the context of primate neurophysiology studies.
The FEF is an important structure in saccade execution, and the rate of activity increases of gaze‐shifting neurons predicts saccade latency [Hanes and Schall, 1996]. The FEF receives projections from the SEF directly and from the striatum via the thalamus [Hikosaka et al., 2000; Huerta and Kaas, 1990]. Both the SEF and dorsal striatum can bias movement activity in the FEF, consistent with our finding that connections between the FEF and both the dorsal striatum and SEF predict saccade latency. In nonhuman primates performing the saccadic stop‐signal task, modulation of activity in FEF movement neurons is crucial for successful inhibition. Mounting activity in movement neurons following the GO cue must be rapidly attenuated following the STOP cue in order for the saccade to be inhibited [Hanes et al., 1998]. As highlighted in Introduction section, how exactly these movement neurons are modulating their firing rate is still a matter for debate, and just as there are multiple routes to saccade execution, there are likely multiple routes by which a saccade can be inhibited. One proposed route is via interactions between gaze‐holding and gaze‐shifting neurons within the FEF. Our findings are at odds, however, with interactions within the FEF being the sole driver of inhibitory success, as we observed largely non‐overlapping networks that were involved in saccade execution and inhibition speed.
Alternatively, the signal to attenuate movement activity could arrive at FEF from other subcortical and cortical brain regions. Although SEF neurons were typically not observed to modulate fast enough to directly implement gaze control following the STOP cue [Emeric et al., 2010; Stuphorn et al., 2010, 2000] these neurons did modulate in a manner consistent with a role in biasing the saccadic system toward automatic versus controlled actions (i.e., toward speed or caution) over a longer time scale. Studies in humans have suggested that SEF exerts influence over cortical regions more directly involved in movement execution via the dorsal striatum [Duann et al., 2009; Zandbelt et al., 2013], through direct anatomical connections [Huerta and Kaas, 1990], which is consistent with our finding that the integrity of connections between the SEF and dorsal striatum predicted inhibition latency.
The role of the IFC has not been investigated in nonhuman primates performing the saccadic countermanding task, although observations paralleling to those in FEF have been made in an analogous region of premotor cortex [Mirabella et al., 2011] during inhibition of reaching movements. This finding, along with those from human fMRI studies [reviewed in Aron et al., 2014], is in line with current findings, which suggest that IFC might exert control over regions more directly involved in gaze control via connections with SEF and the dorsal striatum. The precise role of the IFC in response inhibition is a topic of lively discussion [Schall and Godlove, 2012]. Although originally proposed to play a direct role in suppressing actions [Aron et al., 2004], recent evidence suggests that it serves a more general function by orienting to relevant behavioral cues [Duann et al., 2009; Hampshire et al., 2010; Sharp et al., 2010]. Although our data cannot disambiguate these alternate hypotheses, they do support a role of the IFC that contributes, either directly or indirectly, to the efficiency of behavioral control.
These findings should be considered in light of several factors, which limit our biological interpretations of the current data. First, although FA is the most commonly used measure of white matter integrity, it is influenced by a range of biological factors, including myelination, axonal damage, axonal diameter, and fiber coherence [Assaf and Pasternak, 2008] Thus, the precise physiological underpinnings of the current findings cannot be specified; however, since this is a group of healthy, young participants, we find it unlikely that individual differences in axonal damage are driving behavioral correlations. Second, DTI does not provide information regarding the directionality of connections. That is, we cannot say whether behavior is related to connections from region A to region B, from region B to region A, or both. Third, although both function and structural imaging would indicate that the caudate and putamen likely have different roles in saccade inhibition and execution [Neggers et al., 2012], we cannot address the potentially dissociable contributions of these two structures in this study. The tracts connecting cortical regions with caudate and putamen were largely overlapping, consistent with a recent study comparing these tracts between macaques and humans [Neggers et al., 2015]. For this reason, tracts between the FEF and the caudate and putamen were combined. Fourth, our scan parameters, namely the number of diffusion directions, were not sufficient to investigate connections between cortex and small subcortical nuclei, like the STN or substantia nigra pars reticulata, that are known to be involved in reactive action control [Aron and Poldrack, 2006; Schmidt et al., 2013].
Nevertheless, these findings provide novel insights into the structural contributions to the reactive control of gaze and provide evidence for partially distinct networks that support saccade execution and inhibition. In addition, these findings have implications for understanding the biological basis of impairments in the reactive inhibition of saccadic eye movements observed in several neuropsychiatric populations, including schizophrenia [Thakkar et al., 2011, 2015b), bipolar disorder [Thakkar et al., 2015a], Parkinson's disease [Joti et al., 2007], and attention‐deficit/hyperactivity disorder [Armstrong and Munoz, 2003].
REFERENCES
- Alexander AL, Lee JE, Lazar M, Field AS (2007): Diffusion tensor imaging of the brain. Neurotherapeutics 4:316–329. [DOI] [PMC free article] [PubMed] [Google Scholar]
- Alexander GE, DeLong MR, Strick PL (1986): Parallel organization of functionally segregated circuits linking basal ganglia and cortex. Ann Rev Neurosci 9:357–381. [DOI] [PubMed] [Google Scholar]
- Andersson JL, Skare S (2002): A model‐based method for retrospective correction of geometric distortions in diffusion‐weighted EPI. Neuroimage 16:177–199. [DOI] [PubMed] [Google Scholar]
- Armstrong IT, Munoz DP (2003): Inhibitory control of eye movements during oculomotor countermanding in adults with attention‐deficit hyperactivity disorder. Exp Brain Res 152:444–452. [DOI] [PubMed] [Google Scholar]
- Aron AR, Poldrack RA (2006): Cortical and subcortical contributions to stop signal response inhibition: Role of the subthalamic nucleus. J Neurosci 26:2424–2433. [DOI] [PMC free article] [PubMed] [Google Scholar]
- Aron AR, Robbins TW, Poldrack RA (2004): Inhibition and the right inferior frontal cortex. Trends Cogn Sci 8:170–177. [DOI] [PubMed] [Google Scholar]
- Aron AR, Robbins TW, Poldrack RA (2014): Inhibition and the right inferior frontal cortex: One decade on. Trends Cogn Sci 18:177–185. [DOI] [PubMed] [Google Scholar]
- Ashburner J, Friston KJ (2005): Unified segmentation. Neuroimage 26:839–851. [DOI] [PubMed] [Google Scholar]
- Assaf Y, Pasternak O (2008): Diffusion tensor imaging (DTI)‐based white matter mapping in brain research: A review. J Mol Neurosci 34:51–61. [DOI] [PubMed] [Google Scholar]
- Band GP, van der Molen MW, Logan GD (2003): Horse‐race model simulations of the stop‐signal procedure. Acta Psychol 112:105–142. [DOI] [PubMed] [Google Scholar]
- Beaulieu C (2002) The basis of anisotropic water diffusion in the nervous system – a technical review. NMR Biomed 15:435–455. [DOI] [PubMed] [Google Scholar]
- Behrens TE, Berg HJ, Jbabdi S, Rushworth MF, Woolrich MW (2007): Probabilistic diffusion tractography with multiple fibre orientations: What can we gain? Neuroimag 34:144–155. [DOI] [PMC free article] [PubMed] [Google Scholar]
- Behrens TE, Woolrich MW, Jenkinson M, Johansen‐Berg H, Nunes RG, Clare S, Matthews PM, Brady JM, Smith SM (2003): Characterization and propagation of uncertainty in diffusion‐weighted MR imaging. Magn Reson Med 50:1077–1088. [DOI] [PubMed] [Google Scholar]
- Bock RD ( 1975): Multivariate Statistical Methods in Behavioral Research. New York: McGraw‐Hill. [Google Scholar]
- Boekel W, Wagenmakers EJ, Belay L, Verhagen J, Brown S, Forstmann BU (2015): A purely confirmatory replication study of structural brain‐behavior correlations. Cortex 66:115–133. [DOI] [PubMed] [Google Scholar]
- Camalier CR, Gotler A, Murthy A, Thompson KG, Logan GD, Palmeri TJ, Schall JD (2007): Dynamics of saccade target selection: Race model analysis of double step and search step saccade production in human and macaque. Vision Res 47:2187–2211. [DOI] [PMC free article] [PubMed] [Google Scholar]
- Chao HH, Luo X, Chang JL, Li CS (2009): Activation of the pre‐supplementary motor area but not inferior prefrontal cortex in association with short stop signal reaction time—An intra‐subject analysis. BMC Neurosci 10:75. [DOI] [PMC free article] [PubMed] [Google Scholar]
- Chen X, Scangos KW, Stuphorn V (2010): Supplementary motor area exerts proactive and reactive control of arm movements. J Neurosci 30:14657–14675. [DOI] [PMC free article] [PubMed] [Google Scholar]
- Coxon JP, Van Impe A, Wenderoth N, Swinnen SP (2012): Aging and inhibitory control of action: Cortico‐subthalamic connection strength predicts stopping performance. J Neurosci 32:8401–8412. [DOI] [PMC free article] [PubMed] [Google Scholar]
- Curtis CE, Cole MW, Rao VY, D'Esposito M (2005): Canceling planned action: An FMRI study of countermanding saccades. Cereb Cortex 15:1281–1289. [DOI] [PubMed] [Google Scholar]
- Duann JR, Ide JS, Luo X, Li CS (2009): Functional connectivity delineates distinct roles of the inferior frontal cortex and presupplementary motor area in stop signal inhibition. J Neurosci 29:10171–10179. [DOI] [PMC free article] [PubMed] [Google Scholar]
- Emeric EE, Brown JW, Boucher L, Carpenter RH, Hanes DP, Harris R, Logan GD, Mashru RN, Paré M, Pouget P, Stuphorn V, Taylor TL, Schall JD (2007): Influence of history on saccade countermanding performance in humans and macaque monkeys. Vision Res 47:35–49. [DOI] [PMC free article] [PubMed] [Google Scholar]
- Emeric EE, Leslie MW, Pouget P, Schall JD (2010): Performance monitoring local field potentials in the medial frontal cortex of primates: Supplementary eye field. J Neurophysiol 104:1523–1537. [DOI] [PMC free article] [PubMed] [Google Scholar]
- Forstmann BU, Anwander A, Schafer A, Neumann J, Brown S, Wagenmakers EJ, Bogacz R, Turner R (2010): Cortico‐striatal connections predict control over speed and accuracy in perceptual decision making. Proc Natl Acad Sci USA 107:15916–15920. [DOI] [PMC free article] [PubMed] [Google Scholar]
- Hampshire A, Chamberlain SR, Monti MM, Duncan J, Owen AM (2010): The role of the right inferior frontal gyrus: Inhibition and attentional control. Neuroimage 50:1313–1319. [DOI] [PMC free article] [PubMed] [Google Scholar]
- Hanes DP, Patterson WF, 2nd , Schall JD (1998): Role of frontal eye fields in countermanding saccades: Visual, movement, and fixation activity. J Neurophysiol 79:817–834. [DOI] [PubMed] [Google Scholar]
- Hanes DP, Schall JD (1996): Neural control of voluntary movement initiation. Science 274:427–430. [DOI] [PubMed] [Google Scholar]
- Hikosaka O, Takikawa Y, Kawagoe R (2000): Role of the basal ganglia in the control of purposive saccadic eye movements. Physiol Rev 80:953–978. [DOI] [PubMed] [Google Scholar]
- Hsu TY, Tseng LY, Yu JX, Kuo WJ, Hung DL, Tzeng OJ, Walsh V, Muggleton NG, Juan CH (2011): Modulating inhibitory control with direct current stimulation of the superior medial frontal cortex. NeuroImage 56:2249–2257. [DOI] [PubMed] [Google Scholar]
- Hu S, Li CS (2012): Neural processes of preparatory control for stop signal inhibition. Hum Brain Mapp 33:2785–2796. [DOI] [PMC free article] [PubMed] [Google Scholar]
- Huerta MF, Kaas JH (1990): Supplementary eye field as defined by intracortical microstimulation: Connections in macaques. J Comp Neurol 293:299–330. [DOI] [PubMed] [Google Scholar]
- Jahfari S, Stinear CM, Claffey M, Verbruggen F, Aron AR (2010): Responding with restraint: What are the neurocognitive mechanisms? J Cogn Neurosci 22:1479–1492. [DOI] [PMC free article] [PubMed] [Google Scholar]
- Joti P, Kulashekhar S, Behari M, Murthy A (2007): Impaired inhibitory oculomotor control in patients with Parkinson's disease. Exp Brain Res 177:447–457. [DOI] [PubMed] [Google Scholar]
- King AV, Linke J, Gass A, Hennerici MG, Tost H, Poupon C, Wessa M (2012): Microstructure of a three‐way anatomical network predicts individual differences in response inhibition: A tractography study. NeuroImage 59:1949–1959. [DOI] [PubMed] [Google Scholar]
- Landman BA, Bogovic JA, Wan H, El Zahraa ElShahaby F, Bazin PL, Prince JL (2012): Resolution of crossing fibers with constrained compressed sensing using diffusion tensor MRI. Neuroimage 59:2175–2186. [DOI] [PMC free article] [PubMed] [Google Scholar]
- Lappin J, Eriksen CW (1966): Use of a delayed signal to stop a visual reaction‐time response. J Exp Psychol Gen 72:805–811. [Google Scholar]
- Li CS, Huang C, Constable RT, Sinha R (2006): Gender differences in the neural correlates of response inhibition during a stop signal task. NeuroImage 32:1918–1929. [DOI] [PubMed] [Google Scholar]
- Liston C, Watts R, Tottenham N, Davidson MC, Niogi S, Ulug AM, Casey BJ (2006): Frontostriatal microstructure modulates efficient recruitment of cognitive control. Cereb Cortex 16:553–560. [DOI] [PubMed] [Google Scholar]
- Logan GD, Burkell J (1986): Dependence and independence in responding to double stimulation: A comparison of stop, change, and dual‐task paradigms. J Exp Psychol‐Hum Percept Perform 12:549–563. [Google Scholar]
- Logan GD, Cowan WB (1984): On the ability to inhibit thought and action: A theory of an act of control. Psychol Rev 91:295–327. [DOI] [PubMed] [Google Scholar]
- Madsen KS, Baare WF, Vestergaard M, Skimminge A, Ejersbo LR, Ramsoy TZ, Gerlach C, Akeson P, Paulson OB, Jernigan TL (2010): Response inhibition is associated with white matter microstructure in children. Neuropsychologia 48:854–862. [DOI] [PubMed] [Google Scholar]
- Manoach DS, Ketwaroo GA, Polli FE, Thakkar KN, Barton JJ, Goff DC, Fischl B, Vangel M, Tuch DS (2007): Reduced microstructural integrity of the white matter underlying anterior cingulate cortex is associated with increased saccadic latency in schizophrenia. Neuroimage 37:599–610. [DOI] [PubMed] [Google Scholar]
- Mirabella G, Pani P, Ferraina S (2011): Neural correlates of cognitive control of reaching movements in the dorsal premotor cortex of rhesus monkeys. J Neurophysiol 106:1454–1466. [DOI] [PubMed] [Google Scholar]
- Mori S, van Zijl PC (2002): Fiber tracking: Principles and strategies—A technical review. NMR Biomed 15:468–480. [DOI] [PubMed] [Google Scholar]
- Mori S, Zhang J (2006): Principles of diffusion tensor imaging and its applications to basic neuroscience research. Neuron 51:527–539. [DOI] [PubMed] [Google Scholar]
- Murthy A, Ray S, Shorter SM, Priddy EG, Schall JD, Thompson KG (2007): Frontal eye field contributions to rapid corrective saccades. J Neurophysiol 97:1457–1469. [DOI] [PubMed] [Google Scholar]
- Nachev P, Wydell H, O'Neill K, Husain M, Kennard C (2007): The role of the pre‐supplementary motor area in the control of action. Neuroimage 36:T155–T163. [DOI] [PMC free article] [PubMed] [Google Scholar]
- Neggers SF, Diepen RM, Zandbelt BB, Vink M, Mandl RC, Gutteling TP (2012): A functional and structural investigation of the human fronto‐basal volitional saccade network. PloS One 7:e29517. [DOI] [PMC free article] [PubMed] [Google Scholar]
- Neggers SF, Zandbelt BB, Schall MS, Schall JD (2015): Comparative diffusion tractography of cortico‐striatal motor pathways reveals differences between humans and macaques. J Neurophysiol 113:2164–2172. [DOI] [PMC free article] [PubMed] [Google Scholar]
- Oldfield RC (1971): The assessment and analysis of handedness: The Edinburgh inventory. Neuropyschologia 9:97–113. [DOI] [PubMed] [Google Scholar]
- Pierpaoli C, Basser PJ (1996): Toward a quantitative assessment of diffusion anisotropy. Magn Reson Med 36:893–906. [DOI] [PubMed] [Google Scholar]
- Rae CL, Hughes LE, Anderson MC, Rowe JB (2015): The prefrontal cortex achieves inhibitory control by facilitating subcortical motor pathway connectivity. J Neurosci 35:786–794. [DOI] [PMC free article] [PubMed] [Google Scholar]
- Scangos K, Aronberg R, Stuphorn V (2013): Performance monitoring by presupplementary and supplementary motor area during an arm movement countermanding task. J Neurophys 109:1928–1939. [DOI] [PMC free article] [PubMed] [Google Scholar]
- Scangos KW, Stuphorn V (2010): Medial frontal cortex motivates but does not control movement initiation in the countermanding task. J Neurosci 30:1968–1982. [DOI] [PMC free article] [PubMed] [Google Scholar]
- Schall JD, Boucher L (2007): Executive control of gaze by the frontal lobes. Cogn Affect Behav Neurosci 7:396–412. [DOI] [PubMed] [Google Scholar]
- Schall JD, Godlove DC (2012): Current advances and pressing problems in studies of stopping. Curr Opin Neurobiol 22:1012–1021. [DOI] [PMC free article] [PubMed] [Google Scholar]
- Schmidt R, Leventhal DK, Mallet N, Chen F, Berke JD (2013): Canceling actions involves a race between basal ganglia pathways. Nat Neurosci 16:1118–1124. [DOI] [PMC free article] [PubMed] [Google Scholar]
- Sharika KM, Neggers SFW, Gutteling TP, Van der Stigchel S, Dijkerman HC, Murthy A (2013): Proactive control of sequential saccades in the human supplementary eye field. Proc Nat Acad Sci USA 110:E1311–E1320. [DOI] [PMC free article] [PubMed] [Google Scholar]
- Sharp DJ, Bonnelle V, De Boissezon X, Beckmann CF, James SG, Patel MC, Mehta MA (2010): Distinct frontal systems for response inhibition, attentional capture, and error processing. Proc Natl Acad Sci USA 107:6106–6111. [DOI] [PMC free article] [PubMed] [Google Scholar]
- Smith SM, Jenkinson M, Woolrich MW, Beckmann CF, Behrens TE, Johansen‐Berg H, Bannister PR, De Luca M, Drobnjak I, Flitney DE, Niazy RK, Saunders J, Vickers J, Zhang Y, De Stefan N, Brady JM, Matthews PM (2004): Advances in functional and structural MR image analysis and implementation as FSL. Neuroimage 23:S208–S219. [DOI] [PubMed] [Google Scholar]
- Stuphorn V, Brown JW, Schall JD (2010): Role of supplementary eye field in saccade initiation: Executive, not direct, control. J Neurophys 103:801–816. [DOI] [PMC free article] [PubMed] [Google Scholar]
- Stuphorn V, Taylor TL, Schall JD (2000): Performance monitoring by the supplementary eye field. Nature 408:857–860. [DOI] [PubMed] [Google Scholar]
- Swick D, Ashley V, Turken U (2011): Are the neural correlates of stopping and not going identical? Quantitative meta‐analysis of two response inhibition tasks. Neuroimage 56:1655–1665. [DOI] [PubMed] [Google Scholar]
- Thakkar KN, Schall JD, Boucher L, Logan G, Park S (2011): Response inhibition and response monitoring in a saccadic countermanding task in schizophrenia. Biol Psychiatry 69:55–62. [DOI] [PMC free article] [PubMed] [Google Scholar]
- Thakkar KN, Schall JD, Logan GD, Park S (2015a): Cognitive control of gaze in bipolar disorder and schizophrenia. Psychiatry Res 225:254–262. [DOI] [PMC free article] [PubMed] [Google Scholar]
- Thakkar KN, Schall JD, Logan GD, Park S (2015b): Response inhibition and response monitoring in a saccadic double‐step task in schizophrenia. Brain Cogn 95:90–98. [DOI] [PMC free article] [PubMed] [Google Scholar]
- Thakkar KN, van den Heiligenberg FM, Kahn RS, Neggers SFW (2014): Frontal‐subcortical circuits involved in reactive control and monitoring of gaze. J Neurosci 34:8918–8929. [DOI] [PMC free article] [PubMed] [Google Scholar]
- Van der Stigchel S, Nijboer TCW (2011): The global effect: What determines where the eyes land? J Eye Mov Res 4:1–13. 21603125 [Google Scholar]
- Verbruggen F, Logan GD (2009): Proactive adjustments of response strategies in the stop‐signal paradigm. J Exp Psychol Hum Percept Perform 35:835–854. [DOI] [PMC free article] [PubMed] [Google Scholar]
- Waxman SG, Bennett MVL (1972): Relative conduction velocities of small myelinated and non‐myelinated fibres in the central nervous system. Nat New Biol 238:217–219. [DOI] [PubMed] [Google Scholar]
- Zandbelt BB, Bloemendaal M, Hoogendam JM, Kahn RS, Vink M (2013): Transcranial magnetic stimulation and functional MRI reveal cortical and subcortical interactions during stop‐signal response inhibition. J Cogn Neurosci 25:157–174. [DOI] [PubMed] [Google Scholar]
- Zandbelt BB, Vink M (2010): On the role of the striatum in response inhibition. PloS One 5:e13848. [DOI] [PMC free article] [PubMed] [Google Scholar]