

Abstract
Background
Low‐dose ketamine has been found to have robust and rapid antidepressant effects. A hypoactive prefrontal cortex (PFC) and a hyperactive amygdala have been suggested to be associated with treatment‐resistant depression (TRD). However, it is unclear whether the rapid antidepressant mechanisms of ketamine on TRD involve changes in glutamatergic neurotransmission in the PFC and the amygdala.
Methods
A group of 48 TRD patients were recruited and equally randomized into three groups (A: 0.5 kg/mg‐ketamine; B: 0.2 kg/mg‐ketamine; and C: normal saline [NS]). Standardized uptake values (SUV) of glucose metabolism measured by 18F‐FDG positron‐emission‐tomography before and immediately after a 40‐min ketamine or NS infusion were used for subsequent region‐of‐interest (ROI) analyses (a priori regions: PFC and amygdala) and whole‐brain voxel‐wise analyses and were correlated with antidepressant responses, as defined by the Hamilton depression rating scale score. The 18F‐FDG signals were used as a proxy measure of glutamate neurotransmission.
Results
The ROI analysis indicated that Group A and Group B, but not Group C, had increases in the SUV of the PFC (group‐by‐time interaction: F = 7.373, P = 0.002), whereas decreases in the SUV of the amygdala were observed in all three groups (main effect of time, P < 0.001). The voxel‐wise analysis further confirmed a significant group effect on the PFC (corrected for family‐wise errors, P < 0.05; post hoc analysis: Group A<Group C, Group B<Group C). The SUV differences in the PFC predicted the antidepressant responses at 40 and 240 min post‐treatment. The PFC changes did not differ between those with and without side effects.
Conclusion
Ketamine's rapid antidepressant effects involved the facilitation of glutamatergic neurotransmission in the PFC. Hum Brain Mapp 37:1080–1090, 2016. © 2016 Wiley Periodicals, Inc.
Keywords: treatment‐resistant depression, ketamine, glucose, prefrontal cortex
INTRODUCTION
Ketamine, which is an N‐methyl‐d‐aspartate (NMDA) antagonist, is an anesthetic agent with a rapid onset and a short duration of action. The onset of ketamine peaks in 1–5 min, and the duration of action is less than 20 min [Aroni et al., 2009]. A growing body of evidence has indicated that the glutamatergic system, which ketamine acts directly on, could be critically involved in the pathophysiology of depression [Paul and Skolnick, 2003].
Low‐dose ketamine results in rapid improvement of depressive symptoms (within 1 h) in patients with treatment‐resistant depression (TRD) [Mathew et al., 2012; Naughton et al., 2014]. Robust antidepressant effects of ketamine have been shown in several randomized controlled studies [Berman et al., 2000; Murrough et al., 2013; Zarate et al., 2006]. Similarly, a recent placebo‐controlled study investigating anhedonia, another core symptom of depression, has determined that a single ketamine injection for TRD can significantly reduce the level of anhedonia in 40 min [Lally et al., 2014].
The prefrontal cortex (PFC) and the subcortical and limbic brain regions (e.g., the amygdala) are critically involved in the neurocircuitry of depression [Arana et al., 2008; Kimbrell et al., 1999; Kupfer et al., 2012; Price and Drevets, 2010]. Enhanced activity in response to negative stimuli in the emotion‐processing subcortical and limbic regions and deficiencies in the top‐down regulatory activities of various parts of the PFC are the characteristic features of major depressive disorder [Kupfer et al., 2012; Mayberg et al., 1999]. TRD patients have a hypoactive PFC and a hyperactive amygdala; this functional dysregulation between the PFC and the amygdala has been shown to persist even after a patient's depression has been temporarily controlled with aggressive treatment [Li et al., 2010b]. Recently, it has been further demonstrated that pronounced hypofrontality has a key role in the neuropathology of TRD [Li et al., 2015].
However, it remains unclear whether the rapid antidepressant mechanisms of ketamine on TRD involve changes in glutamatergic neurotransmission in the PFC. This randomized, double‐blind, placebo‐controlled study utilized 18F fluorodeoxyglucose positron emission tomography (18F‐FDG‐PET) to investigate cerebral glucose uptake at baseline levels (−15 to 0 min) and following ketamine or placebo injection (45–60 min after the injection). The experiment was designed to capture the earliest and perhaps the most important (based on the aforementioned preclinical and clinical studies) biological effects of ketamine on the brain. Notably, 18F‐FDG‐PET measures the uptake of glucose primarily metabolized by astrocytes in response to glutamate release from neuronal cells [Magistretti and Pellerin, 1999]. The 18F‐FDG signals thus provide a proxy for the quantification of glutamatergic neurotransmission in the human brain. This study was designed to investigate the rapid effects of ketamine, specifically on the glutamatergic system of mood circuitry in TRD. We hypothesized that the rapid antidepressant effects of low‐dose ketamine involve PFC activation. Activity in the amygdala, which is a core region of the limbic system that is involved in the mood‐related neurocircuitry [Price and Drevets, 2010], was also investigated.
METHODS AND MATERIALS
Subjects
Eligible subjects were adult patients between 21 and 65 years of age with a Diagnostic and Statistical Manual of Mental Disorders‐IV‐Text Revision (DSM‐IV‐TR) diagnosis of major depressive disorder. To ensure that patients were resistant to treatment medications, all TRD patients were required to have a history of failing to respond to at least three different antidepressants with adequate dosage and treatment duration and of failing at least one trial of adequate antidepressant treatment during their current depressive episode. The recruited TRD patients did not have major medical or neurological illnesses or a history of alcohol or substance abuse. Other exclusion criteria are described in the Supporting Information.
This study was performed in accordance with the Declaration of Helsinki and was approved by the local Ethics Review Committee. Informed consent was provided by all of the participants.
Study Procedures
Patients underwent a detailed psychiatric and medical history‐taking, a diagnostic interview, and brain structural imaging by magnetic resonance imaging (MRI) at baseline. Following screening and baseline ratings, a subsequent 40‐min acute treatment phase was conducted, which involved constant intravenous infusion of ketamine or placebo via an infusion pump. The study involved two stages, as it aimed to study the rapid effects of ketamine on the human brain in the first hour after ketamine administration and in the third day. In this article, we report the results of the first stage; the second stage is still ongoing, and its results will be reported elsewhere. For the first stage, a total of 48 TRD patients were randomized in a 1:1:1/A:B:C ratio to each of the respective experiment groups: A: 0.5 mg/kg, B: 0.2 mg/kg, and C: normal saline (Supporting Information Fig. S1). Two low‐dose ketamine regimens were selected to test and to confirm our hypothesis because both 0.5 mg/kg and 0.2 mg/kg have been shown to be effective in the treatment of TRD. The entire study procedure was double‐blinded, and participants and staff were all blind to the treatment assignment. An independent research nurse who was not involved in the study was responsible for the random allocation and was not allowed to release any information to others, including the study nurse who applied the intravenous injection. Depressive symptoms were rated using the 17‐item Hamilton Depression Rating Scale (HDRS‐17) [Hamilton, 1967] at baseline (immediately before the first 18F‐FDG‐PET scan) and at 40, 80, 120, and 240 min post‐ketamine administration. The positive symptoms subscale of the brief psychiatric rating scale (BPRS) was used [Overall and Gorham, 1962] to measure potential psychotomimetic effects of ketamine at each time point. The present study primarily focused on the rapid antidepressant responses and neuroimaging findings during the first day of treatment. Primary outcomes, such as the percent change between baseline and 40‐min HDRS‐17 scores, were correlated with imaging results. Responders were defined as having at least a 50% decrease in their HDRS‐17 score from baseline. Side effects following injections, including floating sensations, dissociative symptoms, dizziness, nausea, and somatic discomfort, were recorded.
Imaging Procedures
The MR images were acquired with a 3.0 GE Discovery 750 whole‐body high‐speed imaging device and high‐resolution structural T1‐weighted images were acquired. Two volumes of 18F‐FDG PET scans (i.e., pre‐ and post‐ketamine injections; the brain acquisition time for each PET volume is 15 min) of at rest glucose utilizations were acquired on a PET/CT scanner (Discovery VCT; GE Healthcare, USA) with 3D brain mode in the morning (9000 h to 1200 h). The 1st, 15‐min PET scan was acquired 45 min after an intravenous (IV) injection of about 222 MBq of 18F‐FDG. Subsequently, another IV bolus of approximately 222 MBq of 18F‐FDG was injected. At 5 min after the 2nd FDG injection, a 40‐min IV infusion of normal saline or low dose ketamine (0.2 mg/kg or 0.5 mg/kg of ketamine) was given in a resting state. After 40 min of rest (staying awake in a deem‐light room), the 2nd, 15‐min PET scan was acquired. Other details regarding MRI and PET acquisition please refer to the Supporting Information.
Preprocessing and Analysis of PET Data
The PET data were analyzed using Statistical Parametric Mapping version 8 software (SPM8; Wellcome Department of Cognitive Neurology, Institute of Neurology, University College London, London, England) implemented in Matlab 7.1 (The Mathworks Inc., Sherborn, MA). A group‐specific MRI‐aided 18F‐FDG template was created [Gispert et al., 2003; Signorini et al., 1999] and used to normalize each subject's PET images, followed by smoothing with a 3D Gaussian kernel (full width half maximum [FWHM] = 8 mm). The smoothed and normalized PET images in the standardized brain space were created and subjected to further analysis.
Because we were primarily interested in the relative changes in brain metabolic activity in the first hour after IV infusion treatment (drug or placebo), the standardized uptake value (SUV), which is a validated semi‐quantitative method [Borckardt et al., 2008], was used to correct for FDG activity at the time of injection for each of the two FDG scans (before and 40 min after injections). Specifically, the parametric whole‐brain SUV image was calculated by dividing the concentration of radiotracer activity in the normalized PET image (MBq/kg) by the FDG dose at the injection time (MBq) divided by the body weight (kg). The total FDG dose at the 2nd injection time was approximated with consideration of the residual dose from the 1st FDG injection.
Region of Interest Analysis of PET Data
To test our hypothesis, region of interest (ROI) analysis was performed. The mean SUV in the a priori regions (PFC and amygdala) was extracted from unsmoothed SUV images in the standard stereotactic space by using PMOD version 3.0 (PMOD Technologies, Zurich, Switzerland) as described previously [Arana et al., 2008; Hirvonen et al., 2012]. Normalized SUV values (values were normalized by dividing the PFC mean SUV by the global mean SUV) were reported. The delineations of the PFC and amygdala were performed by an automated anatomical labeling template (AAL template [Tzourio‐Mazoyer et al., 2002]) to prevent bias from inter‐ or intra‐rater reliability issues that arise in manual delineation. The delineated PFC combined ten anatomical regions of the AAL template (i.e., F1, F2, F1O, F2O, F3T, F3O, F3OP, GR, F1MO, and F1M) in bilateral hemispheres to maximize the coverage of the PFC; this delineation of the PFC covered the clusters that are most involved in depression and TRD, including the dorsolateral PFC [Fitzgerald et al., 2006; Li et al., 2015].
Voxel‐Wise Analysis of PET Data
Voxel‐wise analysis was performed using SPM8 to confirm the results of the ROI analysis and to explore any regional changes that were specific to ketamine treatment. We compared the between‐group SUV changes by two‐way ANOVA, with time (i.e., the 1st and 2nd SUV images) as the within‐subject factor, ketamine groups (i.e., A: 0.5 mg/kg, B: 0.2 mg/kg, and C: normal saline) as the between‐subject factor, and age and sex as covariates of no interest. The group‐by‐time interaction and the main effects of group and time that were significant at P < 0.05 after voxel‐level family‐wise error (FWE) correction were reported. For the post hoc analysis, independent t‐tests were performed for the between‐group comparisons. The statistical thresholds were set at P < 0.0167 (=0.05/3, corrected for the three groups). For exploratory purposes, we conducted a separate paired t‐test to visualize the relative changes between the 1st and 2nd SUV images in the three groups, with the significance thresholds set at a voxel‐level uncorrected value of P < 0.05 and cluster‐level FWE‐corrected value of P < 0.001.
Statistical Methods
Statistical analysis of demographic and clinical data was performed using SPSS 16.0 (SPSS Inc, Chicago, IL). One‐way analysis of variance (ANOVA) (or Student's t‐test) and Fisher's chi‐square test (or Yate's correction) were used to compare the continuous and categorical variables between groups (i.e., ketamine groups). A value of P < 0.05 was used to indicate statistical significance. To investigate the relationship between improvements in depression (i.e., percent change in HDRS‐17 scores after treatment) and differences in before‐versus‐after SUV in the PFC and amygdala, Pearson's correlation analysis was performed, and the correlation coefficient (r) was reported. P < 0.05 (2‐sided tests) was considered to be statistically significant. To determine whether any changes in the measures of the PFC and amygdala (i.e., SUV of the PFC and amygdala) were a result of the interaction between time (i.e., before and after ketamine treatment) and ketamine group (i.e., A, B, and C), two‐way repeated measures ANOVA was conducted, with time as the within‐subject factor and ketamine groups as the between‐subject factor, whereas age and sex were treated as covariates. The interaction between group and time and the main effects of group and time were reported, with P < 0.05 (2‐sided test) considered to be statistically significant. The Least Significant Difference (LSD) method was used for post hoc analyses. Finally, linear regression was performed, with age, sex, baseline HDRS‐17 scores, before‐versus‐after SUV changes in the PFC and amygdala, and ketamine groups (low‐dose ketamine or placebo group) included as independent factors. The percent change in the HDRS‐17 score at 40 min and 240 min after treatment was the dependent variable. A P‐value < 0.05 (2‐sided test) was deemed statistically significant.
RESULTS
All 48 subjects (16 subjects in each group) were recruited from December 2012 to April 2014 and participated in the entire study. Baseline demographic and clinical features (i.e., age, gender, duration of illness, psychiatric comorbidities, and HDRS‐17 scores) were similar among the three groups (Table 1).
Table 1.
Baseline variables and antidepressant responses following treatment
| A, 0.5 mg/kg | B, 0.2 kg/kg | C, Placebo | F or χ 2 | P‐value | |
|---|---|---|---|---|---|
| N = 16 | N = 16 | N = 16 | — | — | |
| Baseline variables | |||||
| Age | 43.3 (11.9) | 44.4 (10.8) | 49.9 (8.1) | 2.397 | 0.105 |
| Female | 11 | 11 | 13 | 0.844 | 0.656 |
| Duration of illness (years) | 13.8 (8.9) | 9.1 (9.4) | 10.1 (5.8) | 1.509 | 0.232 |
| Psychiatric comorbidities (DD/PD/SP/PTSD/GAD) | 7/9/2/1/10 | 9/6/2/2/10 | 8/5/3/5/10 | 0.500/2.229/0.334/3.282/0.000 | 0.779/0.328/0.846/0.194/1.000 |
| Current antidepressantsa (1ATD, 2ATDs, ATD+others) | 3, 2, 11 | 2, 2, 12 | 6, 4, 6 | 5.502 | 0.240 |
| HDRS‐17 | 22.6 (5.8) | 20.9 (5.6) | 22.8 (3.9) | 0.631 | 0.537 |
| Antidepressant responses following treatment | |||||
| Responders (40 min) | 4 | 6 | 0 | 7.074 | 0.029* |
| Responders (80 min) | 6 | 7 | 1 | 6.252 | 0.044* |
| Responders (120 min) | 5 | 7 | 3 | 2.327 | 0.312 |
| Responders (240 min) | 4 | 6 | 3 | 1.477 | 0.478 |
| HDRS‐17 changes (40 min vs. baseline) | −32.8% (27.2%) | −37.1% (24.1%) | −12.0% (11.4%) | 5.958 | 0.005* |
| HDRS‐17 changes (80 min vs. baseline) | −32.9% (25.7%) | −36.9% (27.5%) | −19.2% (19.0%) | 2.331 | 0.109 |
| HDRS‐17 changes (120 min vs. baseline) | −33.7% (28.1%) | −38.6% (22.1%) | −25.3% (20.7%) | 1.265 | 0.292 |
| HDRS‐17 changes (240 min vs. baseline) | −37.8% (25.0%) | −38.2% (21.7%) | −26.7% (20.2%) | 1.477 | 0.478 |
DD, Dysthymic disorder; PD, Panic disorder; SP, Social phobia; PTSD, Post‐traumatic stress disorder; GAD, Generalized anxiety disorder; ATD, Antidepressant; HDRS‐17, 17‐item Hamilton depression rating scales.
Current antidepressant uses included one ATD, two ATD combinations, and one ATD in combination with atypical antipsychotics (i.e., quetiapine and aripiprazole) or mood stabilizers (i.e., lithium and valproic acid). ATDs included serotonin‐specific reuptake inhibitors, serotonin‐norepinephrine reuptake inhibitors, and bupropion.
*P < 0.05.
The active ketamine infusion groups (Groups A and B) exhibited better antidepressant responses immediately following ketamine treatment than the placebo group (Group C) (Table 1). There were significantly more responders in the active ketamine infusion group (Groups A and B) than in the control group (Group C) at 40 min and 80 min following ketamine treatment (P < 0.05). The results of the mean HDRS‐17 changes indicated that the best outcome was at 40 min after active ketamine injection (40 min vs. baseline, Table 1) (P < 0.05; post hoc analysis: 0.5 mg/kg>placebo, 0.2 mg/kg > placebo).
There was no between‐group significance found regarding changes in BPRS positive symptoms during the follow‐up (Table 2). The side effects following ketamine treatment were all mild and self‐limiting and required no additional medical treatment. However, statistically, more cases of floating sensation occurred in Group A (0.5 mg/kg) than in Group B (0.2 mg/kg) (Table 2).
Table 2.
Psychotomimetic effects and side‐effect profiles following treatment
| A, 0.5 mg/kg | B, 0.2 kg/kg | C, Placebo | F or χ 2 | P‐value | |
|---|---|---|---|---|---|
| BPRS changes (40 min vs. baseline) | −20.5% (21.0%) | −18.3% (19.1%) | −10.0% (10.4%) | 1.614 | 0.210 |
| BPRS changes (80 min vs. baseline) | −23.9% (24.1%) | −20.0% (18.3%) | −12.5% (20.4%) | 1.578 | 0.218 |
| BPRS changes (120 min vs. baseline) | −22.9% (24.3%) | −22.3% (17.7%) | −14.2% (11.2%) | 1.094 | 0.344 |
| BPRS changes (240 min vs. baseline) | −23.6% (23.1%) | −21.9% (17.4%) | −15.5% (12.2%) | 0.877 | 0.423 |
| Floating Sensations | 8 | 1 | 0 | 15.590 | 0.000** |
| Dissociation | 1 | 0 | 0 | 2.043 | 0.360 |
| Dizziness/Nausea | 2 | 1 | 2 | 0.447 | 0.800 |
| Chest tightness | 2 | 1 | 0 | 2.133 | 0.344 |
| Others (Crying) | 2 | 0 | 1 | 2.133 | 0.344 |
Note. BPRS, Brief psychiatric rating scale positive symptoms subscale.
**P < 0.05.
Region of Interest Analysis of Brain SUV
The ANOVA model for the PFC showed a significant group × time interaction (F = 7.373, P = 0.002), in which both of the low‐dose ketamine groups were more associated with PFC activation than the placebo group (Fig. 1A). The ANOVA analysis did not reveal a significant main effect of group (F = 0.223, P = 0.793) or a significant interaction between group and time (F = 0.776, P = 0.467) for the amygdala; however, there was a significant main effect of time on the SUV of the amygdala (F = 40.695, P < 0.000) (Fig. 1A). In brief, the SUV in the PFC increased only in the active ketamine groups (i.e., Group A and B; Effect size for Group A: Cohen's d = 0.316, for Group B: 1.019) but not in the placebo group (Group C), whereas the SUV in the amygdala decreased significantly after treatment in all three groups (Fig. 1A). The antidepressant outcomes, which were based on the changes in the HDRS‐17 scores, correlated well with differences in the SUV in the PFC (r = −0.433, P = 0.002) (Fig. 1B) but not in the amygdala (r = 0.070, P = 0.705) (Fig. 1C). The PFC changes did not differ between those with and without floating sensations (with vs. without: 0.0186 ± 0.0092 vs. 0.0198 ± 0.0156, t = −0.210, P = 0.835).
Figure 1.
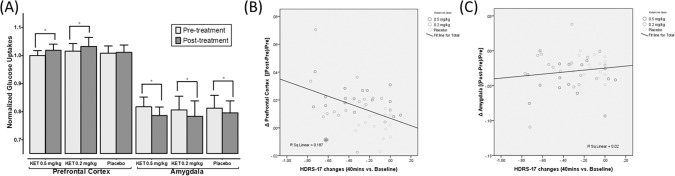
ROI analysis showing the effects of ketamine on the PFC and the amygdala among different groups. A: Normalized PFC glucose uptake (PFC SUV/whole‐brain SUV) was significantly elevated in the 0.5 mg/kg and 0.2 mg/kg groups but not in the placebo group. The ROI analysis demonstrated a significant increase in the amygdala in all three groups. The bars are presented as the mean (standard deviation [SD]). B: The PFC SUV changes after treatment; the changes were significantly correlated with improvement in depression as documented by percent changes in HDRS‐17 scores. C: No correlation existed between the amygdala SUV changes and clinical improvement. P‐values of less than 0.05 were considered to be statistically significant (*P < 0.05, **P < 0.005).
Furthermore, the SUV differences in the PFC were negatively correlated with the differences in the amygdala (Fig. 2), which supports a functionally reciprocal relationship between the PFC and the amygdala brain circuit in depression. This functional regulation in the PFC‐amygdala circuitry was observed in patients who received active ketamine treatment, but not in those who received a placebo (Fig. 2).
Figure 2.
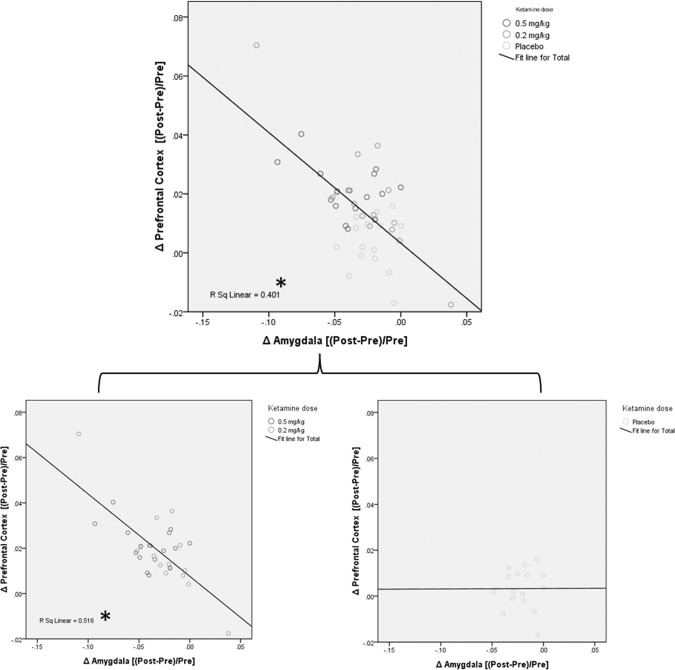
Correlation between SUV changes in the PFC and the amygdala. This correlation was observed most significantly in the patients receiving active ketamine treatment (bottom left figure) (P < 0.05). However, this correlation was not observed in the placebo group, suggesting that the antidepressant mechanisms of the placebo differ from the antidepressant mechanisms of ketamine.
Voxel‐Wise Analysis of Brain SUV
The results of the whole‐brain analysis showed that there was a significant main effect of the group on the PFC, the supplementary motor area (SMA), the dorsal anterior cingulate cortex (dACC), and the bilateral post‐central gyrus (PCG) (Fig. 3, boxed on the left). The post hoc analyses showed that after treatment, both of the ketamine groups had significantly more increases in SUV in the PFC, SMA, and parts of the PCG compared with the placebo group. However, Group A (0.5 mg/kg) had a significantly greater increase in SUV in the dACC and bilateral PCG than Group B (0.2 mg/kg) (Fig. 3; 0.5 > 0.2 mg/kg) and a significantly lower increase in SUV in the right side of the PFC (Fig. 3; 0.2 < 0.5 mg/kg). The ANOVA analysis did not reveal a significant main effect of time or a significant interaction between group and time. The results of the group‐by‐time analysis confirmed that the PFC was the main locus of low‐dose ketamine IV treatment.
Figure 3.
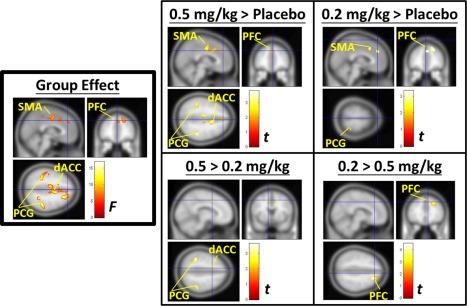
Voxel‐wise analysis showing a significant main effect of ketamine among the different groups and the post hoc analysis. Left panel: The significant main effect of the group was on the PFC, the supplementary motor area (SMA), the dorsal anterior cingulate cortex (dACC), and the bilateral post‐central gyrus (PCG). Right panel: The post hoc analyses showed that both of the ketamine groups had significantly greater increases in the SUV in the PFC, SMA, and parts of the PCG than the placebo group. The 0.5 mg/kg group (Group A) had a significantly greater increase in the SUV in the dACC and bilateral PCG than the 0.2 mg/kg group (Group B), but had a significantly lower increase in the SUV of the right‐side of the PFC than the 0.2 mg/kg group. The significance thresholds for voxel‐wise analysis were set at a voxel‐level family‐wise error (FWE)‐corrected level of P < 0.05 by two‐way group‐by‐time ANOVA. No significant main effect of time and no significant interaction between group and time were found. [Color figure can be viewed in the online issue, which is available at http://wileyonlinelibrary.com.]
The exploratory results revealed significant increases in SUV in the bilateral PFC, and decreases in SUV in the amygdala, parahippocampus, hippocampus, and cerebellum were observed in both the 0.5 mg/kg (Supporting Information Fig. S2B) and 0.2 mg/kg (Supporting Information Fig. S2B) ketamine groups (Supporting Information Table S1). Group A also demonstrated an increase in SUV in the posterior cingulate cortex, precuneus, and thalamus. In the placebo group, significant increases in SUV were observed in the precuneus, posterior cingulate cortex, parietal cortex, temporal cortex, and occipital cortex, whereas significant decreases in SUV were found in the amygdala, hippocampus, cerebellum, and pons (Supporting Information Fig. S2C and Table S1).
Linear Regression Results
Finally, linear regression models demonstrated that the most significant factors predicting antidepressant effects 40 min after administration of ketamine were the changes in the SUV in the PFC (β = −0.403, P = 0.031) and being in a ketamine group (β = 0.305, P = 0.047), whereas the SUV changes in the amygdala (P = 0.182), age (P = 0.149), and sex (P = 0.111) were not significant. Similarly, the most significant factor predicting antidepressant effects after 240 min was the change in SUV in the PFC (β = −0.549, P = 0.008), but not the ketamine group (P = 0.974), SUV changes in the amygdala (P = 0.170), age (P = 0.370), and sex (P = 0.132).
DISCUSSION
Strengths of the Study
Our study was a randomized placebo‐controlled study that investigated the effects of ketamine on brain mechanisms during the first hour of treatment. The rapid changes in glutamate neurotransmission following the NMDA‐antagonist ketamine treatment were investigated in a double‐blind randomized study design. As hypothesized, the ROI analysis and the voxel‐wise analysis found that the rapid antidepressant effects of low‐dose ketamine involved activation of the PFC. The evidence supporting this hypothesis included the finding that the increase in SUV of the PFC was specific to the low‐dose ketamine treatment and that it was significantly related to the rapid antidepressant responses in the first day after ketamine treatment.
Prefrontal Changes were the Most Important Finding
Although most previous studies administered intravenous ketamine at a dose of 0.5 mg/kg, some research has demonstrated that other dosing regimens, such as 0.2 mg/kg, are also effective [Katalinic et al., 2013] in treating TRD. Consistent with the existing evidence from western countries, we found that both of the ketamine doses (0.2 and 0.5 mg/kg) resulted in rapid antidepressant effects during the first one to two hours (Table 1); the long‐term antidepressant effects of ketamine warrant further studies. Most importantly, our neuroimaging data suggested that increased glutamatergic neurotransmission in the PFC was critical to the ketamine‐specific rapid antidepressant effect. The finding that both of the active ketamine groups, but not the placebo group, demonstrated an increase in the PFC SUV supports this claim as this increase was well correlated with antidepressant response (Fig. 1). It is important to note that the 18F‐FDG‐PET signals could be considered to be a specific proxy measurement of glutamate neurotransmission [Magistretti and Pellerin, 1999]. The PET signals were used to investigate the rapid effects of ketamine on the glutamatergic system of mood circuitry in TRD. Structural and functional deficits of the PFC have been found to be associated with TRD [Arana et al., 2008; Levinson et al., 2010; Li et al., 2010a]. Higher degrees of PFC abnormalities, as observed in TRD patients, may result in the failure to control limbic hyperactivity (e.g., the amygdala). A recent open‐labeled study reported that ketamine could change glucose metabolism in various parts of the PFC in TRD patients [Lally et al., 2015]. Augmenting PFC activity (e.g., by non‐invasive brain stimulation) has long been sought as an option for treating TRD [Berlim et al., 2013; De Ridder et al., 2011]. Interestingly, the present study found that 0.5 mg/kg of ketamine was not associated with a greater increase in PFC activity than 0.2 mg/kg, supporting the notion that the antidepressant action of ketamine occurs only in a small‐ and low‐dose range.
Our major finding, that the PFC is involved in ketamine's rapid antidepressant effects, was not unexpected as a single‐dose intravenous injection of low‐dose ketamine (0.3 mg/kg) had previously been shown to induce PFC activation and cerebellar deactivation within 20 min in healthy individuals [Holcomb et al., 2001]. Additionally, a placebo‐controlled neuroimaging study reported that low doses of ketamine resulted in rapid changes in glucose metabolism in many mood‐related brain areas in patients with bipolar disorders [Nugent et al., 2014]. In another 18F‐FDG PET study with 17 healthy volunteers, a metabolic increase in the PFC was also observed during the infusion of a sub‐anesthetic dose of ketamine [Breier et al., 1997]. The ketamine‐induced PFC functions may, in turn, lead to a decrease in limbic hyperactivity and thus improve depressive symptoms. This is supported by the fact that the changes in the SUV of the PFC were negatively correlated with SUV changes in the amygdala, which was observed only in the ketamine groups (Fig. 2).
The results from previous neuroimaging investigations have demonstrated that beliefs and expectations can markedly regulate functional activity in brain regions that are involved in perception and various aspects of emotion processing [Beauregard, 2007]. In the placebo group (Fig. 1A and Supporting Information Fig. S2A), no prominent PFC changes were observed, whereas a decrease in the SUV in the amygdala and an increase in the brain regions involved in the sensory and visual pathways, such as the occipital cortex, the temporal cortex (the ventral stream of the visual pathway), the parietal cortex (sensory perception and the dorsal stream of the visual pathway) [Schutter et al., 2001], and the posterior cingulate cortex/precuneus (associated with awareness and behavioral adaptation) [Graf et al., 2001; Jandl et al., 2005], was found. It has been reported that the most important brain change involved in the placebo effects of emotional processing is the functional decrease in the bilateral amygdala [Petrovic et al., 2005]. In addition, perceptions of drug preparations could play an important role in the psychological expectancy and placebo responses [Buckalew and Coffield, 1982]. Because continuous intravenous infusion of ketamine should be associated with a higher perceived strength of treatment compared to oral intake of conventional antidepressant pills, the findings related to changes in the posterior brain regions (e.g., occipital, temporal, parietal cortex) could be attributed to individual expectation and memory.
Potential Psychotomimetic Effects From Ketamine on Imaging Findings?
As we studied the rapid effects of ketamine (i.e., 45–60 min after the injection) on brain glucose metabolism, there could have been potential psychotomimetic effects that occurred following ketamine injection. Some side effects, such as floating sensations, dissociative symptoms, dizziness, nausea, chest discomfort, and crying, were reported in the present study. However, the only difference between groups was a higher incidence of a floating sensation in Group A, the 0.5 mg/kg ketamine group. The 0.5 mg/kg group was also associated with a greater increase in the SUVs in the bilateral sensory cortex and the attention system, the dorsal ACC, than the placebo and 0.2 mg/kg group, which may partly explain the occurrence of the side effects in the 0.5 mg/kg group (Fig. 2). Group B, the 0.2 mg/kg group, was not associated with more side effects than the placebo group. As the PFC changes and the PFC‐amygdala correlation were identified in both the 0.5 mg/kg and 0.2 mg/kg ketamine groups, it is plausible that the observed clinical effects and the associated changes in the PFC in those receiving active ketamine treatment were not caused by direct psychotomimetic effects. In fact, patients who experienced more side effects (e.g., floating sensation) did not experience greater increases in the SUV of the PFC than those who did not experience side effects. BPRS changes over time were also similar across the three groups. A single‐dose intravenous injection of low‐dose ketamine (0.3 mg/kg) has previously been reported to induce PFC activation within 20 min in healthy individuals, and this finding was not simply induced by psychotomimetic effects of ketamine [Holcomb et al., 2001]. The results from preclinical data also support the belief that the effect of ketamine on the PFC is potentially the crux of its functioning as an antidepressant; the rapid antidepressant effects of ketamine have been found to be dependent on the mammalian target of rapamycin, which peaks at 30–60 min following ketamine injection and leads to increased synaptic signaling proteins and an increased number and function of new spine synapses in the PFC of rats within 24 h [Li et al., 2010c].
Limitations
Some limitations should be considered in the interpretation of our study results. First of all, despite its randomized and placebo‐controlled design, the current study could be considered an add‐on ketamine study because the original medication regimen that the TRD patients had failed to respond was not discontinued during the ketamine treatment and PET scans. Therefore, the observed responses to ketamine could be the result of a combination or a regulation of the effects of the medications that the patients were already using. However, because we have previous solid data to support the antidepressant effects of ketamine among Asian patients with TRD, the add‐on design was more ethically appropriate and could provide more naturalistic data. Additionally, the study's main finding of the ketamine‐induced increases in the PFC SUV occurred within the first hour of ketamine treatment, whereas the concomitant medications were not altered. Furthermore, there were no differences in the medications used across all groups (Table 1). Second, although the Hamilton depression rating scale has been used in many of the previous ketamine studies [Berman et al., 2000; Zarate et al., 2006], it may not be ideal for rating short‐term changes in depression. Third, the results of the present study provide evidence to support the involvement of PFC activation on initial antidepressant effects of low‐dose ketamine in human TRD subjects. However, whether the increase in PFC activity is also related to the antidepressant effects of ketamine at other time points (e.g., day three) or to the persistent resolution of TRD remains elusive and requires further research.
CONCLUSION
The results of this double‐blind placebo‐controlled study provide evidence that the rapid antidepressant mechanisms of low doses of ketamine involve the facilitation of glutamatergic neurotransmission in the PFC.
Supporting information
Supporting Information
Supporting Information
Supporting Information
ACKNOWLEDGMENTS
Authors would like to express their gratitude to all patients who kindly participated in this study. They also thank all the research assistants, physicians, and staffs for their assistance during the study process and the imaging recruitments.
Unique trial Number: UMIN000016985 (Fast Antidepressant Efficacy and Central Mechanisms of Single Low‐Dose Ketamine Injection in Treating Major Depression: a double‐blind and randomized‐controlled trial and image study)
REFERENCES
- Arana AB, Borckardt JJ, Ricci R, Anderson B, Li X, Linder KJ, Long J, Sackeim HA, George MS (2008): Focal electrical stimulation as a sham control for repetitive transcranial magnetic stimulation: Does it truly mimic the cutaneous sensation and pain of active prefrontal repetitive transcranial magnetic stimulation? Brain Stimul 1:44–51. [DOI] [PMC free article] [PubMed] [Google Scholar]
- Aroni F, Iacovidou N, Dontas I, Pourzitaki C, Xanthos T (2009): Pharmacological aspects and potential new clinical applications of ketamine: Reevaluation of an old drug. J Clin Pharmacol 49:957–964. [DOI] [PubMed] [Google Scholar]
- Beauregard M (2007): Mind does really matter: Evidence from neuroimaging studies of emotional self‐regulation, psychotherapy, and placebo effect. Prog Neurobiol. 81:218–236. [DOI] [PubMed] [Google Scholar]
- Berlim MT, van den Eynde F, Tovar‐Perdomo S, Daskalakis ZJ (2013): Response, remission and drop‐out rates following high‐frequency repetitive transcranial magnetic stimulation (rTMS) for treating major depression: A systematic review and meta‐analysis of randomized, double‐blind and sham‐controlled trials. Psychol Med 1–15. [DOI] [PubMed] [Google Scholar]
- Berman RM, Cappiello A, Anand A, Oren DA, Heninger GR, Charney DS, Krystal JH (2000): Antidepressant effects of ketamine in depressed patients. Biol Psychiatry 47:351–354. [DOI] [PubMed] [Google Scholar]
- Borckardt JJ, Reeves ST, Weinstein M, Smith AR, Shelley N, Kozel FA, Nahas Z, Byrne KT, Morgan K, George MS (2008): Significant analgesic effects of one session of postoperative left prefrontal cortex repetitive transcranial magnetic stimulation: A replication study. Brain Stimul 1:122–127. [DOI] [PMC free article] [PubMed] [Google Scholar]
- Breier A, Malhotra AK, Pinals DA, Weisenfeld NI, Pickar D (1997): Association of ketamine‐induced psychosis with focal activation of the prefrontal cortex in healthy volunteers. Am J Psychiatry 154:805–811. [DOI] [PubMed] [Google Scholar]
- Buckalew LW, Coffield KE (1982): An investigation of drug expectancy as a function of capsule color and size and preparation form. J Clin Psychopharmacol 2:245–248. [PubMed] [Google Scholar]
- De Ridder D, Vanneste S, Kovacs S, Sunaert S, Dom G (2011): Transient alcohol craving suppression by rTMS of dorsal anterior cingulate: An fMRI and LORETA EEG study. Neurosci Lett 496:5–10. [DOI] [PubMed] [Google Scholar]
- Fitzgerald PB, Oxley TJ, Laird AR, Kulkarni J, Egan GF, Daskalakis ZJ (2006): An analysis of functional neuroimaging studies of dorsolateral prefrontal cortical activity in depression. Psychiatry Res 148:33–45. [DOI] [PubMed] [Google Scholar]
- Gispert JD, Pascau J, Reig S, Martinez‐Lazaro R, Molina V, Garcia‐Barreno P, Desco M (2003): Influence of the normalization template on the outcome of statistical parametric mapping of PET scans. Neuroimage 19:601–612. [DOI] [PubMed] [Google Scholar]
- Graf T, Engeler J, Achermann P, Mosimann UP, Noss R, Fisch HU, Schlaepfer TE (2001): High frequency repetitive transcranial magnetic stimulation (rTMS) of the left dorsolateral cortex: EEG topography during waking and subsequent sleep. Psychiatry Res 107:1–9. [DOI] [PubMed] [Google Scholar]
- Hamilton M (1967): Development of a rating scale for primary depressive illness. Br J Soc Clin Psychol 6:278–296. [DOI] [PubMed] [Google Scholar]
- Hirvonen J, Goodwin RS, Li CT, Terry GE, Zoghbi SS, Morse C, Pike VW, Volkow ND, Huestis MA, Innis RB (2012): Reversible and regionally selective downregulation of brain cannabinoid CB1 receptors in chronic daily cannabis smokers. Mol Psychiatry 17:642–649. [DOI] [PMC free article] [PubMed] [Google Scholar]
- Holcomb HH, Lahti AC, Medoff DR, Weiler M, Tamminga CA (2001): Sequential regional cerebral blood flow brain scans using PET with H2(15)O demonstrate ketamine actions in CNS dynamically. Neuropsychopharmacology 25:165–172. [DOI] [PubMed] [Google Scholar]
- Jandl M, Bittner R, Sack A, Weber B, Gunther T, Pieschl D, Kaschka WP, Maurer K (2005): Changes in negative symptoms and EEG in schizophrenic patients after repetitive transcranial magnetic stimulation (rTMS): An open‐label pilot study. J Neural Transm 112:955–967. [DOI] [PubMed] [Google Scholar]
- Katalinic N, Lai R, Somogyi A, Mitchell PB, Glue P, Loo CK (2013): Ketamine as a new treatment for depression: A review of its efficacy and adverse effects. Aust N Z J Psychiatry 47:710–727. [DOI] [PubMed] [Google Scholar]
- Kimbrell TA, Little JT, Dunn RT, Frye MA, Greenberg BD, Wassermann EM, Repella JD, Danielson AL, Willis MW, Benson BE, Speer AM, Osuch E, George MS, Post RM. (1999): Frequency dependence of antidepressant response to left prefrontal repetitive transcranial magnetic stimulation (rTMS) as a function of baseline cerebral glucose metabolism. Biol Psychiatry 46:1603–1613. [DOI] [PubMed] [Google Scholar]
- Kupfer DJ, Frank E, Phillips ML (2012): Major depressive disorder: New clinical, neurobiological, and treatment perspectives. Lancet 379:1045–1055. [DOI] [PMC free article] [PubMed] [Google Scholar]
- Lally N, Nugent AC, Luckenbaugh DA, Ameli R, Roiser JP, Zarate CA (2014): Anti‐anhedonic effect of ketamine and its neural correlates in treatment‐resistant bipolar depression. Transl Psychiatry 4:e469. [DOI] [PMC free article] [PubMed] [Google Scholar]
- Lally N, Nugent AC, Luckenbaugh DA, Niciu MJ, Roiser JP, Zarate CA Jr. (2015): Neural correlates of change in major depressive disorder anhedonia following open‐label ketamine. J Psychopharmacol 29:596–607. [DOI] [PMC free article] [PubMed] [Google Scholar]
- Levinson AJ, Fitzgerald PB, Favalli G, Blumberger DM, Daigle M, Daskalakis ZJ (2010): Evidence of cortical inhibitory deficits in major depressive disorder. Biol Psychiatry 67:458–464. [DOI] [PubMed] [Google Scholar]
- Li CT, Lin CP, Chou KH, Chen IY, Hsieh JC, Wu CL, Lin WC, Su TP (2010a): Structural and cognitive deficits in remitting and non‐remitting recurrent depression: A voxel‐based morphometric study. Neuroimage 50:347–356. [DOI] [PubMed] [Google Scholar]
- Li CT, Wang SJ, Hirvonen J, Hsieh JC, Bai YM, Hong CJ, Liou YJ, Su TP (2010b): Antidepressant mechanism of add‐on repetitive transcranial magnetic stimulation in medication‐resistant depression using cerebral glucose metabolism. J Affect Disord 127:219–229. [DOI] [PubMed] [Google Scholar]
- Li N, Lee B, Liu RJ, Banasr M, Dwyer JM, Iwata M, Li XY, Aghajanian G, Duman RS (2010c): mTOR‐dependent synapse formation underlies the rapid antidepressant effects of NMDA antagonists. Science 329:959–964. [DOI] [PMC free article] [PubMed] [Google Scholar]
- Li CT, Su TP, Wang SJ, Tu PC, Hsieh JC (2015): Prefrontal glucose metabolism in medication‐resistant major depression. Br J Psychiatry 206:316–323. [DOI] [PubMed] [Google Scholar]
- Magistretti PJ, Pellerin L (1999): Astrocytes Couple Synaptic Activity to Glucose Utilization in the Brain. News Physiol Sci 14:177–182. [DOI] [PubMed] [Google Scholar]
- Mathew SJ, Shah A, Lapidus K, Clark C, Jarun N, Ostermeyer B, Murrough JW (2012): Ketamine for treatment‐resistant unipolar depression: Current evidence. CNS Drugs 26:189–204. [DOI] [PMC free article] [PubMed] [Google Scholar]
- Mayberg HS, Liotti M, Brannan SK, McGinnis S, Mahurin RK, Jerabek PA, Silva JA, Tekell JL, Martin CC, Lancaster JL, Fox PT. (1999): Reciprocal limbic‐cortical function and negative mood: Converging PET findings in depression and normal sadness. Am J Psychiatry 156:675–682. [DOI] [PubMed] [Google Scholar]
- Murrough JW, Iosifescu DV, Chang LC, Al Jurdi RK, Green CE, Perez AM, Iqbal S, Pillemer S, Foulkes A, Shah A, Charney DS, Mathew SJ. (2013): Antidepressant efficacy of ketamine in treatment‐resistant major depression: A two‐site randomized controlled trial. Am J Psychiatry 170:1134–1142. [DOI] [PMC free article] [PubMed] [Google Scholar]
- Naughton M, Clarke G, O'Leary OF, Cryan JF, Dinan TG (2014): A review of ketamine in affective disorders: Current evidence of clinical efficacy, limitations of use and pre‐clinical evidence on proposed mechanisms of action. J Affect Disord 156:24–35. [DOI] [PubMed] [Google Scholar]
- Nugent AC, Diazgranados N, Carlson PJ, Ibrahim L, Luckenbaugh DA, Brutsche N, Herscovitch P, Drevets WC, Zarate CA Jr. (2014): Neural correlates of rapid antidepressant response to ketamine in bipolar disorder. Bipolar Disord 16:119–128. [DOI] [PMC free article] [PubMed] [Google Scholar]
- Overall JE, Gorham DR (1962): The brief psychiatric rating scale. Psychol Rep 10:799–812. [Google Scholar]
- Paul IA, Skolnick P (2003): Glutamate and depression: Clinical and preclinical studies. Ann N Y Acad Sci 1003:250–272. [DOI] [PubMed] [Google Scholar]
- Petrovic P, Dietrich T, Fransson P, Andersson J, Carlsson K, Ingvar M (2005): Placebo in emotional processing‐induced expectations of anxiety relief activate a generalized modulatory network. Neuron 46:957–969. [DOI] [PubMed] [Google Scholar]
- Price JL, Drevets WC (2010): Neurocircuitry of mood disorders. Neuropsychopharmacology 35:192–216. [DOI] [PMC free article] [PubMed] [Google Scholar]
- Schutter DJ, van Honk J, d'Alfonso AA, Postma A, de Haan EH (2001): Effects of slow rTMS at the right dorsolateral prefrontal cortex on EEG asymmetry and mood. Neuroreport 12:445–447. [DOI] [PubMed] [Google Scholar]
- Signorini M, Paulesu E, Friston K, Perani D, Colleluori A, Lucignani G, Grassi F, Bettinardi V, Frackowiak RS, Fazio F (1999): Rapid assessment of regional cerebral metabolic abnormalities in single subjects with quantitative and nonquantitative [18F]FDG PET: A clinical validation of statistical parametric mapping. Neuroimage 9:63–80. [DOI] [PubMed] [Google Scholar]
- Tzourio‐Mazoyer N, Landeau B, Papathanassiou D, Crivello F, Etard O, Delcroix N, Mazoyer B, Joliot M (2002): Automated anatomical labeling of activations in SPM using a macroscopic anatomical parcellation of the MNI MRI single‐subject brain. Neuroimage 15:273–289. [DOI] [PubMed] [Google Scholar]
- Zarate CA, Jr. , Singh JB, Carlson PJ, Brutsche NE, Ameli R, Luckenbaugh DA, Charney DS, Manji HK (2006): A randomized trial of an N‐methyl‐d‐aspartate antagonist in treatment‐resistant major depression. Arch Gen Psychiatry. 63:856–864. [DOI] [PubMed] [Google Scholar]
Associated Data
This section collects any data citations, data availability statements, or supplementary materials included in this article.
Supplementary Materials
Supporting Information
Supporting Information
Supporting Information