

Abstract
Machado‐Joseph Disease, inherited type 3 spinocerebellar ataxia (SCA3), is the most common form worldwide. Neuroimaging and neuropathology have consistently demonstrated cerebellar alterations. Here we aimed to discover whole‐brain functional biomarkers, based on parametric performance‐level‐dependent signals. We assessed 13 patients with early SCA3 and 14 healthy participants. We used a combined parametric behavioral/functional neuroimaging design to investigate disease fingerprints, as a function of performance levels, coupled with structural MRI and voxel‐based morphometry. Functional magnetic resonance imaging (fMRI) was designed to parametrically analyze behavior and neural responses to audio‐paced bilateral thumb movements at temporal frequencies of 1, 3, and 5 Hz. Our performance‐level‐based design probing neuronal correlates of motor coordination enabled the discovery that neural activation and behavior show critical loss of parametric modulation specifically in SCA3, associated with frequency‐dependent cortico/subcortical activation/deactivation patterns. Cerebellar/cortical rate‐dependent dissociation patterns could clearly differentiate between groups irrespective of grey matter loss. Our findings suggest functional reorganization of the motor network and indicate a possible role of fMRI as a tool to monitor disease progression in SCA3. Accordingly, fMRI patterns proved to be potential biomarkers in early SCA3, as tested by receiver operating characteristic analysis of both behavior and neural activation at different frequencies. Discrimination analysis based on BOLD signal in response to the applied parametric finger‐tapping task significantly often reached >80% sensitivity and specificity in single regions‐of‐interest.Functional fingerprints based on cerebellar and cortical BOLD performance dependent signal modulation can thus be combined as diagnostic and/or therapeutic targets in hereditary ataxia. Hum Brain Mapp 37:3656–3668, 2016. © 2016 Wiley Periodicals, Inc.
Keywords: spinocerebellar ataxia type 3, parametric functional MRI, voxel‐based morphometry, movement disorder, cerebellar degeneration, imaging biomarker
INTRODUCTION
Spinocerebellar ataxia type 3 (SCA3, Machado‐Joseph Disease, MJD) is an inherited neurodegenerative disease [Coutinho and Andrade, 1978; Rosenberg et al., 1976; Woods and Schaumburg, 1972] caused by an expanded (CAG)n motif repeat mutation in the coding region of the ATXN3 gene, in chromosome 14q32.1 [Maciel et al., 2001; Martins et al., 2006]. Normal alleles have usually a number of repeats ranging between 12 and 41, whereas in disease carriers, this range is between 53 and 86 repeats [Bettencourt et al., 2010; Kawaguchi et al., 1994; Schöls et al., 2004]. CAG repeat length exhibits an inverse correlation with age at onset [Abe et al., 1998; Klockgether et al., 1996] and determines 46% of onset variability in addition to non‐repeat‐related factors [Globas et al., 2008; Swami et al., 2009] such as paternal transmission and intragenic CGG/GGG polymorphism [Martins et al., 2006; Takiyama et al., 1995].
Recent studies emphasized the importance of early symptom detection [Garrard et al., 2008; Globas et al., 2008; Jardim et al., 2001]. Neuropathology and immunohistochemistry suggest involvement of a broad array of cortical and subcortical regions [Coutinho et al., 1982; Kumada et al., 2000; Lukas et al., 2008; Rüb et al., 2004, 2002; Yamada et al., 2001], which is consistent with neuroradiological studies [Horimoto et al., 2008; Murata et al., 1998].
So far, neuroimaging studies in SCA3 focused on structural or resting‐state changes [Hashimoto et al., 2011]. Functional MRI (fMRI) is based on the blood oxygenation level dependent (BOLD) signal changes [Ogawa et al., 1990], and still infrequently used in clinical practice [Pillai, 2010]. It has focused only on the cerebellum as the region of interest (ROI) in hereditary ataxias [Stefanescu et al., 2015]. One way to overcome the limitations of fMRI in clinical research is to use level‐dependent parametric designs coupled with whole‐brain analysis. For example, a quantitative change in motor performance patterns, such as frequency of movement alternation, can potentially be related with neuroactivation in clinically impaired groups. Parametric manipulation of the task demands might be critical in identifying regions specifically performing the physiologically relevant computations [Müller et al., 2003], because it may identify rate‐dependent differences or alternatively, performance‐level‐dependent BOLD signal breakdown.
Here we searched for the neural correlates of deficits in rhythmic motor planning of sequences of increasing frequency associated with SCA3. We set to assess motor coordination of hand movements (assessing the ability to accurately perform discrete voluntary movements at increasing temporal frequency levels) and to parametrically correlate behavior with neuroactivation (for the feasibility of this approach, see Wurster et al. [2015] and Riecker et al. [2003]). The aim was to identify fingerprints of altered functional patterns in relatively early stages of the disease, of potential use to monitor disease progression. This study had a data‐driven exploratory component, and tested as well the specific hypothesis that brain activity patterns would reflect temporal pacing performance levels in regions such as the supplementary motor area (SMA). We found evidence for performance‐level‐dependent neuroactivation in SCA3 suggesting early functional reorganization in a broad array of cortical areas contrasting with low cerebellar activation. Such fMRI activation patterns might be used in reliable statistical classification of disease states.
MATERIALS AND METHODS
Participants
Thirteen SCA3 patients (mean age, 43.66 ± 11.25 years; 7 female) and 14 control participants (34.67 ± 10.77; 8 female) were included. All patients, with genetically proven disease (through investigation of the expansion of CAG motif repetition located within exon 10 of the ATXN3 gene), were recruited from the Neurogenetics Unit of the University Hospital of Coimbra (CHUC ‐ Coimbra, Portugal). Control participants had no personal or family history of neurological or psychiatric diseases. All participants were right handed. The Helsinki Declaration guidelines were followed throughout the study. The Ethics Committee of the Faculty of Medicine of the University of Coimbra approved the study.
On the day of the MRI examination, neurological examination was performed in all participants. We defined as the onset of the disease when a permanent neurological disturbance appeared (mean ± SD = 32.94 ± 11.44 years). Disease severity and clinical ataxia scores were assessed also on the same day based on the scale for the assessment and rating of ataxia (SARA) [Schmitz‐Hübsch et al., 2006] and the neurological examination score for the assessment of spinocerebellar ataxia type 3 (NESSCA) [Kieling et al., 2008]. Clinical and demographic data are summarized in Table 1.
Table 1.
Demographic characteristics of the study participants
| SCA3 | Controls | P valuea | |
|---|---|---|---|
| n | 13 | 14 | |
| Age (years) | 43.66 (11.25) | 34.67 (10.77) | n.s. |
| Age range (years) | 24.30–60.23 | 24.51–57.62 | |
| Gender (M/F) | 6/7 | 6/8 | n.s. |
| Disease duration (years) | 7.51 (5.77) | ||
| NESSCA score | 11.00 (6.86) | ||
| SARA score | 11.92 (10.07) | ||
| CAG expanded | 65.67 (19.58) | ||
| CAG normal | 20.50 (4.78) |
NESSCA = neurological examination score for spinocerebellar ataxia; SARA = scale for the assessment and rating of ataxia. Data presented as mean (± standard deviation).
Between‐group differences were tested using Mann‐Whitney test for age and χ2‐test for gender distribution.
MRI Scanning
Structural and fMRI acquisitions were performed at the national brain imaging network facilities, in a 3 T research scanner (Magnetom TIM Trio, Siemens, phased array 12‐channel birdcage head coil).
Structural MRI Data Acquisition
We acquired a 3D anatomical MPRAGE (magnetization‐prepared rapid gradient echo) scan using a standard T1w gradient echo pulse sequence (TR = 2530 ms; TE = 3.42 ms; TI = 1100 ms; flip angle 7°; 176 slices with voxel size 1 × 1 × 1 mm; FOV 256 mm).
Voxel‐Based Morphometry Analysis
Data were preprocessed using SPM8 software (Wellcome Trust Centre for Neuroimaging, UCL, London, UK, http://www.fil.ion.ucl.ac.uk/spm). T1‐weighted native images were aligned onto the axis of the anterior and posterior commissures, automatically corrected for inhomogeneity of the magnetic field and segmented into grey matter (GM), white matter (WM), and cerebrospinal fluid [Ashburner and Friston, 2000, 2005]. We used the standard MNI template for spatial normalization and segmentation followed by a nonlinear only “modulation” step [Ashburner, 2009; Ashburner and Friston, 2000; Buckner et al., 2004]. We smoothed the modulated normalized GM volume images with three‐dimensional 8‐mm full‐width at half‐maximum (FWHM) isotropic Gaussian kernels. We then applied a GLM at each voxel to investigate between‐group differences in regional volumes, including age as a covariate. Volumetric differences (SCA3 vs controls) were compared using voxel‐wise two‐sample t‐tests corrected for multiple comparisons (voxel level P value <0.05 corrected employing the family wise error (FWE) rate) [Hayasaka et al., 2004; Worsley et al., 1999].
Behavioral Task and fMRI Data Acquisition
The fMRI motor paradigm involved bilateral, audio‐paced thumb movements. Participants were instructed to use their thumbs simultaneously to press alternately on one button of two hand‐held MRI compatible response‐boxes (Cedrus Lumina LP‐400, LU400 PAIR, Cedrus Corporation, San Pedro, CA, USA). Movements were paced by audio‐tones at temporal frequencies of 1, 3, and 5 Hz, delivered by MRI‐compatible headphones (Avotec, Inc., FL, USA). Twelve blocks of stimulation, four per frequency, were interleaved with 13 rest periods. Block duration was 28 s (stimulation) and 14 s (rest). The total scanning time was 518 s. Stimulation was synchronized to the acquisition using a PC running the Psychophysics Toolbox (PTB3) [Brainard, 1997; Pelli, 1997], on Matlab R2008a (MathWorks, Natick, MA, USA). fMRI series consisted of a sequence of 148 gradient‐echo echo‐planar imaging (EPI) scans (TR 3500 ms; TE = 30 ms; flip angle 90°; 36 interleaved slices with voxel size 3 × 3 × 3 mm; FOV 256 mm) in a parametric block‐design stimulation paradigm, covering the whole brain, including the cerebellum, brainstem, and motor cortex.
To establish the best frequency of pacing, pilot experiments were performed in a subgroup (9) of participants to decide the final chosen frequencies, which encompassed three clearly distinct (1, 3, and 5 Hz) performance/difficulty levels (e.g., 4 and 6 Hz were both in a similar range of difficulty) (data not shown).
Behavioral Performance Analysis
During fMRI, the time of button presses was recorded. Average thumb movement frequency over block type for each prescribed audio‐pacing frequency of 1, 3, and 5 Hz was calculated as number of button presses as a function of time, as well as the standard deviation, as a measure of movement synchronization. Between‐group motor performance was compared using the Mann–Whitney test at P value (two‐tailed) = 0.05.
fMRI Data Preprocessing and Analysis
Preprocessing/statistical analyses of functional imaging data were performed using BrainVoyager QX 2.4 (BrainInnovation, Maastricht, The Netherlands). Scans were preprocessed by applying slice scan time correction, linear trend removal, temporal high‐pass filtering (2 cycles/run), and head–motion correction. We did not apply temporal smoothing to the data but we did apply spatial smoothing, to ensure normality of the data and satisfy the requirements of the random field theory. Scans were excluded when >2 voxel motion was detected. Functional data were co‐registered to each subject's structural T1 image in stereotaxic Talairach space. For statistical comparisons, we performed a random effects (RFX) general linear model (GLM) analysis which allows modelling explicitly both within‐subjects and between‐subjects variance components to generalize findings to the population level [Penny et al., 2003]. Predictors corresponding to the 3 prescribed stimulation frequencies were used to estimate condition effects (beta values) separately for each subject (first‐level), allowing to localize areas exhibiting parametric modulation, that is, in which BOLD signal changes differentially with movement frequency. Then the estimated first‐level mean effects per subject enter the second level as the new dependent variable and serve as input to the group analysis. Analysis at the second‐level explicitly models the variability of estimated effects across subjects to generalize to the population [Beckmann et al., 2003]. Statistical maps were corrected for multiple comparisons using the false‐discovery rate (FDR) correction at P value <0.01 with cluster extent threshold (Figs. 2 and 3). We further examined the mean activation values and the average BOLD fMRI response time courses for each stimulation condition in selected ROIs (Figs. 2 and 3).
Figure 2.
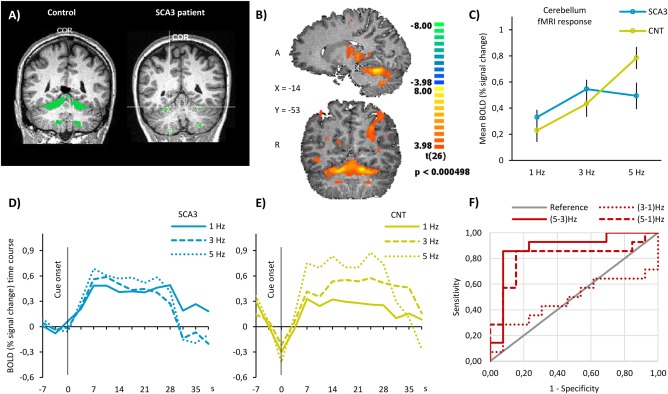
Functional MRI results in the cerebellum. (A) Actual cerebellar activation volumes in a 33‐year‐old control participant, on the left, and a 21‐year‐old SCA3 patient, with mild disease (SARA score = 6 and NESSCA score = 14), on the right. In these individual cases, cerebellar activation volumes were 18869 and 1766 mm3, respectively. No visible gross atrophy is visible. (B) Hand‐movement‐related RFX statistical parametric map in sagittal and coronal sections showing significant neuronal activation in cerebellum. Data are shown at a height threshold of P‐value <0.05 corrected for false‐discovery rate. (C) Mean BOLD activity within cerebellum during finger‐tapping task in SCA3 patients and controls. Data are presented as mean % signal change ± standard error of the mean. (D, E) Averaged time course of the BOLD response in the cerebellum in SCA3 patients and controls, respectively, during finger‐tapping task at the three prescribed frequencies. (F) Sensitivity analysis of BOLD signal in cerebellum. We computed the ROC curve for the difference in BOLD signal between every two frequencies of finger‐tapping. ROC curve analysis shows up to 85.7% and specificity of 84.6% (AUC = 0.879) to discriminate SCA3 patients from controls.
Figure 3.
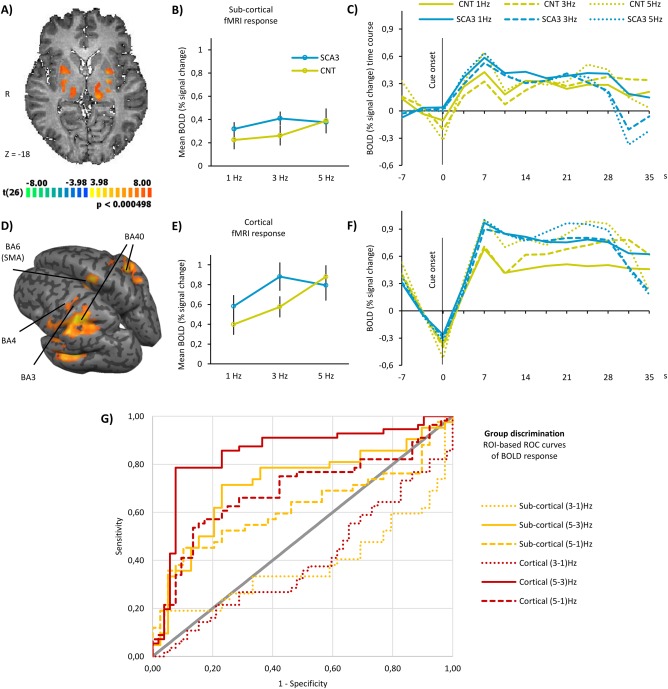
Functional MRI results in subcortical and cortical regions. (A) Hand‐movement‐related RFX statistical parametric map in axial section showing significant neuronal activation in putamen, globus pallidus, and thalamus. Data are shown at a height threshold of P‐value <0.05 corrected for false‐discovery rate. (B) Mean BOLD activity in SCA3 patients and controls within subcortical regions, during finger‐tapping task. Data are presented as mean % signal change ± standard error of the mean. (C) Averaged time course of the BOLD response in SCA3 and controls in subcortical regions, during finger‐tapping task at the three prescribed frequencies. (D) Hand‐movement‐related RFX statistical parametric map in inflated template brain showing significant neuronal activation in (BA, Brodmann area) BA3, BA4, BA6/SMA, and BA40. Data are shown at a height threshold of P‐value <0.05 corrected for false‐discovery rate. (E) Mean BOLD activity in SCA3 patients and controls within cortical regions, during finger‐tapping task. Data are presented as mean % signal change ± standard error of the mean. (F) Averaged time course of the BOLD response in SCA3 and controls in cortical regions, during finger‐tapping task at the three prescribed frequencies. (G) Sensitivity analysis of BOLD signal in cortical (red lines) and subcortical (yellow lines) regions. We computed the ROC curve for the difference in BOLD signal between every two frequencies of finger‐tapping. ROC curve analysis shows up to sensitivity 71.4% and specificity 76.9% (AUC = 0.717) to discriminate SCA3 patients from controls in subcortical regions. In cortical regions, ROC analysis reached sensitivity 85.7% and specificity 76.9% (AUC = 0.846) in group discrimination.
Regions‐of‐Interest‐Based Analysis of BOLD Response
To perform independent parametric ROI analyses, these were first selected based on the contrast (1 + 3 + 5 Hz > baseline), in pooled data from all participants. All subsequent hypotheses about parametric effects and between‐group differences are explicitly independent from this contrast. Furthermore, we circumscribed the ROI analysis to regions that were identified in a large voxel‐wise, coordinate‐based meta‐analysis on 685 sets of activation foci in Talairach space gathered from 38 published studies employing finger‐tapping tasks [Witt et al., 2008]. Clusters of concordance in audio paced finger‐tapping tasks were identified within the primary sensorimotor cortices, SMA, premotor cortex, basal ganglia, and anterior cerebellum. After investigating BOLD responses individually in each ROI, we merged ROIs in three groups — cerebellum, subcortical, and cortical regions — as the response profiles (shape of signal waveforms) were similar across ROIs within these categories.
For each grouped ROI, we performed an ROI‐GLM analysis in each group to extract the mean activation values in response to each frequency, to investigate the effect of prescribed frequencies on average BOLD response in the cerebellum, subcortical regions, and cortical regions.
We further investigated the shape of the full BOLD signal change across time during finger‐tapping periods in all grouped ROIs.
Parametric Analysis
In each grouped ROI, we performed a mixed ANOVA with one between‐subjects factor (group) and one within‐subjects factor (frequency) with repeated measures to compare the mean difference between groups. In case there was an interaction effect between the two factors, we further tested the simple main effect and pairwise comparison of frequencies in each group to quantitatively assess the parametric modulation effect of the finger‐tapping task in brain activation. We used age and age at disease onset (in SCA3 group) as a covariate as age at lesion onset might affect functional reorganization in cerebellar lesion patients [Peterburs et al. 2010].
ROC Analysis
We hypothesized that the parametric effect would be lost in the SCA3 group, and the BOLD response would not follow the parametric variation of frequencies in SCA3 patients as in controls. Thus, we set to investigate the potential role of this parametric modulation of BOLD response as a biomarker of early SCA3 and computed receiver operating characteristic (ROC) curves for the discrimination of SCA3 patients and control participants based on the activation difference between every two prescribed frequencies: (3–1 Hz), (5–3 Hz), and (5–1 Hz).
Cerebellar Activation
The individual activation volume in the cerebellum was obtained from statistical maps of activation with the previously described contrast, thresholded at P value <0.01 using Bonferroni correction for multiple comparisons.
RESULTS
VBM Analysis of Whole‐Brain Group Differences
VBM results are presented in Figure 1 and Supporting Information, Table I. We found clusters of significant grey matter reduction in SCA3 patients in multiple brain regions over the thalamus, cerebellum, parietal lobe (postcentral gyrus), and insula.
Figure 1.
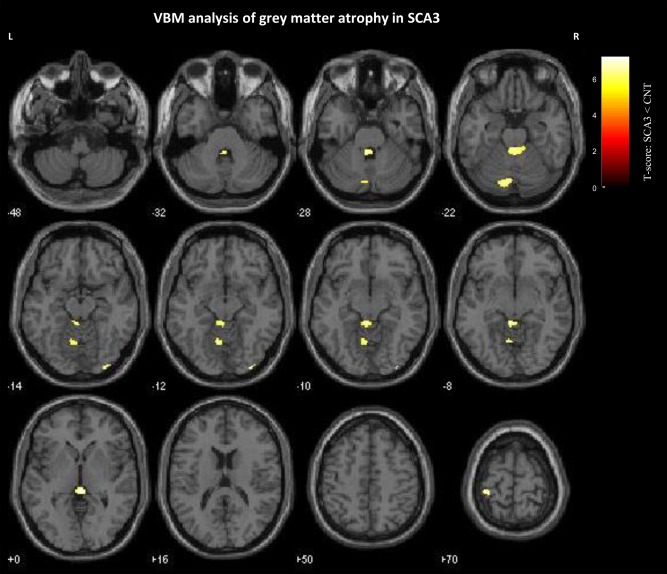
Significant grey matter reduction in SCA3 patients. Results are presented at a voxel‐level P‐value <0.05 corrected for family‐wise error rate and nonstationary smoothness. The spatial extent threshold was set at 10 voxels. Voxels showing significant grey matter relative volume between‐groups reduction are overlaid on canonical single subject T1‐weighted MRI template.
Behavioral Performance: Evidence for Increasingly Degraded Performance as a Function of Frequency
All subjects were able to rhythmically perform thumb movements but with different performance patterns, which are presented in Table 2.
Table 2.
Behavioral performance and cerebellar activation volume
| SCA3 | Controls | P valuea | |
|---|---|---|---|
| Number of presses at 1 Hz | 1.04 (0.04) | 1.01 (0.02) | 0.029 |
| Number of presses at 3 Hz | 2.58 (0.46) | 2.98 (0.13) | 0.010 |
| Number of presses at 5 Hz | 2.90 (0.78) | 4.02 (0.59) | <0.001 |
| CAV (mm3) | 4571.69 (1823.38) | 7102.57 (1782.73) | 0.120 |
CAV = cerebellar activation volume. Data presented as mean (± standard deviation).
Between‐group differences were tested using t‐test or Mann–Whitney test when data were not normally distributed (both were corrected with Bonferroni method).
Motor performance between patient and control groups was significantly different. They showed similar numbers of thumb movements (NT) at low frequencies (NT1Hz, SCA3 = 1.04; NT1Hz, CNT = 1.01) but diverged at higher frequencies (NT3Hz, SCA3 = 2.58; NT3Hz, CNT = 2.98; NT5Hz, SCA3 = 2.90; NT5Hz, CNT = 4.02). Between‐group differences in motor performance were significant at all prescribed frequencies (P value <0.05, all comparisons, corrected for multiple comparisons; see Table 2). The increased deviation of the motor performance from the prescribed frequencies in the SCA3 group demonstrates diminished movement synchronization. One‐sample t test of frequency deviation was applied for each frequency in both groups. We found significant deviations with effect size increasing gradually, being higher for the mean number of button presses at 5 Hz than for the mean number of button presses at 1 and 3 Hz in SCA3 patients and controls. These results support the notion that this parametric design of the motor task enabled the identification of 5 Hz as the performance limiting condition for both groups, ensuring asymptotic neuroactivation, which was correlated with movement frequency.
Correlation Between Genetics, Behavior, Age, and Cerebellar Activation
In the SCA3 group, age had a positive strong correlation with the number of button presses at 1 Hz (r = 0.648, P value < 0.001) and an inverse significant correlation with the motor response at 3 Hz (r = −0.494, P value = 0.009) and 5 Hz (r = −0.542, P value = 0.003). This pattern was not found in the control group. The overall correlation analysis is presented in Table 3.
Table 3.
Correlation between genetics, behavior, age, and cerebellar activation
| Disease duration | Cerebellar activation volume | |||
|---|---|---|---|---|
| Rho | P value | Rho | P value | |
| NESSCA | 0.709 | 0.074 | −0.284 | 0.536 |
| SARA | 0.460 | 0.114 | −0.168 | 0.583 |
| Disease duration | — | — | −0.314 | 0.297 |
| CAG expanded | −0.076 | 0.847 | 0.203 | 0.601 |
| CAG normal | 0.192 | 0.649 | 0.313 | 0.450 |
| CAV | −0.314 | 0.297 | — | — |
| Number of presses at 1 Hz | 0.313 | 0.297 | −0.203 | 0.311 |
| Number of presses at 3 Hz | 0.071 | 0.817 | 0.288 | 0.145 |
| Number of presses at 5 Hz | 0.137 | 0.655 | 0.382a | 0.049 |
NESSCA = neurological examination score for spinocerebellar ataxia; SARA = scale for the assessment and rating of ataxia; CAG expanded/normal = repeat length of the respective alleles; CAV = cerebellar activation volume. Correlation was tested using Spearman's rank–order correlation in all participants.
Correlation is significant at 0.05 level (two‐tailed).
Correlation Between Clinical Ratings and Genetics
Strong correlations were found between the two clinical scales: scale for the assessment and rating of ataxia (SARA) [Schmitz‐Hübsch et al., 2006] and the neurological examination score (NESSCA) [Kieling et al., 2008] (r = 0.953, P value <0.05). However, no significant correlations were found between the expanded CAG repeats length and neurological examination measures.
The age of disease onset presents a strong inverse correlation with expanded CAG repeat length (r = −0.88, P value = 0.02), confirming previous evidence that CAG length influences disease onset [Abe et al., 1998; Globas et al., 2008]. The disease duration showed a strong correlation with SARA (r = 0.872, P value = 0.024).
Sensitivity Analysis of Behavioral Performance
We performed sensitivity and specificity analysis of behavioral performance of patients versus controls. We computed the ROC (receiver operating characteristic) curve for the number of button presses at each prescribed frequency. The area under the curve (AUC) was found to be highly significantly different from the null hypothesis of no between‐group discrimination for 1 Hz (AUC = 0.812, SEM = 0.082, P value = 0.002), 3 Hz (AUC = 0.898, SEM = 0.065, P value <0.001) and 5 Hz (AUC = 0.910, SEM = 0.067, P value <0.001). Additionally, we investigated for each group the sensitivity of task performance to discriminate the prescribed frequency. We found the motor task performance to be significantly discriminative of all the prescribed frequencies in controls. In SCA3, interestingly, the within group discrimination between 3 and 5 Hz was the only not significant ROC curve, suggesting loss of the parametric effect.
Cerebellar Activation Volumes
Quantitative analysis of cerebellar activation volume (CAV) is shown in Table 2. The average CAV in SCA3 patients and controls was (mean ± SD) 4571.69 ± 1823.38 and 7102.57 ± 1782.73 mm3, respectively. In Figure 2A, representative examples of CAVs are shown for a patient and a healthy participant. However, the difference in CAV was not significantly different between‐groups (Mann‐Whitney test, P value = 0.120, Table 2). We did not find significant correlations between CAV and age or clinical variables at P value < 0.05 (Table 3). Concerning correlations between CAV and motor performance in the SCA3 and control groups a significant correlation was found specifically for the demanding rate of 5 Hz (Table 3).
Whole‐Brain fMRI Analysis and ROI Definition
The fMRI statistical map extracted from the whole‐brain RFX‐GLM analysis yielded significantly activated voxels in the postcentral gyrus (Brodmann area 3, BA3), primary motor cortex in the precentral gyrus (M1/BA4), SMA (BA6), and inferior parietal cortex in the area of the supramarginal gyrus (BA40). We also observed significant activation of three subcortical regions: putamen, globus pallidus, and thalamus, as well as in the cerebellum. Cluster coordinates are presented in Supporting Information, Table II. We observed significant activation in expected regions, according to the meta‐analysis of finger‐tapping studies [Witt et al., 2008].
As mean BOLD amplitude and response profiles were similar in regions in the cortex or in subcortical regions, we grouped BA3, BA4, BA6, and BA40 in an ROI called cortical. The same was observed in putamen, globus pallidus, and thalamus; thus we grouped them in an ROI called subcortical. We investigated the within‐group effect of parametric modulations across the three grouped ROIs: cerebellum, subcortical, and cortical brain regions. A mixed ANOVA with one between‐subjects factor (group) and one within‐subjects factor (frequencies) was conducted to examine the effect of the disease and prescribed frequency on BOLD response in the cerebellum, subcortical regions, and cortical regions. In addition, we tested between‐group effect of this parametric finger‐tapping task in brain activation and further assessed the potential role of a parametric finger‐tapping task as a biomarker for the discrimination of early SCA3 patients.
Importantly, we tested the effect of age and age at disease onset in the fMRI results by running an ANCOVA model including age and age at disease onset in SCA3 as covariates. These covariates did not show any significant contribution to the analyzed BOLD responses.
BOLD Response in the Cerebellum
Parametric analysis
Figure 2B shows the whole‐brain statistical RFX map, depicting significant activation in the anterior cerebellum of the whole group of participants, at a low and corrected P value. After drawing an ROI for the cerebellum as described earlier, we plotted the mean BOLD amplitude in each group separately at each prescribed frequency (Fig. 2C). We can clearly see that control participants are able to increase the response in the cerebellum with increasing frequencies, while SCA3 participants are only able to do it for the intermediate increase in cue frequency (from 1 to 3 Hz) but not for the most demanding frequency (5 Hz), indeed decreasing BOLD signal amplitude in this condition. The same effect is observable in the full time course of BOLD response, plotted in Figure 2D,E for patients and controls, respectively. While SCA3 patients show close (and often mixed) profiles across frequencies, control participants exhibit a clearly separated response profile for each frequency with distinct amplitudes across time.
Quantitatively, the repeated measures ANOVA analysis showed a statistically significant interaction between the main effects of group and tapping frequency on the BOLD response in the cerebellum, F (2, 50) = 9.029, P value <0.001 (Table 4). Computation of simple main effects revealed that frequency variation in SCA3 patients had a much smaller effect size (ηp 2 = 0.320) and was significant only for the pairwise comparison of 1 Hz vs 3 Hz. In controls, a larger effect size was found (ηp 2 = 0.638) and all pairwise comparisons of frequencies were significant (Table 4). These results suggest loss of the parametric effect in SCA3 in the cerebellum.
Table 4.
Regions‐of‐interest analysis of BOLD response with repeated measures ANOVA
| ROI‐based repeated measures ANOVA | Stats | Cerebellum | Subcortical | Cortical | ||
|---|---|---|---|---|---|---|
| Interaction frequency × group | df (error) | 2 (50) | 2 (158) | 2 (212) | ||
| F | 9.029 | 3.043 | 21.148 | |||
| P value | <0.001 | 0.050 | <0.001 | |||
| ηp 2 | 0.265 | 0.037 | 0.166 | |||
| SCA3 | Simple main effect | df (error) | 1.386 (16.630) | 1.570 (59.649) | 2 (102) | |
| F | 5.635 | 2.868 | 31.989 | |||
| P value | 0.021 | 0.077 | <0.001 | |||
| ηp 2 | 0.320 | 0.070 | 0.385 | |||
| Pairwise comparisons | 1–3 Hz | P values | <0.001 | 0.005 | <0.001 | |
| 3–5 Hz | 1.000 | 1.000 | 0.086 | |||
| 1–5 Hz | 0.198 | 0.586 | <0.001 | |||
| CNT | Simple main effect | df (error) | 2 (26) | 1.559 (63.902) | 1.634 (89.884) | |
| F | 22.892 | 9.888 | 52.595 | |||
| P value | < 0.001 | 0.012 | <0.001 | |||
| ηp 2 | 0.638 | 0.115 | 0.489 | |||
| Pairwise comparisons | 1–3 Hz | P values | 0.071 | 1.000 | <0.001 | |
| 3–5 Hz | 0.003 | 0.051 | <0.001 | |||
| 1–5 Hz | <0.001 | 0.045 | <0.001 | |||
ηp 2 = partial eta squared, a measure of the estimated effect size; df = degrees of freedom.
Pairwise comparisons are post‐hoc tests corrected with Bonferroni correction for multiple comparisons.
When sphericity was not verified, we used a Greenhouse‐Geisser correction.
ROC analysis
The discrimination between early SCA3 patients and healthy controls based on the BOLD response to the parametric finger‐tapping task is presented in Figure 2F.
We can observe that the difference in BOLD response at frequencies (5–3 Hz) and (5–1 Hz) are highly discriminative between groups, unlike the difference between (3–1 Hz). Both 5–3 Hz (AUC = 0.879) and 5–1 Hz (AUC = 0.808) BOLD differences‐based discrimination curves are significant, P value = 0.001 and 0.007 respectively, reaching sensitivity 85.7% and specificity 84.6% in the former (solid red line in Fig. 2D).
BOLD response in cortical and subcortical regions
The results of whole‐brain RFX‐GLM, parametric analysis, and ROC analysis in subcortical and cortical regions are presented in Figure 3. Significant activation in clusters located in putamen, globus pallidus, and thalamus is observable in Figure 3A, showing the same whole‐brain statistical RFX map described before. These clusters were used to draw the corresponding ROIs, and then transformed in the grouped‐ROI subcortical. The same map is shown in an inflated version of a template brain in Talairach space in Figure 3D, with the four described cortical regions highlighted. These clusters were used to draw the corresponding ROIs, and then transformed in the grouped‐ROI cortical.
Parametric analysis
Similar to the cerebellum, the mean activation amplitude was higher in SCA3 patients, except for the most demanding frequency of 5 Hz, in both subcortical (Fig. 3B) and cortical regions (Fig. 3E). Furthermore, the variation of the BOLD response is also not able to fully trail the variation in the tapping frequency in SCA3 patients, unlike in control participants. In both the plots of the mean response and full response time courses (Fig. 3C for subcortical regions and Fig. 3F for cortical regions), we can observe that SCA3 patients are able to increase the BOLD response from tapping at 1 Hz to tapping at 3 Hz but not when they are asked to tap at 5 Hz. Control participants on the other hand are able to linearly increase BOLD response values within these two groups of regions whenever the prescribed frequency increases, they even show a more pronounced increase from 3 to 5 Hz, particularly in the late part of the tapping periods (Fig. 3C,F).
In both subcortical and cortical regions, we observed a significant interaction effect, between group and frequency of finger‐tapping, in the BOLD response. Simple main effects revealed different effects of frequency variation in SCA3 patients and controls across subcortical and cortical regions.
Subcortical regions: putamen, globus pallidus, and thalamus
The repeated‐measures ANOVA showed a significant interaction between the effects of group and tapping frequency on BOLD response in subcortical regions, F (2, 158) = 3.043, P value = 0.050, as presented in Table 4. SCA3 patients had a small main effect size (ηp 2 = 0.070) of frequency that was not significant (P value = 0.077). In controls, the simple main effect in subcortical regions had a larger and significant effect size (ηp 2 = 0.115, P value = 0.012) (Table 4). These results suggest predominant loss of the parametric effect in SCA3 in subcortical regions.
Cortical regions: BA3, BA4, BA6 (SMA), and BA40
The repeated‐measures ANOVA revealed a statistically significant interaction between the effects of group and tapping frequency on BOLD response in cortical regions, F (2, 212) = 21.148, P value <0.001, as presented in the last column of Table 4. In the case of cortical regions both SCA3 patients and control participants had a significant main effect (P value < 0.001), but the effect size was smaller in SCA3 patients (ηp 2 = 0.385) than in controls (ηp 2 = 0.489). When looking at the pairwise comparisons, we observed that all were significant in control participants, while in SCA3 patients, the increase from 3 to 5 Hz finger‐tapping did not yield a significant increase in BOLD response. These results suggest loss of the parametric effect in SCA3 in cortical regions as well.
Overall, in all analyzed ROIs, the mean BOLD response was higher in SCA3 patients for finger‐tapping at 1 and 3 Hz but lower than in controls when tapping at the most demanding frequency of 5 Hz. This was due to the loss of parametric modulation of neuronal BOLD response by increasing tapping frequencies as also supported by the behavioral results (Table 2).
In sum, neuroactivation was larger in SCA3 in a broad array of neocortical regions and the cerebellum, but SCA3 patients were not able to effectively maintain a parametric modulation of neuroactivation.
ROC analysis
We performed a sensitivity and specificity analysis of the BOLD response of SCA3 patients versus healthy controls in subcortical and cortical grouped ROIs. Discrimination between early SCA3 patients and controls based on BOLD response to the parametric finger‐tapping task is presented in Figure 3G. Note that, the way we computed the discrimination variables — BOLD difference between frequencies — allows the ROC curves to be symmetrically informative in the upper or lower part of the graph, depending on whether the BOLD amplitude increases or decreases from one frequency to the other. As we have seen in the results of the parametric analysis, in the SCA3 group, the BOLD response decreases from 3 to 5 Hz frequency, while in control participants, it increases.
Subcortical regions: putamen, globus pallidus, and thalamus
We can observe that the difference in BOLD response at frequencies (5–3 Hz) is highly discriminative between groups (AUC = 0.717, P value = 0.001, sensitivity 71.4%, and specificity 76.9% — solid yellow line in Fig. 3G).
Cortical regions: BA3, BA4, BA6 (SMA), and BA40
We observed that the differences in BOLD responses at frequencies (5–3 Hz) and (5–1 Hz) are highly discriminative between groups. Both (5–3 Hz, AUC = 0.846) and (5–1 Hz, AUC = 0.688) BOLD differences‐based discrimination curves are significant (P value < 0.001 and P value = 0.001, respectively, sensitivity 85.7% and specificity 76.9% in the former — solid red line in Fig. 3G).
DISCUSSION
In this study, we found evidence of cortico‐cerebellar functional dissociation in early MJD/SCA3 (Machado‐Joseph Disease) patients during a parametric motor tapping task, where different pacing rates were imposed to vary performance load. This parametric design allowed discriminating with high specificity and sensitivity between patients and controls across brain regions beyond the cerebellum. The tapping task paced by a series of periodic auditory signals (1–3–5 Hz) yielded significant BOLD effects within the cerebellum and several cortical and subcortical areas characterized by distinct rate/response functions in SCA3 patients compared to controls.
We found clusters of significant but low extent of grey matter reduction in SCA3 patients in several regions, including the cerebellum. This result is in accordance with a very recent study comparing structural and fMRI abnormalities of cerebellar cortex and nuclei in SCA3, SCA6, and Friedreich's ataxia, which reported that the volume of the cerebellum was markedly reduced in spinocerebellar ataxia type 6, preserved in Friedreich's ataxia, and mildly reduced in spinocerebellar ataxia type 3 [Stefanescu et al., 2015]. It is nevertheless possible that group analysis and correction for multiple comparisons may reduce the extent of significant volume loss in SCA3 patients compared to controls.
Moreover, we found significant activation in the anterior part of the cerebellum. However, volumes of activation of this structure did not discriminate between SCA3 patients and controls, unlike rate‐dependent changes in BOLD response signals. Among others, cerebellar disorders give rise to slowed and more irregular movements during finger‐tapping [Riecker et al., 2003]. In accordance with this, activation volumes in the cerebellum were correlated significantly with measured motor task performance at the most demanding frequency (Table 3). This result supports previous findings of the significant contribution of the cerebellum to repetitive finger movements to be restricted to faster rates above a level of about 3 Hz [Riecker et al., 2003]. Furthermore, we found motor performance to be significantly diminished in SCA3 group (Table 2), corroborated by ROC analysis of behavioral data, which showed significant discrimination power between patients and controls.
In addition to the structural differences in the cerebellum and significant rate‐dependent difference in cerebellar activation levels found between groups, functional MRI findings in this study show a consistent pattern of activations in both groups in Brodmann area 40 (BA40). BA40 is involved in somatosensory processing as well as of repetitive passive movements [Carel et al., 2000]. Moreover, we also found neuronal activations in BA3, BA4, and BA6. BA3 includes the somatosensory cortex and lesions affecting this region produce astereognosia, which can be related to the task employed in this study [Bernard et al., 2002]. BA4 includes the primary motor cortex, and is connected to anterior BA6. BA6 (premotor cortex and SMA) receives input from cerebellum and is involved in sensory guidance and planning of coordinated movements based on external cues.
Finally, the activation paradigm also revealed significant clusters in subcortical regions: putamen, globus pallidus, and thalamus. The motor circuitry encompasses several frontal areas and projections mainly to the putamen, and that information is returned via ventrolateral thalamus back to the neocortex [Riecker et al., 2003]. Besides this “direct” putaminal–pallidal pathway, the striatum targets the basal ganglia output stage via the external segment of the globus pallidus and the subthalamic nucleus (“indirect” pathway) [Lanciego et al., 2012; Riecker et al., 2003]. As globus pallidus is involved in both the direct and indirect basal ganglia motor loop, future research is needed to elucidate the relative role of putative functional reorganization in each of these particular branches of the motor loop.
The significant activation of these regions beyond cerebellar activation in SCA3 patients might also represent a mechanism of compensation. This whole‐brain mechanism is reminiscent of the early intracerebellar network shifting that is observed in spinocerebellar ataxia type 6 [Falcon et al., 2015].
Importantly, our parametric design enabled group discrimination with high sensitivity and specificity. Parametric approaches may be better suited to isolate the contribution of regions specifically related to the task at hand [Müller, 2003]. This is an important contribution of parametric designs to overcome the common limitations of fMRI in clinical practice which are often restricted to localization. Parametric designs allow to probe performance levels in an incremental level allowing to test for trend effects and/or performance level dependence, which is important in clinical conditions. This enabled the detection of breakdown of task performance at 5 Hz in the clinical group. The identification of the (sometimes subtle) performance‐level‐dependent differences in the pattern of functional response properties between groups or throughout time can be a valuable tool not only in diagnosis aid but may also aid in disease progression monitoring. In our study, the striking pattern of cortico‐cerebellar modulation of activity was characterized by hyperactivation at the least demanding frequencies (1 and 3 Hz), particularly in cortical regions, and decreased activation at the most demanding frequency (5 Hz), particularly in the cerebellum, in SCA3 patients as compared to healthy controls. The breakdown of task performance is possibly the most likely explanation for the differential activation effects observed with ANOVA and this is the most parsimonious explanation, rather than a mere rate or state change. Interestingly, principally in cortical regions, the mean BOLD response is much higher in SCA3 patients than in controls for 1 and 3 Hz, revealing a possible compensatory recruitment of sensorimotor areas to overcome cerebellum dysfunction. However, when participants were asked to finger tap at 5 Hz BOLD response decreased in all analyzed regions, suggesting that patients had surpassed the dynamic range of maintained function. Accordingly, in control participants, the frequency variation had a linear parametric effect on BOLD signal modulation in all regions, while in SCA3 patients, the parametric effect was lost and both performance and BOLD responses collapsed from 3 to 5 Hz. This differential modulation of BOLD signal in response to variation in the frequency of the finger‐tapping task revealed to be a significant discrimination tool between SCA3 patients and controls, as further supported by the sensitivity ROC analysis of the fMRI signal.
The lack of a clinical control group (other SCA types or cerebellar lesion patients) is a potential limitation of this study. Further studies with more comprehensive disease groups are needed to further address the specificity of these findings.
CONCLUSION
The striking early rate‐dependent cortico–subcortical pattern of activation, beyond the cerebellum, seen in coupled behavioral and parametric fMRI measurements suggest a possible role for whole‐brain fMRI as a potential useful tool for clinical evaluation of MJD/SCA3 patients before overt disease manifestations, as corroborated by ROC analysis of both behavioral and imaging data.
AUTHOR CONTRIBUTIONS
All authors have seen and agreed with the contents of the manuscript and each author believes that the manuscript represents honest work.
Conceived and designed the experiments: JVD, RF, CJ, and MCB. Acquired data: JVD, RF, GC, CN, and CF. Analyzed the data: JVD and RF. Wrote the paper: JVD, RF, CJ, and MCB. Contributed significantly to discussion and helped revise the manuscript: ML, GC, and CN.
CONFLICTS OF INTEREST
The authors declare no competing financial or other conflict of interest. The submission is not under review at any other publication.
Supporting information
Supporting Information
ACKNOWLEDGMENTS
MCB is the guarantor of this work and, as such, have full access to all the data in the study and takes responsibility for the integrity of the data and the accuracy of the data analysis.
We thank the participants for their involvement in this study. We also thank João Marques and Sónia Afonso from ICNAS, University of Coimbra, for help with MRI procedures.
J.V. Duarte and R. Faustino contributed equally to this work.
REFERENCES
- Abe Y, Tanaka F, Matsumoto M, Doyu M, Hirayama M, Kachi T, Sobue G (1998): CAG repeat number correlates with the rate of brainstem and cerebellar atrophy in Machado‐Joseph disease. Neurology 51:882–884. [DOI] [PubMed] [Google Scholar]
- Ashburner J (2009): Computational anatomy with the SPM software. Magn Reson Imaging 27:1163–1174. [DOI] [PubMed] [Google Scholar]
- Ashburner J, Friston KJ (2000): Voxel‐based morphometry ‐ The methods. Neuroimage 11:805–821. [DOI] [PubMed] [Google Scholar]
- Ashburner J, Friston KJ (2005): Unified segmentation. Neuroimage 26:839–851. [DOI] [PubMed] [Google Scholar]
- Beckmann CF, Jenkinson M, Smith SM (2003): General multilevel linear modeling for group analysis in FMRI. Neuroimage 20:1052–1063. [DOI] [PubMed] [Google Scholar]
- Bernard R, Goran D, Sakai S, Carr T, McFarlane D, Nordell B, Cooper T, Potchen E (2002): Cortical activation during rhythmic hand movements performed under three types of control: An fMRI study. Cogn Affect Behav Neurosci 2:271–281. [DOI] [PubMed] [Google Scholar]
- Bettencourt C, Santos C, Montiel R, Kay T, Vasconcelos J, Maciel P, Lima M (2010): The (CAG)n tract of Machado‐Joseph Disease gene (ATXN3): A comparison between DNA and mRNA in patients and controls. Eur J Hum Genet 18:621–623. [DOI] [PMC free article] [PubMed] [Google Scholar]
- Brainard DH (1997): The psychophysics toolbox. Spat Vis 10:433–436. [PubMed] [Google Scholar]
- Buckner RL, Head D, Parker J, Fotenos AF, Marcus D, Morris JC, Snyder AZ (2004): A unified approach for morphometric and functional data analysis in young, old, and demented adults using automated atlas‐based head size normalization: Reliability and validation against manual measurement of total intracranial volume. Neuroimage 23:724–738. [DOI] [PubMed] [Google Scholar]
- Carel C, Loubinoux I, Boulanouar K, Manelfe C, Rascol O, Celsis P, Cholet F (2000): Neural substrate for the effects of passive training on sensorimotor cortical representation: A study with functional magnetic resonance imaging in healthy subjects. J Cereb Blood Flow Metab 20:478–484. [DOI] [PubMed] [Google Scholar]
- Coutinho P, Guimarães A, Scaravilli F (1982): The pathology of Machado‐Joseph Disease: Report of a possible homozygous case. Acta Neuropathol 58:48–54. [DOI] [PubMed] [Google Scholar]
- Coutinho P, Andrade C (1978): Autosomal dominant system degeneration in Portuguese families of the Azores Islands: A new genetic disorder involving cerebellar, pyramidal, extrapyramidal and spinal cord motor functions. Neurology 28:703–709. [DOI] [PubMed] [Google Scholar]
- Falcon M, Gomez C, Chen E, Shereen A, Solodkin A (2015): Early cerebellar network shifting in spinocerebellar ataxia type 6. Cereb Cortex 1–14. [DOI] [PMC free article] [PubMed] [Google Scholar]
- Garrard P, Martin NH, Giunti P, Cipolotti L (2008): Cognitive and social cognitive functioning in spinocerebellar ataxia: A preliminary characterization. J Neurol 255:398–405. [DOI] [PubMed] [Google Scholar]
- Globas C, du Montcel ST, Baliko L, Boesch S, Depondt C, DiDonato S, Durr A, Filla A, Klockgether T, Mariotti C, Melegh B, Rakowicz M, Ribai P, Rola R, Schmitz‐Hubsch T, Szymanski S, Timmann D, Van de Warrenburg BP, Bauer P, Schols L (2008): Early symptoms in spinocerebellar ataxia type 1, 2, 3, and 6. Mov Disord 23:2232–2238. [DOI] [PubMed] [Google Scholar]
- Hashimoto R‐I, Javan AK, Tassone F, Hagerman RJ, Rivera SM (2011): A voxel‐based morphometry study of grey matter loss in fragile X‐associated tremor/ataxia syndrome. Brain 134:863–878. [DOI] [PMC free article] [PubMed] [Google Scholar]
- Hayasaka S, Phan KL, Liberzon I, Worsley KJ, Nichols TE (2004): Nonstationary cluster‐size inference with random field and permutation methods. Neuroimage 22:676–687. [DOI] [PubMed] [Google Scholar]
- Horimoto Y, Matsumoto M, Yuasa H, Kojima A, Nokura K, Katada E, Yamamoto T, Yamamoto H, Mitake S (2008): Brainstem in Machado‐Joseph Disease: Atrophy or small size? Eur J Neurol 15:102–105. [DOI] [PubMed] [Google Scholar]
- Jardim LB, Pereira ML, Silveira I, Ferro A, Sequeiros J, Giugliani R (2001): Neurologic findings in Machado‐Joseph disease: Relation with disease duration, subtypes, and (CAG)n. Arch Neurol 58:899–904. [DOI] [PubMed] [Google Scholar]
- Kawaguchi Y, Okamoto T, Taniwaki M, Aizawa M, Inoue M, Katayama S, Kawakami H, Nakamura S, Nishimura M, Akiguchi I, Kimura J, Narumiya S, Kakizuka A (1994): CAG expansions in a novel gene for Machado‐Joseph Disease at chromosome 14q32.1. Nat Genet 8:221–228. [DOI] [PubMed] [Google Scholar]
- Kieling C, Rieder CRM, Silva ACF, Saute JAM, Cecchin CR, Monte TL, Jardim LB (2008): A neurological examination score for the assessment of spinocerebellar ataxia 3 (SCA3). Eur J Neurol 15:371–376. [DOI] [PubMed] [Google Scholar]
- Klockgether T, Kramer B, Lüdtke R, Schöls L, Laccone F (1996): Repeat length and disease progression in spinocerebellar ataxia type 3. Lancet 348:830. [DOI] [PubMed] [Google Scholar]
- Kumada S, Hayashi M, Mizuguchi M, Nakano I, Morimatsu Y, Oda M (2000): Cerebellar degeneration in hereditary dentatorubral‐pallidoluysian atrophy and Machado‐Joseph disease. Acta Neuropathol 99:48–54. [DOI] [PubMed] [Google Scholar]
- Lanciego JL, Luquin N, Obeso J. a (2012): Functional neuroanatomy of the basal ganglia. Cold Spring Harb Perspect Med 2: [DOI] [PMC free article] [PubMed] [Google Scholar]
- Lukas C, Hahn HK, Bellenberg B, Hellwig K, Globas C, Schimrigk SK, Köster O, Schöls L (2008): Spinal cord atrophy in spinocerebellar ataxia type 3 and 6: Impact on clinical disability. J Neurol 255:1244–1249. [DOI] [PubMed] [Google Scholar]
- Maciel P, Costa M, do C, Ferro A, Rousseau M, Santos CS, Gaspar C, Barros J, Rouleau GA, Coutinho P, Sequeiros J (2001): Improvement in the molecular diagnosis of Machado‐Joseph Disease. Arch Neurol 58:1821–1827. [DOI] [PubMed] [Google Scholar]
- Martins S, Calafell F, Wong VCN, Sequeiros J, Amorim A (2006): A multistep mutation mechanism drives the evolution of the CAG repeat at MJD/SCA3 locus. Eur J Hum Genet 14:932–940. [DOI] [PubMed] [Google Scholar]
- Müller NG, Donner TH, Bartelt OA, Brandt SA, Villringer A, Kleinschmidt A (2003): The functional neuroanatomy of visual conjunction search: A parametric fMRI study. Neuroimage 20:1578–1590. [DOI] [PubMed] [Google Scholar]
- Murata Y, Yamaguchi S, Kawakami H, Imon Y, Maruyama H, Sakai T, Kazuta T, Ohtake T, Nishimura M, Saida T, Chiba S, Oh‐i T, Nakamura S (1998): Characteristic magnetic resonance imaging findings in Machado‐Joseph Disease. Arch Neurol 55:33–37. [DOI] [PubMed] [Google Scholar]
- Ogawa S, Lee T‐M, Nayak AS, Glynn P (1990): Oxygenation‐sensitive contrast in magnetic resonance image of rodent brain at high magnetic fields. Magn Reson Med 14:68–78. [DOI] [PubMed] [Google Scholar]
- Pelli DG (1997): The VideoToolbox software for visual psychophysics: Transforming numbers into movies. Spat Vis 10:437–442. [PubMed] [Google Scholar]
- Penny W, Holmes A, Friston KJ (2003): Random effects analysis In: Frackowiak RSJ, Friston KJ, Frith CD, Dolan R, Price CJ, Zeki S, Ashburner J, Penny W, editors. Human Brain Function. London: Academic Press. [Google Scholar]
- Peterburs J, Bellebaum C, Koch B, Schwarz M, Daum I (2010): Working memory and verbal fluency deficits following cerebellar lesions: Relation to interindividual differences in patient variables. Cerebellum 9:375–383. [DOI] [PubMed] [Google Scholar]
- Pillai JJ (2010): The evolution of clinical functional imaging during the past 2 decades and its current impact on neurosurgical planning. Am J Neuroradiol 31:219–225. [DOI] [PMC free article] [PubMed] [Google Scholar]
- Riecker A, Wildgruber D, Mathiak K, Grodd W, Ackermann H (2003): Parametric analysis of rate‐dependent hemodynamic response functions of cortical and subcortical brain structures during auditorily cued finger tapping: A fMRI study. Neuroimage 18:731–739. [DOI] [PubMed] [Google Scholar]
- Rosenberg RN, Nyhan WL, Bay C, Shore P (1976): Autosomal dominant striatonigral degeneration: A clinical, pathologic, and biochemical study of a new genetic disorder. Neurology 26:703–714. [DOI] [PubMed] [Google Scholar]
- Rüb U, Brunt ER, De Vos RAI, Del Turco D, Del Tredici K, Gierga K, Schultz C, Ghebremedhin E, Bürk K, Auburger G, Braak H (2004): Degeneration of the central vestibular system in spinocerebellar ataxia type 3 (SCA3) patients and its possible clinical significance. Neuropathol Appl Neurobiol 30:402–414. [DOI] [PubMed] [Google Scholar]
- Rüb U, de Vos RAI, Schultz C, Brunt ER, Paulson H, Braak H (2002): Spinocerebellar ataxia type 3 (Machado‐Joseph Disease): Severe destruction of the lateral reticular nucleus. Brain 125:2115–2124. [DOI] [PubMed] [Google Scholar]
- Schmitz‐Hübsch T, Du Montcel ST, Baliko L, Berciano J, Boesch S, Depondt C, Giunti P, Globas C, Infante J, Kang J‐S, Kremer B, Mariotti C, Melegh B, Pandolfo M, Rakowicz M, Ribai P, Rola R, Schöls L, Szymanski S, Van De Warrenburg BP, Dürr A, Klockgether T (2006): Scale for the assessment and rating of ataxia: Development of a new clinical scale. Neurology 66:1717–1720. [DOI] [PubMed] [Google Scholar]
- Schöls L, Bauer P, Schmidt T, Schulte T, Riess O (2004): Autosomal dominant cerebellar ataxias: Clinical features, genetics, and pathogenesis. Lancet Neurol 3:291–304. [DOI] [PubMed] [Google Scholar]
- Stefanescu MR, Dohnalek M, Maderwald S, Thurling M, Minnerop M, Beck A, Schlamann M, Diedrichsen J, Ladd ME, Timmann D (2015): Structural and functional MRI abnormalities of cerebellar cortex and nuclei in SCA3, SCA6 and Friedreich's ataxia. Brain 138:1182–1197. [DOI] [PMC free article] [PubMed] [Google Scholar]
- Swami M, Hendricks AE, Gillis T, Massood T, Mysore J, Myers RH, Wheeler VC (2009): Somatic expansion of the Huntington's disease CAG repeat in the brain is associated with an earlier age of disease onset. Hum Mol Genet 18:3039–3047. [DOI] [PMC free article] [PubMed] [Google Scholar]
- Takiyama Y, Igarashi S, Rogaeva EA, Endo K, Rogaev EI, Tanaka H, Sherrington R, Sanpei K, Liang Y, Saito M, Tsuda T, Takano H, Ikeda M, Lin C, Chi H, Kennedy JL, Lang AE, Wherrett JR, Segawa M, Nomura Y, Yuasa T, Weissenbach J, Yoshida M, Nishizawa M, Kidd KK, Tsuji S, George‐Hyslop PHS (1995): Evidence for inter‐generational instability in the CAG repeat in the MJD1 gene and for conserved haplotypes at flanking markers amongst Japanese and Caucasian subjects with Machado‐Joseph Disease. Hum Mol Genet 4:1137–1146. [DOI] [PubMed] [Google Scholar]
- Witt ST, Meyerand ME, Laird AR (2008): Functional neuroimaging correlates of finger tapping task variations: An ALE meta‐analysis. Neuroimage 42:343–356. [DOI] [PMC free article] [PubMed] [Google Scholar]
- Woods BT, Schaumburg HH (1972): Nigro‐spino‐dentatal degeneration with nuclear ophthalmoplegia: A unique and partially treatable clinico‐pathological entity. J Neurol Sci 17:149–166. [DOI] [PubMed] [Google Scholar]
- Worsley KJ, Andermann M, Koulis T, MacDonald D, Evans AC (1999): Detecting changes in nonisotropic images. Hum Brain Mapp 8:98–101. [DOI] [PMC free article] [PubMed] [Google Scholar]
- Wurster CD, Graf H, Ackermann H, Groth K, Kassubek J, Riecker A (2015): Neural correlates of rate‐dependent finger‐tapping in Parkinson's disease. Brain Struct Funct 220:1637–1648. [DOI] [PubMed] [Google Scholar]
- Yamada M, Hayashi S, Tsuji S, Takahashi H (2001): Involvement of the cerebral cortex and autonomic ganglia in Machado‐Joseph disease. Acta Neuropathol 101:140–144. [DOI] [PubMed] [Google Scholar]
Associated Data
This section collects any data citations, data availability statements, or supplementary materials included in this article.
Supplementary Materials
Supporting Information