

Abstract
Functional interactions in the brain are constrained by the underlying anatomical architecture, and structural and functional networks share network features such as modularity. Accordingly, age‐related changes of structural connectivity (SC) may be paralleled by changes in functional connectivity (FC). We provide a detailed qualitative and quantitative characterization of the SC–FC coupling in human aging as inferred from resting‐state blood oxygen‐level dependent functional magnetic resonance imaging and diffusion‐weighted imaging in a sample of 47 adults with an age range of 18–82. We revealed that SC and FC decrease with age across most parts of the brain and there is a distinct age‐dependency of regionwise SC–FC coupling and network‐level SC–FC relations. A specific pattern of SC–FC coupling predicts age more reliably than does regionwise SC or FC alone (r = 0.73, 95% CI = [0.7093, 0.8522]). Hence, our data propose that regionwise SC–FC coupling can be used to characterize brain changes in aging. Hum Brain Mapp 37:2645–2661, 2016. © 2016 Wiley Periodicals, Inc.
Keywords: aging, brain connectivity, structure, function, resting‐state network
INTRODUCTION
The overwhelming majority of the brain's energy is consumed by intrinsic neuronal activity, which is present in the absence of an explicit task, during the so‐called “resting state” [Biswal et al., 1995]. Intrinsic activity may facilitate the transfer of information, and aid in task performance [Raichle and Mintun, 2006]. Resting‐state functional connectivity (rsFC) represents the degree to which intrinsic activity is correlated between region pairs across time. Changes in rsFC have been found among older adults [Damoiseaux et al., 2007], individuals with mild cognitive impairment [Sorg et al., 2007], and Alzheimer's disease [Greicius et al., 2004; Jones et al., 2011]. It has been suggested that such age‐related changes in FC are a product of changes in structural connectivity (SC) [Andrews‐Hanna et al., 2007]. SC quantifies the strength of long‐range interaction on the basis of diffusion imaging. Indeed, reductions in tract strength have been documented during aging [O'Sullivan et al., 2001], and are related to poorer performance across a range of motor and cognitive tasks in old age [Wen et al., 2011].
SC–FC correspondence has previously been investigated at a regionwise and whole‐brain network level. At a regionwise level, SC between individual regions is highly, but not perfectly, correlated with rsFC between corresponding regions [Hermundstad et al., 2013; Honey et al., 2007, 2009; Koch et al., 2002; Skudlarski et al., 2008; van den Heuvel et al., 2009]. At a network level, SC is also known to support the functional network organization: The modular nature of functional networks emerges from the underlying SC [Grayson et al., 2014; Shen et al., 2012; van den Heuvel and Sporns, 2013a), and SC underlies a number of functional network graph properties [Betzel et al., 2014; Honey et al., 2007; Misic et al., 2015; Ponce‐Alvarez et al., 2015].
The relationship between regionwise SC and FC has been shown to persist in old age [Davis et al., 2012; Ford and Kensinger, 2014; Romero‐Garcia et al., 2014] and is also present in older adults with mild cognitive impairments [Teipel et al., 2009]. However, the structure–function relations on a whole‐brain network level, that is, the network properties as described by graph theoretical measures remain largely uninvestigated in aging. Maturational research suggests different effects of age on structure and function [Supekar et al., 2010].
A new body of research has suggested that the regionwise structure–function relationship may actually change with age. For instance, it has been shown that regionwise structure–function coupling increases during development [Hagmann et al., 2010; Supekar et al., 2010; van den Heuvel et al., 2014]. SC–FC correspondence may change in some regions depending on interactions between age and emotional valence [Ford and Kensinger, 2014]. Moreover, under task conditions, regionwise SC–FC coupling may be stronger among older adults, suggesting that a healthy structural architecture prevents decline in cognitive function by maintaining communication between regions [Davis et al., 2012]. FC changes more with age at polysynaptic structural pathways than where SC is direct, that is, monosynaptic [Betzel et al., 2014]. Decoupling in disease, such as schizophrenia [Cocchi et al., 2014; Skudlarski et al., 2010] and epilepsy [Zhang et al., 2011], has also been shown. The potential predictive value of SC–FC coupling was suggested in one study of epilepsy patients, where this measure was more closely related to long‐term symptom duration than changes in the structural or functional network alone [Zhang et al., 2011].
Network‐level structure–function relations in aging are largely unknown. Although structural [Wu et al., 2013] and functional [Meunier et al., 2009] topology has been shown to vary with age, little is known about how SC supports the functional organization in aging. One study compares the structural and functional topology in development, showing age‐related changes in rich‐club organization only in the functional, but not the structural network [Grayson et al., 2014]. In aging, decreasing SC parallels the functional reorganization [Betzel et al., 2014]; however, whether these two measures were directly related was not investigated.
In aging, regionwise and network structural and functional changes have been asserted; however, our understanding of structure–function relationship dynamics in the latter part of the lifespan is still incomplete. Previous studies have emphasized the potential value of a SC–FC coupling measure; however, its merit in aging research has not been investigated. Network‐level SC–FC relations remain unknown. The objective of this study is to provide a detailed characterization of regionwise and network‐level SC–FC relations from young adulthood to old age by comparing dwMRI‐derived SC between individual regions with rsFC of those connections across participants ranging from 18 to 80 years of age. Specifically, we test these hypotheses: (1) Regionwise SC–FC coupling uniquely predicts age with higher reliability than SC or FC do individually. (2) SC upholds network‐level functional modular organization in changing ways across age. First clusters in individuals’ functional networks are tightly linked to their underlying structure. Second, due to the nature of their architecture, i.e., high embeddedness, hub regions play an important role in altered network‐level SC–FC relations during aging.
MATERIALS AND METHODS
Sample
Forty‐seven healthy subjects between the ages of 18 and 80 (mean age ± SD, 41.49 ± 18.36; 19 male/28 female) were recruited as volunteers (see Supporting Information, Fig. S1 for age distribution). Subjects with a self‐reported history of neurological, cognitive, or psychiatric conditions were excluded from the experiment. Research was performed in compliance with the Code of Ethics of the World Medical Association (Declaration of Helsinki). Written informed consent was provided by all subjects with an understanding of the study prior to data collection, and was approved by the local ethics committee in accordance with the institutional guidelines at Charité Hospital, Berlin. Acquisition procedures for this data were previously reported [Ritter et al., 2013]. They are briefly described below.
Magnetic Resonance Acquisition Procedure
Functional (functional magnetic resonance imaging, fMRI) and structural image acquisition was performed on a 3 T Siemens Tim Trio Scanner MR equipped with a 12‐channel Siemens head coil. After anatomical and dwMRI measurements, subjects were removed from the scanner and again put in later for the functional measurements. It is also important to note that subjects had an EEG cap on their heads during functional measurements, i.e., EEG‐fMRI. Data were obtained from subjects at resting state; subjects were asked to close their eyes, relax, and avoid falling asleep. High‐resolution (1 × 1 × 1 mm) T1‐weighted anatomical images were acquired with an MPRAGE sequence (1900 ms repetition time (TR), 2.25 ms echo time (TE), 9° flip angle, 256 mm field of view (FoV), 256 matrix, 192 sagittal slices, 1 mm slice thickness). Functional image acquisition was performed in a single run with an echo‐planar T2*‐weighted imaging sequence for a duration of 22 min. Each of the 661 volumes acquired consisted of 32 transversal (3 mm thick) slices (1940 ms TR, 30 ms TE, 78° flip angle, 192 mm FoV, 64 matrix, 3 × 3 × 3 mm voxel size). The run was preceded by five dummy scans, which we discarded to allow for stabilization of the blood oxygen‐level dependent (BOLD) signal. Diffusion‐weighted image acquisition was performed using echoplanar imaging with 61 transversal (2 mm thick) slices (7500 ms TR, 86 ms TE, 220 mm FoV, 96 matrix, 2.3 × 2.3 × 2.3 mm voxel size). We used 64 diffusion gradient directions with b‐values of 1000 s/mm2.
dwMRI Data Preprocessing and Tractography
Anatomical and diffusion images were preprocessed using a fully automated open‐source pipeline for extraction of functional and structural connectomes [Schirner et al., 2015]. The pipeline performed the following steps. Using the FreeSurfer software toolbox (http://surfer.nmr.mgh.harvard.edu/), anatomical T1‐weighted images were motion corrected and intensity normalized, nonbrain tissue was removed, and a brain mask was generated. White matter and subcortical segmentation was performed, and a cortical parcellation based on the probabilistic Desikan–Killiany Freesurfer atlas divided the gray matter into 68 ROIs (regions of interest, 34 per hemisphere) [Desikan et al., 2006]. Refer to Supporting Information, Table SI (in Supplementary Material) for a list of cortical regions and abbreviations.
The diffusion data were corrected for head movement and eddy current distortions, and the b0 image linearly registered to the subject's anatomical T1‐weighted image using the FSL toolbox. Each subject's high‐resolution anatomical mask volumes (with cortical parcellations) was transferred to the subject's diffusion space, in which fiber tracking was performed. Probabilistic fiber tracking based on constrained spherical deconvolution was performed using MRTrix streamtrack algorithm, which is a method that can identify crossing fibers [Tournier et al., 2012]. A 0.1 FA threshold was used in MRTrix. The maximum length constraint for fiber tracking was 300 mm and the maximum radius of curvature was 1 mm.
The interface between gray matter and white matter was exhaustively sampled by generating up to 200,000 streamlines per 1mm voxel. If no track was found, we set the weight to 0. If the algorithm reaches a count of 200 valid tracks it will stop before 200,000 tracks are generated. If a connection was found (regardless of the strength), we considered it a “one” connection strength. (See Discussion for a differentiation between the identification of a pathway and the estimation of connection strength.) For each subject, we aggregated these binary connections for each pair of regions, and derived a 68 × 68 ROI SC matrix representing the distinct connections found by the tracking. In other words, the SC weights are the number of voxels between a pair of ROIs with at least one track found between them.
We eliminate tracking biases by weighting SC according to surface area to avoid age‐related differences in ROI size. Note that connection pairs where no SC was observed were taken as 0. Note that individual SCs were not corrected compared to group SCs; studies that conduct analyses on average SC matrices [Honey et al., 2009] often set connections in an average SC to 0 when a certain number of subjects have absent connections in that place; however, all of our analysis were conducted on unchanged individual matrices. We corrected for SC distances by regressing mean tract length (of fibers connecting each pair of regions) from individual SC weights matrices, and using the residuals for analysis. Because tract lengths may have an effect on structure–function relations in aging [Romero‐Garcia et al., 2014], we speculated that this might influence some of our age‐related findings. However, because our results were robust when SC tract lengths were corrected for, the reported analyses were performed on the original SC weights matrices. Moreover, results were also robust when SCs were logarithmized, or resampled to a Gaussian distribution. Thus original SC values were used throughout.
Quality control performed on SC matrices is described in Schirner et al. [2015]. Briefly, we demonstrated almost perfect test–retest intrasubject reliability of the resulting SC matrices from 3 dwMRI acquisitions per subject. Intrasubject similarity (r = 0.97–0.99) was greater than intersubject similarity, and highest compared to previous approaches. Because test–retest reliability across multiple dwMRI scans was so high, the connectome analyses were conducted on a single dwMRI scan per subject.
fMRI Data Preprocessing
The fMRI resting‐state preprocessing was performed using the FEAT (fMRI Expert Analysis Tool) Version 6.0 first‐level analysis software tool from the FMRIB (Functional MRI of the Brain) Software Library (http://www.fmrib.ox.ac.uk). We used MCFLIRT motion correction to adjust for head movement [Jenkinson et al., 2002]. Nuisance variables were regressed from the BOLD signal, including the six motion parameters, mean white matter, and CSF signals. Regression of global mean was not performed. BET brain extraction was used to remove nonbrain tissue [Smith, 2002], correction for motion outliers using interpolation (FD cutoff = 0.5mm), and high‐pass filtering (cutoff at 100 s) was performed to adjust for baseline drift of the signal. Subjects' functional data were registered to their individual high‐resolution anatomical T1‐weighted images using FSL flirt (http://fsl.fmrib.ox.ac.uk/fsl/fslwiki/FLIRT ). Thus, the anatomical high‐resolution parcellation is mapped onto the functional data. Slice‐timing difference correction, smoothing, and normalization of BOLD intensities were not performed [Wu et al., 2011].
Temporal signal‐to‐noise ratio (tSNR) maps were derived for the functional data to ensure consistent quality of the BOLD signal across ROIs and subjects. TSNR is considered a reliable technique for investigating noise in resting‐state fMRI data [Welvaert and Rosseel, 2013]. We calculated tSNR by dividing the mean signal of the fMRI time series of a voxel by the standard deviation [Chen and Yao, 2004; Nan and Nowak, 1999]. In addition, visual inspection of individual participants’ T1 was performed to ensure alignment to the subject's ROI template.
Computation of Matrices for Analysis
Functional images were registered to anatomical images, and the parcellation defined for the anatomical images was applied to functional images. For each subject, a weighted average of the time series of all voxels in a given ROI was calculated to avoid partial volume biases and adjust for variations in ROI size. Voxels were weighted based on the probability that they were located within the ROI, so that voxels in the center of a region were given more weight than those along the boundary [Shen et al., 2012]. For each subject, a 68 × 68 FC matrix was derived by computing Pearson's correlations between the time series of each pair of ROIs.
Using each subject's SC matrix, we computed the average connection strength for each region, so that a subject's 68 × 68 SC matrix is reduced to a 1 × 68 vector by computing column‐wise average values. The resulting vectors are stacked into a matrix with the dimensions n × m (n = 47 being the number of subjects and m = 68 being the number of regions); rows were sorted according to age. The same procedure was performed for FC matrices; however, here we first conducted a Fisher's r to z transform before taking the regionwise mean. We also computed an SC–FC correlation matrix for all subjects; we did this by correlating a region's SC vector with its FC vector for each subject (Spearman's correlation), and stacking resulting vectors into a matrix, again of dimensions n × m, and sorting rows according to subject's age. Thus SC, FC and SC–FC matrices were each of dimensions n × m (n = 47 subjects and m = 68 regions). SC, FC and SC–FC matrices were then stacked above one another to produce a matrix (3n = 3 × 47, m = 68) for input to partial least squares (PLS) statistical analysis. PLS then treats each type of connectivity (i.e., SC, FC, and SC–FC) as a condition [Krishnan et al., 2011]. Note that these SC and FC connectivities are essentially weighted degree, and those of the SC–FC coupling are regionwise correlations of these weighted degrees. This is a distinction from previous work that uses individual connections weights (see Discussion for more detail).
Statistical Analysis
We used behavior PLS correlations [Krishnan et al., 2011] to investigate how SC, FC, and SC–FC coupling is related to age of the individuals as a continuous variable. PLS is a multivariate analysis method very similar to Canonical Correlation Analysis (CCA), in that it computes latent variables (LV) that identify the maximum least‐squares relation between two datasets.
We use a behavior PLS to decompose the correlation between brain connectivity (SC, FC, and SC–FC) and behavior (age) into sets of orthogonal LVs, each of which captures an aspect of that relation. LVs are assessed for significance using permutation tests on the full multivariate pattern, complemented by bootstrap resampling to assess the reliability of each connectivity estimate to the LV. Bootstrap estimation provides a standard error, is used to calculate a ratio of the individual ROI's weight over its estimated standard error, and can be treated as a confidence interval [McIntosh and Lobaugh, 2004]. A region with a high, positive bootstrap ratio means that the region contributes positively and reliably to the age–connectivity relationship identified by the latent variable correlation. Conversely, a region with a high negative bootstrap ratio means that the region contributes negatively and reliably to the age–connectivity relationship identified by the latent variable correlation. Resampling statistics (permutation and bootstrap) do not require the assumption of normality of the data (i.e., of age and connectivity) as with traditional parametric statistics. Bootstrapping also guards against the influence of outliers in the dataset with the emphasis on reliability rather than null hypothesis testing.
To further investigate structural and functional network organization, we used the Brain Connectivity Toolbox (https://sites.google.com/site/bctnet/) and the Network Community Toolbox (http://commdetect.weebly.com). For each subject, we identified the modular partitioning of the functional matrix. A network's modularity strength (Q) is determined by comparing the observed within‐module connection density to the expected within‐module connection density [Newman and Girvan, 2004; Sporns and Betzel, 2015]. We used a Louvain optimization algorithm, a fast greedy algorithm that may recover planted modules (“modularity_louvian_und_sign” Brain Connectivity Toolbox function) [Blondel et al., 2008; Lancichinetti and Fortunato, 2009; Rubinov and Sporns, 2011]. Similar to other modularity maximization algorithms, the Louvain function maximizes the modularity quality function, Q (i.e., observed within‐module connection density is maximal compared to the expected within‐module density), by iteratively searching the network for all possible partitions. The partitioning of the matrix allows us to identify the regions belonging to particular modules. High Q scores are associated with highly modular networks (with segregated modules and fewer intermodular connections), whereas low Q scores represent networks that are less segregated [Sporns and Betzel, 2015]. Because the Louvain algorithm is not deterministic, and the maximum modularity partitions may be misrepresentative (i.e., the optimal partition may be hidden among a great number of very different, but also highly modular, partitioning options) [Good et al., 2010], the modularity algorithm was run 100 times. The partitions were fairly consistent across the 100 algorithm runs. An optimal representative partition was determined with an iterative consensus clustering algorithm (consensus_iterative from the Network Community Toolbox), [Bassett et al., 2013], based on similarities in the 100 near‐optimal community partitions generated using the BCT. The qpc, quality of consensus was 0, suggesting a robust representative partition. The network partitioning was validated with known partitioning.
Moreover, 1000 weighted functional null models with preserved weight and degree distributions, and approximated strength distributions, were generated for comparison for each subject (“null_model_und_sign” Brain Connectivity Toolbox function). In addition, we also used a second type of null model, generated using the Hirschberger–Qi–Steuer (H–Q–S) algorithm to check that our observed networks are significantly modular compared to null networks that preserve the network's transitive structure [Hirschberger et al., 2004; Zalesky et al., 2012]. We transformed our correlation matrices to covariance matrices (input to H–Q–S) by normalizing with regard to the standard deviations. The H–Q–S generated null correlation networks are considered realistic in that they have similar distributional properties (connection density and threshold) to the observed matrix.
We examined the SC among regions within functionally defined modules according to the methodology introduced by Shen et al. [2012]. For each subject, the entire anatomical network was partitioned into modules corresponding to those functional modules defined previously using the Brain Connectivity Toolbox. To quantify how the anatomical connectivity supports the functional modular organization, we first calculated the density of each region. Density is the number of anatomical connections that a region has relative to the number of all possible anatomical connections. We then obtained a within‐module density index (WMDI) for each region, which is defined as the difference between the density of the region within its functionally defined module and density across the entire structural network. Thus, a region with a positive WMDI has stronger structural connections within its functionally defined module than it does throughout the network, whereby a negative WMDI suggests stronger structural connections across functional modules. We also generated 1000 structural null models with preserved weight (the density of links connected to the node) and degree (number of links connected to the node) distributions, and approximated strength (sum of weights of links connected to the node) distributions for comparison for each subject (“null_model_und_sign” Brain Connectivity Toolbox function). We also examined WMDI on SCs corrected for distance, as modularity measures may be particularly sensitive to tract length; in particular, we wanted to rule out the possibility that the higher density within functional modules (WMDI) is not driven by the greater number of short‐distance connections being captured by tractography methods. We corrected for distance in two ways: (1) by calculating WMDI on residuals of distance regressed SCs and (2) by imposing functional modules on SC matrices thresholded for distances above 30 mm; WMDIs were found to be significant compared to randomized thresholded SCs. As both methods of correcting for distances showed that WMDI remained significantly higher than chance, the reported analyses were performed on the original SC weights matrices.
Note that the WMDI is not comparable to Q. Q is one measure for the whole network, and describes either the structural network modularity or the functional network modularity. WMDI is one measure for each region, and describes how the functional network modularity is related to the underlying structural connection density. In other words, for each region, we define to which functional module the region belongs, and examine whether SC from that region is denser to other regions within that functional module (i.e., structure supports functional modularity), or if it is denser going to other regions outside of that functional module. In other words, while Q describes a network depending on whether its within‐module density of connections are greater or lesser than the expected within‐module density of connections [Sporns and Betzel, 2015], WMDI examines the observed density of structural connections within functional modules. High WMDI means there are very dense structural connections within functional modules.
WMDIs were compared using a PLS behavior correlation across ages to investigate whether structural architecture defines functional modularity to the same extent across the age range. We examined whether the structural core increasingly supports the functional modular organization with age in regions that are hubs. We used a measure of hubness introduced by Guimera and Nunes Amaral [2005], whereby hubs are first identified as those with a high within‐module degree z score, and their intermodular “hubness” is then quantified with the participation coefficient. We identified hubs as those regions with a within‐module degree z score (“module_degree_zscore” Brain Connectivity Toolbox function) >2.5 [Guimera and Nunes Amaral, 2005], and then correlated their participation coefficients (“participation coef” Brain Connectivity Toolbox function) with the regionwise weights that describe how WMDIs change with age.
The within‐module degree z score is a measure of how connected the region is to other regions within its module (intramodular connectivity), and regions with large module degree z scores (i.e., >2.5) are considered hubs. The participation coefficient is a measure of the degree to which a region is anatomically connected outside of its structural module (intermodular connectivity). A participation coefficient approaching 1 indicates that a region is very interconnected across modules and would be considered a connector hub, while a participation coefficient of 0 indicates that a region is connected exclusively within its own module.
The regionwise weights that describe how WMDIs change with age are the PLS output of the previous analysis: a region with a positive weight means that WMDIs increase with age in that region (thus the SC from that region strengthens within its functional module as opposed to across the rest of the network with age). A region with a negative weight means that WMDIs decrease with age in that region (thus SC from that region weakens within its functional module as opposed to the rest of the network with age).
Thus, a high correspondence between weights representing how WMDIs change with age, and the hub measures (within‐module degree z score and structural participation coefficient) would suggest that regions where the SC strengthens within functional modules throughout aging are regions that are also highly structurally interconnected (high within‐module degree z score and structural participation coefficient). In other words, the structural architecture increasingly supports functional modular organization throughout aging in connector hubs.
RESULTS
FC between the 68 (34 per hemisphere; Supporting Information, Table SI) regional BOLD time series ranged between −0.65 and 0.98 across all individual subjects (95% of these correlations were positive). Figure 1(A,B) depicts the SC and FC matrices, respectively, for a single exemplary subject. FC was slightly skewed (Kolmogorov–Smirnov: p = 0.05), while structural data was slightly weighted toward the 0s in the matrix. PLS uses resampling methods, so this was not a problem in our analysis.
Figure 1.
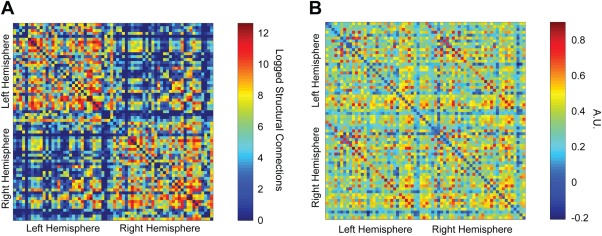
Connectivity matrices with 68 ROIs, a single exemplary subject. (A) Structural connectivity matrix of logged connection strength. Refer to “Materials and Methods” and “Results” for details. (B) Resting‐state BOLD fMRI FC matrix. Region labels corresponding to the order of regions in the matrices above can be found in Supporting Information, Table SI. [Color figure can be viewed in the online issue, which is available at http://wileyonlinelibrary.com.]
First, we were interested in verifying that there indeed was a relationship between SC and FC. Examining all connections (whole‐matrix agreement), we found that FC varied with the strength of SC where SC was present (Spearman correlation, r = 0.19–0.36 for individual subjects (mean correlation ± SD, 0.27 ± 0.04), p < 0.001 for all subjects). Moreover, although mean FC was significantly stronger where SC was present (M = 0.48 on averaged participant) than not (Kruskall–Wallis test, p < 0.001 for all subjects), FC existed even in the absence of direct SC (M = 0.25 on averaged participant). We also examined regionwise SC–FC correlations, as this was the focus of our aging analyses. These ranged from r = −0.40 to 0.66 (mean correlation ± SD, 0.27 ± 0.13) across all regions and subjects.
Regionwise Structure–Function Relations in Aging
The focus of our regionwise structure–function aging analysis was to determine whether SC–FC coupling predicts age above and beyond structure or function alone. We first show a univariate summary of our results (Fig. 2), whereby almost all regions show decreasing SC and FC with age, and SC–FC coupling is more variable across the cortex.
Figure 2.
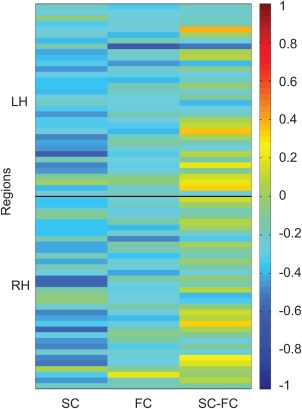
Univariate summary of regionwise connectivity with aging. The first, second, and third columns demonstrate regionwise SC correlations with age, FC with age, and SC–FC with age, respectively. The 68 Desikan Killiany regions along the y‐axis are in the order described in Supporting Information, Table SI: 34 left hemisphere regions first, and 34 right hemisphere regions second. SC (column 1) and FC (column 2) decrease with age, whereas SC–FC coupling (column 3) changes in variable ways during aging, depending on region. This correlation matrix is then analyzed in PLS to obtain the two patterns described in Figures 3 and 4 that characterize the relationship between brain connectivity and age. [Color figure can be viewed in the online issue, which is available at http://wileyonlinelibrary.com.]
We then conducted a behavior PLS analysis, which adds information to these univariate summaries by providing a multivariate assessment of the correlations with age. Using a behavior PLS analysis, we determined two significant latent variables. These latent variables extract the patterns of greatest covariance of age with SC, FC, and SC–FC.
Latent Variable 1 (Fig. 3; p = 0.03) revealed that SC, FC, and SC–FC coupling were all reliably predictive of age. It revealed a set of brain regions where increasing age was associated with decreases in connectivity (Fig. 3A,B). This correlation was strongest (r = −0.53) for SC but still reliable for FC (r = −0.29) and SC–FC coupling (r = −0.22) (Fig. 3C,D). Confidence intervals in Figure 3C demarcate the reliability of these correlations.
Figure 3.
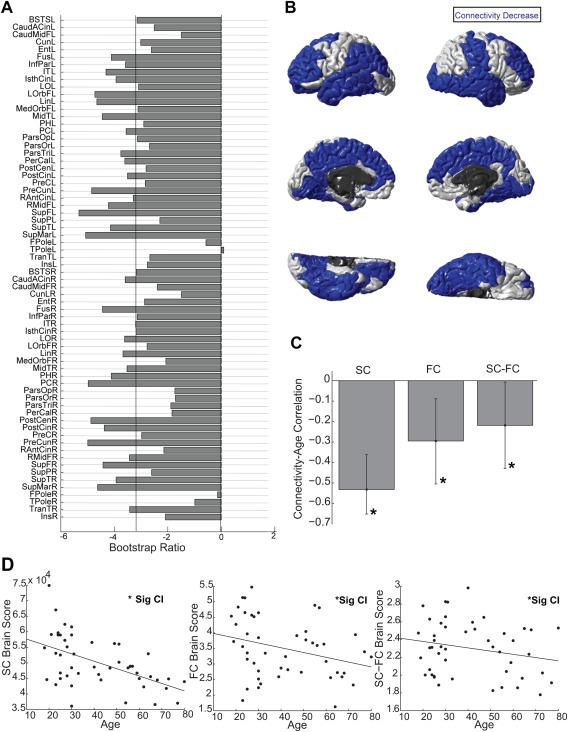
Regionwise weights for Latent Variable 1; this latent variable represents regions where SC, FC, and SC–FC coupling together predict age. Notably, all three decrease with increasing age in the majority of regions. (A) PLS bootstrap ratios are shown. Left‐hemisphere regions are shown first (top half), and right‐hemisphere regions are in the bottom half of the figure. Regions below the threshold (−3.2) have reliable age‐related reductions in SC, FC, and SC–FC coupling. (B) Regions with reliable age‐related reductions in SC, FC, and SC–FC coupling are shown in blue. (C) Bar graph showing the correlation between SC and age, FC and age, and SC–FC coupling and age on Latent Variable 1, confidence intervals on each of these correlations are shown. There is a reliable relationship between each of these and age. (D) Scatterplots visualizing the correlations between SC brain scores and age, FC brain scores and age, and SC–FC brain scores and age on Latent Variable 1. These scatterplots show the same correlations and information as in C. [Color figure can be viewed in the online issue, which is available at http://wileyonlinelibrary.com.]
Latent Variable 2 (Fig. 4) was particularly interesting; it revealed that there is a pattern of SC–FC coupling that uniquely predicts age (p < 0.01). Here, SC–FC coupling was the only measure that reliably predicted age (r = 0.73). The confidence intervals of the correlations in Figure 4C demonstrate this. See also Figure 4D for scatterplots of these correlations (SC with age, FC with age, and SC–FC with age). Note, however, that only SC–FC coupling is reliably predictive of age.
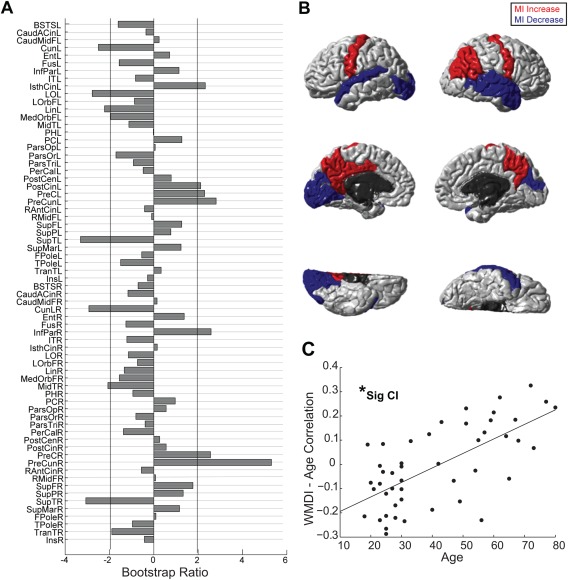
Figure 4.
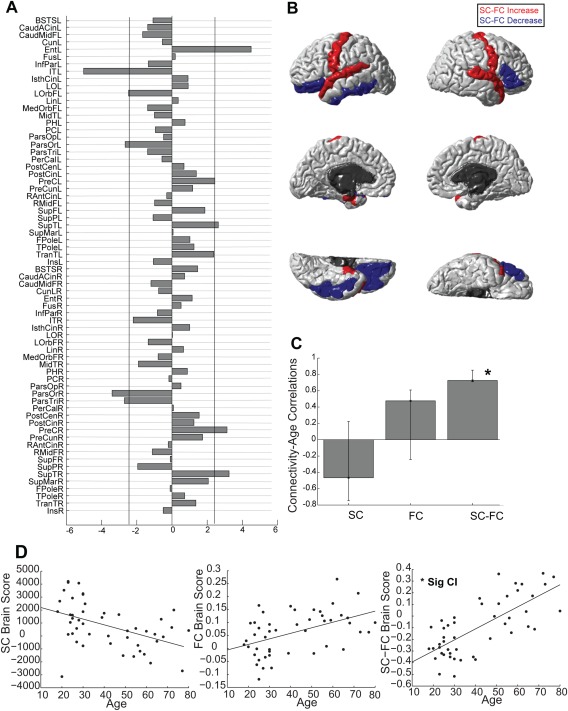
Regionwise weights for Latent Variable 2; this latent variable represents how SC–FC coupling uniquely predicts age. (A) PLS bootstrap ratios are shown. Left‐hemisphere regions are shown first (top half), right‐hemisphere regions are in the bottom half of the figure. Regions below the threshold (−2.39) show reliable age‐related reductions in SC–FC coupling. Regions above the threshold (2.39) show reliable age‐related increases in SC–FC coupling. (B) Regions with reliable age‐related reductions SC–FC coupling are shown in blue, increases are shown in red. (C) Bar graph showing the correlation between SC and age, FC and age, and SC–FC coupling and age on Latent Variable 2, confidence intervals on each of these correlations are shown. Notably, only the SC–FC coupling predicts age on Latent Variable 2, the confidence intervals for the age–SC and the age–FC correlation cross 0. (D) Scatterplots visualizing the correlations between SC brain scores and age, FC brain scores and age, and SC–FC brain scores and age on Latent Variable 2. These scatterplots show the same correlations and information as in C. Only SC–FC reliably predicted age on this Latent Variable. [Color figure can be viewed in the online issue, which is available at http://wileyonlinelibrary.com.]
In other words, Latent Variable 2 represents a set of regions whose combined SC–FC coupling predicts age. For this set of regions, SC does not predict age, and FC does not predict age. In some of these regions, such as the L and R precentral and the L and R superior temporal, where the bootstrap ratios (Fig. 4A,B) are positive, SC–FC coupling strengthens with age. In other regions, such as the L inferior temporal and the L and R pars orbitalis, where bootstrap ratios are negative (Fig. 4A,B), SC–FC coupling weakens with age.
We also conducted a separate SC with age, FC with age, and SC–FC with age analysis to understand how these change in isolation. These results were consistent with the previous research, and with the correlations with age found in Latent Variable 1. That is, SC and FC decreased in the majority of regions with age. SC–FC coupling was reliably correlated with age, and the direction of change was region‐dependent.
Whole‐Brain Structural Architecture Supports Region‐Specific Functional Modular Organization in Aging
The goal of our network structure–function analysis was to investigate how SC supports functional modular organization in age. First, we showed that SC is stronger within functional modules in general (notwithstanding of age). To this end, we partitioned the anatomical network according to the functionally defined modular structure and examined whether there are more anatomical tracts within functional modules than across functional modules. Functional modularity was significant compared to 1000 null models for each participant (p < 0.01 for all participants; Q = 0.71 vs 0.56 ± 0.04 for the averaged participant), based on the BCT null_model_und_sign (note that strength distribution of null networks approximated the strength distribution of the real networks: mean r = 0.99), and also on the H‐Q‐S null model (p < 0.01 for all participants).
We examined WMDIs of each node to quantify how structurally connected a region is within its functionally defined module as opposed to across the entire functional network (refer to methods). The WMDIs were significantly >0 (t‐tests, p < 0.05 for 39 of 47 subjects), indicating that regions were more densely structurally connected within their functionally defined module than across the rest of the network. WMDIs were significantly greater than WMDIs of 1000 structural null models per participant (t‐tests, 70% of WMDIs were significant compared to 1000 null models for each participant, p < 0.05). Four to five functional modules were found across subjects, irrespective of age. These modules were consistent with network partitioning in previous literature [Fair et al., 2009; He et al., 2009]. See Supporting Information, Figure S2 for a topographic brain map of the spatial distribution of the modules.
Having shown that SC significantly links to functional modular organization, we were interested in whether this varies with age. Indeed, a behavioral PLS analysis revealed that there is a significant and reliable correlation between age and the degree to which the structural architecture supports functional modular organization (defined by WMDI) (r = 0.67, p < 0.01, CI = [0.67, 0.83]). In a subset of regions (i.e., the precuneus and the posterior cingulate cortex), WMDIs increased with age. In other words, the strength of SC connections within functional modules as opposed to across functional modules increased with age. In other regions (lateral occipital cortex and the lingual gyrus), SC connection strength decreased within functional modules as opposed to across functional modules with age (Fig. 5). Note that WMDI is already normalized with respect to network density, thus age‐related changes in density did not affect our results.
Figure 5.
Regionwise within module density index (WMDI) changes with age. (A) PLS bootstrap ratios are shown. Regions below the threshold (−1.96) have decreasing WMDIs (decreasing SC density in functional modules) with age. Regions above the threshold (1.96) have increasing WMDIs (increasing SC density in functional modules) with age. (B) Age‐related WMDI increases are shown in red, whereas decreases in blue. Only regions with bootstrap ratios above the 1.96 threshold (and below −1.96) are colored. (C) Scatterplots visualizing the latent variable correlation between WMDI brain scores and age, significance of correlation is assessed with confidence intervals. [Color figure can be viewed in the online issue, which is available at http://wileyonlinelibrary.com.]
Having found that the SC strength within functional modules changes with age, we tested the hypothesis that this is the case particularly in hub regions. Hubs were identified as regions with a within‐module degree z score > 2.5, and a high regional participation coefficient. Interestingly, we did find that the anatomical framework increasingly underpins the functional modular segregation with age in these hub regions (see Methods, r = 0.27, p < 0.001). That is, we found that regions that have a high within‐module degree z score (a region highly connected within its own module), and a high participation coefficient (a region highly connected across all modules) also had a reliable WMDI increase with age (reliable increase in how SC upholds functional modularity). These regions included for instance Default Mode Network hubs such as the L posterior cingulate and precuneus [van den Heuvel and Sporns, 2013b). In other words, in highly interconnected regions, older participants have a stronger structural basis to their functional community structure than younger individuals do, suggesting that hubs play a special role in upholding the network organization as we age. To investigate whether this age effect is driven by age‐related changes in partitioning or changes in the configuration of connections within age‐consistent partitioning, we conduct a follow‐up analysis using a group‐average partitioning (community affiliation vector based on an SC averaged across subjects) on our individual SCs. Our results hold: We observe that the anatomical framework increasingly underpins the functional modular segregation with age in these hub regions. This suggests that this effect is driven by age‐related changes in the configuration of connections rather than a change in the partitions themselves.
Discussion
In this study, we investigated structure–function relations at a regionwise and network level. We found two sets of regions that have a connectivity pattern that predicts age. The first set (Latent Variable 1) confirms previous studies that have shown the predictive ability of SC [de Boer et al., 2011] and FC on age [Dosenbach et al., 2010]. More interestingly, the second set of regions (Latent Variable 2) has an SC–FC coupling that predicts age while SC and FC does not. The predictive ability of SC–FC coupling on age has only been shown in two developmental studies [Hagmann et al., 2010; van den Heuvel et al., 2014]; however, the unique predictive value of this metric (above and beyond SC and FC) during the entire adulthood age spectrum has not been investigated until now. At a network level, we found that SC links to the functional network in changing ways across age. With age, SC strengthens within as opposed to across functional modules the most in structural hub regions. Regionwise and network findings will be discussed separately below.
Regionwise Structure–Function Relations in Aging
We first verified that SC (inferred from dwMRI tractography) is related to rsFC using whole networks as well as regionwise vectors to verify the usefulness of an SC–FC metric. Indeed, we found that the presence of SC predicted stronger FC, with a moderate correspondence between whole network (all connections) as well as regionwise (individual region connectivity vectors) SC and FC. This SC–FC coupling was variable across the age range. SC–FC correlation values were consistent with that in previous research (r = 0.30–0.46, high‐resolution r = 0.36; low‐resolution r = 0.66, r = 0.33, respectively) [Hagmann et al., 2010; Honey et al., 2009; Khalsa et al., 2014]. Imperfect correlations can occur due to non‐neuronal noise [Shmueli et al., 2007], or rsFC can be present even without direct SC. More importantly, how FC emerges from SC is still not well understood. We did find that FC may occur between regions where there is no direct structural link. This is in line with research that suggests that FC may also be supported by indirect anatomical links [Honey et al., 2009; Koch et al., 2002; Skudlarski et al., 2008], or common afferent and efferent pathways [Adachi et al., 2012].
The main focus of our regionwise SC–FC analysis was to find whether this measure can predict age beyond SC and FC alone. We found two patterns that describe the association between SC, FC, SC–FC coupling, and age. The first revealed how SC, FC and SC–FC coupling together predict age, whereby we found that connectivity decreased across the majority of the cortex with increasing age. On this first latent variable, we found a moderate correlation (r = 0.53) between SC and age, a modest correlation (r = 0.29) between FC and age, and a modest correlation (r = 0.22) between SC–FC coupling and age—with the majority of regions contributing negatively to this relationship (so that SC, FC, and SC–FC coupling decreases in most regions with age). These findings are consistent with previous research, which reports age‐related SC [Pfefferbaum and Sullivan, 2003; Salat et al., 2005] and FC [Betzel et al., 2014; Onoda et al., 2012; Onoda and Yamaguchi, 2013] decreases within resting state networks of similar magnitude. Reductions in fractional anisotropy indicate white matter tract volume integrity decline [Chenevert et al., 1990]. Additional age‐related physical changes in the brain, such as changing tract lengths and brain volume may influence SC measurements across age. On the other hand, reductions in rsFC may reflect a decrease in synchronization of intrinsic networks with age [Madhyastha and Grabowski, 2014]. The age‐related FC decreases that we report may be a result of the changing anatomical architecture.
We verified that our findings were not related to age‐related changes in brain volume. We used FSL FAST for tissue segmentation to derive partial volume maps, and obtained total brain volume by summing the GM and WM tissue volumes. Total brain volume across subjects was then correlated with regionwise SC (r = 0.22, p = 0.14), FC (r = 0.17, p = 0.31), SC–FC (r = 0.11, p = 0.45), and WMDI (r = −0.02, p = 0.90); we found no effect.
Particular regions that contributed to the overall connectivity decrease in the first Latent Variable were of interest. For example, the Precuneus (L and R), a well‐known structural hub of the DMN also involved in higher order functions such as memory [Buckner et al., 2008], had one of the largest weights in describing connectivity decreases with age. The region of structural deterioration may indeed be related to the area of cognitive decline [Ziegler et al., 2010]. Other DMN hubs, such as the inferior parietal and posterior cingulate, also showed age‐related overall connectivity decreases on the first Latent Variable, consistent with the recent interest in DMN functional decline in the latter part of the lifespan [Andrews‐Hanna et al., 2007]. However, these regions do not show age‐related decline in SC–FC coupling on Latent Variable 2, suggesting the importance of considering SC and FC in addition to the coupling measure in aging research.
The second pattern that we found was particularly interesting; it revealed that there is an aspect of SC–FC coupling that is highly predictive for age. Expressed in the second latent variable, this pattern shows that SC–FC coupling uniquely predicts age (r = 0.73), while SC and FC do not. The regional reliability to this relationship varies: In some regions (L and R precentral, L and R superior temporal, L entorhinal), SC–FC coupling strengthens with age. In other regions (L inferior temporal, L and R parsorbitalis, R parstriangularis), SC–FC coupling weakens with age. These regions often did not reliably contribute to the overall connectivity decrease pattern expressed in Latent Variable 1. Similarly, Skudlarski et al. [2010] showed that decoupling of structure and function in disease was localized to particular networks, and these regions did not necessarily correspond regions for which SC and FC was affected.
There are a number of perspectives offered by the existing literature on the mechanistic explanations of SC–FC changes. For instance, it has previously been shown that SC–FC coupling is driven by structural topology (e.g., modularity) [Messe et al., 2014]. Indeed, structural network modularity strength changes with age in this study (r = 0.33, p < 0.05), pointing to a potential means of SC–FC coupling alterations. The causal mechanisms may be complex however, as SC–FC coupling changes with age are highly dependent on the region, and SC modularity is defined for the whole network. Note that we also examined age‐related structural modularity while correcting for SC total density, whereby we performed a partial correlation between age and Q structural modularity strength while controlling for total SC network density, and found that age and structural modularity remain significantly related (r = 0.25, p < 0.05). Age‐related structural modularity also remains significant correcting for total weight of the SC network. In another vein, Horn et al. [2014] speculates that more direct anatomical connections lead to higher functional activity, which in turn results in higher SC–FC correspondence. The directness of SC's does indeed affect SC–FC in older adults [Romero‐Garcia et al., 2014].
The predictive value of an SC–FC coupling measure has previously been suggested in studies of development [Hagmann et al., 2010; van den Heuvel et al., 2014], and disease [Zhang et al., 2011]. These studies defined SC–FC coupling as the correlation between individual subjects’ SC and FC matrices. Zhang et al. [2011] showed that with epilepsy patients, SC–FC coupling identified neural damage predictive of symptom duration better than structure or function alone. Hagmann et al. [2010] and van den Heuvel et al. [2014] found progressively stronger SC–FC coupling as children mature. Here, we emphasize the predictive value of a SC–FC coupling measure for age. Future studies will reveal if SC–FC coupling qualifies as a biomarker for aging related cognitive decline or other neuro‐psychiatric changes. SC–FC coupling has also been demonstrated to be an indicator of task performance in older (but not younger) adults [Davis et al., 2012], which supports its possible suitability as a biomarker for cognitive aging.
In this study, we used a novel regionwise approach to investigate connectivity changes. Previous studies investigating SC–FC relations have examined connectivity at a whole‐network level [Honey et al., 2009; Horn et al., 2014], correlating individual connection weights. Typically, this involves correlating all functional connections with all structural connections (i.e., whole matrix). We reduced connectivity to the nodal level by using a measure of average weighted degree (see Methods), and then used PLS to identify how connectivity within sets of regions is predictive of age. We were interested in how the number and weight of functional and structural connections for each region co‐vary together.
Aging effects are not uniform across the brain [Ferreira and Busatto, 2013; Salat et al., 2005], thus a regionwise analysis may elucidate novel patterns. We found variable relationships between age and SC–FC coupling in different regions. This regional variation is consistent with similar previous research with children, where significant changes in coupling were also reported only in some of the areas investigated [Skudlarski et al., 2010; Supekar et al., 2010]. Together, these findings and ours may indicate that structure and function each follow different, regionally specific, age‐related trajectories of change [Burzynska et al., 2010; Zuo et al., 2010]. The pattern of structural degeneration may not match the trajectory of functional decline for some regions, resulting in a variable age‐related correspondence between the two modalities.
Regional differences in structure–function correspondence with age may stem from a number of factors. For instance, regional [Devonshire et al., 2012] and age‐related [D'Esposito et al., 2003] differences in the hemodynamic response to neuronal activity may occur in parallel with variable structural changes. Age‐related changes in the cerebral vasculature suggest the possibility that the BOLD signal may be altered. Moreover, region‐specific FC changes may also stem from variable neurotransmitter receptor densities across the cortex [Zilles et al., 2004], or region‐specific gray matter volume declines with age [Terribilli et al., 2011]. In contrast, region‐specific SC changes may stem from variable age‐related demylenation, Wallerian degeneration, gliosis, and reduction of the number of fiber tracts [Burzynska et al., 2010].
Note that track counts that are commonly used in the literature [Hagmann et al., 2010; Honey et al., 2009] are biased because the shortest, simplest, and straightest pathways receive the highest track counts regardless of whether this actually reflects underlying anatomy and real tract strength [Jones, 2010]. The tractography pipeline we opted for [Schirner et al., 2015] counters this issue by differentiating between the (a) identification of a pathway and (b) the connection strength from tractogrophy. The SC metric used considers whether a pathway exists without making assumptions about the strength of connections. However, it is important to note that diffusion MRI has many limitations, and depends on a number of anatomical properties, such that for instance a high tractography count for a particular pathway does not mean that the tract is thick, nor even that it has a high probability of existence, but rather that it is likely to be discovered with the probabilistic algorithm [Jbabdi and Johansen‐Berg, 2011; Jones et al., 2013]. In addition to tract width, crossing fibers may affect tractography outcomes. The MRtrix streamtrack algorithm we use [Smith et al., 2012] can identify crossing fibers. Moreover, macaque studies demonstrate the lack of validity of diffusion measures by comparing against known axonal projections from tracer studies [Azadbakht et al., 2015; Thomas et al., 2014].
The relevance of SC–FC correspondence to cognitive or physical functioning in old age was not examined. However, in light of the cognitive implications of connectivity changes in both structural [Wen et al., 2011] and functional [Onoda and Yamaguchi, 2013] networks, as well as the unique predictive value of SC–FC coupling for age in this study, and for epilepsy duration in a patient population [Zhang et al., 2011], we propose the investigation of SC–FC coupling as a new predictive measure.
Network‐Level Structure–Function Relations in Aging
We examined how the structure (SC) relates to the segregation of the functional network into modules, and whether this relation changes with age. A number of papers have found important roles of SC in shaping FC [Deco et al., 2011; Goni et al., 2014; Hermundstad et al., 2013; Honey et al., 2009; Koch et al., 2002] and several functional network graph properties [Betzel et al., 2014; Honey et al., 2007; Misic et al., 2015; Ponce‐Alvarez et al., 2015]; however, to our knowledge, only van den Heuvel and Sporns [2013a] have investigated specifically how SC underlies the community partitioning of the functional network. Age‐related changes in how SC underlies the segregation of the functional network into modules are a novel contribution of this study.
The current analyses were performed on individual subjects’ structural and functional matrices to account for individual and age‐related differences in network partitioning, as functional modularity has been shown to vary across the age range [Geerligs et al., 2015; Meunier et al., 2009; Onoda and Yamaguchi, 2013]. We found denser structural connections within individuals’ functional modules than across the individuals’ entire functional network, suggesting that the segregation of information in the functional network is constrained by the underlying anatomical architecture. This finding is consistent with a parallel macaque study [Shen et al., 2012] that used similar methodology and WMDI measure, as well as recent human research demonstrating how the anatomical rich‐club core forms the substrate of functional network organization [Grayson et al., 2014; van den Heuvel and Sporns, 2013a).
Importantly, we observed an age‐related change in the strength of SC within functional modules. Depending on the region from which the SC originates, the structure may uphold its functional partition more strongly with age (WMDI increases with age), or become sparser within its functional partition (WMDI decreases with age). In the former case (WMDI increases with age), the structural connections from these regions were increasingly more prevalent within functional modules (rather than across modules) with progressive age. The current findings indicate that the SC from these regions becomes especially important (supportive) in upholding the functional partitioning in older age, and that these regions drive functional segregation. Examples of such regions are the left posterior cingulate and precuneus cortex. Conversely, in the latter case (WMDI decreases with age), structure becomes less supportive of the individual functional partitioning with age, which indicates that through their structure, these regions drive progressive network integration. Examples of such regions are the lateral occipital and the lingual gyrus.
Age‐related changes in functional network segregation and integration have previously been reported [Geerligs et al., 2015; Onoda and Yamaguchi, 2013]. In this study, we suggest that the evolving functional topology may be driven by the underlying SC. Work by Grayson et al. [2014] provides preliminary evidence that structural and functional rich‐club organization may change in different ways during maturation. By combining structure and functional network‐level organization in this study, rather than studying each in isolation, we gain a better understanding of these network relationships.
Special Role of Hub Regions
We were particularly interested in the special role that hub regions play in age‐varying structure–function relations. It has previously been shown that the hubness of a region is a strong predictor of structure–function coupling among older adults [Romero‐Garcia et al., 2014], and special aging effects on hub regions have been revealed in several studies [Betzel et al., 2014; Yang et al., 2014]. In this study, we found there was an age‐related increase in hub regions’ SC within their respective functional module (rather than across modules).
Structural hubs in this study were consistent with hubs previously identified [van den Heuvel and Sporns, 2013b). The greatest age‐related increase in SC within functional modules (as opposed to across modules) was observed in the right precuneus, with large increases also in the left precuneus. The precuneus is an important hub region in the Default Mode Network that has been found to undergo prominent age‐related changes in previous research [Yang et al., 2014]. Significant age‐related increases in structure–function correspondence in hub regions is consistent with the study by Andrews‐Hanna et al. [2007], where hub regions such as the posterior cingulate and medial prefrontal cortex show a strong structural basis to FC among a sample of older participants. This is also in line with Romero‐Garcia's [2014] findings that emphasize the importance of hubness to structure–function coupling in a sample of older subjects. These studies did not investigate network‐level functional organization however. In this study, the strengthening of structural hub connectivity within functional modules (as opposed to across modules) throughout aging that we found suggests that structural hubs are increasingly important determinants of the functional organization.
Our finding seems to suggest that structural hub regions act to support increased functional segregation in old age. By definition, structural hub regions have high connectivity to many modules across the network. Interestingly, we show that with increasing age, structural hub regions’ connectivity to regions within their own functional modules is increasingly greater than to regions outside their functional modules. Thus, in old age, structural hubs do not fulfill their potential to support a highly integrated cross‐modular functional network. Rather, in old age, these hubs become more important within their own functional module.
Betzel et al. [2014] makes a similar argument in their investigation of how communication efficiency relates to hubness in aging. They suggest that a region's “hubness” predicts whether communication efficiency is compromised in aging. Betzel et al.'s [2014] measure of communication efficiency represents the path efficiency between structural nodes. We use WMDI to examine this in terms of a region's SC communication within the functional network. Since hub region's intrafunctional‐module SC participation becomes greater with age, we conclude that a region's hubness predicts how interfunctional‐modular communication is compromised in aging.
FUTURE DIRECTIONS AND LIMITATIONS
Follow‐up studies will validate our results with different parcellation schemes. However, Honey et al. [2009], for example, has shown that SC–FC relationships hold while using two different, one fine and one coarse, parcellation schemes. We expect that although there would likely be changes in the magnitude of SC–FC relations [Honey et al., 2009] and graph measures [Wang et al., 2009] with finer parcellations (due to regional mapping across individuals, etc.), the proposed age‐dependency of regionwise and global SC–FC measures are of interest regardless of the parcellation. Indeed, age‐dependency of network measures has proved consistent across various parcellation schemes [Cao et al., 2014].
One weakness of our subject sample is a lack of detailed evaluation of cognitive status beyond self‐reports. While there is no way to be absolutely certain that all of our participants have normal cognitive function for their age, the self‐report is a reasonable coarse screen to at least deal with extreme cases. The resampling statistics done for our PLS analysis guards against any effects of outliers that would be expected if there was heterogeneity in our sample because of abnormal cognitive decline.
In summary, we have shown that age‐related alterations in structure–function coupling occur at a regionwise and network level (SC strength within functional modules). We conclude (1) that regionwise structure–function coupling can predict age better than structure or function alone; (2) that SC is stronger within functional modules (compared to the rest of the network); (3) that this changes with age; and (4) that SC from hub regions increases within functional modules (rather than across modules) with age. We demonstrate that a comprehensive account of the brain that captures subtle neurological changes during aging requires the integration of structure and function, and propose that the combination of the two modalities can be used as a new marker of altered brain function and cognition in the future.
Supporting information
Supporting Information
ACKNOWLEDGMENTS
PR acknowledges the Max Planck Society (Minerva Program). ARM acknowledges the support of the JS McDonnell Foundation Collaborative Research Program.
REFERENCES
- Adachi Y, Osada T, Sporns O, Watanabe T, Matsui T, Miyamoto K, Miyashita Y (2012): Functional connectivity between anatomically unconnected areas is shaped by collective network‐level effects in the macaque cortex. Cereb Cortex 22:1586–1592. [DOI] [PubMed] [Google Scholar]
- Andrews‐Hanna JR, Snyder AZ, Vincent JL, Lustig C, Head D, Raichle ME, Buckner RL (2007): Disruption of large‐scale brain systems in advanced aging. Neuron 56:924–935. [DOI] [PMC free article] [PubMed] [Google Scholar]
- Azadbakht H, Parkes LM, Haroon HA, Augath M, Logothetis NK, de Crespigny A, D'Arceuil HE, Parker GJ (2015): Validation of high‐resolution tractography against in vivo tracing in the macaque visual cortex. Cereb Cortex 25:4299–4309. [DOI] [PMC free article] [PubMed] [Google Scholar]
- Bassett DS, Porter MA, Wymbs NF, Grafton ST, Carlson JM, Mucha PJ (2013): Robust detection of dynamic community structure in networks. Chaos 23:013142. [DOI] [PMC free article] [PubMed] [Google Scholar]
- Betzel RF, Avena‐Koenigsberger A, Goni J, He Y, de Reus MA, Griffa A, Vertes PE, Misic B, Thiran JP, Hagmann P, van Den Heuvel M, X Zuo, ET Bullmore, O Sporns (2016): Generative models of the human connectome. Neuroimage 124:1054–1064. [DOI] [PMC free article] [PubMed] [Google Scholar]
- Betzel RF, Byrge L, He Y, Goni J, Zuo XN, Sporns O (2014): Changes in structural and functional connectivity among resting‐state networks across the human lifespan. Neuroimage 102:345–357. [DOI] [PubMed] [Google Scholar]
- Biswal B, Yetkin FZ, Haughton VM, Hyde JS (1995): Functional connectivity in the motor cortex of resting human brain using echo‐planar MRI. Magn Reson Med 34:537–541. [DOI] [PubMed] [Google Scholar]
- Blondel VD, Guillaume J, Lambiotte R, Lefebvre E (2008): Fast unfolding of communities in large networks. J Statist Mech Theory Exp 1–12. [Google Scholar]
- Buckner RL, Andrews‐Hanna JR, Schacter DL (2008): The brain's default network: anatomy, function, and relevance to disease. Ann N Y Acad Sci 1124:1–38. [DOI] [PubMed] [Google Scholar]
- Burzynska AZ, Preuschhof C, Backman L, Nyberg L, Li SC, Lindenberger U, Heekeren HR (2010): Age‐related differences in white matter microstructure: region‐specific patterns of diffusivity. Neuroimage 49:2104–2112. [DOI] [PubMed] [Google Scholar]
- Cao M, Wang JH, Dai ZJ, Cao XY, Jiang LL, Fan FM, Song XW, Xia MR, Shu N, Dong Q, MP Milham, FX Castellanos, XN Zuo, Y He (2014): Topological organization of the human brain functional connectome across the lifespan. Dev Cogn Neurosci 7:76–93. [DOI] [PMC free article] [PubMed] [Google Scholar]
- Chen H, Yao D (2004): Discussion on the choice of separated components in fMRI data analysis by spatial independent component analysis. Magn Reson Imaging 22:827–833. [DOI] [PubMed] [Google Scholar]
- Chenevert TL, Brunberg JA, Pipe JG (1990): Anisotropic diffusion in human white matter: demonstration with MR techniques in vivo. Radiology 177:401–405. [DOI] [PubMed] [Google Scholar]
- Cocchi L, Harding IH, Lord A, Pantelis C, Yucel M, Zalesky A (2014): Disruption of structure–function coupling in the schizophrenia connectome. Neuroimage Clin 4:779–787. [DOI] [PMC free article] [PubMed] [Google Scholar]
- D'Esposito M, Deouell LY, Gazzaley A (2003): Alterations in the BOLD fMRI signal with ageing and disease: a challenge for neuroimaging. Nat Rev Neurosci 4:863–872. [DOI] [PubMed] [Google Scholar]
- Damoiseaux JS, Beckmann CF, Arigita EJ, Barkhof F, Scheltens P, Stam CJ, Smith SM, Rombouts SA (2007): Reduced resting‐state brain activity in the “default network” in normal aging. Cereb Cortex 18:1856–1864. [DOI] [PubMed] [Google Scholar]
- Davis SW, Kragel JE, Madden DJ, Cabeza R (2012): The architecture of cross‐hemispheric communication in the aging brain: linking behavior to functional and structural connectivity. Cereb Cortex 22:232–242. [DOI] [PMC free article] [PubMed] [Google Scholar]
- de Boer R, Schaap M, van der Lijn F, Vrooman HA, de Groot M, van der Lugt A, Ikram MA, Vernooij MW, Breteler MM, Niessen WJ (2011): Statistical analysis of minimum cost path based structural brain connectivity. Neuroimage 55:557–565. [DOI] [PubMed] [Google Scholar]
- Deco G, Jirsa VK, McIntosh AR (2011): Emerging concepts for the dynamical organization of resting‐state activity in the brain. Nat Rev Neurosci 12:43–56. [DOI] [PubMed] [Google Scholar]
- Desikan RS, Segonne F, Fischl B, Quinn BT, Dickerson BC, Blacker D, Buckner RL, Dale AM, Maguire RP, Hyman BT, MS Albert, RJ Killiany (2006): An automated labeling system for subdividing the human cerebral cortex on MRI scans into gyral based regions of interest. Neuroimage 31:968–980. [DOI] [PubMed] [Google Scholar]
- Devonshire IM, Papadakis NG, Port M, Berwick J, Kennerley AJ, Mayhew JE, Overton PG (2012): Neurovascular coupling is brain region‐dependent. Neuroimage 59:1997–2006. [DOI] [PubMed] [Google Scholar]
- Dosenbach NU, Nardos B, Cohen AL, Fair DA, Power JD, Church JA, Nelson SM, Wig GS, Vogel AC, Lessov‐Schlaggar CN, KA Barnes, JW Dubis, E Feczko, RS Coalson, JR Pruett, DM Barch, SE Petersen, BL Schlaggar (2010): Prediction of individual brain maturity using fMRI. Science 329:1358–1361. [DOI] [PMC free article] [PubMed] [Google Scholar]
- Fair DA, Cohen AL, Power JD, Dosenbach NU, Church JA, Miezin FM, Schlaggar BL, Petersen SE (2009): Functional brain networks develop from a “local to distributed” organization. PLoS Comput Biol 5:e1000381. [DOI] [PMC free article] [PubMed] [Google Scholar]
- Ferreira LK, Busatto GF (2013): Resting‐state functional connectivity in normal brain aging. Neurosci Biobehav Rev 37:384–400. [DOI] [PubMed] [Google Scholar]
- Ford JH, Kensinger EA (2014): The relation between structural and functional connectivity depends on age and on task goals. Front Hum Neurosci 8:307. [DOI] [PMC free article] [PubMed] [Google Scholar]
- Geerligs L, Renken RJ, Saliasi E, Maurits NM, Lorist MM (2015): A brain‐wide study of age‐related changes in functional connectivity. Cereb Cortex 25:1987–1999. [DOI] [PubMed] [Google Scholar]
- Goni J, van den Heuvel MP, Avena‐Koenigsberger A, Velez de Mendizabal N, Betzel RF, Griffa A, Hagmann P, Corominas‐Murtra B, Thiran JP, Sporns O (2014): Resting‐brain functional connectivity predicted by analytic measures of network communication. Proc Natl Acad Sci USA 111:833–838. [DOI] [PMC free article] [PubMed] [Google Scholar]
- Good BH, de Montjoye YA, Clauset A (2010): Performance of modularity maximization in practical contexts. Phys Rev E Stat Nonlin Soft Matter Phys 81:046106. [DOI] [PubMed] [Google Scholar]
- Grayson DS, Ray S, Carpenter S, Iyer S, Dias TG, Stevens C, Nigg JT, Fair DA (2014): Structural and functional rich club organization of the brain in children and adults. PLoS One 9:e88297. [DOI] [PMC free article] [PubMed] [Google Scholar]
- Greicius MD, Srivastava G, Reiss AL, Menon V (2004): Default‐mode network activity distinguishes Alzheimer's disease from healthy aging: evidence from functional MRI. Proc Natl Acad Sci USA 101:4637–4642. [DOI] [PMC free article] [PubMed] [Google Scholar]
- Guimera R, Nunes Amaral LA (2005): Functional cartography of complex metabolic networks. Nature 433:895–900. [DOI] [PMC free article] [PubMed] [Google Scholar]
- Hagmann P, Sporns O, Madan N, Cammoun L, Pienaar R, Wedeen VJ, Meuli R, Thiran JP, Grant PE (2010): White matter maturation reshapes structural connectivity in the late developing human brain. Proc Natl Acad Sci USA 107:19067–19072. [DOI] [PMC free article] [PubMed] [Google Scholar]
- He Y, Wang J, Wang L, Chen ZJ, Yan C, Yang H, Tang H, Zhu C, Gong Q, Zang Y, AC Evans (2009): Uncovering intrinsic modular organization of spontaneous brain activity in humans. PLoS One 4:e5226. [DOI] [PMC free article] [PubMed] [Google Scholar]
- Henderson JA, Robinson PA (2014): Relations between the geometry of cortical gyrification and white‐matter network architecture. Brain Connect 4:112–130. [DOI] [PubMed] [Google Scholar]
- Hermundstad AM, Bassett DS, Brown KS, Aminoff EM, Clewett D, Freeman S, Frithsen A, Johnson A, Tipper CM, Miller MB, ST Grafton, JM Carlson (2013): Structural foundations of resting‐state and task‐based functional connectivity in the human brain. Proc Natl Acad Sci USA 110:6169–6174. [DOI] [PMC free article] [PubMed] [Google Scholar]
- Hirschberger M, Qi Y, Steuer RE (2004): Randomly generating portfolio‐selection covariance matrices with specified distributional characteristics. Eur J Oper Res 177:1610–1625. [Google Scholar]
- Honey CJ, Kotter R, Breakspear M, Sporns O (2007): Network structure of cerebral cortex shapes functional connectivity on multiple time scales. Proc Natl Acad Sci USA 104:10240–10245. [DOI] [PMC free article] [PubMed] [Google Scholar]
- Honey CJ, Sporns O, Cammoun L, Gigandet X, Thiran JP, Meuli R, Hagmann P (2009): Predicting human resting‐state functional connectivity from structural connectivity. Proc Natl Acad Sci USA 106:2035–2040. [DOI] [PMC free article] [PubMed] [Google Scholar]
- Horn A, Ostwald D, Reisert M, Blankenburg F (2014): The structural‐functional connectome and the default mode network of the human brain. Neuroimage 102:142–151. [DOI] [PubMed] [Google Scholar]
- Jbabdi S, Johansen‐Berg H (2011): Tractography: where do we go from here? Brain Connect 1:169–183. [DOI] [PMC free article] [PubMed] [Google Scholar]
- Jenkinson M, Bannister P, Brady M, Smith S (2002): Improved optimization for the robust and accurate linear registration and motion correction of brain images. Neuroimage 17:825–841. [DOI] [PubMed] [Google Scholar]
- Jones DK (2010): Challenges and limitations of quantifying brain connectivity in vivo with diffusion MRI. Imaging Med 2:341–355. [Google Scholar]
- Jones DK, Knosche TR, Turner R (2013): White matter integrity, fiber count, and other fallacies: the do's and don'ts of diffusion MRI. Neuroimage 73:239–254. [DOI] [PubMed] [Google Scholar]
- Jones DT, Machulda MM, Vemuri P, McDade EM, Zeng G, Senjem ML, Gunter JL, Przybelski SA, Avula RT, Knopman DS, BF Boeve, RC Petersen, CR Jack Jr. (2011): Age‐related changes in the default mode network are more advanced in Alzheimer disease. Neurology 77:1524–1531. [DOI] [PMC free article] [PubMed] [Google Scholar]
- Khalsa S, Mayhew SD, Chechlacz M, Bagary M, Bagshaw AP (2014): The structural and functional connectivity of the posterior cingulate cortex: comparison between deterministic and probabilistic tractography for the investigation of structure–function relationships. Neuroimage 102:118–127. [DOI] [PubMed] [Google Scholar]
- Koch MA, Norris DG, Hund‐Georgiadis M (2002): An investigation of functional and anatomical connectivity using magnetic resonance imaging. Neuroimage 16:241–250. [DOI] [PubMed] [Google Scholar]
- A Krishnan, LJ Williams, AR McIntosh, H Abdi (2011): Partial Least Squares (PLS) methods for neuroimaging: a tutorial and review. Neuroimage 56:455–475. [DOI] [PubMed] [Google Scholar]
- Lancichinetti A, Fortunato S (2009): Community detection algorithms: a comparative analysis. Phys Rev E Stat Nonlin Soft Matter Phys 80:056117. [DOI] [PubMed] [Google Scholar]
- Madhyastha TM, Grabowski TJ (2014): Age‐related differences in the dynamic architecture of intrinsic networks. Brain Connect 4:231–241. [DOI] [PMC free article] [PubMed] [Google Scholar]
- McIntosh AR, Lobaugh NJ (2004): Partial least squares analysis of neuroimaging data: applications and advances. Neuroimage 23:S250–S263. [DOI] [PubMed] [Google Scholar]
- Messe A, Rudrauf D, Benali H, Marrelec G (2014): Relating structure and function in the human brain: relative contributions of anatomy, stationary dynamics, and non‐stationarities. PLoS Comput Biol 10:e1003530. [DOI] [PMC free article] [PubMed] [Google Scholar]
- Meunier D, Achard S, Morcom A, Bullmore E (2009): Age‐related changes in modular organization of human brain functional networks. Neuroimage 44:715–723. [DOI] [PubMed] [Google Scholar]
- Misic B, Betzel RF, Nematzadeh A, Goni J, Griffa A, Hagmann P, Flammini A, Ahn YY, Sporns O (2015): Cooperative and competitive spreading dynamics on the human connectome. Neuron 86:1518–1529. [DOI] [PubMed] [Google Scholar]
- Nan FY, Nowak RD (1999): Generalized likelihood ratio detection for fMRI using complex data. IEEE Trans Med Imaging 18:320–329. [DOI] [PubMed] [Google Scholar]
- Newman ME, Girvan M (2004): Finding and evaluating community structure in networks. Phys Rev E Stat Nonlin Soft Matter Phys 69:026113. [DOI] [PubMed] [Google Scholar]
- O'Sullivan M, Jones DK, Summers PE, Morris RG, Williams SC, Markus HS (2001): Evidence for cortical “disconnection” as a mechanism of age‐related cognitive decline. Neurology 57:632–638. [DOI] [PubMed] [Google Scholar]
- Onoda K, Ishihara M, Yamaguchi S (2012): Decreased functional connectivity by aging is associated with cognitive decline. J Cogn Neurosci 24:2186–2198. [DOI] [PubMed] [Google Scholar]
- Onoda K, Yamaguchi S (2013): Small‐worldness and modularity of the resting‐state functional brain network decrease with aging. Neurosci Lett 556:104–108. [DOI] [PubMed] [Google Scholar]
- Pfefferbaum A, Sullivan EV (2003): Increased brain white matter diffusivity in normal adult aging: relationship to anisotropy and partial voluming. Magn Reson Med 49:953–961. [DOI] [PubMed] [Google Scholar]
- Ponce‐Alvarez A, Deco G, Hagmann P, Romani GL, Mantini D, Corbetta M (2015): Resting‐state temporal synchronization networks emerge from connectivity topology and heterogeneity. PLoS Comput Biol 11:e1004100. [DOI] [PMC free article] [PubMed] [Google Scholar]
- Raichle ME, Mintun MA (2006): Brain work and brain imaging. Annu Rev Neurosci 29:449–476. [DOI] [PubMed] [Google Scholar]
- Ritter P, Schirner M, McIntosh AR, Jirsa VK (2013): The virtual brain integrates computational modeling and multimodal neuroimaging. Brain Connect 3:121–145. [DOI] [PMC free article] [PubMed] [Google Scholar]
- Roberts JA, Perry A, Lord AR, Roberts G, Mitchell PB, Smith RE, Calamante F, Breakspear M (2016): The contribution of geometry to the human connectome. Neuroimage 124:379–393. [DOI] [PubMed] [Google Scholar]
- Romero‐Garcia R, Atienza M, Cantero JL (2014): Predictors of coupling between structural and functional cortical networks in normal aging. Hum Brain Mapp 35:2724–2740. [DOI] [PMC free article] [PubMed] [Google Scholar]
- Rubinov M, Sporns O (2011): Weight‐conserving characterization of complex functional brain networks. Neuroimage 56:2068–2079. [DOI] [PubMed] [Google Scholar]
- Salat DH, Tuch DS, Greve DN, van der Kouwe AJ, Hevelone ND, Zaleta AK, Rosen BR, Fischl B, Corkin S, Rosas HD, AM Dale (2005): Age‐related alterations in white matter microstructure measured by diffusion tensor imaging. Neurobiol Aging 26:1215–1227. [DOI] [PubMed] [Google Scholar]
- Schirner M, Rothmeier S, Jirsa VK, McIntosh AR, Ritter P (2015): An automated pipeline for constructing personalized virtual brains from multimodal neuroimaging data. Neuroimage 117:343–357. [DOI] [PubMed] [Google Scholar]
- Shen K, Bezgin G, Hutchison RM, Gati JS, Menon RS, Everling S, McIntosh AR (2012): Information processing architecture of functionally defined clusters in the macaque cortex. J Neurosci 32:17465–17476. [DOI] [PMC free article] [PubMed] [Google Scholar]
- Shmueli K, van Gelderen P, de Zwart JA, Horovitz SG, Fukunaga M, Jansma JM, Duyn JH (2007): Low‐frequency fluctuations in the cardiac rate as a source of variance in the resting‐state fMRI BOLD signal. Neuroimage 38:306–320. [DOI] [PMC free article] [PubMed] [Google Scholar]
- Skudlarski P, Jagannathan K, Anderson K, Stevens MC, Calhoun VD, Skudlarska BA, Pearlson G (2010): Brain connectivity is not only lower but different in schizophrenia: a combined anatomical and functional approach. Biol Psychiatry 68:61–69. [DOI] [PMC free article] [PubMed] [Google Scholar]
- Skudlarski P, Jagannathan K, Calhoun VD, Hampson M, Skudlarska BA, Pearlson G (2008): Measuring brain connectivity: diffusion tensor imaging validates resting state temporal correlations. Neuroimage 43:554–561. [DOI] [PMC free article] [PubMed] [Google Scholar]
- Smith RE, Tournier JD, Calamante F, Connelly A (2012): Anatomically‐constrained tractography: improved diffusion MRI streamlines tractography through effective use of anatomical information. Neuroimage 62:1924–1938. [DOI] [PubMed] [Google Scholar]
- Smith SM (2002): Fast robust automated brain extraction. Hum Brain Mapp 17:143–155. [DOI] [PMC free article] [PubMed] [Google Scholar]
- Sorg C, Riedl V, Muhlau M, Calhoun VD, Eichele T, Laer L, Drzezga A, Forstl H, Kurz A, Zimmer C, AM Wohlschlager (2007): Selective changes of resting‐state networks in individuals at risk for Alzheimer's disease. Proc Natl Acad Sci USA 104:18760–18765. [DOI] [PMC free article] [PubMed] [Google Scholar]
- Sporns O, Betzel RF (2015): Modular brain networks. Annu Rev Psychol. [DOI] [PMC free article] [PubMed] [Google Scholar]
- Supekar K, Uddin LQ, Prater K, Amin H, Greicius MD, Menon V (2010): Development of functional and structural connectivity within the default mode network in young children. Neuroimage 52:290–301. [DOI] [PMC free article] [PubMed] [Google Scholar]
- Teipel SJ, Pogarell O, Meindl T, Dietrich O, Sydykova D, Hunklinger U, Georgii B, Mulert C, Reiser MF, Moller HJ, H Hempel (2009): Regional networks underlying interhemispheric connectivity: an EEG and DTI study in healthy ageing and amnestic mild cognitive impairment. Hum Brain Mapp 30:2098–2119. [DOI] [PMC free article] [PubMed] [Google Scholar]
- Terribilli D, Schaufelberger MS, Duran FL, Zanetti MV, Curiati PK, Menezes PR, Scazufca M, Amaro E, Jr. , Leite CC, Busatto GF (2011): Age‐related gray matter volume changes in the brain during non‐elderly adulthood. Neurobiol Aging 32:354–368. [DOI] [PMC free article] [PubMed] [Google Scholar]
- Thomas C, Ye FQ, Irfanoglu MO, Modi P, Saleem KS, Leopold DA, Pierpaoli C (2014): Anatomical accuracy of brain connections derived from diffusion MRI tractography is inherently limited. Proc Natl Acad Sci USA 111:16574–16579. [DOI] [PMC free article] [PubMed] [Google Scholar]
- Tournier JD, Calamante F, Connelly A (2012): MRtrix: diffusion tractography in crossing fibre regions. Int J Imag Syst Technol 22:53–66. [Google Scholar]
- van den Heuvel MP, Kersbergen KJ, de Reus MA, Keunen K, Kahn RS, Groenendaal F, de Vries LS, Benders MJ (2014): The neonatal connectome during preterm brain development. Cereb Cortex 25:3000–3013. [DOI] [PMC free article] [PubMed] [Google Scholar]
- van den Heuvel MP, Mandl RC, Kahn RS, Hulshoff Pol HE (2009): Functionally linked resting‐state networks reflect the underlying structural connectivity architecture of the human brain. Hum Brain Mapp 30:3127–3141. [DOI] [PMC free article] [PubMed] [Google Scholar]
- van den Heuvel MP, Sporns O (2013a): An anatomical substrate for integration among functional networks in human cortex. J Neurosci 33:14489–14500. [DOI] [PMC free article] [PubMed] [Google Scholar]
- van den Heuvel MP, Sporns O (2013b): Network hubs in the human brain. Trends Cogn Sci 17:683–696. [DOI] [PubMed] [Google Scholar]
- Wang J, Wang L, Zang Y, Yang H, Tang H, Gong Q, Chen Z, Zhu C, He Y (2009): Parcellation‐dependent small‐world brain functional networks: a resting‐state fMRI study. Hum Brain Mapp 30:1511–1523. [DOI] [PMC free article] [PubMed] [Google Scholar]
- Welvaert M, Rosseel Y (2013): On the definition of signal‐to‐noise ratio and contrast‐to‐noise ratio for FMRI data. PLoS One 8:e77089. [DOI] [PMC free article] [PubMed] [Google Scholar]
- Wen W, Zhu W, He Y, Kochan NA, Reppermund S, Slavin MJ, Brodaty H, Crawford J, Xia A, Sachdev P (2011): Discrete neuroanatomical networks are associated with specific cognitive abilities in old age. J Neurosci 31:1204–1212. [DOI] [PMC free article] [PubMed] [Google Scholar]
- Wu CW, Chen CL, Liu PY, Chao YP, Biswal BB, Lin CP (2011): Empirical evaluations of slice‐timing, smoothing, and normalization effects in seed‐based, resting‐state functional magnetic resonance imaging analyses. Brain Connect 1:401–410. [DOI] [PubMed] [Google Scholar]
- Wu K, Taki Y, Sato K, Qi H, Kawashima R, Fukuda H (2013): A longitudinal study of structural brain network changes with normal aging. Front Hum Neurosci 7:113. [DOI] [PMC free article] [PubMed] [Google Scholar]
- Yang Z, Chang C, Xu T, Jiang L, Handwerker DA, Castellanos FX, Milham MP, Bandettini PA, Zuo XN (2014): Connectivity trajectory across lifespan differentiates the precuneus from the default network. Neuroimage 89:45–56. [DOI] [PMC free article] [PubMed] [Google Scholar]
- Zalesky A, Fornito A, Bullmore E (2012): On the use of correlation as a measure of network connectivity. Neuroimage 60:2096–2106. [DOI] [PubMed] [Google Scholar]
- Zhang Z, Liao W, Chen H, Mantini D, Ding JR, Xu Q, Wang Z, Yuan C, Chen G, Jiao Q, G Lu (2011): Altered functional‐structural coupling of large‐scale brain networks in idiopathic generalized epilepsy. Brain 134:2912–2928. [DOI] [PubMed] [Google Scholar]
- Ziegler DA, Piguet O, Salat DH, Prince K, Connally E, Corkin S (2010): Cognition in healthy aging is related to regional white matter integrity, but not cortical thickness. Neurobiol Aging 31:1912–1926. [DOI] [PMC free article] [PubMed] [Google Scholar]
- Zilles K, Palomero‐Gallagher N, Schleicher A (2004): Transmitter receptors and functional anatomy of the cerebral cortex. J Anat 205:417–432. [DOI] [PMC free article] [PubMed] [Google Scholar]
- Zuo XN, Kelly C, Di Martino A, Mennes M, Margulies DS, Bangaru S, Grzadzinski R, Evans AC, Zang YF, Castellanos FX, MP Milham (2010): Growing together and growing apart: regional and sex differences in the lifespan developmental trajectories of functional homotopy. J Neurosci 30:15034–15043. [DOI] [PMC free article] [PubMed] [Google Scholar]
Associated Data
This section collects any data citations, data availability statements, or supplementary materials included in this article.
Supplementary Materials
Supporting Information