

Abstract
The central nervous system has the ability to adapt our locomotor pattern to produce a wide range of gait modalities and velocities. In reacting to external pacing stimuli, deviations from an individual preferred cadence provoke a concurrent decrease in accuracy that suggests the existence of a trade‐off between frequency and precision; a compromise that could result from the specialization within the control centers of locomotion to ensure a stable transition and optimal adaptation to changing environment. Here, we explore the neural correlates of such adaptive mechanisms by visually guiding a group of healthy subjects to follow three comfortable stepping frequencies while simultaneously recording their BOLD responses and lower limb kinematics with the use of a custom‐built treadmill device. In following the visual stimuli, subjects adopt a common pattern of symmetric and anti‐phase movements across pace conditions. However, when increasing the stimulus frequency, an improvement in motor performance (precision and stability) was found, which suggests a change in the control mode from reactive to predictive schemes. Brain activity patterns showed similar BOLD responses across pace conditions though significant differences were observed in parietal and cerebellar regions. Neural correlates of stepping precision were found in the insula, cerebellum, dorsolateral pons and inferior olivary nucleus, whereas neural correlates of stepping stability were found in a distributed network, suggesting a transition in the control strategy across the stimulated range of frequencies: from unstable/reactive at lower paces (i.e., stepping stability managed by subcortical regions) to stable/predictive at higher paces (i.e., stability managed by cortical regions). Hum Brain Mapp 37:1722–1737, 2016. © 2016 Wiley Periodicals, Inc.
Keywords: locomotion, lower limb movements, effect of frequency, precision, functional neuroimaging, kinematics, predictive strategy, reactive strategy
INTRODUCTION
Frequency is a fundamental parameter intrinsic to the control of coordinated systems. Human locomotion constitutes such a coordinated system where the rhythmic alternation of the limbs allows an efficient mode for transportation while preserving balance in the gravitational field. Gait is characterized by variations around an intrinsic cadence that is volitionally or automatically modified depending on locomotive requirements [Wagenaar and Van Emmerik, 2000; Wuehr et al., 2014]. Deviations from this preferred cadence provoke a concurrent decrease in accuracy, which suggests a trade‐off between frequency and precision [Fitts, 1954; Noble et al., 1955]. During bilateral coordination of the lower limbs, the trade‐off between frequency and accuracy usually follows nonlinear transitions showing higher gains around the preferred cadence [Hausdorff et al., 1995; Jordan et al., 2007] that could reflect an adaptation mechanism toward the optimal control mode of locomotion in the central nervous system [Harris and Wolpert, 1998]. Studies on kinematics of gait have shown that during lower speeds, the coordination pattern is characterized by a greater variability in the frequency of alternating limbs [Kang and Dingwell, 2008; Plotnik et al., 2013]. Conversely, faster paces evoke more reactive and synchronized stepping patterns [Schöner et al., 1990].
In humans, the neural substrate of sensorimotor synchronization (SMS) during gait has been studied with fMRI imagery tasks. All these studies rely on the assumption that both imagery and actual movement involve similar neuronal structures [Jahn et al., 2008; Stinear et al., 2006 ]. This has been supported by the detection of a locomotion network involving areas in the midbrain, brainstem, cerebellum and supratentorial regions [Hétu et al., 2013; Jahn et al., 2004, 2008; Karachi et al., 2012; Lau et al., 2015; Wagner et al., 2008]. Nevertheless, a study comparing brain activity during different fMRI imagery tasks (i.e., resting, walking, and running) with the brain activity during real locomotion recorded with FDG‐PET proved some differences between imagery tasks and real locomotion. Specifically, the authors suggested that different locomotor modules may be acting across conditions: a direct‐executive network in real locomotion versus an indirect‐planning network responsible for modulating locomotion in imagined tasks [la Fougere et al., 2010].
Knowledge derived from animal studies also suggests that gait is managed by a hierarchical network distributed along the brainstem, cerebellum, basal ganglia, and cortex which would be conserved despite our transition to bipedal locomotion [Armstrong, 1988; Drew et al., 2004; Grillner and Wallen, 1985; Mori, 1987]. Central pattern generators located at the spinal level are controlled by visual, vestibular, proprioceptive, exteroceptive sensory feedback, and supraspinal centers [Armstrong, 1988; Dietz, 2003; Drew et al., 2004; Mori et al., 2004]. Such regions, essential in sensorimotor adaptation, are responsible for controlling locomotion aspects (i.e., motor pattern selection, initiation and termination of movement, speed, direction, spatial orientation, balance, stability on posture) through multisensory dynamic integration mechanisms [Rossignol et al., 2006]. Locomotion requires motor learning and an integrated control of multiple body segments against gravity, including the control of movement, posture and balance. Lesion studies in cats have demonstrated that the ablation of certain regions (i.e., the cerebellum) and electrical stimulation in the midbrain and cerebellum provoke different spatio‐temporal patterns in the animal locomotor performance [Mori, 1987; Mori et al., 1999, 2000]. Thus, a highly distributed and dynamic network for an integrated control of posture and locomotion has been proposed in both quadrupeds and bipeds, including anticipatory and reactive control mechanisms to ensure that motor signals are sent to different muscle‐control systems in a coordinated manner [Mori et al., 2004; Rossignol et al., 2006; Yakovenko and Drew, 2009].
SMS with external rhythms seems to be a uniquely human ability. Studies including finger tapping tasks have demonstrated the participation of the primary sensorimotor cortex, supplementary motor area, premotor cortex, inferior parietal cortex, basal ganglia, and cerebellum [Aznárez‐Sanado et al., 2013; Fernández‐Seara et al., 2009; Witt et al., 2008]. Notably, an essential function of the cerebellum has been emphasized due to its role in interval timing [Ivry and Schlerf, 2008; Repp and Su, 2013; Teki et al., 2011], error correction [Diedrichsen et al., 2005] and predictive movement control [Morton and Bastian, 2006], although the contribution of the cerebellum to the motor commands or to the sensorimotor consequences of such movement is still under debate [Coull et al., 2011; Manto et al., 2012]. Moreover, the upper and lower limbs are naturally involved in distinct tasks purposes: that is, arms and hands are used for voluntary reaching, grasping or manipulation of objects, whereas the lower limbs are mostly involved in locomotion. Thus, there is an essential interest in exploring coordination in the lower limbs because the neural activation evoked during upper‐limb coordination may depend on task other than mechanical properties [Dassonville et al., 1998; Jahanshahi et al., 1995; Jäncke et al., 2000; Kawashima et al., 1994; Krings et al., 2000; Rao et al., 1997]. To date, the set of brain structures responsible for the adaptation abilities of the human locomotor system with external rhythms are still under investigation.
Recently, we presented an fMRI‐compatible device to examine human brain activation associated with repetitive bilateral movements of the lower limbs [Martínez et al., 2014]. To investigate the neural substrates of adaptive locomotion, here we examine the concurrent kinematic and BOLD activity patterns evoked during coordinated stepping movements of the lower limbs across a comfortable range of visually guided frequencies (from 0.8 to 1.75 Hz) in a group of healthy young adults. Considering the accepted trade‐off between frequency and precision in locomotor movements, we hypothesize that requesting individuals to follow repetitive stepping movements at different frequencies will allow us to identify the transition of kinematic strategies and brain activity patterns, and thus will help to better understand the neural substrate of locomotor control.
MATERIALS AND METHODS
Participants
Nineteen healthy young adults (mean age 33.29, standard deviation [SD] 5.8 years, range 25–42; 9 female) recruited from the staff of the University of Navarra participated in the experiment. They were all right‐handed [Oldfield, 1971] by self‐report, naïve to the task, had normal vision and absence of any neurological, psychological or motor disorder reported in their clinical history. The protocol was approved by the Ethics Research Committee of the University of Navarra and participants gave written informed consent before participating in the study.
Experimental Setup
Participants were positioned supine on the MRI scanner table with both thighs placed on a fMRI‐compatible treadmill device with knees flexed and heels resting (Fig. 1A). The apparatus aimed to facilitate the performance of stepping movements during fMRI testing while registering the lower limbs motion and was manufactured with nonmagnetic metals and plastic. Its structural design consisted of two independent columns of rollers connected to a triangular methacrylate platform which was adjustable along the exploration table according to the subject's height. Moreover, custom fixations (head vacuum pillow, stomach, and tights belts) were employed to limit the deleterious head motion consequent from lower limb movements as much as possible. Aspects related with the electromagnetic compatibility and operation of the device in the magnetic environment were examined in a previous study [Martínez et al., 2014].
Figure 1.
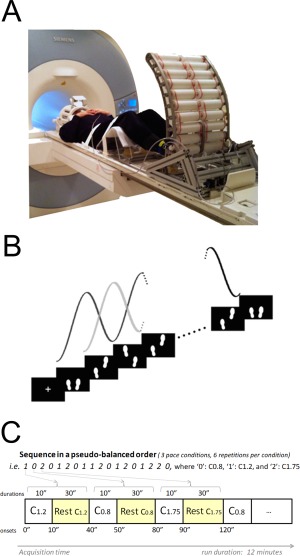
A. Experimental setup of the pseudo‐gait MRI compatible device. B. The visual stimulus employed during the paradigm consisted in two footprints moving constantly and vertically at 0.8, 1,2, and 1.75 Hz depending on the condition. C. Alternation of motor and resting blocks during the sequence presentation showing the onsets and durations of the condition blocks. © [2014] IEEE. Figure 1A,B Reprinted, with permission, from Martínez et al., 2014. [Color figure can be viewed in the online issue, which is available at http://wileyonlinelibrary.com.]
The fMRI study was carried out on a 3T MRI scanner (Siemens Trio TIM, Siemens AG, Erlangen, Germany) equipped with a 12‐channel head array coil. It consisted of one session that included the acquisition of an anatomical dataset and two functional runs, with a total duration of 30 min. During each functional run, subjects were asked to alternate 30 s resting blocks (resting condition) with three different movement blocks of 10 s duration (motor conditions). Each run comprised a total of 18 motor blocks (six repetitions by condition) and the corresponding resting blocks, with a total duration of 12 min. A total of 380 imaging volumes sensitive to BOLD contrast were acquired per run.
During movement blocks, subjects were requested to simulate gait by alternating their lower‐limbs following the pace of a visual stimulus that was delivered in the form of two white colored footprints moving constantly and vertically according to a sinusoidal function of frequencies: 0.8 (motor condition C0.8), 1.2 (motor condition C1.2) or 1.75 steps per second (motor condition C1.75), as seen in Figure 1B. Subjects were allowed to select comfortable displacement amplitude of their lower limb movements and did not receive any feedback on their performance. An isolated lower limb movement (or step) was composed of an upward and a downward component. The upward movement was accomplished by an initial dorsiflexion of the ankle to avoid foot contact with the treadmill‐rollers, simultaneous with a progressive knee extension. Once the knee reached its maximum extension, the sole of the foot contacted the rollers initiating the downward movement, which was started by an ankle plantar flexion accompanied with a progressive knee flexion. During the downward movement, the foot contact with the rollers was maintained until the knee reached the position of maximal flexion entailing feet clearance and the start of a new step. Movements were restricted to the vertical plane. The frequency of the motor blocks was counterbalanced and pseudo‐randomized throughout the run to avoid expectance effects (Fig. 1C). Knee displacements were simultaneously registered by the treadmill's sensors and stored for offline analysis. During resting blocks, the stimulus was maintained but color was changed to yellow for easy identification; participants were instructed to relax without moving. Prior to the fMRI session, a 15‐min practice session was carried out to ensure correct performance.
Kinematic Data
Knee displacements were analyzed to examine the lower limb kinematic patterns and their variation across the different motor conditions and thus characterize the motor performance of individuals. For each subject and condition, we first computed classical kinematic features used to describe gait dynamics. We estimated the stepping frequency (SF, mean stepping frequency across the whole set of trials), the stepping amplitude (SA, mean angular knee displacement, averaged for the two knees), the asymmetry coefficient (AC, ratio between the mean angular left and right knee displacements), and the relative phase (RP, phase difference between both knees computed at the maximum amplitude of displacement or knee extension) [Abe et al., 2003; Kelso et al., 1986] parameters.
To assess the locking of the subject movement to the visual guide we examined the difference between the frequency of the visual stimuli and the subject's mean stepping frequency. We defined the deviation score (DS) as the normalized error between the SF and the visual stimulus frequency across conditions to quantify the subject's accuracy.
| (1) |
where SFi and Fi are the SF and the visual stimulus frequency for each ith condition. The DS constitutes a normalized measure of the accuracy of the locking to the stimulus at different paces as it measures the deviation from the visual guide while considering the requested frequency. Null values for DS indicate a perfect match between the steps and the visual guide, while non‐zero values detect poorer adjustment to the visual cue with positive/negative values implying anticipatory/reactive strategies, respectively.
To further characterize the dynamics of the elicited movements we evaluated the stability of the instantaneous stepping frequencies by computing their coefficient of variation (CV), a normalized measure of dispersion around the mean stepping frequency.
| (2) |
where sfk,i represents the instantaneous stepping frequency for the kth step, under the ith condition.
Wilcoxon signed rank tests were used to assess deviations of the SF values from the stimulating frequencies, deviation of the AC parameters from 1 (i.e., spatial asymmetries), deviation of the RP from the out‐of‐phase mode (i.e., temporal asymmetry value) and the presence of perfect matching to the requested frequency on each condition (deviation of DS from 0). Statistical effects of the stimulation frequency on the SA, AC, RP, DS, and CV were assessed by means of Friedman tests (one way nonparametric ANOVA, with factor frequency). Post hoc multiple comparison tests (P < 0.05, Tukey's HSD correction for multiple comparisons) were performed to assess pair‐wise differences.
Functional Neuroimaging Data
Standard analysis on the BOLD signal was performed using the Statistical Parametrical Mapping package (SPM8; Wellcome Department of Cognitive Neurology, London, UK; http://www.fil.ion.ucl.ac.uk/spm). Additional custom scripts implemented in Matlab® (R2009b, The Mathworks Inc., Natick, MA) were used when necessary.
Image analysis was performed following the previous reported procedure [Martínez et al., 2014]. Functional imaging volumes were realigned to the mean volume of each corresponding session [Friston et al., 1996]. Considering the vulnerability of certain brain regions to motion artifacts [Lund et al., 2006], the amount of head motion was quantified based on the realignment parameters. Then, the Artifact Repair Toolbox (ART) [Mazaika et al., 2009] was employed to detect and eliminate artifact scans (see SM). Valid data were co‐registered to the individual anatomical image and spatially normalized to the MNI template (Montreal Neurological Institute, based on ICBM‐152 coordinates), using the parameters determined by the combined segmentation and normalization of the T1‐weighted image. To finish, a Gaussian filter of 8‐mm full width at half maximum (FWHM) was applied to spatially smooth the data.
Effects in BOLD signal were assessed in the context of the General Linear Model theory (GLM) [Friston et al., 1995]. Volumes were first time‐filtered using a high‐pass filter at 0.008 Hz to remove the effects of slow signal drifts caused by the scanner and physiological noise. Then, the BOLD response was modeled using a boxcar function convolved with the SPM hemodynamic response function. Task‐induced activations and deactivations during each motor condition with respect to the rest condition were assessed individually according to a fixed effects (FFX) analysis (one‐sample t‐test). Intrasubject differences in movement amplitude during the task were controlled and corrected by including the total extent of knee movement during motor trials as a covariate in the design matrix [Martínez et al., 2014]. Group statistics were then inferred using a random effects (RFX) analysis (one‐sample t‐test, FWE‐cluster level corrected, cluster defining threshold P < 0.001) [Penny et al., 2003]. In group analyses, the individual mean SA, age, and gender were used as nuisance covariates to account for inter‐subject variability.
Differential effects of frequency in the BOLD activity across conditions were assessed by means of a repeated measures one‐way analysis of variance (ANOVA) followed by post hoc t‐tests (FWE‐cluster level corrected, cluster defining threshold P < 0.001). The percent signal change (PSC) was then employed to quantify the effect of frequency on the BOLD signal (direction and magnitude).
Neural correlates of the subjects' performance were assessed by means of a multiple regression analysis including the DS and condition parameters as regression factors (P < 0.001, k > 10). Similarly, brain activations associated with the stability of pace were investigated by regressing the CV and condition factors (P < 0.001, k > 10).
The ICBM152 template (based on MNI coordinates) [Fonov et al., 2011] was employed to localize cerebral activations during group analyses. In addition, we employed the SPM anatomy toolbox (version 2.0) [Eickhoff et al., 2005] to anatomically define cerebral activations and the SUIT template [Diedrichsen et al., 2009] to localize cerebellar activations, as this template is less biased in cerebellar areas than the ICBM152.
RESULTS
Motor Performance
Qualitatively, kinematic analyses suggest that all subjects succeed in performing the task at the different paces. Figure 2 and Table 1 summarize the effect of frequency on the kinematic parameters characterizing knee displacements. Analysis of the SF parameter (Fig. 2A) showed that subjects' paced significantly faster than 0.8 Hz during the C0.8 condition (SF > 0.8 Hz, P < 0.001) but slower than 1.2 Hz during C1.2 (SF < 1.2 Hz, P = 0.02). Notably, statistical analyses did not find significant differences between the subjects' and the requested frequency for the C1.75 condition (SF ≠ 1.75 Hz, P = 0.09).
Figure 2.
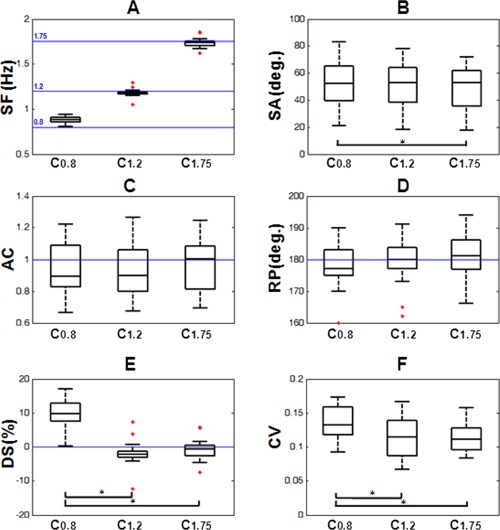
Effect of frequency in the kinematic parameters employed for characterizing the lower limb movement patterns: (A) SF: stepping frequency, (B) SA: stepping amplitude, (C) AC: asymmetry coefficient, (D) RP: relative phase, (E) DS: deviation score, and (F) CV: coefficient of variability. Statistically significant differences (P < 0.05) on features between conditions are indicated. [Color figure can be viewed in the online issue, which is available at http://wileyonlinelibrary.com.]
Table 1.
Kinematic parameters and statistical comparisons across frequency conditions (SF: stepping frequency, SA: stepping amplitude, AC: asymmetry coefficient, RP: relative phase, DS: deviation score, and CV: coefficient of variability)
| Feature (unit)/Condition | C0.8 | C1.2 | C1.75 | |
|---|---|---|---|---|
| SF (Hz) | mean ± std; median | 0.89 ± 0.03; 0.88 | 1.18 ± 0.04; 1.17 | 1.73 ± 0.05; 1.74 |
| Wilcoxon P‐value | <0.0001 | 0.018 | 0.091 | |
| SA (degrees) | mean ± std; median | 51.57 ± 17.15; 52.16 | 49.52 ± 16.99; 53.05 | 48.76 ± 16.66; 52.63 |
| Friedman comparisons [CI 95%] dif | C1.75: [0.29.1.81] 1.05 | — | C0.8: [0.29.1.81] 1.05 | |
| AC (‐) | mean ± std; median | 0.942 ± 0.16; 0.89 | 0.95 ± 0.17; 0.90 | 0.96 ± 0.16; 1.00 |
| Wilcoxon P‐value | 0.107 | 0.171 | 0.314 | |
| Friedman comparisons | — | — | ‐ | |
| RP (degrees) | mean ± std; median | 178.32 ± 7.1; 177.51 | 178.39 ± 8.65; 180.22 | 181.22 ± 7.17; 180.80 |
| Wilcoxon P‐value | 0.316 | 0.868 | 0.42 | |
| Friedman comparisons | — | — | ‐ | |
| DS (%) | mean ± std; median | 9.97 ± 3.80; 9.65 | [−1.92± 3.65; −2.19] | [−0.85± 3.02; −0.74] |
| Wilcoxon P‐value | <0.0001 | 0.018 | 0.09 | |
| Friedman comparisons |
C1.2: [0.87.2.39] 1.63; C1.75: [0.61.2.13] 1.37 |
C0.8: [0.87.2.39] 1.63 | C0.8: [0.61.2.13] 1.37 | |
| CV (%) | mean ± std; median | 0.14 ± 0.05; 0.13 | 0.11 ± 0.03; 0.11 | 0.11 ± 0.02; 0.11 |
| Friedman comparisons |
C1.2: [0.03.1.55] 0.79; C1.75: [0.03.1.55] 0.79 |
C0.8: [0.03.1.55] 0.79 | C0.8: [0.03.1.55] 0.79 | |
SA values (Fig. 2B) showed a significant effect of frequency on the amplitude of knee displacement across conditions (Friedman test, P < 0.01). Post hoc comparisons detected that subjects' knee displacements were significantly larger for C0.8 compared to the C1.75 condition (P < 0.05). Analysis of RP and AC parameters (Fig. 2C,D) confirmed the presence of an out‐of‐phase (RP ≈ 180) and symmetric (AC ≈ 1) kinematic pattern independently of the requested frequency. Statistical analysis did not show significant RP deviations from 180º. Similarly, the value of AC did not significantly differ from 1, and no effect of the frequency factor was detected, suggesting that right and left‐knee displacements were similar across conditions.
Analysis of the DS parameter revealed that subjects anticipated their steps with respect to the visual guide in the C0.8 condition, were delayed in the C1.2 condition and matched the stimulus pace during C1.75, with a significant effect of frequency on the DS (P < 0.001), representing subjects' performance. Post hoc comparisons revealed that subjects adjusted their steps to the guide worse in the C0.8 condition than in C1.2 or C1.75 conditions (P < 0.05, Fig. 2E). No significant differences were found when comparing C1.2 and C1.75 conditions. Finally, analyses on the CV values revealed that the largest variability around the mean frequency occurred under the C0.8 condition. Statistical analysis showed a frequency‐dependent effect with significant differences between C0.8 and the other two frequencies (Fig. 2F, post hoc comparisons, P < 0.05).
These results suggest the presence of a common symmetric and anti‐phase lower limb pattern across conditions, showing a significant deterioration of the performance during the slowest pace C0.8 in the form of less accuracy and stability reflected by the DS and CV features.
Functional Neuroimaging
Mean head motion remained below 2 mm for all subjects and conditions (see Supporting Information). Figure 3 shows the group T‐maps from the BOLD response comparing motor and resting for the three different paces (P < 0.001, FWE‐cluster‐level corrected). Qualitatively, similar bilateral activation/deactivation (hot/cold color scale) maps were detected for the three frequencies. At the cortical level, significant bilateral overlapping activations were found bilaterally in the inferior frontal (including anterior insula), premotor cortex, supplementary motor area (SMA), primary sensorimotor cortex (SM1), cingulate motor cortex (CMC), superior parietal cortex (SPC), supramarginal and angular gyri, and inferior parietal cortex (IPC). Subcortically, significant overlapping activations covered the bilateral dorsal putamen, ventrolateral nuclei of the thalamus and in several cerebellar regions within the anterior vermis (lobes I‐IV) and hemispheric lobes (lobule VII). Deactivation patterns covered bilaterally areas in the superior frontal and medial orbital lobes, postcentral and angular gyri, anterior, middle, and posterior cingulate cortices, cuneus, precuneus, lingual and fusiform gyri, middle and inferior temporal lobes, parahippocampal gyrus, hippocampus, and left middle frontal gyrus. At the subcortical level, decreases of activation were found bilaterally in the caudate nucleus, cerebellum lobule VI, Crus 1 and Crus 2, lobule IX, central pons, and medulla oblongata.
Figure 3.
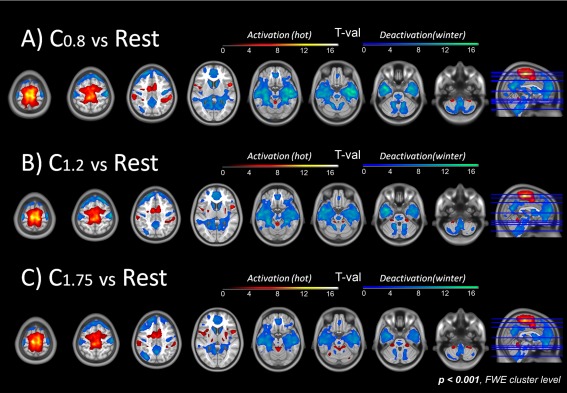
Patterns of brain activation (hot color scale)/deactivation (cold color scale) corresponding to the (A) C0.8, (B) C1.2, and (C) C1.75 vs. rest contrasts, P < 0.001, FWE‐ corrected at the cluster level. Qualitatively, similar bilateral activation and deactivation maps were detected for the three frequencies. At the cortical level, significant bilateral overlapping activations were found in the inferior frontal cortex (including anterior insula), premotor cortex, supplementary motor area (SMA), primary sensorimotor cortex (SM1), cingulate motor cortex (CMC), superior parietal cortex (SPC), supramarginal and angular gyri, and inferior parietal cortex (IPC). Subcortically, significant activations covered the cerebellar regions within the anterior vermis (lobes I–IV). Deactivation covered bilaterally areas in the superior frontal and medial orbital lobes, postcentral and angular gyri, anterior, middle and posterior cingulate cortices, cuneus, precuneus, lingual and fusiform gyri, middle and inferior temporal lobes, parahippocampal gyrus, hippocampus, and left middle frontal gyrus. At the subcortical level, decreases of activation were found in the bilateral caudate nucleus, thalamus, cerebellum lobule VI, Crus 1 and Crus 2, lobule IX, central pons and medulla oblongata.
A significant effect of frequency was detected in the one‐way analysis of variance (P < 0.001, FWE‐cluster corrected) in the left precuneus, visual regions in the calcarine gyrus, the anterior vermis, and the inferior posterior lobe of the cerebellum (Fig. 4A and Table 2). Interestingly, all these areas corresponded to the deactivation network and did not overlap with the set of areas that increased their BOLD response during the stepping blocks. PSC ratio values showed an inverse linear trend between deactivation and task frequency in the cerebellar lobule VIIIa (shown in pink in Fig. 4B). Post hoc t‐tests (P < 0.001, FDR‐cluster corrected) detected significant differences in this region when comparing C1.75 against the other conditions. The same inverse linear deactivation trend was observed in the left cerebellum (lobule VI) extended to the calcarine sulcus (depicted in white) that showed significant differences across all conditions. The left precuneus (green) exhibited an inverse U‐shape response with minimal deactivation for the C1.2 condition and maximal deactivation for the C1.75 condition. Post hoc t‐tests revealed significant differences when comparing C1.75 and C1.2 conditions.
Figure 4.
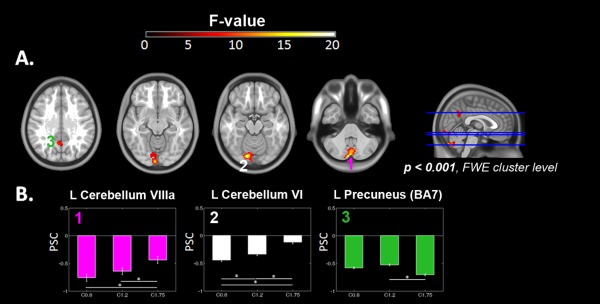
Brain areas showing an effect of the stepping frequency. A. T1 axial sections displaying clusters were BOLD activations showed a significant effect of frequency (P < 0.001, corrected for multiple comparisons). B. Percent signal Change (PSC) in the (1) L cerebellum VIIIa (3,‐79,‐42), (2) L Cerebellum VI (−15, −82,‐17), and (3) L precuneus (−2, −58, 34). NOTE: ROIs were selected from the ANOVA using a 6 mm‐sphere VOI centered in the cluster maxima. R: Right, L: Left.
Table 2.
Significant brain activated areas across frequency conditions resulting from the ANOVA analysis (P < 0.001, FWE cluster‐level corrected), with cluster size, F‐value and localizations of peak activations (MNI‐coordinates)
| Brain region | Cluster size | F‐value | MNI | ||
|---|---|---|---|---|---|
| L Precuneus (BA23) | 319 | 11.13 | −6 | −58 | 24 |
| L Precuneus (BA7) | 11.06 | −2 | −58 | 34 | |
| L Cerebellum (VI)a | 678 | 20.11 | −15 | −82 | −17 |
| L Calcarine Gyrus (BA18) | 16.64 | −6 | −94 | −12 | |
| L Cerebellum (VIIa Crus II)a | 678 | 20.90 | −6 | −82 | −42 |
| R Cerebellum (VIIIa) | 16.12 | 0 | −78 | −42 | |
L: left, R: right.
Regions surviving a threshold of P < 0.05, corrected for FWE at the peak‐level.
Multiple regression analysis detected the existence of a significant, positive linear correlation between the DS and the BOLD response (i.e., the larger the anticipation of the subject's SF from the requested pace, the greater the BOLD response) in the right insula (BA44), right anterior cerebellar vermis (lobules IV/V) and lobule I/IV, left dorsolateral (DL) pontine tegmentum (corresponding to the medial lemniscus), and bilateral inferior olive (Fig. 5 and Table 3).
Figure 5.
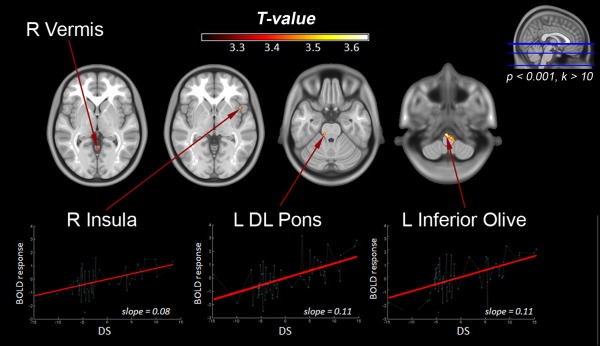
Neural correlates of visuomotor precision during stepping movements (multiple regression analysis with the DS parameter, P < 0.001, k > 10). Responses were found in the R insula, R Vermis, L DL pons and R inferior olive. DL: Dorsolateral. R: Right, L: Left.
Table 3.
T‐values, cluster size and localization of activations peaks (MNI‐coordinates) for areas showing a positive correlation with the DS (P > 0.001, k > 10)
| Brain region | Cluster size | T‐values | MNI | |||
|---|---|---|---|---|---|---|
| R Cerebellar Vermis (IV/V) | 16 | 3.41 | 0 | −55 | 1 | |
| R Insular Lobe (BA 44) | 27 | 3.66 | 44 | 14 | −3 | |
| L DL Pons (medial lemniscus) | 22 | 3.51 | −12 | −30 | −26 | |
| R Cerebellum (I/IV) | 21 | 3.67 | 20 | −27 | −38 | |
| L Inferior Olive | 41 | 3.71 | −5 | −28 | −47 | |
| L Inferior Olive | 121 | 3.72 | −3 | −31 | −59 | |
| R Inferior Olive | 3.57 | 3 | −37 | −60 | ||
L: left, R: right.
Multiple regression analysis with the CV parameter (Fig. 6, Tables 4 and 5) detected significant positive and negative correlations with the BOLD activity in a number of cortical and subcortical brain areas. A positive correlation between BOLD activity and the CV indicates that subjects with a more variable cadence have greater BOLD activity in a determined region than those with more stable performances. In contrast, a negative correlation indicates that subjects with a more variable cadence have lesser BOLD activity that those with more stable performances. At the cortical level, positive correlations were found in the right calcarine (BA19), right superior temporal (BA22), left lingual (BA37), left fusiform (BA37), and left hyppocampus. At the subcortical level, positive correlations were found in the left prefrontal thalamus extended to the caudate nucleus, left thalamus (reticular nucleus), right subthalamic nucleus, left cerebellar vermis (lobules IV–V), right cerebellum Crus I and left inferior olive. Negative correlations were found in several cortical areas, corresponding to the right middle frontal gyrus (BA9), right inferior frontal gyrus (pars orbitalis, BA44/47), bilateral paracentral lobule (BA4) extended to the left SMA (BA6), left preSMA, left superior temporal gyrus (BA22), left postcentral (BA2), and superior parieto‐occipital lobules (BA7).
Figure 6.
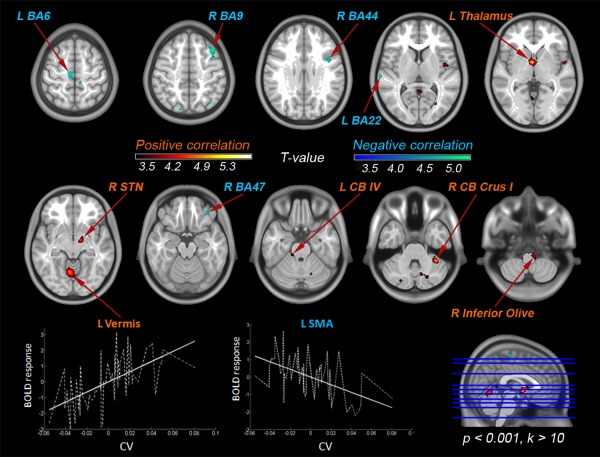
Neural correlates of pace stability during visually‐guided stepping movements (multiple regression analysis with the CV parameter, P < 0.001, k > 10). The localization of the BOLD responses linearly correlating with the CV are colored in hot T‐scale whereas BOLD responses with negative correlation with the CV are colored in cold T‐scale.
Table 4.
T‐values, cluster size and localization of activations peaks (MNI‐coordinates) for areas showing a positive correlation with the CV (P > 0.001, k > 10)
| Brain region | T‐values | Cluster size | MNI | ||
|---|---|---|---|---|---|
| R Superior Temporal (BA38) | 4.13 | 54 | 54 | 2 | −3 |
| R Calcarine (BA19) | 3.60 | 49 | 29 | −69 | 6 |
| L Lingual Gyrus (BA37) | 3.75 | 41 | −30 | −51 | −6 |
| L Hippocampus | 4.07 | 32 | −17 | −7 | −12 |
| L Fusiform Gyrus (BA37) | 3.77 | 22 | −32 | −42 | −15 |
| R Subthalamic nucleus | 4.43 | 97 | 12 | −9 | −10 |
| L Prefrontal Thalamusa | 5.46 | 459 | −5 | 0 | −3 |
| R Cerebellum (Crus 1/2)a | 6.18 | 277 | 39 | −44 | −38 |
| L Cerebellum (Crus 2) | 4.17 | 189 | −42 | −55 | −44 |
| L Cerebellum (Crus 1) | 4.26 | 71 | −23 | −78 | −32 |
| R Cerebellar Vermis (IV/V) | 3.83 | 77 | 3 | −49 | 6 |
| R Cerebellum (IV/V) | 3.58 | 30 | −8 | −40 | −5 |
| L Cerebellum (V) | 4.81 | 491 | 3 | −63 | −8 |
| R Cerebellum (VI/VIII) | 3.88 | 236 | 11 | −66 | −33 |
| R Cerebellum (VIII) | 3.89 | 43 | 18 | −63 | −51 |
| R Inferior Olive | 4.11 | 75 | 9 | −33 | −56 |
L: left, R: right.
Regions surviving a threshold of P < 0.05, corrected for FWE at the peak‐level.
Table 5.
T‐values, cluster size and localization of activations peaks (MNI‐coordinates) for areas showing a negative correlation with the CV (P > 0.001, k > 10)
| Brain region | T‐values | Cluster size | MNI | ||
|---|---|---|---|---|---|
| L preSMA (BA6) | 3.92 | 293 | −47 | −1 | 37 |
| L SMA (BA6) | 4.83 | 921 | −8 | −19 | 60 |
| L Paracentral (BA4a) | 4.18 | −15 | −33 | 64 | |
| R Paracentral (BA 4a) | 3.58 | 9 | −28 | 61 | |
| R Middle Frontal (BA9)a | 5.34 | 198 | 42 | 21 | 51 |
| R Inferior Frontal (BA44) | 3.78 | 121 | 44 | 5 | 28 |
| R Inferior Frontal (BA47) | 3.86 | 40 | 35 | 41 | −20 |
| R Superior Medial (BA10) | 3.57 | 26 | 14 | 69 | 16 |
| R Superior Parietal (BA7) | 4.00 | 66 | −14 | −81 | 49 |
| R Superior Occipital (BA7) | 4.05 | 130 | 33 | −73 | 48 |
| L Superior Temporal (BA22) | 4.11 | 43 | −68 | −22 | 7 |
L: left, R: right.
Regions surviving a threshold of P < 0.05, corrected for FWE at the peak‐level.
DISCUSSION
To the best of the authors knowledge, this is the first time that both kinematic and BOLD activity are measured simultaneously to examine the relationship between stepping frequency and accuracy during alternating lower limb movements with varying stepping velocities. Kinematic analyses confirm the presence of a common, symmetric and anti‐phase stepping pattern across the whole set of frequencies tested in the current study, suggesting that the proposed paradigm constitutes a suitable model for investigating the inherent modes of human gait. Moreover, the differences found across frequencies in the displacement amplitude, in the accuracy of coupling the repetitive movements to the visual guide, as well as in the movement stability fluctuations observed across conditions suggest the presence of a transition between an anticipatory and less stable (reactive) strategy in the motor control during the lowest pace, and a more regular (predictive) at higher frequencies. The differential neural responses found in parieto‐cerebellar regions might be essential in the visuomotor adaptation of the locomotor pattern across different paces. Moreover, the neural correlates of stability in motor performance revealed a distributed network that is in agreement with models previously proposed in animal studies of gait and neuroimaging studies on imagery using locomotion tasks.
Motor Performance
Poorer motor performance was observed during the lowest pace. At this frequency, subject's movements anticipated the visual stimulus, executed larger knee displacements and showed lower cadence stability. Larger knee amplitudes and higher variability in the stepping pace could reflect the presence of corrective adjustments based on sensorimotor feedback related with concurrent stimulus tracking strategies, resulting from the adoption of a supervised mode of operation. Studies on gait have shown that during lower speeds, the coordination pattern is characterized by a higher variability [Kang and Dingwell, 2008; Plotnik et al., 2013], which could be due to the un‐natural adaptation to a slower pace than the individually‐preferred. By contrast, the motor performance became highly stable when frequency increased. At higher frequencies, the amplitude of the movements decreased and the locking of the subject's movements to the visual stimulus was more precise. Conversely to the lower pace, the faster ones evoked more reactive and synchronized stepping patterns, as occurs in locomotion [Cavagna, 2006; Schöner et al., 1990; Smak et al., 1999; Wagenaar and Van Emmerik, 2000 ]. It has been shown that during bilateral coordination of the lower limbs there is a trade‐off between frequency and accuracy around an individual preferred cadence [Jordan et al., 2007]. Deviations from this preferred frequency would force subjects to adopt different strategies to match the stimulus pace and thus subjects' performance will reflect the capabilities of the adaptation mechanisms for the motor control [Day and Marsden, 1982; Harris and Wolpert, 1998]. The stable (predictive) mode of operation could be associated with the adoption of a more optimal or natural strategy than the anticipatory (reactive) mode employed during the lowest stepping frequency. As a result, the effect of frequency on the subjects' performance suggests the existence of two distinct strategies in the motor coordination of visually guided stepping movements. Such control modes have been reported previously representing stable states of the oculo‐motor system [Shelhamer and Joiner, 2003] related with the perception of motion, and also during finger tapping induced by auditory stimuli [Joiner et al., 2007; Kadota et al., 2004 ]. Motor responses to a visual stimulus usually tend to precede unconsciously the stimulus depending on interval duration [Aschersleben, 2002; Klemmer, 1957 ]. The negative mean asynchrony [Repp, 2005], or delay between motor responses (taps) and stimulus onsets (clicks) represents a stability index [Repp and Su, 2013] which has been demonstrated to be larger for foot than for manual tapping [Aschersleben and Prinz, 1995; Fraisse, 1966 ]. As a consequence, these delays result in lack of coordination [Smethurst and Carson, 2003] which may not originate in the movements themselves but may arise at perceptual or cognitive level [Semjen and Ivry, 2001] and possibly managed by a central mechanism of sensorimotor integration [Aschersleben, 2002; Chen et al., 2002; Repp, 2005].
Neural Correlates of Stepping
In this work we have examined the neural correlates of stepping in humans at different paces while employing visual stimulation and fMRI. Generally, stepping evoked similar BOLD activation and deactivation responses in the different conditions reflecting a common lower limb pattern across frequencies (Fig. 3). The brain activation pattern included regions in the primary motor, sensorimotor and cingulate cortices, basal ganglia, and cerebellum which have been previously reported in fMRI studies on lower limb coordination [Jaeger et al., 2014; Martínez et al., 2014; Sahyoun et al., 2004; Swinnen et al., 2010] and PET studies on gait [la Fougere et al., 2010]. Bilateral activations in the frontal and parietal lobes indicate the participation of “top‐down” and “bottom‐up” attention mechanisms intrinsic to goal‐directed behavior, areas that are assumed to be participating in continuous association with the motor cerebellum [Ito, 2008]. On the other hand, stepping‐induced deactivations were found in regions of the default mode network (DMN) as well as in the inferior–posterior cerebellum, pontine tegmentum, brainstem, which may support interval (duration‐based) timing functions [Teki et al, 2011] and in the inferior and rostral temporal lobe including parahippocampal regions, which is supposed to control the perceived position of the visual stimulus [Fischer et al. 2011; Lee et al. 2006 ]. Note that the motor rest condition of the design involved visual attention to the rhythmic stepping visual guide. We interpret the deactivations during stepping movements with respect to the motor rest condition as a reduction of the cerebellar activity during visual attention to movement [Kellermann, et al., 2012].
BOLD deactivation—or negative BOLD response (NBR)—is a focus of current research as it provides a mean of probing the functionality of the resting state of the human brain [Gusnard and Raichle, 2001]. Classically, fMRI research routinely discount NBR regions because its neurophysiological origin remains misunderstood and thus, they are harder to characterize. Despite such controversies on its origin, recently it has been suggested that the NBR may originate from a different neurovascular coupling mechanism to the positive BOLD responses [Goense et al., 2012; Mullinger et al., 2014]. More concretely, works on visual‐processing indicate that the NBR could carry meaningful information about the task‐related stimulus during sustained sensorimotor processing [Bressler et al., 2007], or suppressive effects of spatial attention [Gouws et al., 2014].
Effects of Frequency on the BOLD Response
Localized effects of frequency on the BOLD response were found in the deactivation patterns in parietal and paravermal cerebellar regions (Fig. 4). Improvement in motor performance has been associated with a decrease in cerebellar activation [Flament et al., 1996]. In this work, a linear relationship has been found between the cerebellum BOLD deactivation pattern and frequency, which suggests an improvement in motor performance while increasing frequency. Functional studies have shown that the medial posterior cerebellum plays an important role in fine motor coordination during bimanual tasks [Debaere et al., 2004; Miall et al., 2001; Pollok et al., 2008; Ullén et al., 2004 ], imagine locomotive tasks [Jahn et al., 2008] and also in real locomotion recordings using FDG‐PET [la Fougere et al., 2010]. Moreover, electrical stimulation in this region has also evoked ipsilateral responses on the lower limbs in humans [Mottolese et al., 2013]. In contrast, significant deactivation was found during the fastest pace in the precuneus, which is functionally associated with the online processing of somatosensory information required for movement guidance [Bakker et al., 2008; Desmurget et al., 2001; Rizzolatti et al., 1998] and with the storage of spatiotemporal relationships between effectors [Swinnen et al., 2010]. These evidences indicate that parietal and cerebellar regions participate in a distinct manner in the visuomotor transformations required to maintain a successful coordination pattern while stepping at different pace and thus, might be essential in the sensorimotor adaptation of locomotor movements. Finally, their role could be related with the optimization of the internal feedback‐loops to continuously adapt motion at different frequencies [Desmurget and Grafton, 2000; Miall et al., 2001].
Neural Correlates of Precision and Stability
To further examine individual sensorimotor synchronization of the lower limbs at different paces, we have employed concurrent kinematic measures. The neural correlates of precision in motor performance were revealed trough the DS regressor, representing the degree of temporal delay between the stepping movements and the visual pace. We only observed regions showing a positive linear correlation between their BOLD activity and the DS (Fig. 5 and Table 3). A positive correlation implies that subjects that anticipate their movement with respect to the stimulus recruit greater neural activity in certain areas which is proportional to the magnitude of the anticipation. Neural responses related with anticipations were shown in the right insula, right cerebellum lobule (IV/V), left dorsolateral pontine tegmentum in the midbrain (corresponding to the medial lemniscus) and bilateral inferior olive at the medullar pyramids level. The anterior insula has been proposed as an integrator center involved in visuospatial attention [Gitelman et al., 1999; Kim et al., 1999; Nobre et al., 1997], being a component of the salience network during the control of oriented actions [Menon and Uddin, 2010] and representing a bottom‐up control mechanism during the spontaneous stimulus orientation [Hahn et al., 2006]. The cerebellum is not just a motor control center [Manto et al. 2012] but is also related to perceptual processing and cognitive functions [Buckner, 2013; Koziol et al. 2014; Timmann and Daum, 2010]. The cerebellar vermis has been related with visuo‐spatial functions [Molinari et al., 2007; Stoodley and Schmahmann, 2009]. In fMRI studies, activations located in midbrain regions are difficult to localize with precision. However, the dorsolateral pons includes fibers from the medial lemniscus ascending to the lateral ventroposterior nucleus (VLP) of the thalamus which projects somatotopically to areas in the postcentral gyrus, the primary somatosensory cortex [Steinbusch and Nieuwenhuys, 1983]. Electrophysiological studies in cats have shown responses in the olivary neurons during visual [Simpson et al., 1996] and somatosensory stimulation [Bloedel and Ebner, 1984; Simpson, 1984]. The inferior olivary nucleus is a main input of the cerebellum and provides the sole origin of climbing fibers. Computational models have suggested that the inferior olivary nuclei are responsible for the computation of error signals which are derived by comparing the outputs of a controlled object with those of its forward model, when both are responding to common command signals [Ito, 2008; Kawato and Gomi, 1992; Llinas, 2009]. Thus, these studies have attributed a role of the inferior olivary nucleus associated with motor coordination, temporal processing and with the reorganization of continuous movement when a motor error is produced during execution. In line with these evidences, fMRI studies have indicated a fundamental role of the inferior olive in the codification of temporal information independently of the motor action [Xu et al., 2006] and also independently of awareness [Wu et al., 2010]. According to our results, it is suggested that the participation of the right insula, left DL pons, anterior vermis, and inferior olives could contribute to the synchronization between proprioceptive and visual codes and thus might be essential for the visuomotor adjustments performed during bilateral synchronized movements. Moreover, we propose that the activation of these regions is more related to the proprioceptive information computed from the repetitive movements than to the visual matching from the ocular movements, because the visual guide is synchronous, so this source should not evoke significant adjustments.
The neural correlates of stability in motor performance were revealed through the CV regressor, a normalized measure of cadence variability. We found a distributed network (Fig. 6 and Table 4) including several cortical and subcortical regions whose BOLD activity correlated positively and negatively with the pace stability. The functional responses were colocalized with centers identified in animal studies [Mori et al., 2004] and imagination tasks [Jahn et al., 2008] previously attributed to the control of locomotion and could be related with the higher and lower‐order subsystems involved in the initiation and regulation of posture and locomotion [Mori et al., 2000].
On the one hand, neural responses with positive correlation were localized in the right calcarine, right superior temporal, left lingual, left fusiform, left hyppocampus, left reticular nucleus and left prefrontal thalamus extended to the left caudate nucleus, right subthalamic nucleus extending to substantia nigra, left cerebellar vermis (IV/V), right cerebellum Crus I and Crus II, and bilateral inferior olive. The activation pattern of these regions correlated positively with the pace variability. Thus, maximal activations in these areas might be expected during an unstable motor performance, where there is a need to estimate the consequence of personal actions [Massion, 1992], a process that requires internal models to capture the causal relationship of actions by computing an efferent copy [Ito, 2008]. This fact is consistent with the difficulties of locomotor adaptability found in cerebellar patients during treadmill locomotion, which are capable of performing reactive feedback‐driven motor adaptations, but have significantly disruptions in their predictive adaptations [Morton and Bastian, 2006]. This result confirms that the control of ongoing gait strongly depend on subcortical automatisms [Koenraadt et al., 2014].
In contrast, neural responses with negative correlation included the right middle and inferior frontal gyri, left pre‐SMA, left SMA, bilateral primary motor cortex, left postcentral gyrus, left superior temporal gyrus (STG) and right superior parieto‐occipital gyrus. The negative correlation between the activation pattern and the pace variability found in these regions indicate an opposition to stability decreases with maximal activations during a stable performance. The STG neurons receive both inputs from the visual ventral and dorsal stream, and are sensitive to movement and responsive to visual, somatosensory and/or auditory input [Karnath, 2001; Oram and Perrett, 1994]. The SMA is a key area for the performance of sequential movements which require precise timing [Van Mier et al., 1998]. Increased activity in the dorsolateral prefrontal cortex has been observed during the early phases of learning related to the establishment of a novel association between the visual cues presented and motor commands. However, its activation has been confirmed in the advanced stages of learning [Halsband and Lange, 2006]. Previous studies on treadmill walking and NIRS have also proved prominent activity in prefrontal regions when adjusting the locomotor speed during the adaptation to running [Suzuki et al., 2004]. These results confirm the existence of different zones of the brain involved in cognitive aspects of visuo‐spatial navigation and timing [Kellerman, 2012]. Accordingly, we suggest that during visually‐guided lower‐limbs movements, human brain activity is differentially modulated across stable and unstable performances. In non‐natural locomotor modes, a unstable/reactive strategy could be based on higher reliance on primary visuo‐spatial and primitive motor related regions (i.e., ventral visual stream, automatisms); whereas in natural locomotor modes, a stable/reactive strategy could depend more on superior executive, timing and cortical motor processes (i.e., dorsal visual stream, primary motor regions).
In this work, we have explored the brain architecture responsible for the adaptation abilities of the human locomotor system across a comfortable visually guided range of paces in young and healthy controls. In movement disorders such as Parkinson's disease and cerebellar patients, the use of effective external stimuli has been proposed to reduce the motor control deficits produced by the disorder [Bunn et al., 2015; Cunnington et al., 1995; Hanakawa, 2006; Rochester et al., 2005]. Thus, the knowledge of the brain function during stepping movements in the healthy population allows not only to understand the locomotor function under normal conditions but more importantly would allow to clarify the neural deficits shown by pathological populations suffering from gait disorders. Related with this, current neuroimaging connectivity techniques may be useful to reveal the neural interaction patterns involved in the sensorimotor adaptation processes related with lower‐limb movements in normal and pathological populations.
CONCLUSION
During the synchronization of anti‐phase stepping movements with visual stimulation in a range of frequencies between 0.8 and 1.75 Hz, a transition occurs in motor performance: from anticipatory/unstable at slower paces to predictive/stable at faster paces. BOLD signal changes related with this transition may be located in parietal and cerebellar regions, which according to classical computational motor schemes are involved in internal models formation through learning processes and might be essential to transit from reactive to predictive motor strategies.
Supporting information
Supporting Information
ACKNOWLEDGMENTS
We are very grateful to Dr. Jose Luis Lanciego and Luis Eudave MD, for their suggestions on the manuscript. Conflict of interest: The authors declare no competing financial interests.
Corrections added on 19 February 2016, after first online publication.
REFERENCES
- Abe K, Asai Y, Matsuo Y, Nomura T, Sato S, Inoue S, Mizukura I, Sakoda S (2003): Classifying lower limb dynamics in Parkinson's disease. Brain Res Bull 61:219–226. [DOI] [PubMed] [Google Scholar]
- Armstrong DM (1988): The supraspinal control of mammalian locomotion. J Physiol 405:1–37. [DOI] [PMC free article] [PubMed] [Google Scholar]
- Aschersleben G (2002): Temporal control of movements in sensorimotor synchronization. Brain Cogn 48:66–79. [DOI] [PubMed] [Google Scholar]
- Aschersleben G, Prinz W (1995): Synchronizing actions with events: The role of sensory information. Percept Psychophys 57:305–317. [DOI] [PubMed] [Google Scholar]
- Aznárez‐Sanado M, Fernández‐Seara MA, Loayza FR, Pastor MA (2013): Functional asymmetries in early learning during right, left, and bimanual performance in right‐handed subjects. J Magn Reson Imaging 37:619–631. [DOI] [PubMed] [Google Scholar]
- Bakker M, De Lange F, Helmich RC, Scheeringa R, Bloem BR, Toni I (2008): Cerebral correlates of motor imagery of normal and precision gait. Neuroimage 41:998–1010. [DOI] [PubMed] [Google Scholar]
- Bloedel JR, Ebner TJ (1984): Rhythmic discharge of climbing fibre afferents in response to natural peripheral stimuli in the cat. J Physiol 352:129–146. [DOI] [PMC free article] [PubMed] [Google Scholar]
- Bressler D, Spotswood N, Whitney D (2007): Negative BOLD fMRI response in the visual cortex carries precise stimulus‐specific information. PLoS One 2:e410 [DOI] [PMC free article] [PubMed] [Google Scholar]
- Bunn LM, Marsden JF, Voyce DC, Giunti P, Day BL (2015): Sensorimotor processing for balance in spinocerebellar ataxia type 6. Mov Disord 30:1259–1266. [DOI] [PMC free article] [PubMed] [Google Scholar]
- Cavagna G (2006): The landing–take‐off asymmetry in human running. J Exp Biol 209:4051–4060. [DOI] [PubMed] [Google Scholar]
- Chen Y, Repp BH, Patel AD (2002): Spectral decomposition of variability in synchronization and continuation tapping: Comparisons between auditory and visual pacing and feedback conditions. Hum Mov Sci 21:515–532. [DOI] [PubMed] [Google Scholar]
- Coull JT, Cheng RK, Meck WH (2011): Neuroanatomical and neurochemical substrates of timing. Neuropsychopharmacology 36:3–25. [DOI] [PMC free article] [PubMed] [Google Scholar]
- Cunnington R, Iansek R, Bradshaw JL, Phillips JG (1995): Movement‐related potentials in Parkinson's disease. Brain 118:935–950. [DOI] [PubMed] [Google Scholar]
- Dassonville P, Lewis S, Zhu XH, Uğurbil K, Kim SG, Ashe J (1998): Effects of movement predictability on cortical motor activation. Neurosci Res 32:65–74. [DOI] [PubMed] [Google Scholar]
- Day B, Marsden C (1982): Two strategies for learning a visually guided motor task. Percept Mot Skills 55:1003–1016. [DOI] [PubMed] [Google Scholar]
- Debaere F, Wenderoth N, Sunaert S, Van Hecke P, Swinnen S (2004): Cerebellar and premotor function in bimanual coordination: Parametric neural responses to spatiotemporal complexity and cycling frequency. Neuroimage 21:1416–1427. [DOI] [PubMed] [Google Scholar]
- Desmurget M, Grafton S (2000): Forward modeling allows feedback control for fast reaching movements. Trends Cogn Sci 4:423–431. [DOI] [PubMed] [Google Scholar]
- Desmurget M, Gréa H, Grethe JS, Prablanc C, Alexander GE, Grafton ST (2001): Functional anatomy of nonvisual feedback loops during reaching: A positron emission tomography study. J Neurosci 21:2919–2928. [DOI] [PMC free article] [PubMed] [Google Scholar]
- Diedrichsen J, Hashambhoy Y, Rane T, Shadmehr R (2005): Neural correlates of reach errors. J Neurosci 25:9919–9931. [DOI] [PMC free article] [PubMed] [Google Scholar]
- Diedrichsen J, Balsters JH, Flavell J, Cussans E, Ramnani N (2009): A probabilistic MR atlas of the human cerebellum. Neuroimage 46:39–46. [DOI] [PubMed] [Google Scholar]
- Dietz V (2003): Spinal cord pattern generators for locomotion. Clin Neurophysiol 114:1379–1389. [DOI] [PubMed] [Google Scholar]
- Drew T, Prentice S, Schepens B (2004): Cortical and brainstem control of locomotion. Prog Brain Res 143:251–261. [DOI] [PubMed] [Google Scholar]
- Eickhoff SB, Stephan KE, Mohlberg H, Grefkes C, Fink GR, Amunts K, Zilles K (2005): A new SPM toolbox for combining probabilistic cytoarchitectonic maps and functional imaging data. Neuroimage 25:1325–1335. [DOI] [PubMed] [Google Scholar]
- Fernández‐Seara MA, Aznárez‐Sanado M, Mengual E, Loayza FR, Pastor MA (2009): Continuous performance of a novel motor sequence leads to highly correlated striatal and hippocampal perfusion increases. Neuroimage 47:1797–1808. [DOI] [PubMed] [Google Scholar]
- Fischer J, Spotswood N, Whitney D (2011): The emergence of perceived position in the visual system. J Cogn Neurosci 23:119–136. [DOI] [PMC free article] [PubMed] [Google Scholar]
- Fitts PM (1954): The information capacity of the human motor system in controlling the amplitude of movement. J Exp Psychol 47:381. [PubMed] [Google Scholar]
- Flament D, Ellermann JM, Kim SG, Uğurbil K, Ebner TJ (1996): Functional magnetic resonance imaging of cerebellar activation during the learning of a visuomotor dissociation task. Hum Brain Mapp 4:210–226. [DOI] [PubMed] [Google Scholar]
- Fonov V, Evans AC, Botteron K, Almli CR, McKinstry RC, Collins DL (2011): Unbiased average age‐appropriate atlases for pediatric studies. NeuroImage 54:313–327. [DOI] [PMC free article] [PubMed] [Google Scholar]
- Fraisse P (1966): L'anticipation de stimulus rythmiques. Vitesse d'établissement et précision de la synchronisation. L'Année Psychologique 66:15–36. [PubMed] [Google Scholar]
- Friston K, Frith C, Turner R, Frackowiak R (1995): Characterizing evoked hemodynamics with fMRI. Neuroimage 2:157–165. [DOI] [PubMed] [Google Scholar]
- Friston KJ, Williams S, Howard R, Frackowiak RS, Turner R (1996): Movement‐related effects in fMRI time‐series. Magn Reson Med 35:346–355. [DOI] [PubMed] [Google Scholar]
- Gitelman DR, Nobre AC, Parrish TB, LaBar KS, Kim YH, Meyer JR, Mesulam MM (1999): A large‐scale distributed network for covert spatial attention Further anatomical delineation based on stringent behavioural and cognitive controls. Brain 122:1093–1106. [DOI] [PubMed] [Google Scholar]
- Goense J, Merkle H, Logothetis NK (2012): High‐resolution fMRI reveals laminar differences in neurovascular coupling between positive and negative BOLD responses. Neuron 76:629–639. [DOI] [PMC free article] [PubMed] [Google Scholar]
- Gouws AD, Alvarez I, Watson DM, Uesaki M, Rogers J, Morland AB (2014): On the role of suppression in spatial attention: Evidence from negative BOLD in human subcortical and cortical structures. J Neurosci 34:10347–10360. [DOI] [PMC free article] [PubMed] [Google Scholar]
- Grillner S, Wallen P (1985): Central pattern generators for locomotion, with special reference to vertebrates. Annu Rev Neurosci 8:233–261. [DOI] [PubMed] [Google Scholar]
- Gusnard DA, Raichle ME (2001): Searching for a baseline: Functional imaging and the resting human brain. Nat Rev Neurosci 2:685–694. [DOI] [PubMed] [Google Scholar]
- Hahn B, Ross TJ, Stein EA (2006): Neuroanatomical dissociation between bottom–up and top–down processes of visuospatial selective attention. Neuroimage 32:842–853. [DOI] [PMC free article] [PubMed] [Google Scholar]
- Halsband U, Lange RK (2006): Motor learning in man: A review of functional and clinical studies. J Physiol Paris 99:414–424. [DOI] [PubMed] [Google Scholar]
- Hanakawa T (2006): Neuroimaging of standing and walking: Special emphasis on Parkinsonian gait. Parkinsonism Related Disord 12:S70–S75. [Google Scholar]
- Harris CM, Wolpert DM (1998): Signal‐dependent noise determines motor planning. Nature 394:780–784. [DOI] [PubMed] [Google Scholar]
- Hausdorff JM, Peng C, Ladin Z, Wei JY, Goldberger AL (1995): Is walking a random walk? Evidence for long‐range correlations in stride interval of human gait. J Appl Physiol 78:349–358. [DOI] [PubMed] [Google Scholar]
- Hétu S, Grégoire M, Saimpont A, Coll MP, Eugène F, Michon PE, Jackson PL (2013): The neural network of motor imagery: An ALE meta‐analysis. Neurosci Biobehav Rev 37:930–949. [DOI] [PubMed] [Google Scholar]
- Ito M (2008): Control of mental activities by internal models in the cerebellum. Nat Rev Neurosci 9:304–313. [DOI] [PubMed] [Google Scholar]
- Ivry RB, Schlerf JE (2008): Dedicated and intrinsic models of time perception. Trends Cogn Sci 12:273–280. [DOI] [PMC free article] [PubMed] [Google Scholar]
- Jaeger L, Marchal‐Crespo L, Wolf P, Riener R, Michels L, Kollias S (2014): Brain activation associated with active and passive lower limb stepping. Front Hum Neurosci 8:828. [DOI] [PMC free article] [PubMed] [Google Scholar]
- Jahanshahi M, Jenkins IH, Brown RG, Marsden CD, Passingham RE, Brooks DJ (1995): Self‐initiated versus externally triggered movements. Brain 118:913–933. [DOI] [PubMed] [Google Scholar]
- Jahn K, Deutschländer A, Stephan T, Strupp M, Wiesmann M, Brandt T (2004): Brain activation patterns during imagined stance and locomotion in functional magnetic resonance imaging. Neuroimage 22:1722–1731. [DOI] [PubMed] [Google Scholar]
- Jahn K, Deutschländer A, Stephan T, Kalla R, Wiesmann M, Strupp M, Brandt T (2008): Imaging human supraspinal locomotor centers in brainstem and cerebellum. Neuroimage 39:786–792. [DOI] [PubMed] [Google Scholar]
- Jäncke L, Loose R, Lutz K, Specht K, Shah NJ (2000): Cortical activations during paced finger‐tapping applying visual and auditory pacing stimuli. Cogn Brain Res 10:51–66. [DOI] [PubMed] [Google Scholar]
- Joiner WM, Lee JE, Lasker A, Shelhamer M (2007): An internal clock for predictive saccades is established identically by auditory or visual information. Vision Res 47:1645–1654. [DOI] [PMC free article] [PubMed] [Google Scholar]
- Jordan K, Challis JH, Newell KM (2007): Walking speed influences on gait cycle variability. Gait Posture 26:128–134. [DOI] [PubMed] [Google Scholar]
- Kadota H, Kudo K, Ohtsuki T (2004): Time‐series pattern changes related to movement rate in synchronized human tapping. Neurosci Lett 370:97–101. [DOI] [PubMed] [Google Scholar]
- Kang HG, Dingwell JB (2008): Separating the effects of age and walking speed on gait variability. Gait Posture 27:572–577. [DOI] [PubMed] [Google Scholar]
- Karachi C, André A, Bertasi E, Bardinet E, Lehéricy S, Bernard FA (2012): Functional parcellation of the lateral mesencephalus. J Neurosci 32:9396–9401. [DOI] [PMC free article] [PubMed] [Google Scholar]
- Karnath HO (2001): New insights into the functions of the superior temporal cortex. Nat Rev Neurosci 2:568–576. [DOI] [PubMed] [Google Scholar]
- Kawashima R, Roland PE, O'sullivan BT (1994): Fields in human motor areas involved in preparation for reaching, actual reaching, and visuomotor learning: A positron emission tomography study. J Neurosci 14:3462–3474. [DOI] [PMC free article] [PubMed] [Google Scholar]
- Kawato M, Gomi H (1992): A computational model of four regions of the cerebellum based on feedback‐error learning. Biol Cybern 68:95–103. [DOI] [PubMed] [Google Scholar]
- Kellermann T, Regenbogen C, De Vos M, Mößnang C, Finkelmeyer A, Habel U (2012): Effective connectivity of the human cerebellum during visual attention. J Neurosci 32:11453–11460. [DOI] [PMC free article] [PubMed] [Google Scholar]
- Kelso J, Scholz J, Schöner G (1986): Nonequilibrium phase transitions in coordinated biological motion: Critical fluctuations. Phys Lett A 118:279–284. [Google Scholar]
- Kim YH, Gitelman DR, Nobre AC, Parrish TB, LaBar KS, Mesulam MM (1999): The large‐scale neural network for spatial attention displays multifunctional overlap but differential asymmetry. Neuroimage 9:269–277. [DOI] [PubMed] [Google Scholar]
- Klemmer E (1957): Rhythmic disturbances in a simple visual‐motor task. Am J Psychol 70:56–63. [PubMed] [Google Scholar]
- Koenraadt KL, Roelofsen EG, Duysens J, Keijsers NL (2014): Cortical control of normal gait and precision stepping: An fNIRS study. Neuroimage 85:415–422. [DOI] [PubMed] [Google Scholar]
- Koziol LF, Budding D, Andreasen N, D'Arrigo S, Bulgheroni S, Imamizu H, M Ito, M Manto, C Marvel, K Parker, G Pezzulo, N Ramnani, D Riva, J Schmahmann, L Vandervert, Yamazaki T (2014): Consensus paper: The cerebellum's role in movement and cognition. Cerebellum 13:151–177. [DOI] [PMC free article] [PubMed] [Google Scholar]
- Krings T, Töpper R, Foltys H, Erberich S, Sparing R, Willmes K, Thron A (2000): Cortical activation patterns during complex motor tasks in piano players and control subjects. A functional magnetic resonance imaging study. Neurosci Lett 278:189–193. [DOI] [PubMed] [Google Scholar]
- la Fougere C, Zwergal A, Rominger A, Förster S, Fesl G, Dieterich M, Brandt T, Strupp M, Bartenstein P, Jahn K (2010): Real versus imagined locomotion: A F‐FDG PET‐fMRI comparison. Neuroimage 50:1589–1598. [DOI] [PubMed] [Google Scholar]
- Lau B, Welter ML, Belaid H, Vidal SF, Bardinet E, Grabli D, Karachi C (2015): The integrative role of the pedunculopontine nucleus in human gait. Brain 138:1284–1296. [DOI] [PMC free article] [PubMed] [Google Scholar]
- Lee AC, Bandelow S, Schwarzbauer C, Henson RN, Graham KS (2006): Perirhinal cortex activity during visual object discrimination: An event‐related fMRI study. Neuroimage 33:362–373. [DOI] [PubMed] [Google Scholar]
- Llinas R (2009): Inferior olive oscillation as the temporal basis for motricity and oscillatory reset as the basis for motor error correction. Neuroscience 162:797–804. [DOI] [PMC free article] [PubMed] [Google Scholar]
- Lund TE, Madsen KH, Sidaros K, Luo WL, Nichols TE (2006): Non‐white noise in fMRI: Does modelling have an impact? Neuroimage 29:54–66. [DOI] [PubMed] [Google Scholar]
- Manto M, Bower JM, Conforto AB, Delgado‐García JM, da Guarda SNF, Gerwig M, Timmann D (2012): Consensus paper: Roles of the cerebellum in motor control—the diversity of ideas on cerebellar involvement in movement. Cerebellum 11:457–487. [DOI] [PMC free article] [PubMed] [Google Scholar]
- Martínez M, Villagra F, Loayza F, Vidorreta M, Arrondo G, Luis E, Diaz J, Echeverria M, Fernández‐Seara MA, Pastor MA (2014): MRI‐compatible device for examining brain activation related to stepping. IEEE Trans Med Imaging 33:1044–1053. [DOI] [PubMed] [Google Scholar]
- Massion J (1992): Movement, posture and equilibrium: Interaction and coordination. Prog Neurobiol 38:35–56. [DOI] [PubMed] [Google Scholar]
- Mazaika PK, Hoeft F, Glover G, Reiss AL (2009): Methods and software for fMRI analysis of clinical subjects. Neuroimage 47:S58 [Google Scholar]
- Menon V, Uddin LQ (2010): Saliency, switching, attention and control: A network model of insula function. Brain Struct Funct 214:655–667. [DOI] [PMC free article] [PubMed] [Google Scholar]
- Miall R, Reckess G, Imamizu H (2001): The cerebellum coordinates eye and hand tracking movements. Nat Neurosci 4:638–644. [DOI] [PubMed] [Google Scholar]
- Molinari M, Leggio MG, Thaut MH (2007): The cerebellum and neural networks for rhythmic sensorimotor synchronization in the human brain. Cerebellum 6:18–23. [DOI] [PubMed] [Google Scholar]
- Mori S (1987): Integration of posture and locomotion in acute decerebrate cats and in awake, freely moving cats. Prog Neurobiol 28:161–195. [DOI] [PubMed] [Google Scholar]
- Mori S, Matsui T, Kuze B, Asanome M, Nakajima K, Matsuyama K (1999): Stimulation of a restricted region in the midline cerebellar white matter evokes coordinated quadrupedal locomotion in the decerebrate cat. J Neurophysiol 82:290–300. [DOI] [PubMed] [Google Scholar]
- Mori S, Matsui T, Mori F, Nakajima K, Matsuyama K (2000): Instigation and control of treadmill locomotion in high decerebrate cats by stimulation of the hook bundle of Russell in the cerebellum. Can J Physiol Pharmacol 78:945–957. [PubMed] [Google Scholar]
- Mori S, Nakajima K, Mori F, Matsuyama K (2004): Integration of multiple motor segments for the elaboration of locomotion: Role of the fastigial nucleus of the cerebellum. Prog Brain Res 143:341–351. [DOI] [PubMed] [Google Scholar]
- Morton SM, Bastian AJ (2006): Cerebellar contributions to locomotor adaptations during splitbelt treadmill walking. J Neurosci 26:9107–9116. [DOI] [PMC free article] [PubMed] [Google Scholar]
- Mottolese C, Richard N, Harquel S, Szathmari A, Sirigu A, Desmurget M (2013): Mapping motor representations in the human cerebellum. Brain 136:330–342. [DOI] [PubMed] [Google Scholar]
- Mullinger K, Mayhew S, Bagshaw A, Bowtell R, Francis S (2014): Evidence that the negative BOLD response is neuronal in origin: A simultaneous EEG–BOLD–CBF study in humans. NeuroImage 94:263–274. [DOI] [PubMed] [Google Scholar]
- Noble M, Fitts PM, Warren CE (1955): The frequency response of skilled subjects in a pursuit tracking task. J Exp Psychol 49:249 [DOI] [PubMed] [Google Scholar]
- Nobre AC, Sebestyen GN, Gitelman DR, Mesulam MM, Frackowiak RSJ, Frith CD (1997): Functional localization of the system for visuospatial attention using positron emission tomography. Brain 120:515–533. [DOI] [PubMed] [Google Scholar]
- Oldfield RC (1971): The assessment and analysis of handedness: The Edinburgh inventory. Neuropsychologia 9:97–113. [DOI] [PubMed] [Google Scholar]
- Oram M, Perrett D (1994): Responses of anterior superior temporal polysensory (STPa) neurons to “biological motion” stimuli. J Cogn Neurosci 6:99–116. [DOI] [PubMed] [Google Scholar]
- Penny WD, Holmes A, Friston K (2003): Random effects analysis. Hum Brain Funct 2:843–850. [Google Scholar]
- Plotnik M, Bartsch RP, Zeev A, Giladi N, Hausdorff JM (2013): Effects of walking speed on asymmetry and bilateral coordination of gait. Gait Posture 38:864–869. [DOI] [PMC free article] [PubMed] [Google Scholar]
- Pollok B, Gross J, Kamp D, Schnitzler A (2008): Evidence for anticipatory motor control within a cerebello‐diencephalic‐parietal network. J Cogn Neurosci 20:828–840. [DOI] [PubMed] [Google Scholar]
- Rao SM, Harrington DL, Haaland KY, Bobholz JA, Cox RW, Binder JR (1997): Distributed neural systems underlying the timing of movements. J Neurosci 17:5528–5535. [DOI] [PMC free article] [PubMed] [Google Scholar]
- Repp BH (2005): Sensorimotor synchronization: A review of the tapping literature. Psychonom Bull Rev 12:969–992. [DOI] [PubMed] [Google Scholar]
- Repp BH, Su YH (2013): Sensorimotor synchronization: A review of recent research (2006–2012). Psychonom Bull Rev 20:403–452. [DOI] [PubMed] [Google Scholar]
- Rizzolatti G, Luppino G, Matelli M (1998): The organization of the cortical motor system: New concepts. Electroencephalogr Clin Neurophysiol 106:283–296. [DOI] [PubMed] [Google Scholar]
- Rochester L, Hetherington V, Jones D, Nieuwboer A, Willems AM, Kwakkel G, Van Wegen E (2005): The effect of external rhythmic cues (auditory and visual) on walking during a functional task in homes of people with Parkinson's disease. Arch Phys Med Rehabil 86:999–1006. [DOI] [PubMed] [Google Scholar]
- Rossignol S, Dubuc R, Gossard JP (2006): Dynamic sensorimotor interactions in locomotion. Physiol Rev 86:89–154. [DOI] [PubMed] [Google Scholar]
- Sahyoun C, Floyer‐Lea A, Johansen‐Berg H, Matthews P (2004): Towards an understanding of gait control: Brain activation during the anticipation, preparation and execution of foot movements. Neuroimage 21:568–575. [DOI] [PubMed] [Google Scholar]
- Schöner G, Jiang WY, Kelso JS (1990): A synergetic theory of quadrupedal gaits and gait transitions. J Theor Biol 142:359–391. [DOI] [PubMed] [Google Scholar]
- Semjen A, Ivry RB (2001): The coupled oscillator model of between‐hand coordination in alternate‐hand tapping: A reappraisal. J Exp Psychol Hum Percept Perform 27:251–265. [DOI] [PubMed] [Google Scholar]
- Shelhamer M, Joiner WM (2003): Saccades exhibit abrupt transition between reactive and predictive, predictive saccade sequences have long‐term correlations. J Neurophysiol 90:2763–2769. [DOI] [PubMed] [Google Scholar]
- Simpson JI (1984): The accessory optic system. Annu Rev Neurosci 7:13–41. [DOI] [PubMed] [Google Scholar]
- Simpson J, Wylie D, De Zeeuw C (1996): On climbing fiber signals and their consequence (s). Behav Brain Sci 19:384–398. [Google Scholar]
- Smak W, Neptune R, Hull M (1999): The influence of pedaling rate on bilateral asymmetry in cycling. J Biomech 32:899–906. [DOI] [PubMed] [Google Scholar]
- Smethurst CJ, Carson RG (2003): The effect of volition on the stability of bimanual coordination. J Motor Behav 35:309–319. [DOI] [PubMed] [Google Scholar]
- Steinbusch HWM, Nieuwenhuys R (1983): The Raphe Nuclei of the Rat Brainstem: A Cytoarchitectonic and Immunohistochemical Study In: Chemical Neuroanatomy. New York: Raven Press; pp. 131–207. [Google Scholar]
- Stinear CM, Byblow WD, Steyvers M, Levin O, Swinnen SP (2006): Kinesthetic, but not visual, motor imagery modulates corticomotor excitability. Exp Brain Res 168:157–164. [DOI] [PubMed] [Google Scholar]
- Stoodley CJ, Schmahmann JD (2009): Functional topography in the human cerebellum: A meta‐analysis of neuroimaging studies. Neuroimage 44:489–501. [DOI] [PubMed] [Google Scholar]
- Suzuki M, Miyai I, Ono T, Oda I, Konishi I, Kochiyama T, Kubota K (2004): Prefrontal and premotor cortices are involved in adapting walking and running speed on the treadmill: An optical imaging study. Neuroimage 23:1020–1026. [DOI] [PubMed] [Google Scholar]
- Swinnen SP, Vangheluwe S, Wagemans J, Coxon JP, Goble DJ, Van Impe A, Sunaert S, Peeters R, Wenderoth N (2010): Shared neural resources between left and right interlimb coordination skills: The neural substrate of abstract motor representations. Neuroimage 49:2570–2580. [DOI] [PubMed] [Google Scholar]
- Teki S, Grube M, Kumar S, Griffiths TD (2011): Distinct neural substrates of duration‐based and beat‐based auditory timing. J Neurosci 31:3805–3812. [DOI] [PMC free article] [PubMed] [Google Scholar]
- Timmann D, Daum I (2010): How consistent are cognitive impairments in patients with cerebellar disorders? Behav Neurol 23:81–100. [DOI] [PMC free article] [PubMed] [Google Scholar]
- Ullén F, Forssberg H, Ehrsson HH (2004): Neural networks for the coordination of the hands in time. Cereb Cortex 14:1153–1163. [DOI] [PubMed] [Google Scholar]
- Van Mier H, Tempel L, Perlmutter J, Raichle M, Petersen S (1998): Changes in brain activity during motor learning measured with PET: Effects of hand of performance and practice. J Neurophysiol 80:2177–2199. [DOI] [PubMed] [Google Scholar]
- Wagenaar R, Van Emmerik R (2000): Resonant frequencies of arms and legs identify different walking patterns. J Biomech 33:853–861. [DOI] [PubMed] [Google Scholar]
- Wagner J, Stephan T, Kalla R, Brückmann H, Strupp M, Brandt T, Jahn K (2008): Mind the bend: Cerebral activations associated with mental imagery of walking along a curved path. Exp Brain Res 191:247–255. [DOI] [PubMed] [Google Scholar]
- Witt ST, Laird AR, Meyerand ME (2008): Functional neuroimaging correlates of finger‐tapping task variations: An ALE meta‐analysis. Neuroimage 42:343–356. [DOI] [PMC free article] [PubMed] [Google Scholar]
- Wu T, Chan P, Hallett M (2010): Effective connectivity of neural networks in automatic movements in Parkinson's disease. Neuroimage 49:2581–2587. [DOI] [PMC free article] [PubMed] [Google Scholar]
- Wuehr M, Pradhan C, Brandt T, Jahn K, Schniepp R (2014): Patterns of optimization in single‐and inter‐leg gait dynamics. Gait Posture 39:733–738. [DOI] [PubMed] [Google Scholar]
- Xu D, Liu T, Ashe J, Bushara KO (2006): Role of the olivo‐cerebellar system in timing. J Neurosci 26:5990–5995. [DOI] [PMC free article] [PubMed] [Google Scholar]
- Yakovenko S, Drew T (2009): A motor cortical contribution to the anticipatory postural adjustments that precede reaching in the cat. J Neurophysiol 102:853–874. [DOI] [PubMed] [Google Scholar]
Associated Data
This section collects any data citations, data availability statements, or supplementary materials included in this article.
Supplementary Materials
Supporting Information