

Abstract
The thalamus is a relay center between various subcortical brain areas and the cerebral cortex with delineation of its constituent nuclei being of particular interest in many applications. While previous studies have demonstrated efficacy of connectivity‐based thalamus segmentation, they used approaches that do not consider the dynamic nature of thalamo‐cortical interactions. In this study, we explicitly exploited the dynamic variation of thalamo‐cortical connections to identify different states of functional connectivity and performed state‐specific thalamus parcellation. With normalized spectral clustering successively applied in temporal and spatial domains, nine thalamo‐cortical connectivity states were identified and the dynamic thalamus parcellation revealed finer thalamic structures with improved atlas correspondence. The present results extend our understanding of thalamo‐cortical connectivity and provide a more comprehensive view of the thalamo‐cortical interaction. Hum Brain Mapp 37:954–967, 2016. © 2015 Wiley Periodicals, Inc.
Keywords: resting state, functional connectivity, thalamus, dynamic parcellation, normalized spectral clustering
Abbreviations
- AV
anteroventral nucleus
- DTI
diffusion tensor imaging
- LP
lateral posterior nucleus
- MD
mediodorsal nucleus
- PFC
prefrontal cortex
- ROIs
regions of interest
- rs‐fMRI
resting‐state functional MRI
- VA
ventral anterior nucleus
INTRODUCTION
The thalamus, located between the cerebral cortex and the midbrain, is comprised of many sub‐structures including the anteroventral nucleus (AV), ventral anterior nucleus (VA), mediodorsal nucleus (MD), ventral posterior nucleus (VP), ventral lateral nucleus (VL), lateral posterior nucleus (LP), and pluvial nuclei (Pu) [Mai et al., 1997; Morel et al., 1997; Sherman, 2006]. Functional parcellation of thalamic nuclei is of particular interest in studies of various brain disorders. For example, selective neuronal loss in the intralaminar thalamic nuclei contributes to symptoms of Parkinson's disease [Halliday, 2009]; and alterations of functional connectivity between medial/anterior/dorsal nuclei and the putamen are associated with attention deficit hyperactivity disorder [Mills et al., 2012]. Furthermore, reduced functional connectivity of the VA has been noted in patients with minimal hepatic encephalopathy [Qi et al., 2013].
Since different thalamic nuclei have highly specific connections to distinct cortical regions [Sherman, 2006], previous work on thalamus parcellation has utilized thalamo‐cortical connectivity patterns derived from diffusion tensor imaging (DTI) [Johansen‐Berg et al., 2005; Schultz, 2011; Wiegell et al., 2003; Ziyan et al., 2006] or resting‐state functional MRI (rs‐fMRI) [Fair et al., 2010; Johansen‐Berg et al., 2005; Kim et al., 2013; Zhang et al., 2008]. Despite successful parcellation reported in these studies, DTI and standard rs‐fMRI approaches only consider a static pattern of neural connectivity and assume the connections are constant over time [Cole et al., 2010]. However, given the dynamic nature of functional brain connectivity [Handwerker et al., 2012; Jones et al., 2012; Kiviniemi et al., 2011], consideration of temporal variation in functional connections may provide additional insight into neural networks as well as yield more pertinent and reliable thalamic parcellation.
In the present study, we explicitly account for the dynamic nature of thalamo‐cortical functional connectivity patterns, identifying distinct temporal and spatial connectivity patterns/states. Further, we derive state‐specific parcellations and compare reproducibility of these parcellations across groups. Specifically, we found parcellations from dynamic analysis to be more robust than static analysis. The resultant parcels, individually provide insights into the dynamic nature of thalamo‐cortical connections and, when combined, provide better correspondence with histological atlases.
MATERIALS AND METHODS
Resting‐State fMRI Data
Rs‐fMRI data were obtained from the Human Connectome Project (HCP; http://www.humanconnectomeproject.org), an open‐access repository of healthy human brain datasets [Van Essen et al., 2012]. Subjects were scanned on a customized 3T Siemens scanner (Connectome Skyra) using a standard 32‐channel head coil and a body transmission coil. Resting‐state fMRI data were collected with participants’ eyes open with instructions to fixate on a projection of a bright cross‐hair on a dark background. Images were acquired with parameters of FOV=208 × 180 mm2 (RO×PE), Matrix=104 × 90 (RO×PE), slice#=72, resolution= 2.0 mm isotropic, TE = 33.1 ms, TR = 720 ms, measurements = 1,200. The first 80 subjects (32M/48F; ages: 22–36) in the “WU‐Minn” (The Washington University and University of Minnesota) dataset were selected for use in this study.
Regions of Interest
Five cortical regions of interest (ROIs) in each hemisphere, ten in total, with connections to the thalamus were identified from a previous parcellation study [Zhang et al., 2010] and used to derive thalamo‐cortical connectivity. The chosen cortical ROIs used in the analysis were bilateral (i) prefrontal cortex (PFC), (ii) premotor cortex (PMC) plus motor cortex (MC), (iii) somatosensory cortex (SC), (iv) parietal cortex (PC) plus occipital cortex (OC), and (v) temporal cortex (TE). The thalamus was extracted from the Harvard‐Oxford subcortical structural atlas (http://fsl.fmrib.ox.ac.uk/fsl/fslwiki/Atlases ) and voxels located in ventricles or white matter regions were removed (Fig. 1).
Figure 1.
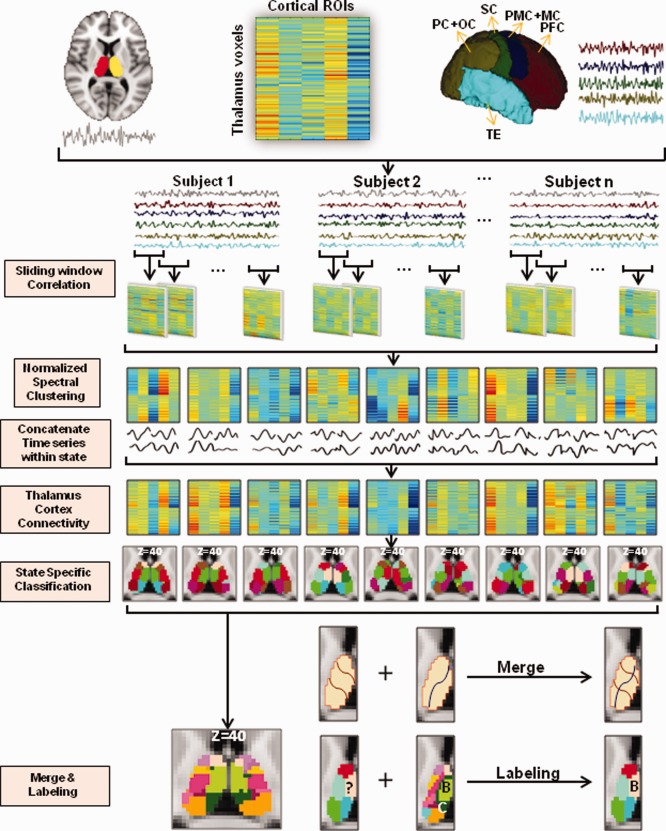
An overview of dynamic data analysis. With fMRI time series extracted from each one of the thalamus voxels and the five cortical regions, a sliding time window approach was used to derive dynamic thalamo‐cortical connectivity matrices. These matrices, gathered from each individual, were submitted to a normalized spectral clustering algorithm to define different thalamo‐cortical connectivity states. Windowed time series across all subjects were then temporally concatenated within state and the state‐specific connectivity matrices were computed for subsequent thalamus parcellation. The parcellations results were finally merged across states and labeled according to the histology atlas. PFC: prefrontal cortex; PMC: premotor cortex; MC: motor cortex; SC: somatosensory cortex; PC: parietal cortex; OC: occipital cortex; TE: temporal cortex. [Color figure can be viewed in the online issue, which is available at http://wileyonlinelibrary.com.]
Preprocessing
In addition to the standard volume‐based HCP preprocessing steps (rigid‐body motion correction, cross‐modal registration, MNI spatial transformation, denoising with the ICA‐based “fix” algorithm and regressing out nuisance signals) [Glasser et al., 2013; Salimi‐Khorshidi et al., 2014], ICA‐based “fix” algorithm was used to identify and remove artifactual components from the data [Salimi‐Khorshidi et al., 2014]. Further preprocessing steps of band‐pass filtering (0.009 Hz < f < 0.08 Hz) and spatial smoothing (FWHM = 6 mm) were applied. After these preprocessing steps, time series from each thalamus voxel and each cortical ROI were extracted for the subsequent dynamic analysis.
Dynamic Analysis Overview
This subsection provides an overview of our approach and is illustrated schematically in Figure 1. Details regarding each step are described in subsequent subsections. A sliding time window approach was applied to divide thalamus and cortex fMRI signals into windowed time series. Thalamo‐cortical connectivity matrices were then generated for each of these windows, temporally concatenated across subjects, and fed into a normalized spectral clustering algorithm. This algorithm defined different thalamo‐cortical connectivity states at the group level. Within each one of these states, windowed fMRI time series from all subjects were temporally concatenated for deriving state‐specific thalamo‐cortical connectivity matrices.
For thalamus parcellation, the same normalized spectral classifier was applied again in each state. Classifications of left and right thalamus were performed separately according to ipsilateral thalamocortical connectivity patterns. State‐specific parcellations were examined individually and then combined to produce a merged parcellation by superimposing parcel boundaries from all states. In this merged result, different subunits were labeled according to their spatial overlap with subunits in a histology atlas [Krauth et al., 2010]. For comparison purposes, static thalamus segmentation was also performed in a fashion similar to the dynamic analysis described in the subsequent section with the exception that the entire fMRI dataset was treated as a single state.
Dynamic Functional Connectivity
A sliding‐time‐window‐based approach was used to examine dynamic functional connectivity [Allen et al., 2014; Handwerker et al., 2012; Jones et al., 2012; Kiviniemi et al., 2011; Sakoğlu et al., 2010]. In each window, the signal of each thalamic voxel was partially correlated with that of each ipsilateral cortical ROI, so that a thalamo‐cortical connectivity matrix (size 1,057 × 5 and 1049 × 5 for the left and right hemispheres respectively) was derived. The partial correlation quantified the degree of association between a thalamic voxel and a specific cortical ROI with the shared correlations of other 4 cortical ROIs removed [Zhang et al., 2008]. For statistical purposes, the partial correlation coefficients were then converted to z‐scores with Fisher's r‐to‐z transformation.
Sliding Window Length
The sliding window length for dynamic connectivity analysis was determined by the measurement of modularity in network algorithm [Rubinov and Sporns, 2011]. Based on thalamo‐cortical functional connections, this algorithm calculates modularity, denoted by Q*, and suggests the optimum window length at the cutoff of Q* variance. Specifically,
where , represents the sum of positive or negative connectivity weights across row i in the connectivity matrix, is the sum over all , m and n denote total number of positive and negative weights. The modularity and its variance are plotted against different window length in Figure 2A. Based on this result, the window length in this study was set to 52 volumes or 37 seconds. Because the HCP imaging protocol provides higher temporal resolution (0.72s) than typical conventional whole‐brain fMRI, independence of TR on window length is illustrated in Figure 2B with effective TRs increased by averaging adjacent 2 (1.44s), 3 (2.16s), and 4 (2.88s) image volumes.
Figure 2.
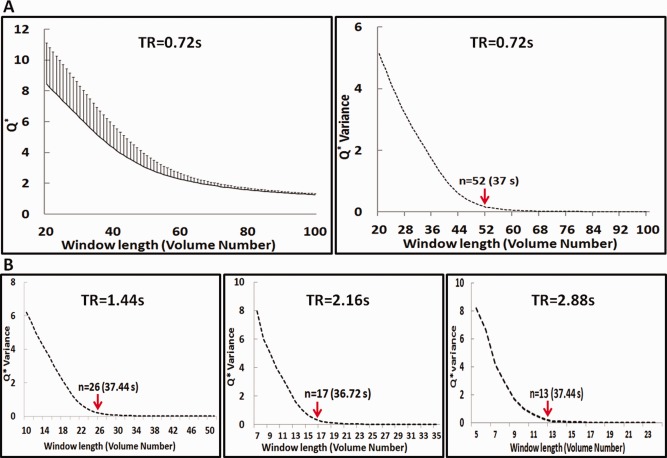
Q* and Q* Variance in 80 normal subjects. In (A), the mean and standard deviation of Q*, Q* Variance are shown. The standard deviation of Q* decreased as the window length increased. Q* Variance showed an obvious cutoff at a window length of 52 volume numbers or 37 seconds. In (B), Q* Variance on different TRs including 1.44 s, 2.16 s, and 2.88 s is shown. [Color figure can be viewed in the online issue, which is available at http://wileyonlinelibrary.com.]
Temporal Clustering
The similarity of thalamo‐cortical connectivity pattern was estimated using eta2, which is a similarity measure calculated using the following equation [Cohen et al. 2008]
where and are the values in position of matrix a and matrix b, is the mean of ai and bi, and is the grand mean value across all positions in the two matrices.
The normalized spectral clustering algorithm [Craddock et al., 2012; Ng et al., 2002; Wang et al., 2012] utilized the normalized Laplacian eigenvectors of the similarity matrix (graph) for dimensionality reduction and global optimization. These eigenvectors are further clustered to derive thalamo‐cortical connectivity states. The normalized Laplacian matrix was defined as
where , is a Laplacian matrix with the value between vertices and , is a diagonal degree matrix containing the total number of edges connected to each vertex, and is an adjacency matrix encoding the eta2 similarity between vertices and .
Prior to normalized spectral clustering, the number of clusters (k) was chosen according to the minimum ratio of within‐clustering distance to between‐clustering distance. After the group‐level connectivity states were determined, windowed fMRI signals of the same state were then concatenated across all subjects; and the connectivity matrices of each state were derived from these concatenated time series by partial correlation.
Thalamus Parcellation
Thalamus parcellation was performed on both dynamically derived and statically derived connectivity matrices. To achieve this parcellation, spatial constraints were applied to the similarity matrix of different thalamus voxels with the assumption that functional units are spatially contiguous and most connections between neurons are short range. Hence, time courses of voxels are mostly similar to their neighbors and their contralateral counterparts [Cohen et al., 2008; Janssen et al., 2015; Thirion et al., 2006; Zang et al., 2004]. Under this assumption, the similarity matrix took the form of
where the denotes the eta2 measure of connection similarity between two thalamus voxels, and dij is the Euclidean distance between them. With this neighborhood constraint applied, normalized spectral clustering was performed for state‐specific thalamus segmentations. The segmentation was carried out for the left and right hemispheres separately, with the cluster numbers were determined by the minimum ratio of within‐clustering distances to between‐clustering distances. Because the procedure of separate parcellation provided no correspondence between parcels on the two hemispheres, resultant parcels of the left and right thalamus were matched depending on similarities of their cortical connectivity patterns and finally labeled. Specifically, given N thalamic parcels in each hemisphere, an N (left) × N (right) matrix was calculated based on correlation coefficients between cortical connectivity patterns of the left and right thalamic parcels. In this matrix, the maximum entry were identified and eliminated. On each one of these eliminations, the corresponding parcels on the row (left) and on the column (right) were assigned the same label. This step was carried out successively until the entire matrix was eliminated.
Segment Merging and Labeling
Thalamus parcellation results from different states were merged into a single parcellation by superimposing segment boundaries identified in all the states. As an example, the merging of a 3‐unit parcellation with a 2‐unit parcellation, resulting in a 6‐unit parcellation is schematically demonstrated in Figure 1. After the merging procedure, the closing operation which included dilation and erosion was performed, dilation followed by erosion. The erosion assigns a voxel to zero when any voxel in its contiguity is of a different value. The dilation is a reverse process of replacing zero values to the same value of its majority neighbors. A given voxel's contiguity (neighborhood) included 6 voxels which share face with it.
Labeling of the final segments was carried out based on their spatial overlap with thalamus sub‐regions demarcated in a histology atlas [Krauth et al., 2010]. Specifically, a particular segment “A” was assigned the same label as the atlas region “B i” according to
Reproducibility
For validation of the thalamus parcellation, the nine state‐dependent parcellation results were derived from five subsamples, each containing 16 participants, for assessing reproducibility. The subsample level thalamus parcellations were achieved used virtually the same procedure applied to the full sample except that these parcellations were all initialized and constrained by the full‐sample parcellation centers. To assess the parcellation reproducibility, voxel‐wise clustering labels were correlated between the result of full‐sample parcellation and that of subsample parcellation.
RESULTS
Thalamo‐Cortical Connectivity States
As shown in the top portion of Figure 3, a total of nine thalamo‐cortical connectivity states were found using the criteria of within‐clustering distance to between‐clustering distance. These nine connectivity patterns, together with those derived from the static analysis, are shown in the bottom portion of Figure 3. The dynamic states are sorted in the order of their temporal occurrence with 13% for the state 1 (the highest) and 9% for the state 9 (the lowest).
Figure 3.
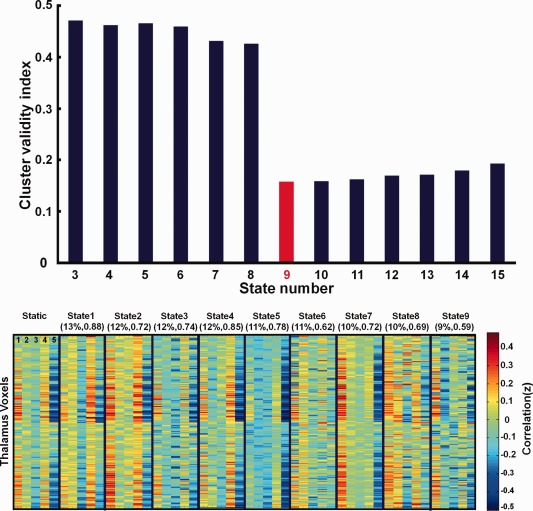
Thalamo‐cortical connectivity states. The cluster number k (from 3 to 15) was determined to be 9 (the lowest) by the criteria of within clustering distances to between clustering distances shown in the top bar graph. Connectivity patterns of the entire scan (static) as well as the 9 dynamic states are shown in the bottom matrices of 2106 thalamus voxels by 5 cortical ROIs. For each one of the dynamically derived connectivity patterns, its temporal occurrence as well as its spatial correlation with the static connectivity pattern is shown in parentheses. The five cortical regions are prefrontal cortex (1), premotor cortex and motor cortex (2), somatosensory cortex (3), parietal cortex and occipital cortex (4), temporal cortex (5).
State Specific Thalamus Segmentation Reproducibility
As shown in Figure 4, the thalamus was segmented into different numbers of parcels in different states as determined by the within‐clustering distance to between‐clustering distance criterion.
Figure 4.
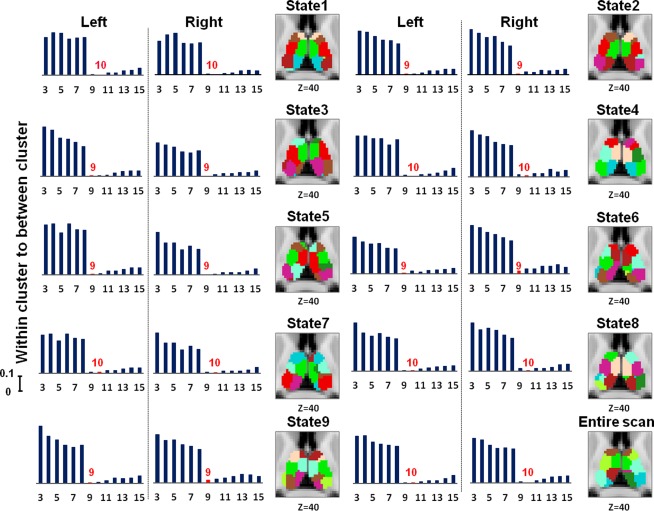
Number of thalamus subunits determined by within clustering distances to between clustering distances and the corresponding segmentation results. The color coding of thalamus subunits is independent in different states. [Color figure can be viewed in the online issue, which is available at http://wileyonlinelibrary.com.]
The mean Fisher's z scores for dynamic and static parcellation results across five subgroups are shown in Figure 5. The dynamic parcellation results, based on each of the nine states, are all significantly higher than those from the static results (pairwise t‐test p < 0.05), indicating better reproducibility of parcellation results from dynamic analysis over that from the static analysis.
Figure 5.
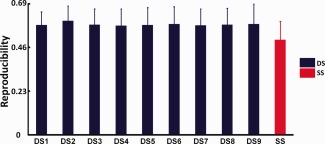
Comparison of parcellation results reproducibility across subgroups. DS1‐9: thalamus parcellation results on dynamic states of 1‐9, SS: thalamus parcellation results on static state. [Color figure can be viewed in the online issue, which is available at http://wileyonlinelibrary.com.]
State Dependent Thalamo‐Cortical Connectivity Profiles
The MD was selected for evaluation of the state‐dependent thalamo‐cortical connectivity. This region was identified in all dynamic and static parcellations and the corresponding connectivity profiles were examined and compared across all states. Specifically, voxels in the MD common to all states are highlighted in Figure 6 and cortical connectivity patterns extracted from these common voxels are shown in the same figure.
Figure 6.
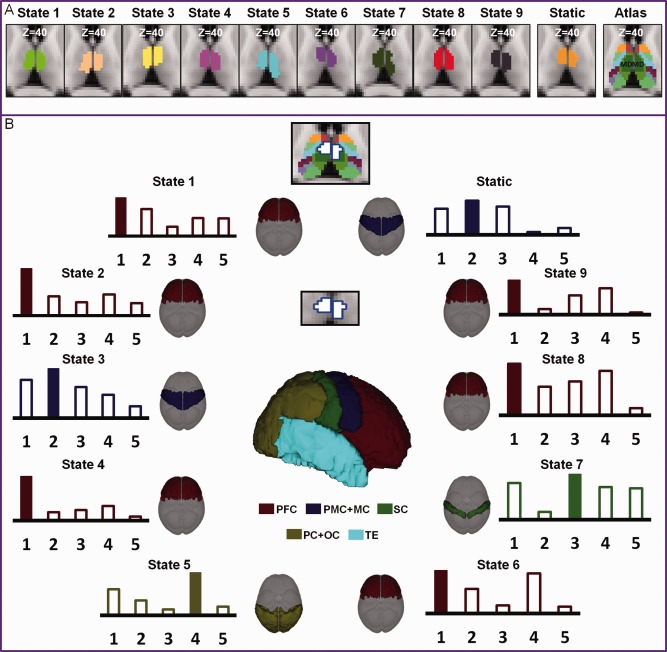
State‐dependent thalamo‐cortical connections for the medial dorsal nucleus (MD). The dynamically derived segmentation of MD are compared with the Morel atlas in (A) and their cortical connectivity patterns are shown for all 9 dynamic states and the static state in (B). The connectivity patterns in (B) are derived from the overlapping regions across all the dynamic and static states (the white regions) with the highest cortical connections highlighted.
Prefrontal connections ranked top for the MD in the states 1, 2, 4, 6, 8 and 9. These results accords well with established neuroanatomy research [Klein et al., 2010]. However, the results of dynamic parcellation also revealed dynamic changes of cortical connections with MD. As shown in Figure 6, the MD connection maximized in the motor, parietal/occipital, and somatosensory cortices in the states of 3, 5, and 7, respectively.
Merged Segmentation Results Across States
The merged parcellation from the dynamic analysis exhibited higher correspondence to the histology atlas than that derived from the static analysis (Fig. 7). In the merged segmentation map, six putative regions from the atlas, AV, ventral lateral anterior nucleus (VLa), ventral posterior lateral posterior nucleus (VPLp), centromedian (CM), anterior pulvinar nucleus (PuA), and LP could be readily identified; in contrast, these nuclei are not observed in the static parcellation (Fig. 7). Additionally, in different states, these four regions showed the strongest functional connection with different cortical regions (bottom portion of Fig.7), indicating that these finer anatomical structures can only be captured by considering dynamic changes in functional connectivity in the segmentation analysis.
Figure 7.
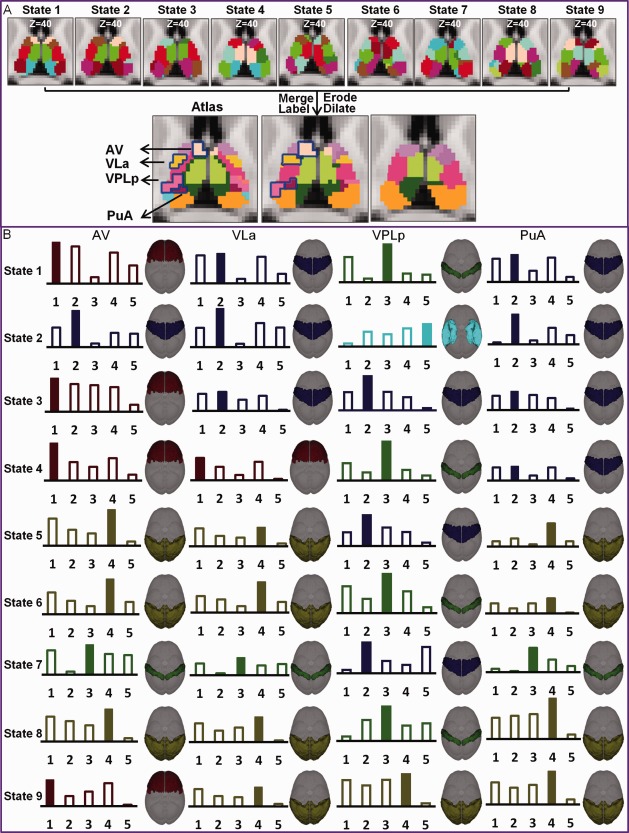
Atlas structures identified by the dynamic thalamus segmentation. These structures, including the anteroventral nucleus (AV), ventral lateral anterior nucleus (VLa), ventral posterior lateral posterior (VPLp), anterior pulvinar nucleus (PuA) can be seen in the merged dynamic parcels but not in the static parcels (A).The dynamic cortical connectivity patterns for each of these regions are shown (B). The strongest connections are marked with a solid bar.
The pulvinar is a major thalamic nucleus with finer structures. Anatomically, it is divided into the anterior (PuA), lateral (PuL), and medial (PuM) portions in the Morel atlas [Morel et al., 1997]. These anatomic structures from the atlas are compared with the merged dynamic parcellations as well as the static parcellations in Figure 8. PuA is not seen in the static parcellation but clearly seen in the result obtained by merging dynamic parcellation. Not surprisingly, as shown in Figure 9, in the static parcellation, most of the strongest thalamo‐cortical connections correspond well with previous studies (VAmc‐Prefrontal, VLp‐Premotor, CL‐Motor and PuM‐Temporal) [Jones, 2012; Ray and Price, 1993; Zhang et al., 2010].
Figure 8.
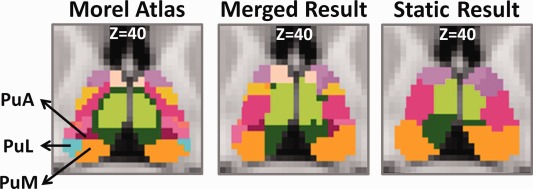
Finer structures of pulvinar in Morel atlas, merged result and static result. Pulvinar is mainly divided into three parts including anterior pulvinar, lateral pulvinar, medial pulvinar.
Figure 9.
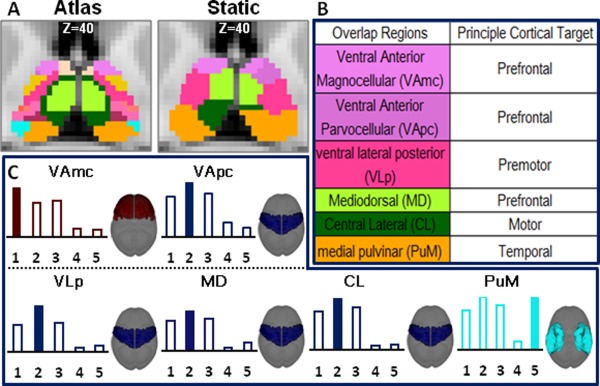
Correlation pattern between morel atlas and static result. In (A), Morel atlas and static result was shown (Z = 40). In (B), overlap regions and principle target were shown. In (C), the strongest correlation pattern of those nuclei including ventral anterior magnocellular (VAmc), ventral anterior parvocellular (VApc), ventral lateral posterior (VLp), mediodorsal (MD) and central lateral (CL) and medial pulvinar (PuM) were shown.
DISCUSSION
In this study, we examined the temporal variability of thalamo‐cortical functional connectivity and exploited dynamic information to improve thalamus parcellation. In contrast to previous whole brain dynamic functional connectivity studies [Hutchison et al., 2013; Jones et al., 2012; Kiviniemi et al., 2011], this is the first study focusing exclusively on thalamo‐cortical networks. The state‐specific connectivity patterns accord well with prior reports [Klein et al., 2010] and exhibit a smaller inter‐group variability than static parcellation. In addition, merging of state‐specific parcellations resulted in additional regions seen in the histologic atlas. Furthermore, our results also revealed the dynamic nature of functional interactions between different sub‐regions of the thalamus and different cortical areas with its implication discussed as follows.
Comparison of dynamic and static results revealed that the connectivity pattern of the temporally dominant state has the highest correlation with the static connectivity pattern (correlation: 0.88), while FC patterns from other states diverge from the static pattern [Allen et al., 2014; Deco et al., 2011].
In the method described here, a spatial constraint assuming that neighboring voxels have similar time courses or FC patterns was applied. This constraint separated the thalamus into two disjoint structures in separate hemispheres. Left and right thalamic hemispheres were then parcellated separately for each dynamic temporal state. Furthermore, this procedure increases the applicability of our method in diseases with asymmetric brain degeneration, such as Parkinson's disease [Horton and Wedding, 2008].
To assess the reliability of thalamus parcellation results, reproducibility of group‐level parcellation results was determined and reported here. Previous studies only report parcellation results of whole brain and subcortical areas based on group‐level analysis [Barnes et al., 2010; Fair et al., 2010; Fan et al., 2015; Janssen et al., 2015; Shen et al., 2010; Yang et al., 2014; Zhang et al., 2010]. In the present work, we report group‐level thalamus parcellation reproducibility results. Compared with the thalamus group segmentation results, the reproducibility of the individual segmentation results will be lower because of variations individual functional connectivity patterns.
Our results indicate that the MD nucleus connects primarily to the prefrontal cortex in the static state as well as in dynamic states 1, 2, 4, 6, 8 and 9. However, these results are not consistent with previous reports that the MD is dominantly correlated with the premotor/motor cortex [Zhang et al., 2010]. This discrepancy could be because of methodological differences between the two studies. In the present analysis, the MD region was defined as the overlapping voxels between segments identified from the static and the nine dynamic states, whereas in the previous work, it was solely defined by the static segmentation. Interestingly, in the same work of Zhang et al., [Zhang et al., 2010], the MD region defined from overlapping results of DTI‐based and fMRI‐based segmentations also projected to the prefrontal cortex.
In comparison with the Morel atlas, six nuclei which were absent in the static parcellation were identified in the dynamic analysis. More specifically, six nuclei that were identified in the dynamic analysis were not seen in the static parcellation. The spatial overlap between the Morel atlas and the dynamic analysis for AV, VLa, VPLp, PuA, CM, and LP is summarized in Table 1. The functional connectivities of in four of these regions, AV, VLa, VPLp and PuA nucleus, are impaired in Alzheimer's disease or Parkinsonism. Specifically AV, involved in spatial navigation [Clark and Taube, 2012] and mnemonic functions [Buzsáki and Moser, 2013], could be used to differentiate Alzheimer's disease [Braak and Braak, 1991] and Korsakoff's psychosis [Harding et al., 2000]. VLa helps in performing coordination and planning of movement function [Crosson, 1992], so that it may be useful for the treatment of limbic rigidity, involuntary movement disorders and tremor in Parkinson's disease [Carpenter and Sutin, 1983]. VPLp is involved in processing sensory information, and could be used to diagnose somatosensory syndrome [Krause et al., 2012]. PuA is part of somatosensory system [Kaas, 2009] and could it could be linked to somatosensory deficits in Parkinson's or Huntington's disease.
Table 1.
The spatial overlap between merged results and Morel atlas
| Overlap | |
|---|---|
| Morel atlas | Merged result |
| AV | 73% |
| VLa | 56% |
| VPLp | 44% |
| PuA | 52% |
| CM | 19% |
| LP | 48% |
Table 2.
The spatial overlap between merged results, static results, and Morel atlas [Morel et al., 1997]
| Morel atlas | Overlap | |
|---|---|---|
| Merged result | Static result | |
| PuA | 52% | N |
| PuL | N | N |
| PuM | 90% | 93% |
Percent overlap is calculated between merged result, static result and morel atlas.
N represents no voxels.
Exploration of dynamic functional connectivity may also help in preoperative planning. As localization of brain areas specialized for sensory and motor function are needed before surgical operations in order to mitigate potential postsurgical damage. In fact, task activation and connectivity techniques are all used in presurgical planning [Faro et al., 2011; Lee et al., 2013]. However, all approaches used to date assume functional stationarity, which is known to be inaccurate and may therefore be clinically unreliable. As shown in our results, the MD nucleus does not project to somatosensory cortex in the static analysis, but does exhibit dominant somatosensory connection in state 7. While traditional presurgical planning would consider MD a region of low importance, our result may indicate the need of additional caution as MD is involved with sensory function from time to time.
Some experimental and methodological limitations should be noted in the present work. The size of cortical ROIs may affect the results. Ten cortical regions were defined according to known thalamo‐cortical connections [Jones et al., 1985]. However, the use of a finer definition of cortical ROIs may provide better functional resolution. The present study did not examine the effect of a larger set of cortical ROIs (such as the AAL atlas) mainly because of the partial correlation method used. Given that each windowed time series only contains 52 TRs, the number of cortical ROIs needs to be less than 6 to ensure 10+ time points for each regressor.
CONCLUSIONS
In the current study, we have identified nine states of thalamocortical connectivity. Accordingly, state‐dependent thalamus parcellation exhibited higher consistency with known anatomy than static thalamus parcellation. Our results provided additional insight on dynamic roles the thalamus plays in the resting brain and revealed finer deep brain structures previously uncovered with static analysis.
ACKNOWLEDGMENT
The authors are grateful to Lei Zhou for programming assistance, Junhao Pan for statistical advice.
REFERENCES
- Allen EA, Damaraju E, Plis SM, Erhardt EB, Eichele T, Calhoun VD (2014): Tracking whole‐brain connectivity dynamics in the resting state. Cereb Cortex 24:663–676. [DOI] [PMC free article] [PubMed] [Google Scholar]
- Barnes KA, Cohen AL, Power JD, Nelson SM, Dosenbach YB, Miezin FM, Petersen SE, Schlaggar BL (2010): Identifying basal ganglia divisions in individuals using resting‐state functional connectivity MRI. Front Syst Neurosci 4:18. [DOI] [PMC free article] [PubMed] [Google Scholar]
- Braak H, Braak E (1991): Alzheimer's disease affects limbic nuclei of the thalamus. Acta Neuropathologica 81:261–268. [DOI] [PubMed] [Google Scholar]
- Buzsáki G, Moser EI (2013): Memory, navigation and theta rhythm in the hippocampal‐entorhinal system. Nat Neurosci 16:130–138. [DOI] [PMC free article] [PubMed] [Google Scholar]
- Carpenter MB, Sutin J ( 1983): Human Neuroanatomy; Baltimore: Williams & Wilkins. [Google Scholar]
- Clark BJ, Taube JS (2012): Vestibular and attractor network basis of the head direction cell signal in subcortical circuits. Frontiers in Neural Circuits 6:7. [DOI] [PMC free article] [PubMed] [Google Scholar]
- Cohen AL, Fair DA, Dosenbach NU, Miezin FM, Dierker D, Van Essen DC, Schlaggar BL, Petersen SE (2008): Defining functional areas in individual human brains using resting functional connectivity MRI. Neuroimage 41:45–57. [DOI] [PMC free article] [PubMed] [Google Scholar]
- Cole DM, Smith SM, Beckmann CF (2010): Advances and pitfalls in the analysis and interpretation of resting‐state FMRI data. Frontiers in Systems Neuroscience 4:8. [DOI] [PMC free article] [PubMed] [Google Scholar]
- Craddock RC, James GA, Holtzheimer PE, Hu XP, Mayberg HS (2012): A whole brain fMRI atlas generated via spatially constrained spectral clustering. Hum Brain Mapp 33:1914–1928. [DOI] [PMC free article] [PubMed] [Google Scholar]
- Crosson BA. 1992. Subcortical Functions in Language and Memory; New York: Guilford Press. [Google Scholar]
- Deco G, Jirsa VK, McIntosh AR (2011): Emerging concepts for the dynamical organization of resting‐state activity in the brain. Nat Rev Neurosci 12:43–56. [DOI] [PubMed] [Google Scholar]
- Fair DA, Bathula D, Mills KL, Dias TGC, Blythe MS, Zhang D, Snyder AZ, Raichle ME, Stevens AA, Nigg JT (2010): Maturing thalamocortical functional connectivity across development. Front Syst Neurosci 4:10. [DOI] [PMC free article] [PubMed] [Google Scholar]
- Fan Y, Nickerson LD, Li H, Ma Y, Lyu B, Miao X, Zhuo Y, Ge J, Zou Q, Gao J‐H: Functional connectivity‐based parcellation of the thalamus: An unsupervised clustering method and its validity investigation. Brain Connect, in press. [DOI] [PubMed] [Google Scholar]
- Faro SH, Mohamed FB, Law M, Ulmer JT (2011): Functional Neuroradiology: Principles and Clinical Applications; New York: Springer. [Google Scholar]
- Glasser MF, Sotiropoulos SN, Wilson JA, Coalson TS, Fischl B, Andersson JL, Xu J, Jbabdi S, Webster M, Polimeni JR (2013): The minimal preprocessing pipelines for the Human Connectome Project. Neuroimage 80:105–124. [DOI] [PMC free article] [PubMed] [Google Scholar]
- Halliday GM (2009): Thalamic changes in Parkinson's disease. Parkinson Relat Disord 15:S152–S155. [DOI] [PubMed] [Google Scholar]
- Handwerker DA, Roopchansingh V, Gonzalez‐Castillo J, Bandettini PA (2012): Periodic changes in fMRI connectivity. Neuroimage 63:1712–1719. [DOI] [PMC free article] [PubMed] [Google Scholar]
- Harding A, Halliday G, Caine D, Kril J (2000): Degeneration of anterior thalamic nuclei differentiates alcoholics with amnesia. Brain 123:141–154. [DOI] [PubMed] [Google Scholar]
- AM Horton, D Wedding (2008): The neuropsychology handbook. New York: Springer Publishing Company. [Google Scholar]
- Hutchison RM, Womelsdorf T, Allen EA, Bandettini PA, Calhoun VD, Corbetta M, Della Penna S, Duyn JH, Glover GH, Gonzalez‐Castillo J (2013): Dynamic functional connectivity: promise, issues, and interpretations. Neuroimage 80:360–378. [DOI] [PMC free article] [PubMed] [Google Scholar]
- Janssen R, Jylänki P, Kessels R, van Gerven M (2015): Probabilistic model‐based functional parcellation reveals a robust, fine‐grained subdivision of the striatum. Neuroimage 119:398–405. [DOI] [PubMed] [Google Scholar]
- Johansen‐Berg H, Behrens TE, Sillery E, Ciccarelli O, Thompson AJ, Smith SM, Matthews PM (2005): Functional–anatomical validation and individual variation of diffusion tractography‐based segmentation of the human thalamus. Cereb Cortex 15:31–39. [DOI] [PubMed] [Google Scholar]
- Jones DT, Vemuri P, Murphy MC, Gunter JL, Senjem ML, Machulda MM, Przybelski SA, Gregg BE, Kantarci K, Knopman DS (2012): Non‐stationarity in the “resting brain's” modular architecture. PloS One 7:e39731 [DOI] [PMC free article] [PubMed] [Google Scholar]
- Jones EG (2012): The Thalamus. New York: Springer Science Business Media. [Google Scholar]
- Jones EG, Steriade M, McCormick D (1985): The Thalamus. Plenum: New York. [Google Scholar]
- Kaas JH (2009): Evolutionary Neuroscience. New York: Academic Press. [Google Scholar]
- Kim DJ, Park B, Park HJ (2013): Functional connectivity‐based identification of subdivisions of the basal ganglia and thalamus using multilevel independent component analysis of resting state fMRI. Hum Brain Mapp 34:1371–1385. [DOI] [PMC free article] [PubMed] [Google Scholar]
- Kiviniemi V, Vire T, Remes J, Elseoud AA, Starck T, Tervonen O, Nikkinen J (2011): A sliding time‐window ICA reveals spatial variability of the default mode network in time. Brain Connect 1:339–347. [DOI] [PubMed] [Google Scholar]
- Klein JC, Rushworth MF, Behrens TE, Mackay CE, de Crespigny AJ, D'Arceuil H, Johansen‐Berg H (2010): Topography of connections between human prefrontal cortex and mediodorsal thalamus studied with diffusion tractography. Neuroimage 51:555–564. [DOI] [PMC free article] [PubMed] [Google Scholar]
- Krause T, Brunecker P, Pittl S, Taskin B, Laubisch D, Winter B, Lentza ME, Malzahn U, Villringer K, Villringer A, Jungehulsing GJ (2012): Thalamic sensory strokes with and without pain: differences in lesion patterns in the ventral posterior thalamus. J Neurol Neurosurg Psychiatry 83:776–784 [DOI] [PubMed] [Google Scholar]
- Krauth A, Blanc R, Poveda A, Jeanmonod D, Morel A, Székely G (2010): A mean three‐dimensional atlas of the human thalamus: generation from multiple histological data. Neuroimage 49:2053–2062. [DOI] [PubMed] [Google Scholar]
- Lee M, Smyser C, Shimony J (2013): Resting‐state fMRI: a review of methods and clinical applications. Am J Neuroradiol 34:1866–1872. [DOI] [PMC free article] [PubMed] [Google Scholar]
- Mai JK, Assheuer J, Paxinos G (1997): Atlas of the Human Brain. Academic Press: San Diego. [Google Scholar]
- Mills KL, Bathula D, Dias TGC, Iyer SP, Fenesy MC, Musser ED, Stevens CA, Thurlow BL, Carpenter SD, Nagel BJ (2012): Altered cortico‐striatal–thalamic connectivity in relation to spatial working memory capacity in children with ADHD. Front Psychiatry 3:2. [DOI] [PMC free article] [PubMed] [Google Scholar]
- Morel A, Magnin M, Jeanmonod D (1997): Multiarchitectonic and stereotactic atlas of the human thalamus. J Comparat Neurol 387:588–630. [DOI] [PubMed] [Google Scholar]
- Ng AY, Jordan MI, Weiss Y (2002): On spectral clustering: Analysis and an algorithm. Adv Neural Informat Process Syst 2:849–856. [Google Scholar]
- Qi R, Zhang LJ, Zhong J, Zhang Z, Ni L, Zheng G, Lu GM (2013): Disrupted thalamic resting‐state functional connectivity in patients with minimal hepatic encephalopathy. Eur J Radiol 82:850–856. [DOI] [PubMed] [Google Scholar]
- Ray JP, Price JL (1993): The organization of projections from the mediodorsal nucleus of the thalamus to orbital and medial prefrontal cortex in macaque monkeys. J Comparat Neurol 337:1–31. [DOI] [PubMed] [Google Scholar]
- Rubinov M, Sporns O (2011): Weight‐conserving characterization of complex functional brain networks. Neuroimage 56:2068–2079. [DOI] [PubMed] [Google Scholar]
- Sakoğlu Ü, Pearlson GD, Kiehl KA, Wang YM, Michael AM, Calhoun VD (2010): A method for evaluating dynamic functional network connectivity and task‐modulation: application to schizophrenia. Magn Reson Mater Phys Biol Med 23:351–366. [DOI] [PMC free article] [PubMed] [Google Scholar]
- Salimi‐Khorshidi G, Douaud G, Beckmann CF, Glasser MF, Griffanti L, Smith SM (2014): Automatic denoising of functional MRI data: combining independent component analysis and hierarchical fusion of classifiers. Neuroimage 90:449–468. [DOI] [PMC free article] [PubMed] [Google Scholar]
- Schultz T (2011): Segmenting thalamic nuclei: what can we gain from HARDI? Medical Image Computing and Computer‐Assisted Intervention–MICCAI 2011: New York: Springer; p 141–148. [DOI] [PubMed] [Google Scholar]
- Shen X, Papademetris X, Constable RT (2010): Graph‐theory based parcellation of functional subunits in the brain from resting‐state fMRI data. Neuroimage 50:1027–1035. [DOI] [PMC free article] [PubMed] [Google Scholar]
- Sherman SM (2006): Thalamus. Scholarpedia 1:1583. [Google Scholar]
- Thirion B, Flandin G, Pinel P, Roche A, Ciuciu P, Poline JB (2006): Dealing with the shortcomings of spatial normalization: Multisubject parcellation of fMRI datasets. Hum Brain Mapp 27:678–693. [DOI] [PMC free article] [PubMed] [Google Scholar]
- Van Essen DC, Ugurbil K, Auerbach E, Barch D, Behrens T, Bucholz R, Chang A, Chen L, Corbetta M, Curtiss SW (2012): The Human Connectome Project: a data acquisition perspective. Neuroimage 62:2222–2231. [DOI] [PMC free article] [PubMed] [Google Scholar]
- Wang J, Fan L, Zhang Y, Liu Y, Jiang D, Zhang Y, Yu C, Jiang T (2012): Tractography‐based parcellation of the human left inferior parietal lobule. Neuroimage 63:641–652. [DOI] [PubMed] [Google Scholar]
- Wiegell MR, Tuch DS, Larsson HB, Wedeen VJ (2003): Automatic segmentation of thalamic nuclei from diffusion tensor magnetic resonance imaging. Neuroimage 19:391–401. [DOI] [PubMed] [Google Scholar]
- Yang Z, Craddock RC, Margulies DS, Yan C‐G, Milham MP (2014): Common intrinsic connectivity states among posteromedial cortex subdivisions: Insights from analysis of temporal dynamics. Neuroimage 93:124–137. [DOI] [PMC free article] [PubMed] [Google Scholar]
- Zang Y, Jiang T, Lu Y, He Y, Tian L (2004): Regional homogeneity approach to fMRI data analysis. Neuroimage 22:394–400. [DOI] [PubMed] [Google Scholar]
- Zhang D, Snyder AZ, Shimony JS, Fox MD, Raichle ME (2010): Noninvasive functional and structural connectivity mapping of the human thalamocortical system. Cereb Cortex 20:1187–1194. [DOI] [PMC free article] [PubMed] [Google Scholar]
- Zhang DY, Snyder AZ, Fox MD, Sansbury MW, Shimony JS, Raichle ME (2008): Intrinsic functional relations between human cerebral cortex and thalamus. J Neurophysiol 100:1740–1748. [DOI] [PMC free article] [PubMed] [Google Scholar]
- Ziyan U, Tuch D, Westin C‐F ( 2006): Segmentation of thalamic nuclei from DTI using spectral clustering Medical Image Computing and Computer‐Assisted Intervention–MICCAI 2006: New York: Springer; pp 807–814. [DOI] [PubMed] [Google Scholar]