

Abstract
The mammalian cortex is a complex system of—at the microscale level—interconnected neurons and—at the macroscale level—interconnected areas, forming the infrastructure for local and global neural processing and information integration. While the effects of regional chemoarchitecture on local cortical activity are well known, the effect of local neurotransmitter receptor organization on the emergence of large scale region‐to‐region functional interactions remains poorly understood. Here, we examined reports of effective functional connectivity—as measured by the action of strychnine administration acting on the chemical balance of cortical areas—in relation to underlying regional variation in microscale neurotransmitter receptor density levels in the macaque cortex. Linking cortical variation in microscale receptor density levels to collated information on macroscale functional connectivity of the macaque cortex, we show macroscale patterns of effective corticocortical functional interactions—and in particular, the strength of connectivity of efferent macroscale pathways—to be related to the ratio of excitatory and inhibitory neurotransmitter receptor densities of cortical areas. Our findings provide evidence for the microscale chemoarchitecture of cortical areas to have a direct stimulating influence on the emergence of macroscale functional connectivity patterns in the mammalian brain. Hum Brain Mapp 37:1856–1865, 2016. © 2016 Wiley Periodicals, Inc.
Keywords: functional connectivity, brain networks, graph theory, strychnine, neurotransmitter receptors
INTRODUCTION
Brain function emerges from neural interactions between individually connected neurons, as well as between globally interconnected areas [Passingham et al., 2002; Sporns et al., 2005; van den Heuvel and Sporns, 2013]. At the microscale level of brain organization, functional organization entails signal transduction between neurons [Cossell et al., 2015; Ullo et al., 2014; Yuste, 2011]. At the macroscale, functional connectivity of macroscale neuronal circuits describes interactions between large‐scale cortical areas [Rubinov and Sporns, 2010; van den Heuvel et al., 2012] shaped by the underlying anatomical wiring infrastructure of the brain [Adachi et al., 2012; Honey et al., 2010; van den Heuvel and Sporns, 2013]. Much is known about how signaling on the neuronal level depends on the local cyto‐, myelo‐, and chemoarchitecture of cortical areas [Amunts and von Cramon, 2006; Zilles et al., 2002, 1995]. Functional activity of cortical areas on the microscale is shaped by local interactions between large numbers of neurons and their corticocortical interconnections with other brain regions [Kandel et al., 2000]. A large proportion of these interactions is communicated through chemical transmission [Kandel et al., 2000]. Whether a connected target area will fire depends on the summation of many factors, such as the neuronal types present in that region [Ullo et al., 2014], as well on their excitatory and inhibitory synaptic input [Kandel et al., 2000] and their excitatory and inhibitory balance [Duncan et al., 2014; Kapogiannis et al., 2013]. However, how underlying microscale structural and chemical architecture of cortical regions shapes the emergence of macroscale brain‐wide functional connectivity patterns is less well understood [Honey et al., 2010; Kötter, 2007; Passingham et al., 2002].
In this study, we set about to provide insight into this matter by examining a potential interplay between the chemoarchitecture of cortical areas and the formation of macroscale effective functional connectivity patterns in the macaque brain. Data on density of six common regional neurotransmitter receptors were collated from the pioneering autoradiography work of Kötter et al. [2001], reporting on regional neurotransmitter receptor densities of the macaque cortical surface. Induced functional connectivity of macaque cortical areas was derived from a collation of strychninization studies made by Stephan et al. [2000]. Strychnine studies provide detailed information on a rather unique type of directed functional connectivity resulting from strychnine‐induced regional cortical disinhibition. Targeted administration of strychnine on a cortical region leads to a temporary excitatory reaction at the local source region, and subsequently an increase in neural activity in remote cortical areas by means of glutamate‐mediated excitatory long‐range projecting axons of the source region (a detailed description of strychnine functional connectivity is given in the section “Materials and Methods”). Combining chemoarchitectural receptor densities operating at the nanoscale of brain organization with measurements of macroscale strychnine‐derived functional connectivity, we show the effective functional connectivity patterns of cortical areas to be modulated by regional variation in excitatory and inhibitory receptor density.
MATERIALS AND METHODS
Macroscale Strychnine‐Induced Functional Connectivity
Data on effective functional connectivity of the macaque cortex was derived from the strychnine‐based functional connectivity dataset as collated by Stephan et al. [2000] in their seminal paper on strychnine‐induced effective functional connectivity of the macaque cortex. Since the neuronographic studies from which the strychnine functional connectivity data was collated did not usually state in which hemisphere activity was recorded, Stephan et al. pooled connections across hemispheres, leaving a single monohemispheric connectivity matrix. Originally, the in vivo technique of strychninization has been designed to reveal functional relations between cortical areas and bodily movements by stimulation of motor regions of the macaque cerebral cortex [De Barenne, 1924]. Later, local strychnine application was used to determine the boundaries between cortical areas based on their functional projections [De Barenne and McCulloch, 1938]. Functional interaction between cortical source and target areas was observed as alterations in electrocorticography activity of target areas following strychninization of source regions (Fig. 1A). Connectivity patterns similar to those observed after electrical stimulation of the same source region were demonstrated labeling strychninization as an effective methodology for mapping corticocortical projections [De Barenne and McCulloch, 1938]. It is now known that strychnine acts as an antagonist for the neuronal glycine receptor (GlyR) and as a partial antagonist for the γ‐aminobutyric acid type A receptor (GABAA) [Curtis et al., 1971; Davidoff et al., 1969] partially blocking the function of inhibitory postsynaptic potentials (Fig. 1B). The resulting disinhibition of strychninized areas increases the chance of pyramidal neurons—in particular, layer 2 and 3 pyramidal neurons, neurons of which their projections are important for corticocortical signal transduction [Salling and Harrison, 2014]—to spike and to propagate action potentials along their long‐range axons projecting to distinct cortical areas. At the macroscale level of brain organization, the net effect of strychnine administration is thus a strong stimulating action on target areas.
Figure 1.
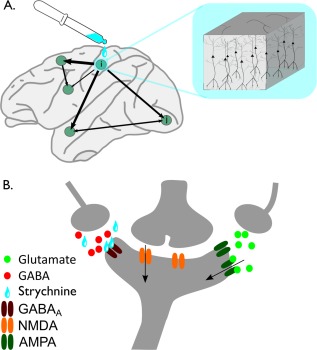
Schematic representation of workings of strychnine‐induced functional connectivity. Figure shows the schematic presentation of the biological mechanism of the workings of strychninization (see also the main text). (A) During a strychnine experiment, strychnine (blue) is administered to a source region i. The schematic drawing (blue box) illustrates the strychnine to have an effect on the cortical column and to particularly act on layer 3 pyramidal cells. (B) At the nanoscale receptor level, local administration of strychnine (depicted by the blue drops) results in the blocking of inhibitory glycine receptors and partially blocking of the GABAA receptors (dark red), therewith strongly reducing GABA‐mediated influx (red dots) into the source neuron. The lack of GABAergic modulation increases the excitability of the source neuron and results in a strong sensitivity of the neuron to incoming glutamatergic‐mediated excitatory activity (green dots) via—for example—AMPA receptors (dark green) and second messenger‐dependent excitatory neurotransmission (orange receptor). At the microscale cellular level, this has the net effect of an overall increase in the excitability of the source neuron. Taken across the entire stimulated area (thus involving a large number of neurons), the source region's macroscale net excitatory impulse on its short‐ and long‐range connected cortical regions increases. This outgoing functional influence of source region i to these other regions j of the cortex is measured by means of electroencephalography recordings of an increase in cortical activity at the target regions j of the cortex. [Color figure can be viewed in the online issue, which is available at http://wileyonlinelibrary.com.]
In their article, Stephan et al. [2000] collated functional connectivity data across 19 strychnine studies for each cortical source region of the Walker‐Von Bonin & Bailey atlas (WBB47). The WBB47 atlas is a combination of cortical areas of Von Bonin and Bailey's [1947] atlas and frontal areas of Walker's [1940] atlas and was first used by Stephan et al. [2000] and later by others for the analysis of anatomical corticocortical connectivity [Scholtens et al., 2014]. The WBB47 describes the whole (unihemispheric) surface of the macaque cortex in 39 nonoverlapping areas (including 5 frontal, 10 prefrontal, 7 parietal, 9 temporal, 3 occipital, 2 insular, and 3 cingulate regions) [Stephan et al., 2000]. Figure 2 shows the schematic illustration of the 39 WBB47 regions on the macaque cortical surface. Using the WBB47 atlas, Stephan et al. collated reports across literature on corticocortical strychnine functional connectivity (i.e., net excitatory effect) of the 39 WBB47 cortical regions with all other cortical regions in a 39 × 39 functional connectivity matrix. Information on the presence or absence and information on the strength of present connections was stored in the connectivity matrix as “0” (connection explicitly mentioned to be absent), “1” (connection present, strength: weak), “2” (connection present, strength: moderate), “3” (connection present, strength: strong), “X” (connection present, strength: unreported) or “−” when no information on a corticocortical connection could be found. Of the connections for which a specific strength was reported (64% of all 221 connections), the majority (52.7%) was reported to be weak (s = 1), 20.6% of connections was of moderate strength (s = 2), and 26.7% was strong (s = 3). For our analysis, connections of which clear presence but no information on strength was reported in literature (i.e., the “X” connections), were taken as connections with the strength most prevalent in our dataset (s = 1); connection pairs of which no information could be collated across literature (i.e., the “−” connections) were taken as an empty entry (i.e., absence of connection, s = 0) in the connectivity matrix following the procedures by Stephan et al. (Fig. 2) (for additional analyses excluding all connections of unknown strength, see Supporting Information, Table S1 and Fig. S1). In all, the examined connectivity matrix described 39 areas (nodes) of the WBB47 atlas, with 175 weak connections (edges), 20 medium strength connections, and 26 strong connections.
Figure 2.
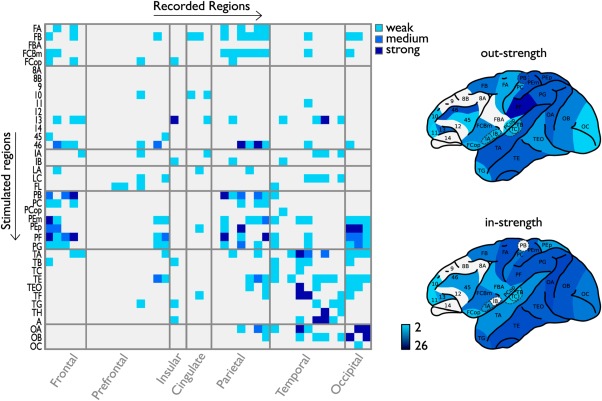
Regional strychnine functional connectivity matrix. Left panel shows the strychnine‐induced functional connectivity matrix of the 39 WBB47 areas of the macaque cortex as reported by Stephan et al. [2000]. Connection strength of pathways is given from weak (represented as 1, light blue) to moderate (2, medium blue) and strong (3, dark blue). Right panel shows the regional levels of functional in‐strength and out‐strength mapped onto a lateral view of the macaque cortex, with regional in‐strength and out‐strength computed as column and row summation of strength values of the matrix. Regional strength values ranged from 2 (weakest connected region depicted in light blue) to 26 (strongest functionally connected cortical region, shown in dark blue). [Color figure can be viewed in the online issue, which is available at http://wileyonlinelibrary.com.]
Regionwise Strychnine Functional Connectivity Strength
Basic graph analysis was used as a theoretical framework to explore topological structure of the strychnine‐induced functional network (Fig. 2). For each cortical area, the regional out‐strength defined as the sum across all outgoing projections of a region and in‐strength defined as the sum across all ingoing connections of a region were computed.
Regional Neurotransmitter Receptor Levels
Information on the chemoarchitecture of macaque cortical regions was taken from the study of Kötter et al. [2001]. Kötter's study reports on densities of (in total) 9 excitatory and inhibitory neurotransmitter receptors (in fmol/mg protein) of 29 smaller subareas of the visual, motor, and somatosensory system of the macaque cortex, densities obtained by means of in vitro autoradiography using receptor‐specific radiolabeled receptor binding ligands (collated density levels are displayed in Fig. 3). Data reported on receptors involved in excitatory neurotransmission included (receptor 1) glutamatergic AMPA receptor (α‐amino‐3‐hydroxy‐5‐methyl‐4‐isoxazolepropionic acid receptor), (2) glutamatergic kainate receptor, (3) serotonin 5‐HT2A receptor (5‐hydroxytryptamine receptor type 2A), and (4) acetylcholine receptor M1 (muscarinic receptor type 1). Data reported on receptors involved in inhibitory neurotransmission included (5) the GABAA receptor (type A of the γ‐aminobutyric acid receptor) and (6) acetylcholine receptor M2 (muscarinic receptor type 2). Receptors 7–9 (respectively, NMDA, α1, and α2h) were measured in motor areas only (just 4 regions in the used WBB47 atlas, see below) and therefore not included in this study, resulting in the examination of 6 receptor levels.
Figure 3.
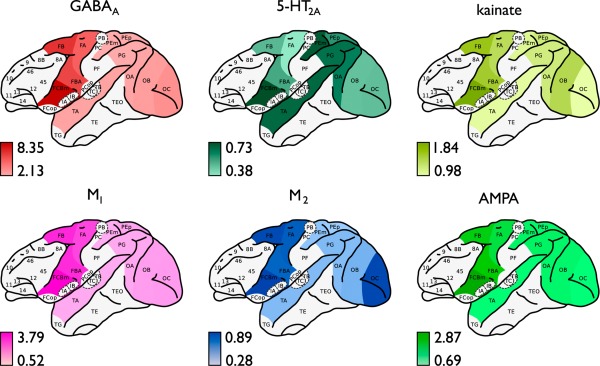
Cortical layout of mapped regional density levels. Figure shows the regional densities of the 6 examined receptors for the included macaque WBB47 cortical regions (Table 2). Figure shows the density distributions of inhibitory receptors GABAA (red) and M2 (blue), and density distributions of excitatory receptors AMPA (light green), 5‐HT2A (dark green), M1 (pink), and kainate (yellow). Binding density levels are depicted in fmol/mg·103 proteins ranging from minimum values (light colors) to maximum values (dark colors). Data as collated from the study of Kötter et al. [2001] (see main text). [Color figure can be viewed in the online issue, which is available at http://wileyonlinelibrary.com.]
Mapping of receptor data to strychnine functional connectivity
To enable cross‐modal analysis between the receptor data and macroscale strychnine functional connectivity data derived for the WBB47 cortical areas, the 29 smaller areas reported by Kötter et al. were manually mapped to the regions of the WBB47 parcellation atlas. The WBB47 atlas and mapping was used in previous studies of our group on macroscale anatomical connectivity of the macaque cortex, and provided a detailed description of the performed mapping (Table 2) [Scholtens et al., 2014; van den Heuvel et al., 2015a]. Mapping of receptor density data to the WBB47 atlas resulted in receptor data for a total of 11 WBB47 cortical regions (FA, FB, FBA, FCBm, PEp, PEm, PG, TA, OA, OB, and OC) [Scholtens et al., 2014]. The resulting receptor density levels for the 6 examined receptors of the 11 cortical regions are shown in Figure 3.
Table 2.
Mapping of Kötter [2001] subregions to the WBB47 atlas
| WBB47 region | Kötter [2001] subregion | ||||||||
| FA | F1 | ||||||||
| FB | F2v | F2d | F3 | F6 | F7 | ||||
| FBA | F4v | F4d | |||||||
| FCBm | F5 | ||||||||
| PEm | VIP | ||||||||
| PEp | PO | MIP | PEP | ||||||
| PG | LIP | PG | MST | ||||||
| TA | FST | ||||||||
| OA | V3v | V3d | V3A | V4v | V4d | V6A | V4t | MT | MTp |
| OB | V2v | V2d | |||||||
| OC | V1 | ||||||||
The first column lists all cortical regions of the WBB47 parcellation that were included in the analysis. Remaining columns show the included subregions from the Kötter [2001] study (for which receptor density information was available) per WBB47 region.
Excitatory–inhibitory ratio
For each region, a net excitatory character was examined by means of computation of the excitatory–inhibitory ExIn ratio, calculated as the mean excitatory receptor density (mean over AMPA, 5‐HT2A, kainate, and M1) divided by the mean inhibitory receptor density (mean over M2 and GABAA). As such, a larger ExIn ratio indicated less inhibitory neurotransmission as mediated by receptor densities [Kapogiannis et al., 2013]. To eliminate potential influences of differences in absolute receptor densities, we calculated an alternative ExIn ratio using normalized receptor densities. Values for each receptor were rescaled by dividing each density by the largest value for that specific receptor, excluding any effect of differences in absolute receptor density.
Statistical Analysis
Pearson's correlation was used to test a potential interplay between regional receptor densities and functional connectivity, cross‐correlating the 6 receptor density levels plus the ExIn ratio with nodal functional out‐ and in‐strength. Area FBA lacked any recordings of efferent strychnine functional connectivity and with such (functional) disconnection believed to be related to a shortage of measurements rather than a true effect of regions being completely unconnected to the rest of the brain, FBA was excluded from further analysis. This resulted in a dataset on chemoarchitecture–connectomics comparison for 10 cortical regions. Across these 10 regions, a total of 7 × 2 = 14 statistical tests were performed (6 receptors plus ExIn ratio; in‐ and out‐strength), yielding the need for correction for multiple testing. With a strongly dependent nature of the receptor density data (showing an average correlation of r = 0.6296 between the 6 receptor levels), a principal component analysis was performed to assess the true number of independent tests performed [Gao et al., 2008]. PCA resulted in the identification of two components in the receptor data explaining >99% of the total variance, yielding a partial Bonferroni‐corrected α of 0.05/(2 × 2) = 0.0125 correcting for the number of independent tests of 2 receptor components × 2 functional connectivity metrics (i.e., out‐ and in‐strength). Effects reaching this partial Bonferroni‐corrected α of 0.0125 were taken as significant [Gao et al., 2008; Li and Ji, 2005; Scholtens et al., 2014]. Further taking into account the notion of the data not being normally distributed, findings were verified with nonparametric Spearman's Rank correlations. Similar results were observed (Supporting Information), but we believe that due to the low power of the data (n = 10), Spearman's tests might have overestimated relationships (Supporting Information, Table S2), thus we favored Pearson's correlation analysis.
RESULTS
Table 1 lists all correlations between receptor levels and regional functional out‐ and in‐strength (see also Supporting Information, Figs. S2 and S3 for overview of all interactions). Correlating the 6 receptor densities with regional out‐strength revealed a significant negative effect of inhibitory M2 receptors and strychnine‐induced functional out‐strength (r = −0.7577, p = 0.0111, reaching partial Bonferroni correction) (Supporting Information, Fig. S4). No effects between regional variation of GABAA, AMPA, kainate, 5‐HT2A, or M1 neurotransmitter receptor densities and regional functional out‐strength were observed (see Table 1 and Supporting Information, Fig. S2 for overview of all correlations).
Table 1.
Pearson correlations (R) between neurotransmitter receptor level densities and total out‐/in‐strength of strychnine‐induced functional connectivity of cortical areas
| Out‐strength | In‐strength | |||
|---|---|---|---|---|
| R | p | R | p | |
| AMPA | −0.1328 | 0.7146 | −0.1741 | 0.6086 |
| 5‐HT2A | 0.6194 | 0.0561 | −0.0283 | 0.9342 |
| Kainate | −0.0817 | 0.8224 | −0.0873 | 0.7985 |
| M1 | −0.3278 | 0.3551 | −0.2044 | 0.5466 |
| M2 | −0.7577 | 0.0111 a | −0.1292 | 0.7049 |
| GABAA | −0.3372 | 0.3408 | −0.1861 | 0.5838 |
| ExIn ratio | 0.8259 | 0.0032 a | 0.1256 | 0.7129 |
Receptor levels are based on autoradiography measurements reported by Kötter et al. [2001]. Correlations were calculated between excitatory receptor levels (AMPA, 5HT2A, kainate, and M1), inhibitory receptors (GABAA and M2), and the in‐ and out‐strength of strychnine functional connectivity of cortical areas.
Effects reaching a partial Bonferroni corrected α of 0.0125.
Moreover, in particular, receptor ExIn ratio and functional out‐strength showed a strong positive correlation (r = 0.8259, p = 0.0032; Fig. 4), indicating an overall more excitatory and less inhibitory chemoarchitecture of cortical regions to be related to more and stronger outgoing macroscale effective functional projections. Using the normalized ExIn ratio yielded similar results (r = 0.8439, p = 0.0021). As hypothesized based on the workings of strychninization, no correlation was found between macroscale functional in‐strength connectivity patterns and cortical variation in excitatory/inhibitory receptor level densities.
Figure 4.
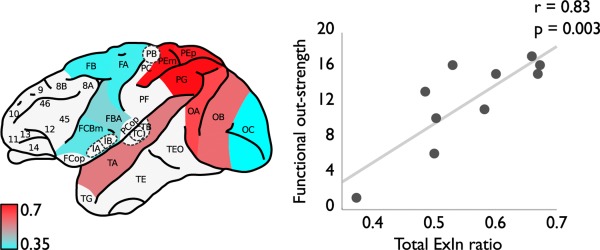
Interplay between receptor ExIn ratio and macroscale functional out‐strength connectivity. Left panel shows the cortical ExIn ratios (high ratio values in red and low values in blue). Red regions depict cortical areas with an (relatively) excitatory chemoarchitecture, whereas blue regions depict regions with an (relatively) inhibitory character. Right panel depicts the observed positive association between local chemoarchitecture ExIn ratio (x‐axis) and the level of macroscale strychnine functional out‐strength of cortical areas (y‐axis) (r = 0.83, p = 0.0032). Figure illustrates the main finding of our study of the local excitatory chemoarchitecture of cortical areas to be of positive influence on outgoing global interregional functional influence of cortical areas. [Color figure can be viewed in the online issue, which is available at http://wileyonlinelibrary.com.]
DISCUSSION
Our findings show evidence of a direct interplay between the excitatory chemoarchitecture of cortical areas and their effective functional connectivity pattern on the macroscale of brain organization. Supported by the receptor‐driven neurobiological underpinnings of strychninization [Curtis et al., 1971], our study shows the out‐strength of cortical connectivity of cortical areas to be related to the excitatory and inhibitory nature of cortical areas, and in particular, their balance herein. A micro–macro interplay between regional variation in receptor densities and macroscale functional cortical connectivity contributes to the hypothesis of the emergence of global brain patterns to be dependent on microscale neuronal properties [Scholtens et al., 2014; Zilles et al., 1995]. Considering the original intentions of Dusser de Barenne to reveal the functional organization of regions of the visual, sensory, motor, and frontal cortex, it is not surprising that the strychnine functional modules as shown in the study of Stephan are in line with common functional [Stephan et al., 2000] and anatomical [Scholtens et al., 2014] subdivisions of the macaque cortex. Interestingly, multidimensional hierarchical clustering approaches in macaque did reveal first overlapping patterns of anatomical connectivity and receptor mappings, but did not observe direct relationships between receptor levels and total level of structural connectivity of cortical areas [Kötter et al., 2001; Scholtens et al., 2014]. Pandya et al. showed in the macaque and human cortex that distinct cytoarchitectonic subregions have unique patterns of corticocortical connectivity [Pandya and Sanides, 1973; Petrides and Pandya, 1999, 2002]. Furthermore, Beul et al. [2014] recently showed the relation between cytoarchitectonic type and structural connectivity, and we showed highly connected cortical areas to have higher neuronal complexity [Scholtens et al., 2014; van den Heuvel et al., 2015b, 2015c]. Taken together, cytoarchitectonic characteristics have been suggested to be potentially more directly related to anatomical projections and less to the smaller and more functionally operating scale of chemoarchitecture. In contrast, chemoarchitectural modulation—and in particular rich variation in cortical “receptor fingerprints”—has been hypothesized to rather relate to the functional organization of cortical regions [Zilles et al., 2002, 2004] with receptors and their corresponding neurotransmitters modulating neuronal signal transduction by means of integration and summation of excitatory and inhibitory input [Salling and Harrison, 2014]. Our current observations are in favor of such an important role of the chemoarchitecture of cortical areas in the emergence of large‐scale functional connectivity patterns across regions, showing evidence of the extent of effective functional connectivity of cortical regions to depend on their underlying chemical excitatory and inhibitory nature.
Whether the observed across‐region relationship between microscale chemoarchitecture and macroscale functional connectivity also holds within an individual region across time (e.g., on the relatively short timescale of task performance or on the much longer timescale of brain development) would be an interesting topic for future research. Over time, neurotransmitter receptors traffic between intracellular compartments and the neuronal membrane, thereby changing the distribution of active excitatory and inhibitory receptors [Choquet and Triller, 2013; Kneussel et al., 2014]. The receptor distributions included in this study are static snapshots of the macaque cortex at a certain time point and therefore do not enable examination of the influence of subtle changes in excitatory and inhibitory balance on the strength of functional connectivity within a region across time. Complementary research measuring changes in functional dynamics and receptor binding densities at different time points can contribute to a more complete understanding of the relationship between a region's chemoarchitecture and functional connectivity.
Our findings of cortical chemoarchitecture to play a modulating role in large‐scale functional processes are in line with earlier observations on positive interactions between functional connectivity as derived from resting‐state fMRI recordings and magnetic resonance spectroscopy (MRS) estimations of the chemical balance of cortical regions. As recently reviewed by Duncan et al. [2014], human MRI studies have reported on inverse interactions between individual variation in functional MRI measured cortical activity and GABA levels [e.g., Donahue et al., 2010], and positive relationships between functional connectivity and glutamate levels [e.g., Schmaal et al., 2012]. Furthermore, Kapogiannis et al. [2013] reported on higher levels of precuneus functional cortical activity and connectivity to be linked to local availability of glutamate and GABA transmitters, with in particular the ratio of excitatory glutamate and inhibitory GABA neurotransmission to show the strongest relationship with resting‐state fMRI functional connectivity patterns. This further underscores the importance of the excitatory/inhibitory chemical character of cortical regions in influencing global whole‐brain functional connectivity patterns [Duncan et al., 2014].
Induced functional connectivity patterns by strychninization are a consequence of a net excitatory reaction to a cortical target area by suppressing the receptor function of inhibitory glycine receptors and (partially) GABAA strychnine‐sensitive receptors in the source regions [De Barenne and McCulloch, 1938; Salling and Harrison, 2014]. In this context, it is worth to note that as a result of the strychnine administration, the retained inhibitory role of M2 receptors has been reported to become (relatively) more important in the local chemical balance of the source region, due to the temporary elimination of glycine and GABAergic receptor activity at the site of administration [Brown, 2010]. This is consistent with our findings showing strychnine‐induced functional connectivity out‐strength to have an inverse relationship with regional M2 receptor density (shown in Supporting Information, Fig. S4 and Table 1). Moreover, while strychninization may modulate inhibitory receptor action in the source region, the inhibitory mechanisms of the target regions are thought to be left unaffected, with the overall incoming (i.e., afferent) level of influence of other regions on the target region believed to remain relatively unchanged [Stephan et al., 2000]. Whether or not the target region will eventually become activated depends—among other things—on the neuron type, on which the majority of the efferents from the source region project, as well as on neuronal interactions within the target regions. As a result, strychninization is thought to have only a minimal influence on incoming signals of cortical areas, which is indeed consistent with our observations showing no strong relationships between receptor levels and cortical in‐strength.
As noted by Stephan et al. [2000], functional connectivity patterns derived from strychninization are known to be highly stable within and between specimens, as well as to be highly comparable to electroencephalography patterns acquired from direct electrical stimulation [De Barenne and McCulloch, 1938]. Comparable modern‐day examinations might include the study of effects of transcranial direct‐current stimulation (tDCS) and transcranial magnetic stimulation (TMS) on functional brain connectivity, techniques that both modulate cortical activity and therewith connectivity, albeit—clearly—in a much less‐invasive way than cortical strychninization [Pascual‐Leone et al., 2000]. TMS in the motor cortex has indeed been suggested to result in a temporary local decrease in GABAergic neurotransmission together with enhanced cortical excitability and to modulate global resting‐state functional connectivity patterns of the motor system [Stagg et al., 2011, 2009].
Considerations about the receptor densities have to be kept in mind when interpreting our presented findings on functional organization. First, it is important to note that neurotransmitter receptors are likely to act on multiple cellular mechanisms and may thus involve a long chain of both excitatory and inhibitory events, making the overall interpretation of their resulting modulatory effect on neuronal excitability considerably more complex. Ionotropic kainate receptors mediate postsynaptic glutamatergic neurotransmission having an overall excitatory effect on the postsynaptic neuron [Kandel et al., 2000]. Kainate receptors have, however, also been reported to play an indirect modulating role in the release of presynaptic GABA (see [Contractor et al., 2011] for an overview on the workings of kainate receptors). Second, in addition to classifying receptors based on their inhibitory and excitatory role, receptors are also often categorized according to their ionotropic or metabotropic nature. Ionotropic receptors such as AMPA, GABAA, and kainate (ion channels) are known for their fast and direct influence on the membrane potential, while slower acting metabotropic G‐protein‐coupled receptors such as M1, M2, and 5‐HT2A have been shown to have a more modulatory role on the membrane potential [see for an overview, Hammond, 2008]. We incorporated both types of receptors in our study, arguing that in the timespan of measured strychnine‐inducted cortical activity (ranging from 2 to 15 min, [De Barenne and McCulloch, 1938]), both types of receptors will have had an influence on neuronal activity. Third, autoradiography studies have noted the distribution of neurotransmitter receptors to vary widely across cortical layers [Geyer et al., 1998]. Layer‐specific information about connectivity modulation could thus have been lost when taking the average receptor density over cortical layers. High densities of kainate receptors have been reported in cortical layer 4 (described as an important layer for driving processes [Shipp, 2005] from subcortical and thalamic projections [Jones, 1998]), suggesting that kainate receptors may be particularly involved in reception of input from subcortical rather than corticocortical projections [Douglas and Martin, 2004]. In contrast, the highest densities of AMPA receptors have been noted in layer 2/3 cortical motor areas [Geyer et al., 1998], described as important target and source layers for corticocortical projections [Douglas and Martin, 2004]. Fourth, data on glutamatergic NMDA receptor levels was only available for a small number of WBB47 areas and we therefore excluded recordings of this type of receptor from our analysis. However, NMDA is one of the most prevalent excitatory receptors in the central nervous system, with receptor densities in the macaque visual, motor, and sensory cortex recorded to range from 19% to 46% of all excitatory synapses [Huntley et al., 1994]. Examination of NMDA receptors in relation to macroscale functional connectivity patterns may thus include an interesting and important topic for future studies.
We report on a small but potentially important next step in understanding a micro–macro interplay of mammalian brain organization. Our findings may be of interest to studies examining changes in functional connectivity in neurological and psychiatric disorders, as such conditions are often reported to involve alterations in both receptor and neurotransmitter levels (see, for example, a review about serotonin receptors [Naughton et al., 2000]) as well as large‐scale changes in interareal functional connectivity (see for example [Greicius, 2008] for review). Considering the interplay between macroscale cortical patterns and (dys‐)function of the chemoarchitecture of neural elements at the microscale may form a potential fruitful way to get insight into the biological underpinnings of large‐scale disruptions of functional connectivity in brain disorders.
Supporting information
Supporting Information
REFERENCES
- Adachi Y, Osada T, Sporns O, Watanabe T, Matsui T, Miyamoto K, Miyashita Y (2012): Functional connectivity between anatomically unconnected areas is shaped by collective network‐level effects in the macaque cortex. Cereb Cortex 22:1586–1592. [DOI] [PubMed] [Google Scholar]
- Amunts K, von Cramon DY (2006): The anatomical segregation of the frontal cortex: What does it mean for function? Cortex 42:525–528. [DOI] [PubMed] [Google Scholar]
- Beul SF, Grant S, Hilgetag CC (2014): A predictive model of the cat cortical connectome based on cytoarchitecture and distance. Brain Struct Funct 1–18. [DOI] [PMC free article] [PubMed] [Google Scholar]
- Brown DA (2010): Muscarinic acetylcholine receptors (mAChRs) in the nervous system: Some functions and mechanisms. J Mol Neurosci 41:340–346. [DOI] [PubMed] [Google Scholar]
- Choquet D, Triller A (2013): The dynamic synapse. Neuron 80:691–703. [DOI] [PubMed] [Google Scholar]
- Contractor A, Mulle C, Swanson GT (2011): Kainate receptors coming of age: Milestones of two decades of research. Trends Neurosci 34:154–163. [DOI] [PMC free article] [PubMed] [Google Scholar]
- Cossell L, Iacaruso MF, Muir DR, Houlton R, Sader EN, Ko H, Hofer SB, Mrsic‐Flogel TD (2015): Functional organization of excitatory synaptic strength in primary visual cortex. Nature 518:399–403. [DOI] [PMC free article] [PubMed] [Google Scholar]
- Curtis D, Duggan A, Johnston G (1971): The specificity of strychnine as a glycine antagonist in the mammalian spinal cord. Exp Brain Res 12:547–565. [DOI] [PubMed] [Google Scholar]
- Davidoff R, Aprison M, Werman R (1969): The effects of strychnine on the inhibition of interneurons by glycine and γ‐aminobutyric acid. Int J Neuropharmacol 8:191–194. [DOI] [PubMed] [Google Scholar]
- De Barenne JD (1924): Experimental researches on sensory localization in the cerebral cortex of the monkey (Macacus). Proc R Soc London Ser B 272–291. [Google Scholar]
- De Barenne JD, McCulloch WS (1938): Functional organization in the sensory cortex of the monkey (Macaca mulatta). J Neurophysiol 1:69–85. [Google Scholar]
- Donahue MJ, Near J, Blicher JU, Jezzard P (2010): Baseline GABA concentration and fMRI response. Neuroimage 53:392–398. [DOI] [PubMed] [Google Scholar]
- Douglas RJ, Martin KA (2004): Neuronal circuits of the neocortex. Annu Rev Neurosci 27:419–451. [DOI] [PubMed] [Google Scholar]
- Duncan NW, Wiebking C, Northoff G (2014): Associations of regional GABA and glutamate with intrinsic and extrinsic neural activity in humans—A review of multimodal imaging studies. Neurosci Biobehav Revs 47:36–52. [DOI] [PubMed] [Google Scholar]
- Gao X, Starmer J, Martin ER (2008): A multiple testing correction method for genetic association studies using correlated single nucleotide polymorphisms. Genet Epidemiol 32:361–369. [DOI] [PubMed] [Google Scholar]
- Geyer S, Matelli M, Luppino G, Schleicher A, Jansen Y, Palomero‐Gallagher N, Zilles K (1998): Receptor autoradiographic mapping of the mesial motor and premotor cortex of the macaque monkey. J Comparat Neurol 397:231–250. [DOI] [PubMed] [Google Scholar]
- Greicius M (2008): Resting‐state functional connectivity in neuropsychiatric disorders. Curr Opin Neurol 21:424–430. [DOI] [PubMed] [Google Scholar]
- Hammond, C. (2008) Cellular and Molecular Neurophysiology. Academic Press. [Google Scholar]
- Honey CJ, Thivierge JP, Sporns O (2010): Can structure predict function in the human brain? Neuroimage 52:766–776. [DOI] [PubMed] [Google Scholar]
- Huntley GW, Vickers JC, Morrison JH (1994): Cellular and synaptic localization of NMDA and non‐NMDA receptor subunits in neocortex: Organizational features related to cortical circuitry, function and disease. Trends Neurosci 17:536–543. [DOI] [PubMed] [Google Scholar]
- Jones E (1998): Viewpoint: The core and matrix of thalamic organization. Neuroscience 85:331–345. [DOI] [PubMed] [Google Scholar]
- Kandel ER, Schwartz JH, Jessell TM (2000): Principles of Neural Science. McGraw‐Hill: New York. [Google Scholar]
- Kapogiannis D, Reiter DA, Willette AA, Mattson MP (2013): Posteromedial cortex glutamate and GABA predict intrinsic functional connectivity of the default mode network. NeuroImage 64:112–119. [DOI] [PMC free article] [PubMed] [Google Scholar]
- Kneussel M, Triller A, Choquet D (2014): SnapShot: Receptor dynamics at plastic synapses. Cell 157:1738–1738. [DOI] [PubMed] [Google Scholar]
- Kötter, R. (2007) Anatomical concepts of brain connectivity In Handbook of Brain Connectivity, Springer; p 149–167. [Google Scholar]
- Kötter R, Stephan K, Palomero‐Gallagher N, Geyer S, Schleicher A, Zilles K (2001): Multimodal characterisation of cortical areas by multivariate analyses of receptor binding and connectivity data. Anatomy Embryol 204:333–349. [DOI] [PubMed] [Google Scholar]
- Li J, Ji L (2005): Adjusting multiple testing in multilocus analyses using the eigenvalues of a correlation matrix. Heredity 95:221–227. [DOI] [PubMed] [Google Scholar]
- Naughton M, Mulrooney JB, Leonard BE (2000): A review of the role of serotonin receptors in psychiatric disorders. Hum Psychopharmacol Clin Exp 15:397–415. [DOI] [PubMed] [Google Scholar]
- Pandya DN, Sanides F (1973): Architectonic parcellation of the temporal operculum in rhesus monkey and its projection pattern. Zeitschrift Für Anatomie Und Entwicklungsgeschichte 139:127–161. [DOI] [PubMed] [Google Scholar]
- Pascual‐Leone A, Walsh V, Rothwell J (2000): Transcranial magnetic stimulation in cognitive neuroscience–virtual lesion, chronometry, and functional connectivity. Curr Opin Neurobiol 10:232–237. [DOI] [PubMed] [Google Scholar]
- Passingham RE, Stephan KE, Kötter R (2002): The anatomical basis of functional localization in the cortex. Nat Rev Neurosci 3:606–616. [DOI] [PubMed] [Google Scholar]
- Petrides M, Pandya D (1999): Dorsolateral prefrontal cortex: Comparative cytoarchitectonic analysis in the human and the macaque brain and corticocortical connection patterns. Eur J Neurosci 11:1011–1036. [DOI] [PubMed] [Google Scholar]
- Petrides M, Pandya D (2002): Comparative cytoarchitectonic analysis of the human and the macaque ventrolateral prefrontal cortex and corticocortical connection patterns in the monkey. Eur J Neurosci 16:291–310. [DOI] [PubMed] [Google Scholar]
- Rubinov M, Sporns O (2010): Complex network measures of brain connectivity: Uses and interpretations. NeuroImage 52:1059–1069. [DOI] [PubMed] [Google Scholar]
- Salling MC, Harrison NL (2014): Strychnine‐sensitive glycine receptors on pyramidal neurons in layers II/III of the mouse prefrontal cortex are tonically activated. J Neurophysiol 112:1169–1178. [DOI] [PMC free article] [PubMed] [Google Scholar]
- Schmaal L, Goudriaan AE, Meer J, Brink W, Veltman DJ (2012): The association between cingulate cortex glutamate concentration and delay discounting is mediated by resting state functional connectivity. Brain Behav 2:553–562. [DOI] [PMC free article] [PubMed] [Google Scholar]
- Scholtens LH, Schmidt R, de Reus MA, van den Heuvel MP (2014): Linking macroscale graph analytical organization to microscale neuroarchitectonics in the macaque connectome. J Neurosci 34:12192–12205. [DOI] [PMC free article] [PubMed] [Google Scholar]
- Shipp S (2005): The importance of being agranular: A comparative account of visual and motor cortex. Philos Trans R Soc B Biol Sci 360:797–814. [DOI] [PMC free article] [PubMed] [Google Scholar]
- Sporns O, Tononi G, Kötter R (2005): The human connectome: A structural description of the human brain. PLoS Comput Biol 1:e42. [DOI] [PMC free article] [PubMed] [Google Scholar]
- Stagg CJ, Bachtiar V, Johansen‐Berg H (2011): The role of GABA in human motor learning. Curr Biol 21:480–484. [DOI] [PMC free article] [PubMed] [Google Scholar]
- Stagg CJ, Best JG, Stephenson MC, O'Shea J, Wylezinska M, Kincses ZT, Morris PG, Matthews PM, Johansen‐Berg H (2009): Polarity‐sensitive modulation of cortical neurotransmitters by transcranial stimulation. J Neurosci 29:5202–5206. [DOI] [PMC free article] [PubMed] [Google Scholar]
- Stephan KE, Hilgetag CC, Burns GA, O'Neill MA, Young MP, Kotter R (2000): Computational analysis of functional connectivity between areas of primate cerebral cortex. Philos Trans R Soc B Biol Sci 355:111–126. [DOI] [PMC free article] [PubMed] [Google Scholar]
- Ullo S, Nieus TR, Sona D, Maccione A, Berdondini L, Murino V (2014): Functional connectivity estimation over large networks at cellular resolution based on electrophysiological recordings and structural prior. Front Neuroanat 8:137. [DOI] [PMC free article] [PubMed] [Google Scholar]
- van den Heuvel MP, de Reus MA, Feldman Barrett L, Scholtens LH, Coopmans FM, Schmidt R, Preuss TM, Rilling JK, Li L (2015a): Comparison of diffusion tractography and tract‐tracing measures of connectivity strength in rhesus macaque connectome. Hum Brain Mapp. [DOI] [PMC free article] [PubMed] [Google Scholar]
- van den Heuvel MP, Kahn RS, Goñi J, Sporns O (2012): High‐cost, high‐capacity backbone for global brain communication. Proc Natl Acad Sci 109:11372–11377. [DOI] [PMC free article] [PubMed] [Google Scholar]
- van den Heuvel MP, Scholtens LH, Barrett LF, Hilgetag CC, de Reus MA (2015b): Bridging cytoarchitectonics and connectomics in human cerebral cortex. J Neurosci 35:13943–13948. [DOI] [PMC free article] [PubMed] [Google Scholar]
- van den Heuvel MP, Scholtens LH, de Reus MA, Kahn RS (2015c): Associated microscale spine density and macroscale connectivity disruptions in schizophrenia. Biol Psychiatry. [DOI] [PubMed] [Google Scholar]
- van den Heuvel MP, Sporns O (2013): An anatomical substrate for integration among functional networks in human cortex. J Neurosci 33:14489–14500. [DOI] [PMC free article] [PubMed] [Google Scholar]
- Von Bonin G, Bailey P (1947): The neocortex of Macaca mulatta . Illinois Monogr Med Sci 5 (4). [Google Scholar]
- Walker AE (1940): A cytoarchitectural study of the prefrontal area of the macaque monkey. J Comparat Neurol 73:59–86. [Google Scholar]
- Yuste R (2011): Dendritic spines and distributed circuits. Neuron 71:772–781. [DOI] [PMC free article] [PubMed] [Google Scholar]
- Zilles K, Palomero‐Gallagher N, Grefkes C, Scheperjans F, Boy C, Amunts K, Schleicher A (2002): Architectonics of the human cerebral cortex and transmitter receptor fingerprints: Reconciling functional neuroanatomy and neurochemistry. Eur Neuropsychopharmacol 12:587–599. [DOI] [PubMed] [Google Scholar]
- Zilles K, Palomero‐Gallagher N, Schleicher A (2004): Transmitter receptors and functional anatomy of the cerebral cortex. J Anat 205:417–432. [DOI] [PMC free article] [PubMed] [Google Scholar]
- Zilles K, Schlaug G, Matelli M, Luppino G, Schleicher A, Qü M, Dabringhaus A, Seitz R, Roland PE (1995): Mapping of human and macaque sensorimotor areas by integrating architectonic, transmitter receptor, MRI and PET data. J Anat 187:515–537. [PMC free article] [PubMed] [Google Scholar]
Associated Data
This section collects any data citations, data availability statements, or supplementary materials included in this article.
Supplementary Materials
Supporting Information