

Abstract
Ambiguous stimuli have been widely used to study the neuronal correlates of consciousness. Recently, it has been suggested that conscious perception might arise from the dynamic interplay of functionally specialized but widely distributed cortical areas. While previous research mainly focused on phase coupling as a correlate of cortical communication, more recent findings indicated that additional coupling modes might coexist and possibly subserve distinct cortical functions. Here, we studied two coupling modes, namely phase and envelope coupling, which might differ in their origins, putative functions and dynamics. Therefore, we recorded 128‐channel EEG while participants performed a bistable motion task and utilized state‐of‐the‐art source‐space connectivity analysis techniques to study the functional relevance of different coupling modes for cortical communication. Our results indicate that gamma‐band phase coupling in extrastriate visual cortex might mediate the integration of visual tokens into a moving stimulus during ambiguous visual stimulation. Furthermore, our results suggest that long‐range fronto‐occipital gamma‐band envelope coupling sustains the horizontal percept during ambiguous motion perception. Additionally, our results support the idea that local parieto‐occipital alpha‐band phase coupling controls the inter‐hemispheric information transfer. These findings provide correlative evidence for the notion that synchronized oscillatory brain activity reflects the processing of sensory input as well as the information integration across several spatiotemporal scales. The results indicate that distinct coupling modes are involved in different cortical computations and that the rich spatiotemporal correlation structure of the brain might constitute the functional architecture for cortical processing and specific multi‐site communication. Hum Brain Mapp 37:4099–4111, 2016. © 2016 Wiley Periodicals, Inc.
Keywords: large‐scale neuronal networks, EEG source analysis, intrinsic coupling modes, phase synchronization, amplitude envelope correlations, bistable perception, ambiguous perception, motion quartett, stroboscopic alternative motion, gamma oscillations
INTRODUCTION
The selective synchronization of oscillatory brain activity in widely distributed cortical areas is thought to constitute a key mechanism for conscious perception [Engel et al., 2001; Engel and Singer, 2001; Fries, 2005; Siegel et al., 2012]. In particular, it has been suggested that the brain utilizes its rich spatiotemporal patterning to multiplex operations in coupled cortical networks to increase information coding capacity [Onat et al., 2011; Siegel et al., 2012; Watrous et al., 2014]. The concept of intrinsic coupling modes (ICMs) [Engel et al., 2013] suggests that phase synchronization might represent a powerful mechanism to channel cortical information flow [Fries, 2005], while envelope coupling might regulate the activation of task‐relevant neuronal elements. Furthermore, distinct cognitive functions might be encoded in unique spectral signatures, that is, dynamically established task‐relevant cortical networks spanning several spatiotemporal scales, which subserve distinct cortical computations [Siegel et al., 2012].
Ambiguous stimuli are frequently used to assess neuronal correlates of conscious perception, given that a physically identical stimulus can be perceived as distinct percepts [Kornmeier and Bach, 2012]. The stroboscopic alternative motion (SAM; Fig. 1A) is one of the best‐characterized ambiguous stimuli, where the alternating presentation of two static displays can be perceived as either horizontal or vertical motion [Chaudhuri and Glaser, 1991]. It has been demonstrated to activate cortical motion‐sensitive areas [Sterzer et al., 2009] and might be mediated via callosal fibers connecting extra‐striate motion‐sensitive regions [Genç et al., 2011]. Furthermore, its perception has been associated with a variety of spectral signatures, such as frontal gamma‐band activity [Başar‐Eroglu et al., 1996] and posterior alpha‐band decrements [Strüber and Herrmann, 2002]. In particular, perceptual reversals have been associated with changes in frontal brain activity [Sterzer et al., 2009]. Importantly, the instantaneous percept might depend on the level of inter‐hemispheric gamma‐band connectivity to integrate information from both visual fields [Engel et al., 1991; Rose and Büchel, 2005], which can selectively be modulated through transcranial alternating current stimulation [Helfrich et al., 2014; Strüber et al., 2014]. Recently, it has become evident that synchronization processes in large‐scale networks might also modulate ambiguous perception and perceptual switches might be the result of slow fluctuations in network interactions [Hipp et al., 2011]. This raises the question regarding the nature of large‐scale neuronal correlates during ambiguous motion perception in the SAM.
Figure 1.
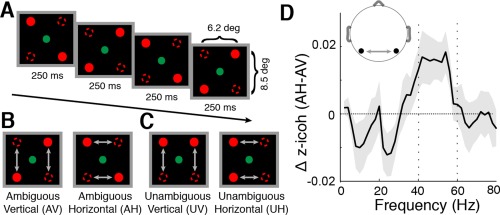
SAM stimulus and its electrophysiological key signature. (A) Alternating presentation of two displays with diagonal tokens. (B) All subjects perceived either vertical or horizontal motion with spontaneous perceptual reversals. (C) Subjects were also presented with an unambiguous control condition, where the visual tokens moved either vertically or horizontally. (D) Replication of the electrophysiological key signature as reported by Rose and Büchel (2005) prior to extensive ICA cleaning: Increased gamma‐band (40–60 Hz) imaginary coherence over parieto‐occipital EEG sensor pairs during ambiguous horizontal motion perception as compared with ambiguous vertical motion perception (AH–AV; shaded gray area depict SEM).
Here, we assessed whether distinct ICMs support the integration of visual tokens into a moving stimulus and whether they encode specific perceptual interpretations of the SAM stimulus. In order to replicate previous fMRI studies [Bartels and Logothetis, 2010; Brascamp et al., 2015; Fischer et al., 2012; Sterzer et al., 2003, 2006], we studied contrasts between ambiguous and unambiguous motion displays, as well as contrasts between the distinct perceptual interpretations of the stimuli. We aimed to replicate and extend previous findings on the role of inter‐areal gamma‐band connectivity for both the ambiguous and unambiguous SAM stimulus [Rose and Büchel, 2005]. Furthermore, we sought to further study the role of local gamma synchronization for the integration of ambiguous stimuli into a stable percept, which had previously been demonstrated in binocular rivalry [Fries et al., 1997].
Therefore, we employed high‐density electroencephalography (EEG) recordings while participants viewed the SAM in an ambiguous or disambiguated version (Fig. 1A–C). We utilized a variety of state‐of‐the‐art techniques to reduce artifacts and volume conduction effects, which hamper the analysis of sensor‐level EEG data. Hence, we utilized extensive ICA cleaning [Hipp and Siegel, 2013] along with novel source projection methods [Pascual‐Marqui et al., 2011]. Importantly, we employed connectivity measures which suppress coherent activity at zero phase and, therefore, minimize artefacts resulting from volume spread [Brookes et al., 2014]. Here, we tested source power, phase coupling by means of the imaginary part of coherency [Nolte et al., 2004] and envelope coupling by means of orthogonalized envelope correlations [Hipp et al., 2012] to identify spectral fingerprints of ambiguous motion perception within motion‐sensitive cortical areas [Helfrich et al., 2013; Sterzer et al., 2009].
MATERIAL AND METHODS
Participants
Eighteen naïve, right‐handed participants (nine male) aged between 21 and 33 years (24.9 ± 3.6; mean ± SD) were presented with the stroboscopic alternative motion stimulus (SAM; Fig. 1A) for a total of 60 minutes. Three participants had to be excluded because of technical difficulties during data acquisition and one subject was excluded because he did not perceive the stimulus bistability. Please note, one additional subject was only included for sensor—but not source‐level analyses, since the participant did not meet the minimum number of required trials for the source analyses (details see below). The study was conducted in accordance with the Declaration of Helsinki and had been approved by the local Ethics Committee of the Medical Association in Hamburg, Germany (IRB number: PV4335). All participants provided written informed consent.
Experimental Procedure
Participants were seated in a darkened, sound‐attenuated and electronically shielded room, facing an LED display on the table before them. In order to minimize line noise artefacts, fiber‐optic cables (inner diameter of 3 mm; 0.03° visual angle) were used to transmit the LED signals into the recording chamber. The display had a distance of 55 cm to the participants. LED illumination changed at a frequency of 2 Hz (full cycle). The horizontal dot distance was 6.2° and the vertical 8.5°. We introduced a shorter horizontal than vertical distance to compensate the vertical bias of equidistant SAMs [Chaudhuri and Glaser, 1991]. In order to quantify the amount of perceived horizontal and vertical motion, we calculated a motion dominance index [Strüber et al., 2014], which was defined as the difference between the average vertical and horizontal percept durations divided by their sum. This motion dominance index is bounded between plus/minus one and values larger than zero indicated a bias to the vertical percept, while values smaller than zero to horizontal motion percept and values close to zero highlight balanced distribution. In the present study, the mean motion dominance index was 0.0062 ± 0.0249 (mean ± SD), thus, highlighting a balanced distribution between horizontal and vertical motion percepts.
The SAM display was controlled by custom MATLAB (The MathWorks, Natick, MA) code on a Dell Latitude E6230 laptop. During the entire recording session, participants received continuous white noise stimulation over in‐ear headphones in order to minimize any ambient noise. Participants reported the perceived motion direction by button presses on a Boss FS‐6 Dual Foot Switch pedal (Roland Corporation, Shizuoka, Japan) with their right foot. Subjects were instructed to report vertical motion by pressing down the pedal, while they reported horizontal motion by releasing the pedal.
The stimulus presentation was divided into three blocks, each containing 20 trials of 60 seconds length. During each trial, participants had to keep fixating a central green LED the same size as the red stimulation LEDs. We presented a random sequence of 40 ambiguous and 20 unambiguous trials (Fig. 1B and C). Unambiguous trials contained one switch in motion direction per trial at a variable and randomly assigned time point between 20 and 40 seconds after trial onset. The order of initial motion direction (horizontal or vertical) was balanced across unambiguous trials of each participant and we ensured equal presentation times of either motion direction. After each block, participants had a short break of 5–10 minutes. We also recorded 2–3 minutes resting state data while participants were told to keep continuous fixation on the central LED before, after each break and after the recording session. Participants were familiarized with the ambiguous nature of the stimulus prior to recording in order to ensure that all subjects could reliably track their percept.
Data Acquisition
The EEG was recorded using BrainAmp amplifiers (Brain Products, Munich, Germany) with 124 active electrodes mounted in an elastic cap (EASYCAP GmbH, Herrsching, Germany) prepared with a slightly abrasive electrolyte gel (Abralyt 2000, Easycap, Herrsching, Germany). Two additional electrodes were placed below either eye for electrooculogram recordings. EEG data was sampled with an analog passband of 0.016–250 Hz, referenced against the nose‐tip, digitized at a sampling rate of 1,000 Hz and stored for offline analysis.
Data Analyses
Data analysis was performed using MATLAB® R2013a (The MathWorks, Natick, MA), FieldTrip (http://fieldtrip.fcdonders.nl/; Oostenveld et al., 2011) and customized MATLAB code.
Pre‐processing
Data was band‐pass filtered between 2 and 120 Hz, referenced to common average and down‐sampled to 500 Hz. Theoretically, different reference choices could differentially affect the coupling modes. However, most spatial filters as beamformers or LORETA are commonly applied after the data is common average referenced [Oostenveld et al., 2011]. Given that in previous studies we observed comparable results with noise tip referencing [Helfrich et al., 2014], we assume that the choice of reference only has a minor impact on the coupling modes. Line noise was removed by means of a notch‐filter as described previously [Voytek et al., 2010]. Then the entire data was segmented into non‐overlapping 500 ms epochs of continuous perception of every motion direction, excluding 1.25 seconds before and after a button press. For ambiguous epochs, we additionally excluded the time period from the beginning of the trial until the first reported percept switch to ensure the emergence of a stable percept. For unambiguous stimulation, reaction times were calculated based on the button press after the exogenous switch in motion direction. Epochs containing excessive noise, saccades, or muscle artefacts were removed after visual inspection. Bad channels were interpolated using spherical splines [Perrin et al., 1989].
ICA cleaning
It has recently been demonstrated that scalp EEG data is heavily contaminated with cranial muscle or microsaccadic artefacts, which constrain the analysis of oscillatory gamma‐band activity [Hipp and Siegel, 2013; Yuval‐Greenberg et al., 2008]. Here, we utilized independent component analysis (ICA), using the fastica algorithm [Hyvärinen and Oja, 2000] with a weight change less than 10−7 as stop criterion, based on the procedure described by Hipp and Siegel (2013). In addition to excluding typical eye‐movement and heartbeat artifacts, artifact components were defined based on three criteria: (I) localized topography, (II) high and broadband power in the frequencies greater than 30 Hz in relation to the alpha power, and (III) high variance in power over trials. Figure 2A–C illustrates several examples of rejected components, while Figure 2D–E depicts the effect of cleaning on sensor level alpha and gamma power. In total, 39.5 ± 11.18 (mean ± SD) components were rejected, resulting in an average decrease in gamma power of 63.31% relative to un‐cleaned data (averaged over 16 occipital electrodes‐of‐interest, black dots in Fig. 2D–E). In particular, the gamma‐band topography shows a maximum over occipital cortex, which is line with previous reports demonstrating parieto‐occipital gamma‐power increments during motion perception [Händel and Haarmeier, 2009; Siegel et al., 2007].
Figure 2.
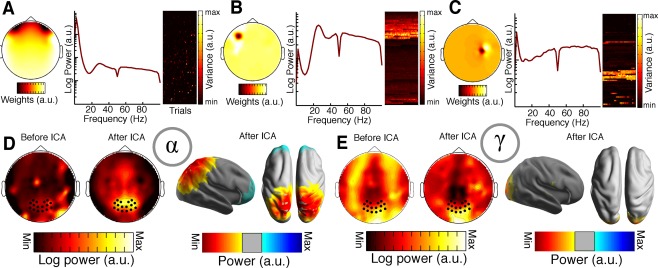
ICA artefact rejection procedure. (A–C) Various components that were classified as artefacts, based on their topography, broadband power distribution in frequencies greater than 30 Hz and their variance in power over trials [Hipp and Siegel, 2013]. Individual components were rejected after visual inspection. Each subplot depicts the sensor‐level topography (left), the power spectrum (middle), and the variance of the component time course over trials (right). Component variances are grouped sequentially for each trial from the upper left to the lower right. (D) The effects of cleaning on sensor and source level power are depicted as grand averages. Left: Sensor level topography of average alpha power across subjects before and after ICA cleaning. Right: Source space projection of average alpha power across subjects after ICA cleaning. (E) ICA cleaning effects on gamma power for sensor (left) and source (right) estimates. Note that the scaling is different for the ICA plots before and after cleaning.
Sensor‐level analyses
Spectral estimates at sensor level were calculated using a multi‐taper approach, based on discrete prolate slepian sequences [Jarvis and Mitra, 2001]. Frequencies below 30 Hz were analyzed with a frequency smoothing of ±4 Hz (3 tapers), while for frequencies above 30 Hz a smoothing of ±10 Hz was used (9 tapers). Previously, it has been demonstrated that sensor level analyses of human EEG data are severely constrained by volume spread in the cortical tissue [Siegel et al., 2012]. Here, we utilize imaginary coherence and orthogonalized envelope correlation as connectivity measures, which both suppress coherent activity at zero‐phase difference [Hipp et al., 2012; Nolte et al., 2004] and, thus, minimize the effect of volume conduction. In order to replicate previous findings [Rose and Büchel, 2005], coherence on sensor level was computed on different amounts of trials per condition and subject and subsequently corrected for potential biases by computing z‐transformed coherence differences [Maris et al., 2007]. Statistical testing was conducted by means of a cluster‐based randomization approach [Maris and Oostenveld, 2007] based on two‐sided dependent‐samples t‐tests. Monte–Carlo estimates of cluster probabilities were calculated at both a global‐ and cluster‐alpha of 0.05. Cluster size and intensity were weighted with a factor of 0.5. We used this weighting factor in order to account for the different options, which are available to define a cluster. The two most commonly options are “maxsum,” considers adjacent voxels with the cumulative highest t values as a cluster, while “maxsize” only considers the number of adjacent voxels. In order to have a trade‐off between size and effect strength, we weighted both options with 50:50.
Source‐level analyses
Source power estimates were calculated for every condition of interest [ambiguous horizontal (AH), ambiguous vertical (AV), unambiguous horizontal (UH), unambiguous vertical (UV), ambiguous (AMB), and unambiguous (UNAMB) motion] based on the cleaned and pre‐processed data. To avoid a sample‐size bias and to provide equal amounts of data for the spatial filter, we randomly selected 600 trials from every condition for source‐level analysis. Please note that one additional subject had to be excluded for source space analysis due to an insufficient amount (<600) of trials in one condition. Therefore, the remaining source analyses were carried out with 13 participants. We utilized different approaches to correct for sample size bias at sensor and source level. Initially, for the sensor level analyses we aimed to reproduce previously published results [Helfrich et al., 2014; Rose and Büchel, 2005] and, therefore, we utilized all the available data, even though the trial numbers were not matched. For source space analyses additional spatial filters were utilized, which in turn are also influenced by the sampling size bias and the total trial number. Therefore, we decided to randomly sample from every condition to obtain equal trial numbers across subjects and conditions, which were then subsequently used for the connectivity analysis.
Source power and connectivity were computed for four frequency bands: alpha (8–12 Hz), beta (16–36 Hz), low gamma (40–60 Hz), and high gamma (61–101 Hz). For computation, single‐subject cross‐spectra for each condition were calculated for frequencies between 8 and 101 Hz in steps of 2 Hz by using a Hanning window. We utilized a single taper, since multitapers are currently not supported by the function ft_connectivity_powcorr_ortho.m in FieldTrip to compute orthogonalized power correlations. Next, the cross‐spectra were averaged over all frequencies belonging to the respective frequency band (α, β, γ low, γ high) and subsequently projected into source space. The forward model was derived from the standard Boundary Element Method (BEM) volume conduction model as included in Fieldtrip [Oostenveld et al., 2003]. We estimated cortical activity at 1,289 voxel locations inside the brain, which corresponds to a homogeneously spaced grid with 1 cm spacing.
Power at source space was reconstructed by means of exact low‐resolution electromagnetic tomography approach (eLORETA; [Pascual‐Marqui et al., 2011]). Source power estimates were then compared between horizontal and vertical motion percepts for both stimulation conditions (ambiguous and unambiguous) by cluster‐based permutation testing. Based on previous sensor‐level studies [Helfrich et al., 2014; Rose and Büchel, 2005] we expected correlated activity in both hemispheres with the visual stimulus paradigm used in this study. Therefore, we utilized eLORETA instead of beamforming for source reconstruction, since beamforming results are less reliable when sources on both hemispheres are highly correlated [Gross et al., 2001; Pascual‐Marqui et al., 2011; Van Veen et al., 1997].
Two different measures of source connectivity, imaginary coherence [Nolte et al., 2004] and orthogonalized power‐envelope correlations [Hipp et al., 2012], were analyzed. For each measure, the connectivity between all voxels in the brain and one of three seed regions of interest (ROI) was computed. Bilateral ROIs were selected based on recent reports [Castelo‐Branco et al., 2002; Kleinschmidt et al., 1998; Sterzer et al., 2003; Sterzer and Kleinschmidt, 2005, 2007] as areas involved in generating the apparent motion percept, namely occipital cortex (OCC), posterior parietal cortex (PPC) and the human homologue of the motion‐sensitive medial temporal area in the monkey (MT+).
We utilized atlases to define three regions of interest that have previously been found in fMRI studies to be involved in the processing of the motion quartet stimulus [Sterzer et al., 2003, 2006, 2009; Sterzer and Kleinschmidt, 2005]. These three well‐established regions served as seeds for whole brain analyses. However, the regions that we obtained nicely correspond to additional regions that have been identified using fMRI. ROIs were defined on the voxel‐level using the AAL atlas [Tzourio‐Mazoyer et al., 2002] and the Brede Atlas (http://neuro.compute.dtu.dk/services/brededatabase/). Source reconstruction and estimation of source connectivity were performed using FieldTrip and a custom toolbox written in MATLAB (METH; M/EEG Toolbox of Hamburg; developed by Guido Nolte). Statistical analyses were done by means of cluster‐based permutation statistics after normalization using the Fisher Z‐transform. Only the absolute value of the normalized imaginary coherence estimate was used, as the sign is determined by the computation rather than physiological processes and, thus, not meaningful. Cluster‐based permutation tests were calculated for every comparison (AH vs. AV and AMB vs. UNAMB), connectivity estimate (imaginary coherence and power correlation), frequency band (α, β, γ low, γ high) and ROI (PPC, MT+, OCC). We conducted two‐sided t‐tests with a cluster alpha of 0.03. Therefore, positive and negative spatial clusters were built using voxels with a P‐value lower than 0.03 (P < 0.015 on each side). The cluster alpha was set to 0.03 rather than 0.05 in order to obtain more refined clusters. In order to correct for multiple comparisons, we applied false discovery rate correction (q = 0.05) for all tests within a given frequency band.
In order to determine which Brodmann areas were included in the significant clusters, the voxel positions of all significant voxels were converted into Talairach space and exported to the Talairach Client (http://www.talairach.org, 2003–2014, Mick Fox).
RESULTS
Increased Gamma Coherence Might Bind Visual Tokens to Moving Stimuli
Previously, horizontal motion perception in the SAM has been linked to increased gamma‐band coherence over parieto‐occipital cortical areas [Helfrich et al., 2014; Rose and Büchel, 2005]. We utilized the approach by Rose and Büchel (2005) prior to extensive ICA cleaning [Hipp and Siegel, 2013] and replicated their electrophysiological key finding of weakly increased gamma‐band (40–60 Hz) coherence over parieto‐occipital cortical areas (Fig. 1D; t 13 = 1.81, P < 0.05). Given the limitations of sensor‐level EEG analyses with various constraints (e.g., low spatial resolution and volume conduction), which hamper the connectivity analysis, we next proceeded to source space analysis.
Decreased Alpha Power Reflects Horizontal Motion Perception
Source power was compared within each frequency band between the horizontal and vertical motion percept for both ambiguous and unambiguous stimulation. We found that visual stimulation induced a prominent alpha power decrease of parieto‐occipital cortical regions (Fig. 3). The alpha power decrease was larger during ambiguous horizontal motion perception as compared with ambiguous vertical motion perception (AH–AV: P = 0.018; Fig. 3A). This effect was mainly confined to posterior parietal cortex and adjacent areas (BA 5, 7, and 40; Fig. 3A) as well as extrastriate visual cortex (BA 18/19). We found the same effect during unambiguous horizontal motion perception (UH–UV: P = 0.014; Fig. 3A). Figure 3B illustrates the spatial extent of the observed effects, indicating a lateralization to the left hemisphere during ambiguous motion perception, while unambiguous motion perception exhibited a bias to the right hemisphere (BA18/19). This observation was in line with a larger alpha power reduction over posterior parietal areas during ambiguous motion perception as compared with unambiguous motion perception (AMB–UNAMB: P = 0.034; BA17‐19, BA39‐40; see also Fig. 3B). No significant differences were found for the beta‐ and the gamma‐band between conditions or percepts (beta: AH–AV: P > 0.05, UH–UV: P > 0.05; gamma: AH–AV: P > 0.05, UH–UV: P > 0.05).
Figure 3.
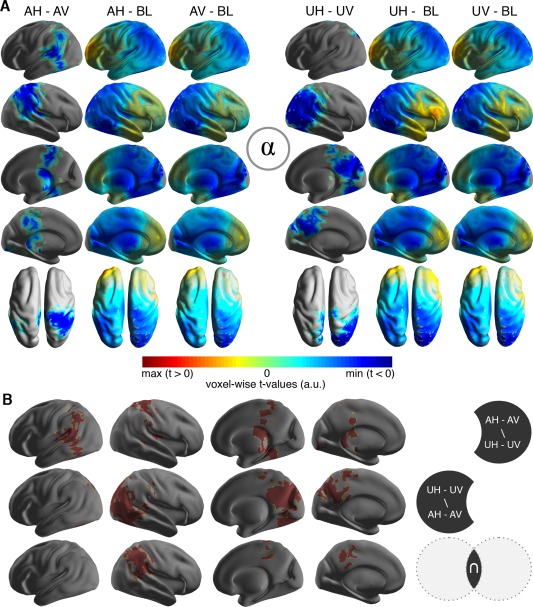
Modulation of alpha power during ambiguous motion perception. (A) Significant clusters of alpha‐power for the comparisons between horizontal and vertical motion during ambiguous (left side; AH–AV) and unambiguous (right side; UH–UV) stimulation. For each half of the figure, the leftmost column shows the t‐statistic of the significant cluster only. Middle and right columns show whole‐brain t‐statistics of the individual conditions compared against baseline (BL) during fixation. (B) Comparisons of the significant alpha‐power clusters for ambiguous and unambiguous motion. The sign \ depicts the set difference (A\B = elements in A that are not in B), the sign ∩ depicts the set intersection. The first row shows parts of the significant cluster for the comparison of ambiguous horizontal against vertical motion (AH–AV), which are not included in the respective unambiguous comparison (UH–UV) and vice versa in the second row. The third row depicts the overlap (∩), that is, voxels that were included in both clusters (AH–AV and UH–UV).
Analysis of Large‐Scale Neuronal Interactions in Source Space
Rose and Büchel (2005) suggested that the increased gamma‐band coherence over parieto‐occipital sensors might reflect an increased synchronization of MT+ bilaterally, while more recent reports indicated that ambiguous perception might stem from synchronization processes in large‐scale networks, which critically depend on parietal cortical areas [Helfrich et al., 2014; Hipp et al., 2011; Kanai et al., 2010, 2011; Zaretskaya et al., 2010].
We directly tested phase synchronization between MT+ bilaterally in source space to verify the assumption by Rose and Büchel (2005), but found no significant results for the low‐gamma (t 12 = 0.67, P = 0.44) or the high‐gamma range (t 12 = 0.72, P = 0.49). In addition, no significant effects were observed for the phase synchronization between the bilateral OCC and PPC ROIs for both frequency‐bands (all P > 0.05).
Subsequently, we pooled left and right ROIs to investigate large‐scale dynamics and to decrease the number of statistical comparisons. Hence, we tested two different coupling modes (envelope correlations and imaginary coherence) for all conditions, frequencies‐of‐interest and the three ROIs (OCC, PPC, MT+) across the entire brain with FDR‐corrected cluster permutation tests.
Increased Parieto‐Occipital Gamma Phase Coupling Mediates Ambiguous Motion Perception
We tested for phase coupling by means of the imaginary part of coherency [Nolte et al., 2004]. We found increased phase synchronization in the high gamma‐band during ambiguous motion perception as compared with unambiguous motion perception between PPC and the ventral stream (AMB‐UNAMB: P = 0.007, FDR‐corrected; Fig. 4A). This finding indicated increased coupling between PPC and extrastriate visual cortex (BA18/19) and inferior temporal cortex (BA20/21) during ambiguous motion perception, independent of the current percept. This effect was frequency and condition specific (all other cluster tests: P > 0.05) and not a result of oscillatory power differences in the voxels of the cluster (t 12 = 1.12, P = 0.29; Fig. 4E and Supporting Information Results).
Figure 4.
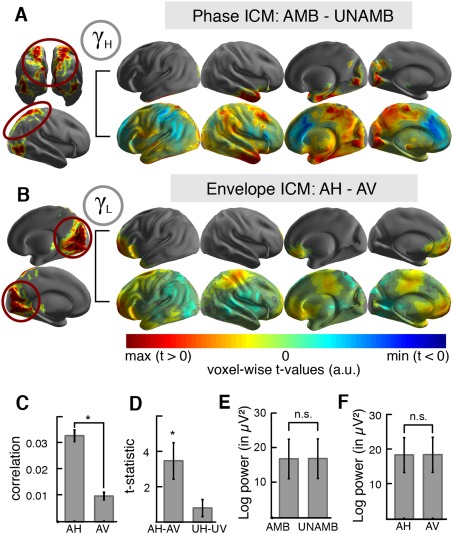
Intrinsic coupling modes during SAM perception. (A) Significant differences in the high‐gamma phase ICM. Left: Lateral and posterior view on seed voxels of the three ROIs (OCC, PPC, hMT+) projected onto an inflated surface (colors are arbitrary). The PPC ROI is encircled in red to highlight that the voxels in PPC were used as seeds for the significant cluster analysis. Right: The projected t‐statistic is depicted for the significant cluster (upper row) and the entire brain (lower row). The results indicate increased high gamma‐band phase synchronization along the ventral and dorsal visual stream during ambiguous motion perception as compared with unambiguous motion perception (AMB‐UNAMB). (B) Significant differences in the low‐gamma envelope ICM. Left: Medial view on occipital seed voxels (OCC; circled in red) projected onto an inflated brain surface (same color code conventions as in A). Right: The projected t‐statistic is depicted for the significant cluster (upper row) and the entire brain (lower row). The results indicate increased fronto‐occipital gamma envelope coupling during horizontal ambiguous motion perception as compared with vertical motion perception (AH–AV). (C) The gamma envelope correlation (see B) revealed a significantly higher fronto‐occipital correlation for ambiguous horizontal (AH) than for vertical (AV) motion perception (mean ± SEM; asterisk indicates significant cluster test). (D) The t‐statistic was extracted for the ambiguous (AH–AV) and the unambiguous (UH–UV) condition from the same ROIs. The results indicate that increased fronto‐occipital coupling sustained the horizontal percept during ambiguous motion perception. (E) Mean source high gamma power in the significant phase ICM cluster (see A) did not differ between ambiguous and unambiguous motion perception (AMB‐UNAMB; mean ± SEM). (F) Mean source low gamma power in the significant envelope ICM cluster (see B and C) did not differ between the horizontal and vertical percepts (AH–AV; same conventions as in D).
Increased Fronto‐Parietal Gamma Envelope Coupling Might Sustain the Horizontal Motion Percept
In order to analyze interactions in large‐scale cortical networks not captured by analysis of oscillatory phase coupling, we assessed orthogonalized envelope correlations [Hipp et al., 2012]. In the low gamma‐band, we found one significant positive cluster of increased envelope coupling between occipital and bilateral prefrontal areas during horizontal ambiguous motion perception (AH–AV: P = 0.006, FDR‐corrected; Fig. 4B and Supporting Information Results). In particular, ventrolateral prefrontal cortex, frontopolar and orbitofrontal cortex (BA10/11, BA38, and BA47) exhibited the strongest increase in envelope coupling to the occipital ROI. We assessed all other combinations in order to verify that this effect was frequency and condition specific and obtained no significant results (cluster test: all P > 0.05). In addition, our results indicated that this effect was not triggered by differences in source power (t 12 = 0.34, P = 0.74; Fig. 4F). Since absolute envelope correlation values can be negative, a positive t‐statistic does not indicate the sign of the correlation. Therefore, we extracted the mean z‐transformed correlation values from voxels in the significant cluster for each percept separately and obtained positive correlation values, indicating stronger fronto‐occipital envelope coupling during the horizontal percept (Fig. 4C). This effect was not present during unambiguous motion perception (Fig. 4D).
DISCUSSION
Our results support the hypothesis that selective synchronization of spatially distributed task‐relevant cortical areas mediates the conscious perception of a bistable motion stimulus. In particular, our results suggest that (i) parieto‐occipital alpha oscillations might influence inter‐hemispheric communication and subsequent motion perception, while (ii) the increased gamma phase synchronization along the visual stream could reflect a cortical integration mechanism to integrate the visual tokens into moving stimuli. Importantly, (iii) the emergence of the horizontal motion percept during ambiguous visual stimulation might require long‐range fronto‐occipital envelope coupling. This rich spatiotemporal patterning seems to reflect, both, the continuous reevaluation of periodic ambiguous sensory input as well as the integration processes occurring across cortical areas [Engel et al., 2013; Leopold and Logothetis, 1999; Siegel et al., 2012].
The Role of Cortical Network States for Ambiguous Perception
The present results provide correlative evidence that large‐scale cortical dynamics across multiple spatiotemporal scales might influence conscious perception [Engel et al., 2013; Engel and Singer, 2001; Siegel et al., 2012]. Bistable phenomena are ideally suited to study the underlying neuronal correlates of conscious perception, since identical sensory input gives rise to distinct perceptual interpretations [Kornmeier and Bach, 2012].
Perception of multi‐stable phenomena has been related to changes in local and long‐range oscillatory activity in large‐scale neuronal networks [Donner and Siegel, 2011; Engel and Singer, 2001; Fries et al., 1997]. While previous research mainly investigated perception‐related changes in local activity [Kornmeier and Bach, 2012], recent findings implied that intrinsic fluctuations in large‐scale networks influence the conscious perception of ambiguous stimuli [Hipp et al., 2011].
In case of the SAM, it has been demonstrated that frontal gamma power increments [Başar‐Eroglu et al., 1996] together with parieto‐occipital alpha power decrements [Strüber and Herrmann, 2002] precede a perceptual switch. Importantly, the subjects' perceptual bias was influenced by the level of interhemispheric gamma‐band coherence [Helfrich et al., 2014; Rose and Büchel, 2005] and the individual percept was enforced by selectively modulating coherence levels by tACS [Helfrich et al., 2014; Strüber et al., 2014]. Our present findings nicely reproduce and extend these previous results.
We replicated the weak coherence increase at sensor level during horizontal motion perception [Helfrich et al., 2014; Rose and Büchel, 2005], which has previously been interpreted as a mechanism for inter‐hemispheric feature integration. The present results at source‐level suggest that increased gamma phase synchronization along the visual stream might reflect an integrative process involved in integrating the visual tokens into a moving stimulus [Engel et al., 2001; Fries et al., 1997; Rose and Büchel, 2005; Siegel et al., 2008]. This finding of increased phase synchrony between primary and secondary visual areas is in line with the notion that more abstract motion perception requires the recruitment of higher‐order visual areas [Helfrich et al., 2013; Sterzer et al., 2009].
This interpretation is also supported by our observation that long‐range envelope coupling in the gamma‐range between frontal and occipital regions might sustain the horizontal percept during ambiguous motion perception. Previously, it has been suggested that frontal gamma‐band activity might trigger changes in parieto‐occipital networks [Baldauf and Desimone, 2014; Dehaene and Changeux, 2011] and thereby influence conscious visual perception [Başar‐Eroglu et al., 1996]. Frontal activity has been regularly observed in fMRI experiments on bistable perception [Sterzer et al., 2009].
In addition to these long‐range coupling effects, we also observed a significant modulation of parieto‐occipital alpha activity. Our analyses revealed higher alpha power during vertical motion perception. This finding has been interpreted in light of the gating‐by‐inhibition hypothesis [Jensen and Mazaheri, 2010]. Alpha increments could hereby serve as an active mechanism to block inter‐hemispheric information transfer during vertical motion perception, which does not require inter‐hemispheric interactions. In addition, we observed generally lower alpha power values during ambiguous motion perception, that is, in states of increased gamma synchronization. This finding further highlights the antagonistic role of alpha and gamma oscillations for visual processing [Helfrich et al., 2015; Jensen et al., 2014].
Taken together, the findings are well in line with the notion that several cortical processes are simultaneously active during ambiguous perception [Kornmeier and Bach, 2012]. While local alpha oscillations might play a role for the destabilization of the current percept on a slower time scale [Strüber and Herrmann, 2002], local and long‐range gamma‐band activity might sustain the current percept on a faster timescale and therefore, recruit additional frontal areas by envelope coupling.
Intrinsic Coupling Modes in Large‐Scale Neuronal Networks
Previously, it has been suggested that local synchronization processes mainly subserve sensory selection and processing [Donner and Siegel, 2011], while selective phase synchronization of spatially distributed cortical areas subserves inter‐areal communication and information transfer [Fries, 2005]. However, recent findings suggested that the cerebral cortex exhibits a phase‐independent large‐scale correlation structure [Hipp et al., 2012], which might be best analyzed by studying envelope coupling. So far, the evidence for distinct functional roles of both coupling modes (phase or envelope coupling) is sparse and has only recently been studied in the same datasets in humans [Mehrkanoon et al., 2014; Tewarie et al., 2014]. Engel et al. [2013] suggested that phase coupling might serve as mechanism to integrate and control the flow of cognitive contents, while envelope coupling might modulate cortical excitability and subsequent cognitive processing on a slower time scale. While the functional role of phase coupling has been extensively studied over the last 30 years [Engel et al., 2001; Fries, 2005; Siegel et al., 2012], the putative physiological function of envelope coupling is less well understood. The present evidence suggests that long‐range communication might be implemented by envelope coupling [Engel et al., 2013], in particular when oscillatory gamma activity drives the interaction [Helfrich et al., 2015; Jiang et al., 2015]. However, it is currently unclear if both coupling modes exhibit a differential sensitivity and specificity, that is, whether differences in could be explained by a different signal‐to‐noise sensitivity or how specific the observed patterns are. To what extend ICMs are influenced by these issues needs to be addressed in future studies.
Measuring synchrony and coupling in electrophysiological data as obtained by MEG/EEG recordings has been hampered by several constrains in the past. Micro‐ or macrosaccadic artefacts [Carl et al., 2012; Plöchl et al., 2012; Yuval‐Greenberg et al., 2008], as well as cranial muscle artefacts [Hipp and Siegel, 2013] along with volume conduction in the cortical tissue often hampered the analysis of sensor‐level MEG/EEG data. Here, we utilized a variety of state‐of‐the‐art techniques to reduce artefacts: We employed ICA cleaning [Hipp and Siegel, 2013] to reduce cranial and ocular muscle artefacts, along with novel source projection methods [Pascual‐Marqui et al., 2011] to reduce the influence of volume conduction. Importantly, we investigated phase and envelope coupling by means of measures which suppress coherent activity at zero phase (imaginary part of coherency, [Nolte et al., 2004]; orthogonalized envelope correlations, [Hipp et al., 2012]). Therefore, the effect of volume spread in the cortical tissue was minimized at the cost of ignoring possible physiological interactions [Demiralp et al., 2007]. Zero‐phase synchronization can be observed by invasive recordings and is known to occur even despite substantial conduction delays [Engel et al., 1991; König et al., 1995]. However, inter‐areal communication along processing pathways has also been shown to involve substantial phase lags [Bastos et al., 2015]. Hence, we assume that our choice of coupling metrics suppressed volume conduction effects while preserving a substantial fraction of true cortico‐cortical interactions. The application of blind‐source separation methods such as ICA is more crucial, since it possibly also eliminates physiological activity. Therefore, we closely followed recent reports on the successful separation of cranial muscle artefacts and ongoing cortical activity by employing the approach as described by Hipp and Siegel (2013; also see Fig. 2 for details). Additional artefacts were eliminated during projection into source space through a spatial filter, which further reduced possible confounds. Here, we employed the eLORETA approach [Pascual‐Marqui et al., 2011], since other techniques (e.g., linear beamforming; [Gross et al., 2001; Van Veen et al., 1997]) underestimate neuronal activity when sources in both hemispheres are highly correlated. In particular, a symmetric stimulus such as the SAM is less suitable for such an analysis. Note that all source space results were obtained after common average referencing (CAR), while in theory different referencing schemes could have been employed, which might alter phase connectivity estimates. Here, we used CAR since it is the most commonly used form in standard toolboxes [Oostenveld et al., 2011]. Taken together, we employed a conservative and carefully designed source‐space analysis approach to study the role of distinct coupling modes during bistable perception.
Confounds and Limitations
However, a number of limitations apply to this study. First, all the presented evidence is correlative in nature and therefore, does not provide direct information on causality or directionality of effects. However, these novel results nicely replicate and extend previous studies, which employed causal approaches by means of non‐invasive brain stimulation such as tACS [Helfrich et al., 2014; Strüber et al., 2014] or rhythmic TMS (transcranial magnetic stimulation, [Kanai et al., 2010; Zaretskaya et al., 2010]). Second, we replicated the effect of increased inter‐hemispheric gamma‐band coherence over extra‐striate EEG sensors during ambiguous horizontal motion perception [Helfrich et al., 2014; Rose and Büchel, 2005], which has been suggested to arise from selective synchronization of the motion‐sensitive MT+ complex bilaterally [Rose and Büchel, 2005]. However, we neither did find the hypothesized increased coupling effect in source‐space between MT+ bilaterally, nor between the occipital or the parietal ROIs, while we observed increments in gamma phase synchronization along the ventral and dorsal visual stream during ambiguous motion perception. As discussed above, previous results at sensor‐level might have been partly contaminated by volume spread in the cortical tissue [Rose and Büchel, 2005], in particular, since previous studies only investigated coupling differences for low numbers of symmetric bi‐hemispheric channel pairs [Helfrich et al., 2014; Rose and Büchel, 2005; Strüber et al., 2014]. Furthermore, interventions by means of tACS demonstrated a causal influence of the interhemispheric gamma‐band coherence, however, recent reports indicated that tACS might also modulate neuronal activity in coupled neuronal networks across several spatiotemporal scales [Cabral‐Calderin et al., 2015; Helfrich et al., 2015; Vosskuhl et al., 2015; Witkowski et al., 2015]. Therefore, we cannot rule out the possibility that tACS also modulated long‐range fronto‐occipital coupling, while some tACS effects might also be attributed to the co‐modulation of the parieto‐occipital alpha rhythm [Boyle and Fröhlich, 2013; Helfrich et al., 2015]. The equivocal findings further highlight the need for advanced source analysis methods to minimize artefacts. Third, the present analysis was limited to three ROIs, which were collapsed across hemispheres after direct interactions between left and right counterparts were excluded in order to lower the number of statistical comparisons. The ROIs were defined in accordance with previous fMRI findings. A data‐driven approach could solve this issue [Hipp et al., 2011], however, it massively increases the number of multiple comparisons, and thus reduces statistical power which is not desirable. Fourth, a recent study demonstrated that resting‐state connectivity patterns are highly similar for both coupling modes [Mehrkanoon et al., 2014] and baseline activity could differentially modulate both task‐related ICMs [Tewarie et al., 2014]. However, the recorded resting state data was too short to thoroughly analyze resting‐state connectivity patterns, which ideally require more than eight minutes of recording [Hipp et al., 2012]. Here, we demonstrated that different ICMs might mediate distinct perceptual interpretations of an ambiguous stimulus. This observation is independent of their, in this study unknown common baseline. To what extend resting‐state ICM patterns influence task‐related networks needs to be addressed in future studies, that are specifically tailored to address this question. Fifth, all analyses are non‐directional in nature. Here, we segmented the data according to the reported percept. Then, we considered those epochs as static and omitted the time around the button press. In order to disentangle bottom‐up and top‐down processes, one requires a better estimate when the switch occurs. It has been demonstrated that the button press does not provide a reliable estimate due to quite large trial‐by‐trial variations [Strüber and Herrmann, 2002]. Experimental approaches how to overcome this limitation include either task design [Brascamp et al., 2015; Kornmeier and Bach, 2012] or another physiological measure such as pupil diameter [Kloosterman et al., 2015].
CONCLUSIONS
Taken together, we provide correlative evidence for the functionally distinct role of different coupling modes, which support the conscious perception of a bistable motion stimulus. Our results reconcile previous equivocal findings on spectral signatures of bistable perception and demonstrate that phase and envelope couplings of oscillatory brain activity simultaneously support the constant reevaluation of sensory input as well as large‐scale integration processes. In particular, they highlight that different coupling modes subserve distinct cortical processes. Future research on intrinsic coupling modes will extend our understanding of their physiological role for conscious perception in the healthy and diseased brain, such as in schizophrenia or autism spectrum disorders [David et al., 2010; Engel et al., 2013; Uhlhaas and Singer, 2010]. This approach might then provide the opportunity of tailored interventions by novel non‐invasive brain stimulation tools developed to selectively modulate distinct coupling modes [Helfrich et al., 2014, 2015; Schulz et al., 2013].
Supporting information
Supporting Information Figure S1
ACKNOWLEDGEMENTS
This work was supported by grants from the European Union (FP7‐ICT‐270212, ERC‐2010‐AdG‐269716, AKE, PK), the German Research Foundation (SFB936/A3/B6/Z1, AKE, PK), the German National Academic Foundation (RFH) and the Alexander von Humboldt Foundation (Feodor Lynen Program, RFH). The authors declare no competing financial interests.
Corrections added on 09 July 2016, after online publication.
REFERENCES
- Baldauf D, Desimone R (2014): Neural mechanisms of object‐based attention. Science 344:424–427. [DOI] [PubMed] [Google Scholar]
- Bartels A, Logothetis NK (2010): Binocular rivalry: A time dependence of eye and stimulus contributions. J Vis 10:3. [DOI] [PubMed] [Google Scholar]
- Başar‐Eroglu C, Strüber D, Kruse P, Başar E, Stadler M (1996): Frontal gamma‐band enhancement during multistable visual perception. Int J Psychophysiol Off J Int Organ Psychophysiol 24:113–125. [DOI] [PubMed] [Google Scholar]
- Bastos AM, Vezoli J, Fries P (2015): Communication through coherence with inter‐areal delays. Curr Opin Neurobiol 31:173–180. [DOI] [PubMed] [Google Scholar]
- Boyle MR, Fröhlich F (2013): EEG feedback‐controlled transcranial alternating current stimulation. In: 2013 6th International IEEE/EMBS Conference on Neural Engineering (NER). pp 140–143.
- Brascamp J, Blake R, Knapen T (2015): Negligible fronto‐parietal BOLD activity accompanying unreportable switches in bistable perception. Nat Neurosci 18:1672–1678. [DOI] [PMC free article] [PubMed] [Google Scholar]
- Brookes MJ, O'Neill GC, Hall EL, Woolrich MW, Baker A, Palazzo Corner S, Robson SE, Morris PG, Barnes GR (2014): Measuring temporal, spectral and spatial changes in electrophysiological brain network connectivity. NeuroImage 91:282–299. [DOI] [PubMed] [Google Scholar]
- Cabral‐Calderin Y, Anne Weinrich C, Schmidt‐Samoa C, Poland E, Dechent P, Bähr M, Wilke M (2015): Transcranial alternating current stimulation affects the BOLD signal in a frequency and task‐dependent manner. Hum Brain Mapp 37:94–121. [DOI] [PMC free article] [PubMed] [Google Scholar]
- Carl C, Açık A, König P, Engel AK, Hipp JF (2012): The saccadic spike artifact in MEG. NeuroImage 59:1657–1667. [DOI] [PubMed] [Google Scholar]
- Castelo‐Branco M, Formisano E, Backes W, Zanella F, Neuenschwander S, Singer W, Goebel R (2002): Activity patterns in human motion‐sensitive areas depend on the interpretation of global motion. Proc Natl Acad Sci 99:13914–13919. [DOI] [PMC free article] [PubMed] [Google Scholar]
- Chaudhuri A, Glaser DA (1991): Metastable motion anisotropy. Vis Neurosci 7:397–407. [DOI] [PubMed] [Google Scholar]
- David N, Rose M, Schneider TR, Vogeley K, Engel AK (2010): Brief report: Altered horizontal binding of single dots to coherent motion in autism. J Autism Dev Disord 40:1549–1551. [DOI] [PubMed] [Google Scholar]
- Dehaene S, Changeux J‐P (2011): Experimental and theoretical approaches to conscious processing. Neuron 70:200–227. [DOI] [PubMed] [Google Scholar]
- Demiralp T, Herrmann CS, Erdal ME, Ergenoglu T, Keskin YH, Ergen M, Beydagi H (2007): DRD4 and DAT1 polymorphisms modulate human gamma band responses. Cereb Cortex 17:1007–1019. [DOI] [PubMed] [Google Scholar]
- Donner TH, Siegel M (2011): A framework for local cortical oscillation patterns. Trends Cogn Sci 15:191–199. [DOI] [PubMed] [Google Scholar]
- Engel AK, Singer W (2001): Temporal binding and the neural correlates of sensory awareness. Trends Cogn Sci 5:16–25. [DOI] [PubMed] [Google Scholar]
- Engel AK, König P, Kreiter AK, Singer W (1991): Interhemispheric synchronization of oscillatory neuronal responses in cat visual cortex. Science 252:1177–1179. [DOI] [PubMed] [Google Scholar]
- Engel AK, Fries P, Singer W (2001): Dynamic predictions: Oscillations and synchrony in top‐down processing. Nat Rev Neurosci 2:704–716. [DOI] [PubMed] [Google Scholar]
- Engel AK, Gerloff C, Hilgetag CC, Nolte G (2013): Intrinsic coupling modes: Multiscale interactions in ongoing brain activity. Neuron 80:867–886. [DOI] [PubMed] [Google Scholar]
- Fischer E, Bülthoff HH, Logothetis NK, Bartels A (2012): Visual motion responses in the posterior cingulate sulcus: A comparison to V5/MT and MST. Cereb Cortex 22:865–876. [DOI] [PMC free article] [PubMed] [Google Scholar]
- Fries P (2005): A mechanism for cognitive dynamics: Neuronal communication through neuronal coherence. Trends Cogn Sci 9:474–480. [DOI] [PubMed] [Google Scholar]
- Fries P, Roelfsema PR, Engel AK, König P, Singer W (1997): Synchronization of oscillatory responses in visual cortex correlates with perception in interocular rivalry. Proc Natl Acad Sci 94:12699–12704. [DOI] [PMC free article] [PubMed] [Google Scholar]
- Genç E, Bergmann J, Singer W, Kohler A (2011): Interhemispheric connections shape subjective experience of bistable motion. Curr Biol 21:1494–1499. [DOI] [PubMed] [Google Scholar]
- Gross J, Kujala J, Hämäläinen M, Timmermann L, Schnitzler A, Salmelin R (2001): Dynamic imaging of coherent sources: Studying neural interactions in the human brain. Proc Natl Acad Sci 98:694–699. [DOI] [PMC free article] [PubMed] [Google Scholar]
- Händel B, Haarmeier T (2009): Cross‐frequency coupling of brain oscillations indicates the success in visual motion discrimination. NeuroImage 45:1040–1046. [DOI] [PubMed] [Google Scholar]
- Helfrich RF, Becker HGT, Haarmeier T (2013): Processing of coherent visual motion in topographically organized visual areas in human cerebral cortex. Brain Topogr 26:247–263. [DOI] [PubMed] [Google Scholar]
- Helfrich RF, Knepper H, Nolte G, Strüber D, Rach S, Herrmann CS, Schneider TR, Engel AK (2014): Selective modulation of interhemispheric functional connectivity by HD‐tACS shapes perception. PLoS Biol 12:e1002031. [DOI] [PMC free article] [PubMed] [Google Scholar]
- Helfrich RF, Herrmann CS, Engel AK, Schneider TR (2015): Different coupling modes mediate cortical cross‐frequency interactions. NeuroImage, in press. doi: 10.1016/j.neuroimage.2015.11.035. [DOI] [PubMed] [Google Scholar]
- Hipp JF, Siegel M (2013): Dissociating neuronal gamma‐band activity from cranial and ocular muscle activity in EEG. Front Hum Neurosci 7:338. [DOI] [PMC free article] [PubMed] [Google Scholar]
- Hipp JF, Engel AK, Siegel M (2011): Oscillatory synchronization in large‐scale cortical networks predicts perception. Neuron 69:387–396. [DOI] [PubMed] [Google Scholar]
- Hipp JF, Hawellek DJ, Corbetta M, Siegel M, Engel AK (2012): Large‐scale cortical correlation structure of spontaneous oscillatory activity. Nat Neurosci 15:884–890. [DOI] [PMC free article] [PubMed] [Google Scholar]
- Hyvärinen A, Oja E (2000): Independent component analysis: Algorithms and applications. Neural Netw 13:411–430. [DOI] [PubMed] [Google Scholar]
- Jarvis MR, Mitra PP (2001): Sampling properties of the spectrum and coherency of sequences of action potentials. Neural Comput 13:717–749. [DOI] [PubMed] [Google Scholar]
- Jensen O, Mazaheri A (2010): Shaping functional architecture by oscillatory alpha activity: Gating by inhibition. Front Hum Neurosci 4:186. [DOI] [PMC free article] [PubMed] [Google Scholar]
- Jensen O, Gips B, Bergmann TO, Bonnefond M (2014): Temporal coding organized by coupled alpha and gamma oscillations prioritize visual processing. Trends Neurosci 37:357–369. [DOI] [PubMed] [Google Scholar]
- Jiang H, Bahramisharif A, van Gerven MAJ, Jensen O (2015): Measuring directionality between neuronal oscillations of different frequencies. NeuroImage 118:359–367. [DOI] [PubMed] [Google Scholar]
- Kanai R, Bahrami B, Rees G (2010): Human parietal cortex structure predicts individual differences in perceptual rivalry. Curr Biol CB 20:1626–1630. [DOI] [PMC free article] [PubMed] [Google Scholar]
- Kanai R, Carmel D, Bahrami B, Rees G (2011): Structural and functional fractionation of right superior parietal cortex in bistable perception. Curr Biol CB 21:R106–R107. [DOI] [PMC free article] [PubMed] [Google Scholar]
- Kleinschmidt A, Buchel C, Zeki S, Frackowiak RS (1998): Human brain activity during spontaneously reversing perception of ambiguous figures. Proc R Soc B Biol Sci 265:2427–2433. [DOI] [PMC free article] [PubMed] [Google Scholar]
- Kloosterman NA, Meindertsma T, van Loon AM, Lamme VAF, Bonneh YS, Donner TH (2015): Pupil size tracks perceptual content and surprise. Eur J Neurosci 41:1068–1078. [DOI] [PubMed] [Google Scholar]
- König P, Engel AK, Singer W (1995): Relation between oscillatory activity and long‐range synchronization in cat visual cortex. Proc Natl Acad Sci U S A 92:290–294. [DOI] [PMC free article] [PubMed] [Google Scholar]
- Kornmeier J, Bach M (2012): Ambiguous figures ‐ what happens in the brain when perception changes but not the stimulus. Front Hum Neurosci 6:51. [DOI] [PMC free article] [PubMed] [Google Scholar]
- Leopold DA, Logothetis NK (1999): Multistable phenomena: Changing views in perception. Trends Cogn Sci 3:254–264. [DOI] [PubMed] [Google Scholar]
- Maris E, Oostenveld R (2007): Nonparametric statistical testing of EEG‐ and MEG‐data. J Neurosci Methods 164:177–190. [DOI] [PubMed] [Google Scholar]
- Maris E, Schoffelen J‐M, Fries P (2007): Nonparametric statistical testing of coherence differences. J Neurosci Methods 163:161–175. [DOI] [PubMed] [Google Scholar]
- Mehrkanoon S, Breakspear M, Britz J, Boonstra TW (2014): Intrinsic coupling modes in source‐reconstructed electroencephalography. Brain Connect 4:812–825. [DOI] [PMC free article] [PubMed] [Google Scholar]
- Nolte G, Bai O, Wheaton L, Mari Z, Vorbach S, Hallett M (2004): Identifying true brain interaction from EEG data using the imaginary part of coherency. Clin Neurophysiol 115:2292–2307. [DOI] [PubMed] [Google Scholar]
- Onat S, König P, Jancke D (2011): Natural scene evoked population dynamics across cat primary visual cortex captured with voltage‐sensitive dye imaging. Cereb Cortex 21:2542–2554. [DOI] [PubMed] [Google Scholar]
- Oostenveld R, Stegeman DF, Praamstra P, van Oosterom A (2003): Brain symmetry and topographic analysis of lateralized event‐related potentials. Clin Neurophysiol 114:1194–1202. [DOI] [PubMed] [Google Scholar]
- Oostenveld R, Fries P, Maris E, Schoffelen J‐M (2011): FieldTrip: Open source software for advanced analysis of MEG, EEG, and invasive electrophysiological data. Comput Intell Neurosci 2011:156869. [DOI] [PMC free article] [PubMed] [Google Scholar]
- Pascual‐Marqui RD, Lehmann D, Koukkou M, Kochi K, Anderer P, Saletu B, Tanaka H, Hirata K, John ER, Prichep L, Biscay‐Lirio R, Kinoshita T (2011): Assessing interactions in the brain with exact low‐resolution electromagnetic tomography. Philos Transact a Math Phys Eng Sci 369:3768–3784. [DOI] [PubMed] [Google Scholar]
- Perrin F, Pernier J, Bertrand O, Echallier JF (1989): Spherical splines for scalp potential and current density mapping. Electroencephalogr Clin Neurophysiol 72:184–187. [DOI] [PubMed] [Google Scholar]
- Plöchl M, Ossandón JP, König P (2012): Combining EEG and eye tracking: Identification, characterization, and correction of eye movement artifacts in electroencephalographic data. Front Hum Neurosci 6:278. [DOI] [PMC free article] [PubMed] [Google Scholar]
- Rose M, Büchel C (2005): Neural coupling binds visual tokens to moving stimuli. J Neurosci Off J Soc Neurosci 25:10101–10104. [DOI] [PMC free article] [PubMed] [Google Scholar]
- Schulz R, Gerloff C, Hummel FC (2013): Non‐invasive brain stimulation in neurological diseases. Neuropharmacology 64:579–587. [DOI] [PubMed] [Google Scholar]
- Siegel M, Donner TH, Oostenveld R, Fries P, Engel AK (2007): High‐frequency activity in human visual cortex is modulated by visual motion strength. Cereb Cortex 17:732–741. [DOI] [PubMed] [Google Scholar]
- Siegel M, Donner TH, Oostenveld R, Fries P, Engel AK (2008): Neuronal synchronization along the dorsal visual pathway reflects the focus of spatial attention. Neuron 60:709–719. [DOI] [PubMed] [Google Scholar]
- Siegel M, Donner TH, Engel AK (2012): Spectral fingerprints of large‐scale neuronal interactions. Nat Rev Neurosci 13:121–134. [DOI] [PubMed] [Google Scholar]
- Sterzer P, Kleinschmidt A (2005): A neural signature of colour and luminance correspondence in bistable apparent motion. Eur J Neurosci 21:3097–3106. [DOI] [PubMed] [Google Scholar]
- Sterzer P, Kleinschmidt A (2007): A neural basis for inference in perceptual ambiguity. Proc Natl Acad Sci 104:323–328. [DOI] [PMC free article] [PubMed] [Google Scholar]
- Sterzer P, Eger E, Kleinschmidt A (2003): Responses of extrastriate cortex to switching perception of ambiguous visual motion stimuli. Neuroreport 14:2337–2341. [DOI] [PubMed] [Google Scholar]
- Sterzer P, Haynes J‐D, Rees G (2006): Primary visual cortex activation on the path of apparent motion is mediated by feedback from hMT+/V5. NeuroImage 32:1308–1316. [DOI] [PubMed] [Google Scholar]
- Sterzer P, Kleinschmidt A, Rees G (2009): The neural bases of multistable perception. Trends Cogn Sci 13:310–318. [DOI] [PubMed] [Google Scholar]
- Strüber D, Herrmann CS (2002): MEG alpha activity decrease reflects destabilization of multistable percepts. Brain Res Cogn Brain Res 14:370–382. [DOI] [PubMed] [Google Scholar]
- Strüber D, Rach S, Trautmann‐Lengsfeld SA, Engel AK, Herrmann CS (2014): Antiphasic 40 Hz oscillatory current stimulation affects bistable motion perception. Brain Topogr 27:158–171. [DOI] [PubMed] [Google Scholar]
- Tewarie P, Hillebrand A, van Dellen E, Schoonheim MM, Barkhof F, Polman CH, Beaulieu C, Gong G, van Dijk BW, Stam CJ (2014): Structural degree predicts functional network connectivity: A multimodal resting‐state fMRI and MEG study. NeuroImage 97:296–307. [DOI] [PubMed] [Google Scholar]
- Tzourio‐Mazoyer N, Landeau B, Papathanassiou D, Crivello F, Etard O, Delcroix N, Mazoyer B, Joliot M (2002): Automated anatomical labeling of activations in spm using a macroscopic anatomical parcellation of the mni mri single‐subject brain. NeuroImage 15:273–289. [DOI] [PubMed] [Google Scholar]
- Uhlhaas PJ, Singer W (2010): Abnormal neural oscillations and synchrony in schizophrenia. Nat Rev Neurosci 11:100–113. [DOI] [PubMed] [Google Scholar]
- Van Veen BD, van Drongelen W, Yuchtman M, Suzuki A (1997): Localization of brain electrical activity via linearly constrained minimum variance spatial filtering. IEEE Trans Biomed Eng 44:867–880. [DOI] [PubMed] [Google Scholar]
- Vosskuhl J, Huster RJ, Herrmann CS (2015): BOLD signal effects of transcranial alternating current stimulation (tACS) in the alpha range: A concurrent tACS‐fMRI study. NeuroImage, in press. doi: 10.1016/j.neuroimage.2015.10.003. [DOI] [PubMed] [Google Scholar]
- Voytek B, Canolty RT, Shestyuk A, Crone NE, Parvizi J, Knight RT (2010): Shifts in gamma phase‐amplitude coupling frequency from theta to alpha over posterior cortex during visual tasks. Front Hum Neurosci 4:191. [DOI] [PMC free article] [PubMed] [Google Scholar]
- Watrous AJ, Fell J, Ekstrom AD, Axmacher N (2014): More than spikes: Common oscillatory mechanisms for content specific neural representations during perception and memory. Curr Opin Neurobiol 31C:33–39. [DOI] [PMC free article] [PubMed] [Google Scholar]
- Witkowski M, Garcia‐Cossio E, Chander BS, Braun C, Birbaumer N, Robinson SE, Soekadar SR (2015): Mapping entrained brain oscillations during transcranial alternating current stimulation (tACS). NeuroImage, in press. doi: 10.1016/j.neuroimage.2015.10.024. [DOI] [PubMed] [Google Scholar]
- Yuval‐Greenberg S, Tomer O, Keren AS, Nelken I, Deouell LY (2008): Transient induced gamma‐band response in eeg as a manifestation of miniature saccades. Neuron 58:429–441. [DOI] [PubMed] [Google Scholar]
- Zaretskaya N, Thielscher A, Logothetis NK, Bartels A (2010): Disrupting parietal function prolongs dominance durations in binocular rivalry. Curr Biol 20:2106–2111. [DOI] [PubMed] [Google Scholar]
Associated Data
This section collects any data citations, data availability statements, or supplementary materials included in this article.
Supplementary Materials
Supporting Information Figure S1