

Abstract
Cerebral small vessel disease (SVD), including white matter hyperintensities (WMH), lacunes and microbleeds, and brain atrophy, are related to cognitive impairment. However, these magnetic resonance imaging (MRI) markers for SVD do not account for all the clinical variances observed in subjects with SVD. Here, we investigated the relation between conventional MRI markers for SVD, network efficiency and cognitive performance in 436 nondemented elderly with cerebral SVD. We computed a weighted structural connectivity network from the diffusion tensor imaging and deterministic streamlining. We found that SVD‐severity (indicated by higher WMH load, number of lacunes and microbleeds, and lower total brain volume) was related to networks with lower density, connection strengths, and network efficiency, and to lower scores on cognitive performance. In multiple regressions models, network efficiency remained significantly associated with cognitive index and psychomotor speed, independent of MRI markers for SVD and mediated the associations between these markers and cognition. This study provides evidence that network (in)efficiency might drive the association between SVD and cognitive performance. This hightlights the importance of network analysis in our understanding of SVD‐related cognitive impairment in addition to conventional MRI markers for SVD and might provide an useful tool as disease marker. Hum Brain Mapp 37:300–310, 2016. © 2015 Wiley Periodicals, Inc.
Keywords: cognition, graph‐theory, cerebral small vessel disease, structural brain networks
INTRODUCTION
Cerebral small vessel disease (SVD)‐related brain lesions include white matter hyperintensities (WMH), lacunes of presumed vascular origin, microbleeds, and brain atrophy [Pantoni, 2010; Wardlaw et al., 2013]. SVD is frequently observed in elderly individuals [de Leeuw et al., 1999] and is an important cause of cognitive and motor impairment [de Laat et al., 2011; Prins et al., 2005]. Despite several studies using conventional magnetic resonance imaging (MRI) and diffusion tensor imaging (DTI) [Roman et al., 2002; Tuladhar et al., 2015a, 2015b; van Norden et al., 2012a], it is still incompletely understood how SVD relates to these clinical symptoms. A presumed mechanism is that SVD disrupts the structural connectivity within a large‐scale brain network, thereby impairing the brain's ability to integrate the neural processes efficiently.
Graph theory is a mathematical tool that allows for the analysis and quantification of these large‐scale brain networks [Bullmore and Sporns, 2009] and their relationship with cognitive function. Structural connectivity can be derived from imaging techniques such as DTI followed by whole‐brain tractography [Gong et al., 2009; Shu et al., 2009; Verstraete et al., 2011; Zalesky et al., 2011]. In graph‐theoretical framework, a structural network consists of a set of nodes (brain regions) connected by edges (white matter tracts). Recently, several studies showed that the network efficiency is associated with cognition in various diseases with white matter abnormalities [Lawrence et al., 2014; Reijmer et al., 2013, 2015; Wen et al., 2011b]. However, it is not yet clear, how network efficiency relates to the conventional MRI markers for SVD markers (WMH, lacunes, microbleeds, and brain atrophy) and to cognitive performance in cognitively rather healthy participants with various degrees of SVD, while taking these MRI markers for SVD into account.
We hypothesized that the SVD‐severity, indicated by MRI markers for SVD, is related to network efficiency, and on its turn with cognitive performance, independent of these MRI markers. To this end, we measured the degree of the structural connectivity using DTI and whole‐brain tractography in participants with SVD. Graph‐theoretical analyses were then conducted to examine the relation between MRI markers for SVD, network efficiency, and cognitive performance from a network perspective.
MATERIAL AND METHODS
Study Population
The study sample is part of the “Radboud University Nijmegen Diffusion tensor and MRI Cohort” (RUN DMC) study [van Norden et al., 2011], a prospective study that was designed to investigate risk factors and cognitive, motor, and mood consequences of functional and structural brain changes as assessed by MRI among elderly with cerebral SVD. The primary study outcome of the longitudinal part of this study is the development of dementia or parkinsonism.
Cerebral SVD is characterized on neuroimaging by either WMH and/or lacunes of presumed vascular origin. Symptoms of SVD can be acute, such as transient ischemic attacks (TIAs) or lacunar syndromes, or subacute manifestations, such as cognitive, motor and/or mood disturbances [Roman et al., 2002]. Because the onset of cerebral SVD is often insidious, clinically heterogeneous, and typically with mild symptoms, it has been suggested that the selection of participants with cerebral SVD in clinical studies should be based on these more consistent brain imaging features [Erkinjuntti, 2002]. Consecutive patients referred to the Department of Neurology between October 2002 and November 2006, were selected for participation.
Inclusion criteria were (a) age between 50 and 85 years, and (b) cerebral SVD on neuroimaging (presence of WMH and/or lacunes). The aforementioned acute or subacute clinical symptoms of SVD were assessed by standardized assessment. Patients who were eligible because of lacunar syndrome were included only >6 months after the event to avoid acute effects on the outcomes. Exclusion criteria were (a) dementia, (b) parkinson(ism), (c) intracranial hemorrhage, (d) life expectancy < 6 months, (e) intracranial space occupying lesion, (f) (psychiatric) disease interfering with cognitive or motor testing, (g) recent or current use of acetylcholine‐esterase inhibitors, neuroleptic agents, l‐dopa, or dopa‐agonist/antagonists, (h) non‐SVD‐related WMH mimics (e.g., multiple sclerosis), (i) prominent visual or hearing impairment, (j) language barrier and (k) MRI contraindications or known claustrophobia.
Participants were selected for participation in the study by a three‐step approach. After reviewing the medical history, 1,004 individuals were invited by letter. Of those 1,004, 727 were eligible after contact by telephone phone and 525 agreed to participate. In 22 subjects, exclusion criteria were found during their visit to our research centre (14 with unexpected claustrophobia, one died before MRI scanning, one was diagnosed with multiple sclerosis, in one there was a language barrier, one subject fulfilled the criteria for Parkinson's disease, and four met the dementia criteria), yielding a response of 71.3% (503/705) for the original cohort of the study. These 503 individuals had symptoms of TIA or lacunar syndrome (n = 219), cognitive disturbances (n = 245), motor disturbances (n = 97), depressive symptoms (n = 100), or a combination thereof. For this study, 67 participants were excluded due to territorial infarcts, inadequate quality of the MRI images, or failure of the DTI pipeline. More detailed information about the recruitment of the study sample can be found in our study protocol [van Norden et al., 2011]. All participants gave written informed consent according to the Declaration of Helsinki. The medical ethics committee region Arnhem–Nijmegen approved the study.
Cognitive Function
All participants underwent an extensive neuropsychological assessment, which included the Mini Mental State Examination (MMSE), Rey auditory verbal learning test (RAVLT), Rey's complex figure test, paper–pencil memory scanning task, Stroop test, verbal series attention test, and symbol–digit substitution task. Detailed information can be found in the reference [van Norden et al., 2011]. The raw test scores were transformed to z‐scores and thematically similar test were used to calculate cognitive performance: Global cognitive function was evaluated by MMSE and cognitive index. Cognitive index is a compound score that includes the mean of the z‐scores of the one‐letter subtask of the paper–pencil memory scanning task, the mean of the reading subtask of the Stroop test, the mean of the symbol–digit substitution task and the mean of the added score on the three learning trials and the delayed recall of the RAVLT [de Groot et al., 2000]. Verbal memory was calculated as the mean of the added score on the three learning trials and the delayed recall of the RAVLT. Visuospatial memory is a compound score of the mean of the immediate recall trial and the delayed recall trial of the Rey's complex figure test. Psychomotor speed was calculated as the mean of the z‐scores of the one‐letter subtask of the paper–pencil memory scanning task, the reading subtask of the Stroop test, and the symbol–digit substitution task. Fluency was calculated as the mean of both verbal fluency tasks. Concept shifting was calculated as the z‐score of the third subtask of the Stroop, the inference task. Attention is a compound score of the total time of the verbal series attention test. The test scores of shifting, psychomotor speed, and attention test were inverted, such that higher scores reflect higher performance.
Other Measurements
Age, gender, education [Hochstenbach et al., 1998], and depressive symptoms were considered as potential confounders. Depressive symptoms were assessed using Center of Epidemiological Studies on Depression scale (CES‐D). Hypertension was defined as systolic blood pressure ≥140 mm Hg or diastolic blood pressure ≥ 90 mm Hg and/or use of antihypertensive drugs. Blood pressures were measured three times in supine position after 5 min rest. Diabetes and hypercholesterolemia were considered to be present if the participant was taking antidiabetic or lipid‐lowering drugs for high cholesterol. Body mass index (BMI) was calculated as weight divided by height (in m) squared. The smoking status was obtained through standardized questionnaires, which was checked during the interview (Table 1).
Table 1.
Baseline characteristics of 436 subjects
| Characteristics | |
|---|---|
| Demographic characteristics | |
| Age, years (SD) | 65.2 (8.8) |
| Female (%) | 199 (45.6) |
| Education, score (range) | 5 (1–7) |
| CES‐D scale, score (SD) | 11.2 (9.5) |
| MMSE, score (range) | 29 (27–30) |
| Vascular risk factors | |
| Hypertension, number (%) | 316 (72.5) |
| Diabetes mellitus, number (%) | 302 (69.3) |
| Use of lipid‐lowering drugs, number (%) | 191 (43.8) |
| BMI, kg/m2 (SD) | 27.1 (4.2) |
| Smoking status | |
| Never, number (%) | 134 (30.7) |
| Former, number (%) | 236 (54.1) |
| Current, number (%) | 66 (15.1) |
| Neuroimaging characteristics | |
| Total brain volume, ml (SD) | 1097.8 (120.8) |
| WM volume, ml (SD) | 467.1 (65.8) |
| WMH volume, ml (range) | 6.4 (3.3; 16.7) |
| Lacune(s) (%) | 97 (22.3) |
| Microbleed(s) (%) | 67 (15.4) |
| Mean FA (SD) | 0.40 (0.03) |
| Mean MD, mm2 ⋅ s−1 × 10⁻³ (SD) | 0.0009 (0.0001) |
| Network properties | |
| Density (SD) | 0.12 (0.009) |
| Network strength (SD) | 0.07 (0.016) |
| Global efficiency (SD) | 0.004 (0.001) |
| Local efficiency (SD) | 0.004 (0.001) |
| Normalized global efficiency (SD) | 0.91 (0.04) |
| Normalized local efficiency) (SD) | 3.20 (0.59) |
Values represent mean (standard deviation), median (range), or presence (%). Education: 1 being less than primary school and 7 reflecting an academic degree. CES‐D: Center of Epidemiologic Studies on Depression. Lacune(s) or microbleed(s) represent number (percentage) of patients with one of more lacunes or microbleeds on MRI.
MMSE: Mini‐Mental State Examination. WM: white matter. WMH: white matter hyperintensities.
MRI Acquisition
Magnetic resonance imaging was performed on a 1.5 T Siemens Magneton Sonata scanner (Siemens Medical Solutions, Erlangen, Germany), which included T1 3‐D magnetization‐prepared rapid gradient‐echo (MPRAGE) imaging (time repetition [TR] = 2.25 s, time echo [TE] = 3.68 ms, inversion time [TI] = 850 ms, flip angle [FA] = 15°, voxelsize 1.0 × 1.0 × 1.0 mm), a Fluid‐Attenuated Inversion Recovery (FLAIR) sequence (TR = 9.00 s, TE = 84 ms, TI = 2.20 s, voxelsize 1.0 × 1.2 × 5.0 mm, plus an interslice gap of 1 mm), T2*‐weighted gradient echo sequences (TR = 800 ms, TE = 26 ms, voxelsize 1.3 × 1.0 × 6.0 mm, and interslice gap 1 mm) and a DTI sequence (TR = 10.10 s, TE = 93 ms, voxelsize 2.5 × 2.5 × 2.5 mm, four unweighted scans, 30 diffusion weighted scans with b‐value of 900 s mm2). All participants were scanned on the same scanner.
MRI Markers for SVD
Two trained raters blinded to the clinical information manually segmented WMH, and the number of lacunes and microbleeds were assessed. WMH was defined as white matter hyper‐intensities on FLAIR images without prominent hypointensity on the T1‐weighted images (Fig. 1) [van Norden et al., 2011; Wardlaw et al., 2013]. The interrater variability in a random sample of 10% revealed an intraclass correlation coefficient of 0.99. Lacunes were defined as hypointense areas > 2 and ≤ 15mm on FLAIR and T1, ruling out enlarged perivascular spaces (≤2 mm, except around the anterior commissure, where perivascular spaces can be large) and infraputaminal pseudolacunes [Wardlaw et al., 2013]. Microbleeds are defined as small, homogeneous, round focal areas of very low signal intensity on T2*‐weighted images of <10 mm in diameter [Cordonnier et al., 2006; Vernooij et al., 2008b]. There were good intra‐ and inter‐rater variabilities with weighted kappa of 0.87 and 0.95, respectively, for the presence of lacunes, and 0.85 and 0.86 for the presence of microbleeds, calculated in 10% of the scans. Automated segmentation on T1 images was performed using Statistical Parametric Mapping (SPM5) to obtain gray matter, white matter, and cerebrospinal fluid probability maps. These maps were binarized and summed to supply total volumes. Total brain volume (the sum of gray matter and white matter volume) and WMH volume were normalized to the total intracranial volume to adjust for head size. Finally, we calculated the mean fractional anisotropy and mean diffusivity within the white matter. The b0‐images were used to compute the coregistration parameters to the skull‐stripped T1‐image1 using Functional MRI of the Brain linear image registration tool (FLIRT), which were applied to all diffusion‐weighted images. All images were visually checked for segmentation, coregistration, and normalization errors, and no inaccuracies or errors were found. The mean fractional anisotropy and mean diffusivity were then calculated within the white matter.
Figure 1.
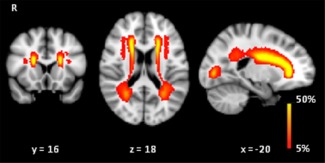
Probability map of WMH. Probability distribution of WMH in red, color‐coded in percent (color bar), thresholded from 5% to 50%. These images are projected onto spatially normalized (Montreal Neurological Institute stereotactic space). R = right. WMH were predominately located in the frontal periventricular regions. [Color figure can be viewed in the online issue, which is available at http://wileyonlinelibrary.com.]
Network Nodes (Brain Regions)
Brain regions were demarcated by the automated anatomical labeling (AAL) template [Tzourio‐Mazoyer et al., 2002], which resulted in 45 regions for each hemisphere. Cerebellar regions were excluded, because the tractography technique used in this study is unsuitable for tracing cerebellar connections. Using the FSL 5.0.5 tools [Smith et al., 2004], the skull‐stripped T1 images were nonlinearly registered to Montreal Neurological Institute (MNI) 152 template using Functional MRI of the Brain nonlinear registration tool (FNIRT). Next, the transformation matrix was derived from the registration of b0‐images to T1 subject space using FLIRT. These transformations were then used to register the AAL image to each subject's diffusion image space.
Network Edges (White Matter Connections)
The inhouse developed algorithm named “PATCH” was used on the raw diffusion data to correct for cardiac and head motion artifacts and eddy currents [Zwiers, 2010]. Diffusion Toolkit (http://www.trackvis.org) was used to calculate the diffusion tensor and fractional anisotropy. To generate the fiber tracks of the entire brain for each subject, fiber assignment by continuous tracking (FACT) was used by Diffusion Toolkit. The tracking algorithm started at the center of the voxels with fractional anisotropy >0.2 and ended when the fiber tracks left the brain mask, encountered voxels with fractional anisotropy <0.2 or when the turning angle exceeded 60°. Two regions were considered connected if the endpoints of the reconstructed streamline lay within both regions. For each subject, a weighted edge was constructed by multiplying the mean fractional anisotropy for each reconstructed streamline and the number of reconstructed streamlines connecting two regions [Lo et al., 2010]. The number of reconstructed streamlines may reflect the white matter structure and has been commonly used as weighting of edges in graph‐theoretical studies. Fractional anisotropy may reflect the microstructural integrity of the white matter. If two edges have similar number of reconstructed streamlines, the weights of the edges might still differ when fractional anisotropy is considered—though the contribution of fractional anisotropy to weighting might be relatively small. The weighting of an edge was further normalized by the average of the AAL volumes to correct for the different sizes of the AAL regions and different brain sizes [Brown et al., 2011]. This resulted in an undirected weighted 90 × 90 matrix for each subject.
Graph‐Theory Analysis
Graph‐theoretical network measures were computed using the Brain Connectivity Toolbox [Rubinov and Sporns, 2010]. Basic network measures include density and network strength. Density is defined as the total number of edges in a network observed divided by the possible number of edges. Node strength represents the sum of weighted edges to the node. Next, we calculated global and local efficiency. Efficiency between two regions is expressed as the inverse of the shortest path length between two regions. The shortest path length refers to the minimum number of weighted connection between two regions. Global efficiency of the network is defined as the average of efficiency for all node pairs. The local efficiency for each node is the global efficiency of all direct neighbors of that node. The global efficiency reflects the extent to which information communication is globally integrated in the network, whereas the local efficiency measures the segregation and specialization within a network. Since global efficiency and local efficiency are highly correlated and global efficiency shows strong relationship with cognition [Lawrence et al., 2014; Reijmer et al., 2015], global efficiency was used for subsequent analysis. Networks with lower global efficiency are regarded as less efficient networks, compared to networks with higher global efficiency. The nodal efficiency is the mean of the inverse of the shortest path length between the node and all other nodes in the network. Nodal efficiency reflects the extent of the participation of a region in the whole network by quantifying the connections from one brain region to all other regions [Achard and Bullmore, 2007]. Furthermore, we investigated whether the structural networks showed small‐world architecture. Small‐world network is characterized by high level of integration and segregation [Bassett and Bullmore, 2006; Griffa et al., 2013; Watts and Strogatz, 1998]. The properties of small‐world can be characterized by comparing the global and local efficiency of the structural network to an equivalent random network with same degree distribution. A network shows small‐world topology when the global efficiency is similar to or lower than the one of a random network and local efficiency higher than the one of a random network. For this, we computed normalized global and local efficiency, which is defined as the global and local efficiency of the structural network divided by the values obtained from 100 randomly rewired null‐model networks.
Statistical Analyses
The baseline characteristics are displayed as mean ± standard deviation for normal distributed data, and median and interquartile ranges for the skewed distributed data. Normalized WMH volume was log‐transformed to obtain normal distribution. We performed multiple linear regression analyses to examine the relationships between MRI markers for SVD (WMH, number of lacunes and microbleeds, and normalized total brain volume volume) and cognitive functions, adjusted for potential confounders (age, gender, education, and depressive symptoms). Pearson's correlation coefficients were calculated for the relationships between MRI markers for SVD and network measures, and Bonferroni‐correction was used for multiple comparison corrections. Multiple linear regression analyses were conducted to investigate the relation between the global efficiency and cognitive performance, while controlling for potential confounders. Additional adjustments for WMH, number of lacunes and microbleeds, total brain volume, and mean diffusivity of the white matter were performed to test whether these associations were independent of these MRI markers for SVD. The relation between global efficiency and vascular risk factors was evaluated, while adjusting for potential confounders and other vascular risk factors. Furthermore, we conducted a path analysis to test whether global efficiency mediated the relationships between MRI markers for SVD and cognition using the Lavaan package in R (http://www.r-project.org) adjusted for potential confounders. To investigate the relationships between nodal efficiency and cognitive performance, Pearson's partial correlation analyses were computed while adjusting for potential confounders and MRI markers for SVD. False‐discovery rate (FDR) procedure was then applied with a q‐value of 0.05 for multiple comparison corrections. An analysis of multicollinearity showed that variance inflation factors were low in all multiple regression models (<3, with scores >5 considered as presence of high multicollinearity).
RESULTS
Characteristics
Baseline characteristics and structural network properties of the study population (n = 436) are shown in Table 1. Mean age was 65.2 years (SD = 8.8) and 199 (45.6%) were female. Structural network of the study population exhibits a small‐world topology, in which the normalized global efficiency < 1 and normalized local efficiency >1 (Table 1).
MRI Markers for SVD and Cognition
Higher WMH load, number of microbleeds, and mean diffusivity of the white matter were associated with lower scores on cognitive index (β = −0.09, P = 0.04; β = −0.11, P = 0.002; β = −0.14, P = 0.002, respectively) and psychomotor speed (β = −0.11, P = 0.009; β = −0.09, P = 0.02; β = −0.18, P < 0.001, respectively), while higher total brain volume was associated with higher scores on cognitive index (β = 0.10, P = 0.04) and psychomotor speed (β = 0.11, P = 0.02), adjusting for age, gender, education, and depressive symptoms (Table 2, model 1). A weak nonsignificant relation was found between number of lacunes and cognitive performance (β = −0.07, P = 0.08).
Table 2.
Relation between MRI markers for SVD, global efficiency, and cognitive performance
| Global efficiency | WMH | Lacunes | Microbleeds | TBV | MD | |
|---|---|---|---|---|---|---|
| Model 1 | ||||||
| Cognitive Index | 0.19 (0.10 to 0.27)c | −0.09 (−0.17 to −0.00)a | −0.07 (−0.14 to 0.01) | −0. 11 (−0.19 to −0.04)b | 0.10 (0.01 to 0.19)a | −0.14 (−0.24 to −0.05)b |
| Psychomotor speed | 0.21 (0.12 to 0.29)c | −0.11 (−0.20 to −0.03)b | −0.07 (−0.15 to 0.01) | −0.09 (−0.17 to −0.02)a | 0.11 (0.02 to 0.21)a | −0.18 (−0.27 to −0.09)c |
| Model 2 | ||||||
| Cognitive index | 0.15 (0.05 to 0.26)a | −0.02 (−0.08 to 0.12) | −0.01 (−0.09 to 0.07) | −0.08 (−0.16 to −0.01)a | 0.03 (−0.08 to 0.13) | −0.03 (−0.15 to 0.08) |
| Psychomotor speed | 0.14 (0.02 to 0.26)a | −0.01 (−0.11 to 0.10) | −0.00 (−0.09 to 0.08) | −0.05 (−0.13 to 0.02) | 0.04 (−0.07 to 0.14) | −0.07 (−0.19 to 0.05) |
Data represents standardized beta's values and 95% confidence interval. Model 1: represents standardized beta's for each variable from the regression model adjusted for age, gender, education and depressive symptoms. Model 2: standardized beta's from the full regression model including age, gender, education, depressive symptoms, white matter hyperintensities (WMH), number of lacunes and microbleeds, total brain volume (TBV), mean diffusivity (MD) and global efficiency. Higher scores indicate better performance.
P < 0.05.
P < 0.01.
P < 0.001.
MRI Markers for SVD, Vascular Risk Factors, and Network Measures
Higher WMH load, number of lacunes and microbleeds, and mean diffusivity of the white matter were associated with lower density, network strength, global and local efficiency, while higher total brain volume and mean fractional anisotropy of the white matter were associated with higher network measures (P < 0.05 Bonferroni‐corrected; Table 3). The strongest association was found between global efficiency and mean diffusivity (r = −0.72, P < 0.001), followed by WMH (r = −0.62, P < 0.001), mean fractional anisotropy (r = 0.57, P < 0.001), total brain volume (r = 0.55, P < 0.001), number of lacunes (r = −0.32, P < 0.001), and number of microbleeds (r = −0.25, P < 0.001). Participants with hypertension exhibited lower global efficiency as compared to participants without hypertension (P < 0.001), while current and former smokers tended to show lower global efficiency compared to never smokers (P < 0.04, uncorrected). No relation was found between hypercholesterolemia, BMI, and diabetes.
Table 3.
Relation between network measures and markers for SVD
| WMH | Lacunes | Microbleeds | TBV | Mean FA | Mean MD | |
|---|---|---|---|---|---|---|
| Density | −0.59 | −0.31 | −0.25 | 0.47 | 0.55 | −0.64 |
| Network strength | −0.60 | −0.30 | −0.23 | 0.58 | 0.57 | −0.74 |
| Global efficiency | −0.62 | −0.32 | −0.25 | 0.55 | 0.57 | −0.72 |
| Local efficiency | −0.58 | −0.28 | −0.19 | 0.56 | 0.56 | −0.71 |
Data are Pearson's correlations. All correlations are significant (P < 0.05, Bonferroni‐corrected). Density of a network is defined as the number of connections in a network divided by the total possible connections within the network. Number of lacunes and microbleeds were used for calculating Pearson's correlations. Network strength refers to the average node strength in a network.
WMH, white matter hyperintensities; TBV, total brain volume; FA, fractional anisotropy; MD, mean diffusivity.
Network Efficiency and Cognition
Network efficiency was associated with cognitive index (global efficiency: β = 0.19, P < 0.001; local efficiency: β = 0.17, P < 0.001), psychomotor speed (global efficiency: β = 0.21, P < 0.001; local efficiency: β = 0.19, P < 0.001), verbal memory (global efficiency: β = 0.13, P = 0.011; local efficiency: β = 0.11, P = 0.029), and shifting (global efficiency: β = 0.19, P < 0.001; local efficiency: β = 0.16, P < 0.001), while controlling for age, gender, education, and depressive symptoms. Network efficiency was not related to visuospatial memory, fluency, and attention. For further analyses, we focused on cognitive index and psychomotor speed, which is one of most common manifestations of SVD and showed the strongest associations with network efficiency.
Regional Efficiency and Cognition
Figure 2 shows nodes with significant positive associations between nodal efficiency and cognitive index and psychomotor speed, adjusted for age, gender, education, depressive symptoms, and MRI markers for SVD (including mean diffusivity of the white matter; P < 0.05, FDR‐corrected). Nodes with the strongest associations with cognitive index and psychomotor speed were located in frontal, parietal, and occipital regions with standardized beta's ranging between 0.09 and 0.14 (Supporting Information Table 1). There were no nodes showing significant negative associations between nodal efficiency and cognitive performance.
Figure 2.
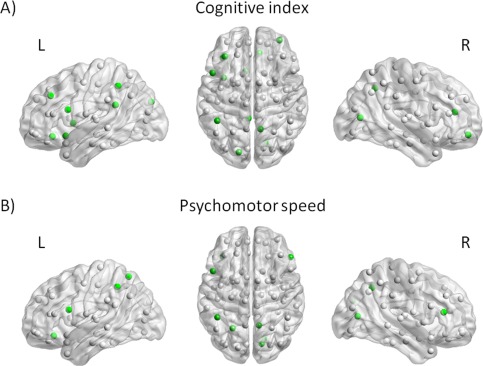
The relation between nodal efficiency and cognitive performance. Nodes with positive associations between nodal efficiency and cognitive index (A) and psychomotor speed (B), independent of age, gender, education, depressive symptoms, WMH, number of lacunes and microbleeds, total brain volume, and mean diffusivity are indicated in green (P < 0.05, FDR‐corrected). [Color figure can be viewed in the online issue, which is available at http://wileyonlinelibrary.com.]
Relation Between MRI Markers for SVD, Network Efficiency, and Cognition
Higher global efficiency was related to higher scores on cognitive index and psychomotor speed (P < 0.05, Bonferroni‐corrected), after adjusting for the MRI markers for SVD (Table 2, model 2; Fig. 3). In contrast, the variance explained by WMH, number of microbleeds, total brain volume, and mean diffusivity of the white matter was reduced, and these MRI markers were no longer significant, except for a weak relation between number of microbleeds and cognitive index (β = −0.08, P = 0.03, uncorrected). The relation between global efficiency and cognition remained independent after controlling for density and vascular risk factors. Path models suggest that WMH, number of microbleeds, total brain volume, and mean diffusivity of the white matter was indirectly related to cognitive index (indirect effects: β = −0.12, P < 0.001; β = −0.14, P < 0.001; β = 0.10, P < 0.001; β = −0.11, P < 0.001, respectively) and psychomotor speed (indirect effects: β = −0.12, P < 0.001; β = −0.16, P < 0.001; β = 0.11, P < 0.001; β = −0.11, P < 0.001, respectively) via global efficiency. Only the direct effect of number of microbleeds on cognitive index was significant (β = −0.04, P = 0.024).
Figure 3.
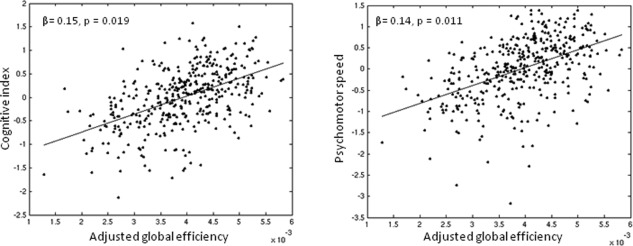
The relation between global efficiency and cognition. Scatterplots showing the association between global efficiency (adjusted for age, gender, education, depressive symptoms, WMH, number of lacunes and microbleeds, total brain volume, and mean diffusivity) and cognitive performances (z‐scores).
DISCUSSION
We demonstrated that participants with greater SVD‐severity, indicated by MRI markers for SVD, had networks with lower global efficiency and lower scores on cognitive performance. More importantly, lower global efficiency was associated with lower scores on cognitive performance independent of MRI markers for SVD and mediated the associations between MRI markers for SVD and cognition. These results highlight the importance of network analysis, which may provide insight on better understanding of the cognitive impairment in participants in SVD, additional to conventional MRI markers.
Several methodological issues should be addressed. The FACT streamlining algorithm has several limitations, such as failure in reconstructing white matter tracks in a complex white matter architecture [Mori and van Zijl, 2002] and identifying long distance fibers due to noise, estimated fit of diffusion tensor and partial volume effect [Zalesky and Fornito, 2009]. Nonetheless, this streamlining algorithm is a powerful and computational inexpensive method and is a robust method for identifying major white matter tracks, giving results that are in close agreement with the known anatomy [Mori and van Zijl, 2002]. Another issue is the parcellation of the brain regions that might influence the network properties. We used the AAL atlas that consists of unequal‐sized brain regions to parcel the brain regions for network construction. We tried to overcome this limitation by correcting for the different sizes of brain regions. Defining the brain regions remains challenging and alternative strategies have been used, such as high‐resolution parcellation scheme, random partitioning into equal‐sized regions, and strategies using anatomical borders [Sporns, 2014]. The extent to which different parcellation strategies might improve the results remains, however, unclear [Sporns, 2014]. Although the structural network showed small‐world topology, indicating that the networks were reliably constructed, future studies should include more sophisticated tractography techniques and other parcellation schemes to verify these findings. Finally, because of the cross‐sectional nature of this study, no causal inferences, or directionality can be made. The RUN DMC study is a prospective study and the follow‐up is currently underway.
The strengths of this single‐center study include its large sample size, the extensive assessment of cognitive functions performed by two‐trained investigators and a cognitively rather healthy study population that covers the whole spectrum of SVD. This study has a reasonably high external validity for individuals aged between 50 and 85 years with sporadic SVD on neuroimaging, though the findings cannot be generalized to individuals with other causes of SVD, to more severe SVD‐patients, or to healthy individuals older than 50 years.
Using graph‐theoretical measures, we showed that network efficiency was associated with cognitive performance in nondemented participants with various degrees of SVD. Emerging evidence suggest that network integrity is important for cognitive performance in several conditions with white matter abnormalities [Lawrence et al., 2014; Reijmer et al., 2013, 2015; Wen et al., 2011a, 2011b]. Cognitive functioning is dependent on neural processes segregated across functionally distinct cortical regions rather than on a single region. Besides the effects of focal damage by SVD on a single region, the cumulative effects of the spatially distributed SVD‐related lesions may also affect the integration of information communication (or the efficiency) between the brain regions, which might lead to cognitive impairment. Currently, it is unclear whether processing speed deficit is a resultant of localized damage [Duering et al., 2013, 2014] or global dysfunction of the brain [Penke et al., 2010; Wen et al., 2011b]. Here, the widespread involvement of brain regions with reduced efficiency might be interpreted to imply that cognitive index and processing speed are related to connectivity of multiple brain regions rather than localized brain regions and thus might be considered as a global function of the brain. The link between network efficiency and cognitive performance in participants with SVD might indicate a role for network (in)efficiency in SVD‐related cognitive deficits.
In our study, participants with greater disease severity, indicated by MRI markers for SVD, showed lower global efficiency, as well as more cognitive deficits. SVD‐related damage to the white matter is believed to cause cognitive deficits, though the conventional MRI markers do not explain all the clinical variance in SVD. The relationships between these markers and cognition are generally weak or inconsistent between the studies [Kloppenborg et al., 2014; Reijmer et al., 2015; van Norden et al., 2012b]. Another important factor is the reduced white matter integrity, both within and outside WMH (i.e., normal appearing white matter) in participants with SVD [de Laat et al., 2011; Tuladhar et al., 2015b; Vernooij et al., 2008a]. The observed relations between global efficiency and vascular risk factors (hypertension and to a lesser extent smoking status) are in agreement with previous studies, which showed that these factors are related to white matter damage [de Groot et al., 2014; Gons et al., 2010, 2011; Staals et al., 2014]. The observed relation between network efficiency and MRI markers for SVD and vascular risk factors suggests that reduced network efficiency might be the resultant of the white matter damage. SVD has a detrimental effect on the multiple white matter tracts by means of direct and indirect damage, which can be ascribed to demyelination, reduction in axonal number, and density and/or gliosis [de Laat et al., 2011; Pantoni and Garcia, 1997; Thomalla et al., 2004]. These processes can influence the “connection strength” and hereby the network efficiency. Nonetheless, network efficiency was strongly associated with cognition, independent of MRI markers for SVD (including traditional MRI markers for SVD and DTI parameters), density of the network, and vascular risk factors, and furthermore, mediated the associations between MRI markers for SVD and cognition, suggesting that these markers might act in causing cognitive impairment through network disruption.
Our results corroborate studies showing that the vascular damage (indicated by conventional MRI markers for SVD) might be related to neurological dysfunction via reduced structural network efficiency [Lawrence et al., 2014; Reijmer et al., 2015], albeit, in a smaller sample size, using different analysis technique and different SVD population. Here, we included MRI characteristics of SVD, consisting of WMH, lacunes, microbleeds, total brain volume, and mean diffusivity of the white matter, and performed multivariable analyses for global and regional network measures, while taking these MRI markers for SVD into account. Network efficiency was the strongest predictor for psychomotor speed and cognitive index, while microbleeds were the only MRI markers for SVD that remained independently associated with cognitive index. The effect sizes were relatively small with standardized beta's < 0.2 compared to other studies in which standardized beta's ranging between 0.2 and 0.4 in patients with cerebral SVD have been reported [Lawrence et al., 2014; Reijmer et al., 2013]. The selection procedure of this study (inclusion of the whole spectrum of the SVD patients and wider range of age (varying between 50 and 85 years) can result in an aging population where multiple risk factors for one single disease are present, thereby possibly limiting each individual (relative) contribution to the disease. Also, the RUN DMC study consists of a cognitively rather healthy population and patients with severe cognitive impairment were excluded from the study. This might underestimate the effects of network measures in more severe SVD‐related cognitive impairment. We hypothesize that the network measures might be of more importance in later stages of SVD with increasing SVD‐related lesions. Nevertheless, the consistency between the studies suggests the reliability of the whole‐brain tractography approach and structural network analysis in SVD, however, further systematic and validation studies are needed. Together, these findings strengthen the importance of graph‐theoretical network analysis, which could serve as an additional tool to the conventional MRI markers for SVD [Reijmer et al., 2013, 2015] to investigate cognitive impairment in participants with SVD.
CONCLUSION
This study shows an important role for the network analysis in our understanding of cerebral SVD‐related cognitive deficits, in addition to the conventional MRI markers for SVD. Network analysis has the potential to serve as a disease marker [Lawrence et al., 2014], however, future—preferably prospective—studies are needed to confirm this notion. An interesting future question to explore is whether structural network efficiency has predictive value in identifying patients who are at risk for further cognitive decline and/or dementia. As this study only explores the structural network, it would be intriguing in future studies to examine the interaction between structural and functional brain networks by applying, for example, data fusion approach. Also, longitudinal studies are important, as they may help us to understand how damage to network connectivity progresses over time and how this can affect cognition.
Supporting information
Supporting Information.
Conflicts of interest: The authors have no conflicts of interest.
REFERENCES
- Achard S, Bullmore E (2007): Efficiency and cost of economical brain functional networks. PLoS Comput Biol 3:e17. [DOI] [PMC free article] [PubMed] [Google Scholar]
- Bassett DS, Bullmore E (2006): Small‐world brain networks. Neuroscientist 12:512–523. [DOI] [PubMed] [Google Scholar]
- Brown JA, Terashima KH, Burggren AC, Ercoli LM, Miller KJ, Small GW, Bookheimer SY (2011): Brain network local interconnectivity loss in aging APOE‐4 allele carriers. Proc Natl Acad Sci USA 108:20760–20765. [DOI] [PMC free article] [PubMed] [Google Scholar]
- Bullmore E, Sporns O (2009): Complex brain networks: Graph theoretical analysis of structural and functional systems. Nat Rev Neurosci 10:186–198. [DOI] [PubMed] [Google Scholar]
- Cordonnier C, van der Flier WM, Sluimer JD, Leys D, Barkhof F, Scheltens P (2006): Prevalence and severity of microbleeds in a memory clinic setting. Neurology 66:1356–1360. [DOI] [PubMed] [Google Scholar]
- de Groot JC, de Leeuw FE, Oudkerk M, van Gijn J, Hofman A, Jolles J, Breteler MM (2000): Cerebral white matter lesions and cognitive function: The Rotterdam Scan Study. Ann Neurol 47:145–151. [DOI] [PubMed] [Google Scholar]
- de Groot M, Ikram MA, Akoudad S, Krestin GP, Hofman A, van der Lugt A, Niessen WJ, Vernooij MW. (2014): Tract‐specific white matter degeneration in aging. The Rotterdam Study. Alzheimers Dement 11:321–330. [DOI] [PubMed] [Google Scholar]
- de Laat KF, Tuladhar AM, van Norden AG, Norris DG, Zwiers MP, de Leeuw FE (2011): Loss of white matter integrity is associated with gait disorders in cerebral small vessel disease. Brain 134:73–83. [DOI] [PubMed] [Google Scholar]
- de Leeuw FE, de Groot JC, Oudkerk M, Witteman JC, Hofman A, van Gijn J, Breteler MM (1999): A follow‐up study of blood pressure and cerebral white matter lesions. Ann Neurol 46:827–833. [DOI] [PubMed] [Google Scholar]
- Duering M, Gonik M, Malik R, Zieren N, Reyes S, Jouvent E, Herve D, Gschwendtner A, Opherk C, Chabriat H, et al. (2013): Identification of a strategic brain network underlying processing speed deficits in vascular cognitive impairment. Neuroimage 66:177–183. [DOI] [PubMed] [Google Scholar]
- Duering M, Gesierich B, Seiler S, Pirpamer L, Gonik M, Hofer E, Jouvent E, Duchesnay E, Chabriat H, Ropele S, R Schmidt, M Dichgans. (2014): Strategic white matter tracts for processing speed deficits in age‐related small vessel disease. Neurology 82:1946–1950. [DOI] [PMC free article] [PubMed] [Google Scholar]
- Erkinjuntti T (2002): Subcortical vascular dementia. Cerebrovasc Dis 13:58–60. [DOI] [PubMed] [Google Scholar]
- Gong G, He Y, Concha L, Lebel C, Gross DW, Evans AC, Beaulieu C (2009): Mapping anatomical connectivity patterns of human cerebral cortex using in vivo diffusion tensor imaging tractography. Cereb Cortex 19:524–536. [DOI] [PMC free article] [PubMed] [Google Scholar]
- Gons RAR, de Laat KF, van Norden AGW, van Oudheusden LJB, van Uden IWM, Norris DG, Zwiers MP, de Leeuw F‐E (2010): Hypertension and cerebral diffusion tensor imaging in small vessel disease. Stroke 41:2801–2806. [DOI] [PubMed] [Google Scholar]
- Gons RAR, van Norden AGW, de Laat KF, van Oudheusden LJB, van Uden IWM, Zwiers MP, Norris DG, de Leeuw F‐E (2011): Cigarette smoking is associated with reduced microstructural integrity of cerebral white matter. Brain 134:2116–2124. [DOI] [PubMed] [Google Scholar]
- Griffa A, Baumann PS, Thiran JP, Hagmann P (2013): Structural connectomics in brain diseases. Neuroimage 80:515–526. [DOI] [PubMed] [Google Scholar]
- Hochstenbach J, Mulder T, van Limbeek J, Donders R, Schoonderwaldt H (1998): Cognitive decline following stroke: A comprehensive study of cognitive decline following stroke. J Clin Exp Neuropsychol 20:503–517. [DOI] [PubMed] [Google Scholar]
- Kloppenborg RP, Nederkoorn PJ, Geerlings MI, van den Berg E (2014): Presence and progression of white matter hyperintensities and cognition: A meta‐analysis. Neurology 82:2127–2138. [DOI] [PubMed] [Google Scholar]
- Lawrence AJ, Chung AW, Morris RG, Markus HS, Barrick TR (2014): Structural network efficiency is associated with cognitive impairment in small‐vessel disease. Neurology 83:304–311. [DOI] [PMC free article] [PubMed] [Google Scholar]
- Lo CY, Wang PN, Chou KH, Wang J, He Y, Lin CP (2010): Diffusion tensor tractography reveals abnormal topological organization in structural cortical networks in Alzheimer's disease. J Neurosci 30:16876–16885. [DOI] [PMC free article] [PubMed] [Google Scholar]
- Mori S, van Zijl PC (2002): Fiber tracking: Principles and strategies—A technical review. NMR Biomed 15:468–480. [DOI] [PubMed] [Google Scholar]
- Pantoni L (2010): Cerebral small vessel disease: From pathogenesis and clinical characteristics to therapeutic challenges. Lancet Neurol 9:689–701. [DOI] [PubMed] [Google Scholar]
- Pantoni L, Garcia JH (1997): Pathogenesis of leukoaraiosis: A review. Stroke 28:652–659. [DOI] [PubMed] [Google Scholar]
- Penke L, Munoz Maniega S, Murray C, Gow AJ, Hernandez MC, Clayden JD, Starr JM, Wardlaw JM, Bastin ME, Deary IJ (2010): A general factor of brain white matter integrity predicts information processing speed in healthy older people. J Neurosci 30:7569–7574. [DOI] [PMC free article] [PubMed] [Google Scholar]
- Prins ND, van Dijk EJ, den Heijer T, Vermeer SE, Jolles J, Koudstaal PJ, Hofman A, Breteler MM (2005): Cerebral small‐vessel disease and decline in information processing speed, executive function and memory. Brain 128:2034–2041. [DOI] [PubMed] [Google Scholar]
- Reijmer YD, Leemans A, Caeyenberghs K, Heringa SM, Koek HL, Biessels GJ, Utrecht Vascular Cognitive Impairment Study G (2013): Disruption of cerebral networks and cognitive impairment in Alzheimer disease. Neurology 80:1370–1377. [DOI] [PubMed] [Google Scholar]
- Reijmer YD, Fotiadis P, Martinez‐Ramirez S, Salat DH, Schultz A, Shoamanesh A, Ayres AM, Vashkevich A, Rosas D, Schwab K, et al. (2015): Structural network alterations and neurological dysfunction in cerebral amyloid angiopathy. Brain 138:179–188. [DOI] [PMC free article] [PubMed] [Google Scholar]
- Roman GC, Erkinjuntti T, Wallin A, Pantoni L, Chui HC (2002): Subcortical ischaemic vascular dementia. Lancet Neurol 1:426–436. [DOI] [PubMed] [Google Scholar]
- Rubinov M, Sporns O (2010): Complex network measures of brain connectivity: Uses and interpretations. Neuroimage 52:1059–1069. [DOI] [PubMed] [Google Scholar]
- Shu N, Liu Y, Li J, Li Y, Yu C, Jiang T (2009): Altered anatomical network in early blindness revealed by diffusion tensor tractography. PLoS One 4:e7228. [DOI] [PMC free article] [PubMed] [Google Scholar]
- Smith SM, Jenkinson M, Woolrich MW, Beckmann CF, Behrens TE, Johansen‐Berg H, Bannister PR, De Luca M, Drobnjak I, Flitney DE, et al. (2004): Advances in functional and structural MR image analysis and implementation as FSL. Neuroimage 23:S208–S219. [DOI] [PubMed] [Google Scholar]
- Sporns O (2014): Contributions and challenges for network models in cognitive neuroscience. Nat Neurosci 17:652–660. [DOI] [PubMed] [Google Scholar]
- Staals J, Makin SD, Doubal FN, Dennis MS, Wardlaw JM (2014): Stroke subtype, vascular risk factors, and total MRI brain small‐vessel disease burden. Neurology 83:1228–1234. [DOI] [PMC free article] [PubMed] [Google Scholar]
- Thomalla G, Glauche V, Koch MA, Beaulieu C, Weiller C, Rother J (2004): Diffusion tensor imaging detects early Wallerian degeneration of the pyramidal tract after ischemic stroke. Neuroimage 22:1767–1774. [DOI] [PubMed] [Google Scholar]
- Tuladhar AM, Reid AT, Shumskaya E, de Laat KF, van Norden AG, van Dijk EJ, Norris DG, de Leeuw FE (2015a): Relationship between white matter hyperintensities, cortical thickness, and cognition. Stroke 46:425–432. [DOI] [PubMed] [Google Scholar]
- Tuladhar AM, van Norden AG, de Laat KF, Zwiers MP, van Dijk EJ, Norris DG, de Leeuw FE (2015b): White matter integrity in small vessel disease is related to cognition. Neuroimage Clin 7:518–524. [DOI] [PMC free article] [PubMed] [Google Scholar]
- Tzourio‐Mazoyer N, Landeau B, Papathanassiou D, Crivello F, Etard O, Delcroix N, Mazoyer B, Joliot M (2002): Automated anatomical labeling of activations in SPM using a macroscopic anatomical parcellation of the MNI MRI single‐subject brain. Neuroimage 15:273–289. [DOI] [PubMed] [Google Scholar]
- van Norden AG, de Laat KF, Gons RA, van Uden IW, van Dijk EJ, van Oudheusden LJ, Esselink RA, Bloem BR, van Engelen BG, Zwarts MJ, et al. (2011): Causes and consequences of cerebral small vessel disease. The RUN DMC study: A prospective cohort study. Study rationale and protocol. BMC Neurol 11:29. [DOI] [PMC free article] [PubMed] [Google Scholar]
- van Norden AG, de Laat KF, van Dijk EJ, van Uden IW, van Oudheusden LJ, Gons RA, Norris DG, Zwiers MP, de Leeuw FE (2012a): Diffusion tensor imaging and cognition in cerebral small vessel disease: The RUN DMC study. Biochim Biophys Acta 1822:401–407. [DOI] [PubMed] [Google Scholar]
- van Norden AG, van Uden IW, de Laat KF, van Dijk EJ, de Leeuw FE (2012b): Cognitive function in small vessel disease: The additional value of diffusion tensor imaging to conventional magnetic resonance imaging: The RUN DMC study. J Alzheimers Dis 32:667–676. [DOI] [PubMed] [Google Scholar]
- Vernooij MW, de Groot M, van der Lugt A, Ikram MA, Krestin GP, Hofman A, Niessen WJ, Breteler MM (2008a): White matter atrophy and lesion formation explain the loss of structural integrity of white matter in aging. Neuroimage 43:470–477. [DOI] [PubMed] [Google Scholar]
- Vernooij MW, van der Lugt A, Ikram MA, Wielopolski PA, Niessen WJ, Hofman A, Krestin GP, Breteler MM (2008b): Prevalence and risk factors of cerebral microbleeds: The Rotterdam Scan Study. Neurology 70:1208–1214. [DOI] [PubMed] [Google Scholar]
- Verstraete E, Veldink JH, Mandl RC, van den Berg LH, van den Heuvel MP (2011): Impaired structural motor connectome in amyotrophic lateral sclerosis. PLoS One 6:e24239. [DOI] [PMC free article] [PubMed] [Google Scholar]
- Wardlaw JM, Smith EE, Biessels GJ, Cordonnier C, Fazekas F, Frayne R, Lindley RI, O'Brien JT, Barkhof F, Benavente OR, and others. (2013): Neuroimaging standards for research into small vessel disease and its contribution to ageing and neurodegeneration. Lancet Neurol 12:822–838. [DOI] [PMC free article] [PubMed] [Google Scholar]
- Watts DJ, Strogatz SH (1998): Collective dynamics of 'small‐world' networks. Nature 393:440–442. [DOI] [PubMed] [Google Scholar]
- Wen W, He Y, Sachdev P (2011a): Structural brain networks and neuropsychiatric disorders. Curr Opin Psychiatry 24:219–225. [DOI] [PubMed] [Google Scholar]
- Wen W, Zhu W, He Y, Kochan NA, Reppermund S, Slavin MJ, Brodaty H, Crawford J, Xia A, Sachdev P (2011b): Discrete neuroanatomical networks are associated with specific cognitive abilities in old age. J Neurosci 31:1204–1212. [DOI] [PMC free article] [PubMed] [Google Scholar]
- Zalesky A, Fornito A (2009): A DTI‐derived measure of cortico‐cortical connectivity. IEEE Trans Med Imaging 28:1023–1036. [DOI] [PubMed] [Google Scholar]
- Zalesky A, Fornito A, Seal ML, Cocchi L, Westin CF, Bullmore ET, Egan GF, Pantelis C (2011): Disrupted axonal fiber connectivity in schizophrenia. Biol Psychiatry 69:80–89. [DOI] [PMC free article] [PubMed] [Google Scholar]
- Zwiers MP (2010): Patching cardiac and head motion artefacts in diffusion‐weighted images. Neuroimage 53:565–575. [DOI] [PubMed] [Google Scholar]
Associated Data
This section collects any data citations, data availability statements, or supplementary materials included in this article.
Supplementary Materials
Supporting Information.