

Abstract
Copy number variants at the 16p11.2 chromosomal locus are associated with several neuropsychiatric disorders, including autism, schizophrenia, bipolar disorder, attention‐deficit hyperactivity disorder, and speech and language disorders. A gene dosage dependence has been suggested, with 16p11.2 deletion carriers demonstrating higher body mass index and head circumference, and 16p11.2 duplication carriers demonstrating lower body mass index and head circumference. Here, we use diffusion tensor imaging to elucidate this reciprocal relationship in white matter organization, showing widespread increases of fractional anisotropy throughout the supratentorial white matter in pediatric deletion carriers and, in contrast, extensive decreases of white matter fractional anisotropy in pediatric and adult duplication carriers. We find associations of these white matter alterations with cognitive and behavioral impairments. We further demonstrate the value of imaging metrics for characterizing the copy number variant phenotype by employing linear discriminant analysis to predict the gene dosage status of the study subjects. These results show an effect of 16p11.2 gene dosage on white matter microstructure, and further suggest that opposite changes in diffusion tensor imaging metrics can lead to similar cognitive and behavioral deficits. Given the large effect sizes found in this study, our results support the view that specific genetic variations are more strongly associated with specific brain alterations than are shared neuropsychiatric diagnoses. Hum Brain Mapp 37:2833–2848, 2016. © 2016 Wiley Periodicals, Inc.
Keywords: autism, genetics, magnetic resonance imaging, neurodevelopmental disorders, white matter
INTRODUCTION
The heterogeneity in clinical presentation of neuropsychiatric disorders presents challenges for their study, diagnosis, and treatment. It is therefore valuable, and increasingly feasible with the advancement of genomic scanning technologies, to take a genetics‐first approach to studying highly variable neuropathologies such as autism spectrum disorders (ASD), schizophrenia, and bipolar disorder. Thus, studying genetically defined cohorts may elucidate more precisely the biological underpinnings of subgroups within these clinically defined neurodevelopmental disorders, paving the way to more objective diagnoses and more effective, targeted interventions.
Advances in genome‐scanning technologies have revealed a high prevalence of structural variation in the human genome [Feuk et al., 2006]. In particular, copy‐number variants (CNVs) have been posed as major contributors both to human diversity and to disease susceptibility. Several CNVs have been observed recurrently in patients ascertained by neurodevelopmental diagnoses [Cook and Scherer, 2008; Feuk et al., 2006], with a number of these demonstrating high penetrance when evaluated in a population‐based cohort [Stefansson et al., 2013].
Recent genetic research has demonstrated that deletion and duplication of a 593 kb region at BP4‐BP5 of 16p11.2 are associated with a number of neuropsychiatric disorders including ASD, schizophrenia, bipolar disorder, intellectual disability, attention deficit disorder, and epilepsy [Kaminsky et al., 2011; Levy et al., 2011; McCarthy et al., 2009; Shinawi et al., 2010; Weiss et al., 2008]. This region contains 29 genes, 17 of which are expressed in the mammalian brain [McCarthy et al., 2009]. Both deletions and duplications of the region have been detected at high frequencies in large clinical cytogenic microarray databases [Cooper et al., 2011; Kaminsky et al., 2011]. Evidence points toward dosage‐dependence of genes in this region that leads to differential effects of their deletion versus duplication. For example, individuals with 16p11.2 deletions have high body mass index (BMI) and large head circumference, while people with the reciprocal duplications have low BMI and small head circumference [Bochukova et al., 2010; Jacquemont et al., 2011; McCarthy et al., 2009; Shinawi et al., 2010; Walters et al., 2010; Zufferey et al., 2012]. Volumetric analysis of structural MRI also shows increases in intracranial volume, total gray and white matter volumes, and regional cortical and subcortical volumes for the deletion carriers, whereas the duplication carriers show decreases in these volumetric measures [Maillard et al., 2014; Qureshi et al., 2014]. Additionally, a meta‐analysis of datasets from multiple psychiatric disorders demonstrated an association of the duplication with schizophrenia, ASD, and other neurodevelopmental disorders, while the deletion was associated only with ASD and other neurodevelopmental disorders, but not schizophrenia [McCarthy et al., 2009].
Using diffusion MRI, we recently reported widespread alterations of white matter microstructure in children with the 16p11.2 deletion, compared to typically developing children [Owen et al., 2014]. In this study, we use diffusion tensor imaging (DTI) to detect white matter microstructural changes in a cohort of children and adults with recurrent ∼600 kb (BP4‐BP5) 16p11.2 duplications, as well as an expanded cohort of children and adults with the reciprocal deletion, as part of the multicenter Simons Foundation Variation in Individuals Project [The Simons VIP Consortium, 2012]. Given our previously reported findings in the pediatric deletion carriers, as well as the theory of gene dosage dependence, we hypothesize that carriers of the 16p11.2 duplication also demonstrate diffuse white matter microstructural alterations, but that the most important changes are opposite to those of the reciprocal deletion carriers. Additionally, observing that deviation in either direction from normal gene dosage tends to be maladaptive, we further predict an association of cognitive and behavioral impairment with deviation (also in either direction) from normal white matter microstructural metrics. This hypothesis is further supported by the recent results of Hahamy et al. [2015] showing that the magnitude of both hyper‐ and hypoconnectivity in interhemispheric homotopic connections correlates with behavioral symptoms of ASD. Finally, given the effect size of previously reported findings in the pediatric deletion carriers, we hypothesize that microstructural and macrostructural brain imaging metrics, the latter from high‐resolution three‐dimensional volumetric MRI, can be used to accurately predict the CNV status in these study subjects.
MATERIALS AND METHODS
Study Subjects
As part of a multicenter investigation of 16p11.2 deletion and duplication carriers, this study analyzes data from 30 pediatric deletion carriers (age 8–16 years; 15 male and 15 female), 13 pediatric duplication carriers (age 7–16 years; 10 male and 3 female), 34 pediatric controls (age 7–16 years; 17 male and 17 female), 7 adult deletion carriers (age 20–48 years; 4 male and 3 female), 22 adult duplication carriers (age 20–63 years; 12 male and 10 female), and 28 adult controls (age 21–63 years; 15 male and 13 female). Compared to subjects studied in Owen et al. [2014], this study included pediatric duplication carriers, adult deletion and duplication carriers and controls, 7 pediatric deletion carriers in addition to the original 23 carriers, and additional pediatric controls. 16p11.2 carriers were recruited primarily by referral from clinical genetic centers or testing laboratories and web‐based networks. Control subjects were recruited from the general population. Individuals with any major DSM‐IV diagnoses based upon clinical psychologist review or with immediate family members diagnosed with developmental disorders, dysmorphic features, or genetic abnormalities were excluded from the control cohort. Chromosome microarrays were obtained for all carriers and controls, and only individuals without other pathogenic CNVs or other known genetic syndromes were enrolled.
Four of the adult deletion carriers were parents of pediatric proband deletion carriers, and six of the adult duplication carriers were parents of the pediatric proband duplication carriers. Additionally, there were two pairs of pediatric deletion carrier siblings, two pairs of pediatric duplication carrier siblings, one pair of pediatric control sublings, three pairs of adult duplication carrier siblings, and a pair of adult siblings + one parent (three individuals from the same family) included in the adult duplication carrier cohort. Subjects with nonverbal intelligence quotients (NVIQ) below 60 were excluded. Of the 15 original pediatric duplication carriers, two were excluded from analysis for excessive motion during MRI, leaving 13 pediatric duplication carriers. Of the 23 original adult duplication carriers, one was excluded from analysis for an NVIQ below 60. Eighty‐seven of the 134 total participants were recruited, tested, and imaged within the University of California (UC) system and the remainder at the Children's Hospital of Philadelphia (CHOP). A breakdown of the subject demographics and clinical neuropsychiatric diagnoses is given in Tables I and II. For the subjects tested and imaged at the UCs, cognitive testing was performed at UC San Francisco, while MR imaging was performed at UC Berkeley to match the scanner manufacturer and model with that at CHOP. NVIQ and verbal IQ (VIQ) were derived from the Differential Ability Scales ‐ Early Years & School Age Intelligence Test for Children (DAS‐II) for all pediatric subjects, and from the Wechsler Abbreviated Scale of Intelligence (WASI) for all adult subjects. Scores from the Social Responsiveness Scale (SRS) as well as Social Communication Questionnaire (SCQ), both parent‐report questionnaires which measure a child's social and communication impairments and are used to screen for autism spectrum symptoms, were obtained for pediatric subjects except for one pediatric control. Scores from the adult research version of the SRS, in which spouses report on one another or parents report on adult study subjects, were obtained for adult subjects except for one duplication carrier, one deletion carrier, and two controls. All study procedures were approved by the institutional review boards at UC San Francisco and CHOP and are in accordance with the ethical standards of the Helsinki Declaration of 1975, as revised in 2008.
Image Acquisition
MRI was performed on a 3 T Trio scanner (Siemens, Erlangen, Germany) using a 32‐channel phased‐array radio‐frequency head coil, at both UC and CHOP. High‐resolution structural images of the brain were collected using a multiecho magnetization prepared rapid acquisition gradient‐echo (ME‐MPRAGE) T1‐weighted sequence with 160 1.0‐mm‐thick slices at 1 × 1 mm in‐plane resolution (FOV = 256 × 256 mm). Whole‐brain diffusion‐weighted images were collected using multislice 2D single‐shot spin‐echo echo‐planar imaging with monopolar gradients (b = 1000 s/mm2, 30 directions). Parallel imaging with the integrated Parallel Acquisition Techniques (iPAT) was used with a reduction factor of 2, one excitation, and 2 mm interleaved axial slices with no gap at an in‐plane resolution of 2 × 2 mm on a 128 × 128 matrix (TE = 80 ms, TR = 10000 ms). An additional brain volume was acquired with no diffusion weighting (b = 0 s/mm2).
Structural MR Imaging Analysis
The 3D T1‐weighted MPRAGE images of all subjects were examined for structural abnormalities by a board‐certified pediatric neuroradiologist (PM). Volumetric measures were obtained from each subject's T1 images using FreeSurfer 4.5.0 [Fischl, 2012] using methods reported previously [Qureshi et al., 2014].
DTI Preprocessing
FMRIB's Linear Image Registration Tool (FLIRT; http://www.fmrib.ox.ac.uk/fsl/flirt) was used to register all diffusion‐weighted volumes to their corresponding b = 0 s/mm2 volume, and to correct for motion and eddy currents [Jenkinson et al., 2002]. Relative displacements between subsequent diffusion volumes were calculated for each subject, and subjects with a >1 mm median displacement were excluded for excessive motion, excepting one adult deletion carrier with 1.1 mm median displacement. None of the four control–carrier cohorts demonstrated group differences of median displacement (p > 0.1), using a two‐tailed, unpaired student's t‐test with unequal variances. Two pediatric duplication carriers were excluded in this manner, and their data along with their matched control data was not used for further analysis. Subsequently, the Brain Extraction Tool (BET; http://www.fmrib.ox.ac.uk/analysis/research/bet) was used to remove nonbrain tissue, and FSL's DTIFIT was used to calculate DTI parameters of fractional anisotropy (FA), mean diffusivity (MD), axial diffusivity (AD), and radial diffusivity (RD).
Tract‐Based Spatial Statistics Analysis of DTI
FSL's Tract‐Based Spatial Statistics (TBSS) tool [Smith et al., 2006] was used to align individual FA maps to FSL's standard FMRIB58 adult FA template. Following registration, the FA maps of all subjects were thinned to create white matter skeletons. Then, skeletonized MD, RD, and AD maps were created and registered to the FMRIB58 FA template. The randomise function from FSL was used to perform voxel‐wise statistics along the white matter skeleton. This function uses nonparametric permutation testing, and allows for cluster‐level inference when the threshold‐free cluster enhancement (TFCE) approach is used [Smith and Nichols, 2009]. Randomise was used with an ANOVA F‐test for difference between means of controls, duplication carriers, and deletion carriers. This was performed separately for each DTI parameter, and for children and adults. Statistically significant contrasts found from the F‐test were followed up with pairwise comparisons between groups using randomise with two‐sample unpaired t‐tests, yielding six contrasts for children, and six contrasts for adults (control > deletion, deletion > control, control > duplication, duplication > control, deletion > duplication, duplication > deletion). These results were evaluated with Bonferonni correction for six comparisons (p < 0.0083). All randomise analyses were performed with 5000 permutations and nuisance regression of age, gender, and site.
Two supplementary group difference TBSS analyses were performed: (1) The same randomise analyses as described above, but with NVIQ added as a nuisance regressor in addition to age, gender, and scan site. (2) The same TBSS + randomise analyses described for the primary analysis, but removing subjects such that there were no related subjects within a given randomise analysis (the family member removed was chosen at random). This second supplementary analysis therefore consisted of 28 deletion carriers, 11 duplication carriers, and 33 controls for the pediatric cohort, and 7 deletion carriers, 17 duplication carriers, and 28 controls for the adult cohort.
Post‐Hoc Group Comparisons of Whole‐Brain and Regional DTI Parameters
Given the widespread statistical white matter differences observed from the randomise analyses, a post‐hoc analysis was performed to assess global white matter effects. Global values of FA, MD, RD, and AD were obtained for each subject by averaging over each whole‐brain white matter skeleton from the prior TBSS analysis. Group effects for each global DTI parameter were then assessed for the children and adults with regression of age, gender, and scan site. For DTI metrics demonstrating significant group effects for children (p < 0.05), pairwise comparisons were performed between the controls and deletions, controls and duplications, and deletions and duplications using two‐group t‐tests with regression of age, gender, and scan site.
As a supplementary analysis, regional values of FA, MD, RD, and AD were obtained from the skeletonized white matter of callosal, cerebellar, projection, association, and limbic tracts. These values were obtained by averaging over the intersecting voxels of each whole‐brain skeletonized white matter map with the aforementioned tracts in the Johns Hopkins University (JHU) ICBM‐DTI‐81 White Matter Labeled Atlas, which is available for MNI152 space in FSL [Mori et al., 2005]. Group effects and pairwise comparisons for each regional DTI parameter were then assessed in the same manner described for the global DTI parameters.
Age Trajectories of Global DTI Parameters
As a preliminary investigation into developmental trajectories of white matter in the CNV carriers, quadratic models were fit to global FA, MD, RD, and AD over age, separately for controls and duplication carriers. Deletion carriers were not included in this analysis due to the low number of adult subjects.
Cognitive and Behavioral Associations
Associations of NVIQ, VIQ, and SRS with diffusion values were assessed. Linear regressions were performed separately for adults and children, with age, site, and gender as a covariate in each. Since the DTI values in the deletion and duplication carriers were observed to deviate from those of the controls in frequently noncoinciding directions, we assumed that deviation from normal toward both lower and higher values would be associated with impaired function (as opposed to only lower FA, for example). We therefore correlated NVIQ, VIQ, and SRS with the absolute value of z‐scored DTI metrics, using the mean and standard deviation of the control subjects to obtain the normalizing values of the z‐score. This gave rise to continuous, positive DTI measures with units of number of standard deviations in either direction from the control mean. These variables will subsequently be denoted |z(FA)|, |z(MD)|, |z(RD)|, and |z(AD)|. Each cognitive‐behavioral metric was correlated with |z(FA)|, |z(MD)|, |z(RD)|, and |z(AD)| in global white matter (WM), as well as five different white matter groups comprised of JHU regions—callosal, projection, association, limbic, and cerebellar tracts. False discovery rate (FDR) correction was applied when inferring the significance of the correlations, with correction for six comparisons corresponding to the global WM and five JHU groups, for each cognitive/behavioral metric and DTI metric.
Prediction of CNV Status
To assess the value of DTI in predicting gene dosage at the 16p11.2 locus, linear discriminant analysis (LDA, also known as Fisher's discriminant) was used to classify CNV status (control, deletion, or duplication) in children. LDA, which separates classes of objects using a linear combination of features, was used with four different sets of candidate predictor variables: (1) Only cognitive and demographic variables of NVIQ, VIQ, Social Responsiveness Scale (SRS), Social Communication Questionnaire (SCQ), age, and gender. (2) Demographic and cognitive variables along with volumetric (structural) measures. (3) Demographic and cognitive variables along with DTI metrics. (4) Demographic and cognitive variables, structural measures, and DTI metrics. The volumetric measures from FreeSurfer included intracranial volume (ICV), left and right total cortical surface area, left and right total white matter volume, left and right cortical volume, brainstem volume, left and right thalamus, caudate, putamen, cerebellum, hippocampus, and amygdala volumes (20 variables per subject). Most of these measures have been shown to differ between 16p11.2 pediatric deletion and duplication carriers versus typically developing controls [Qureshi et al., 2014]. The DTI metrics included were the FA, MD, RD, and AD values within the corpus callosum, association tracts, projection tracts, limbic tracts, and cerebellar tracts (20 variables per subject). For each set of predictor variables, feature selection was performed by sequentially adding the candidate predictor variable which decreased the classification error rate by the largest margin, as assessed using 10‐fold cross‐validation and 500 Monte Carlo repetitions. Linear discriminant models were created in this manner with selection of 1–15 features, excepting the first model for which there are only six candidate predictor variables.
ASD Subgroup Comparisons
Though this study was not designed for hypothesis testing of clinical ASD subjects, post‐hoc comparisons were performed between the six pediatric deletion carriers with clinical ASD, the 24 pediatric deletion carriers without clinical ASD, and controls. This was the only cohort with more than one subject with clinically diagnosed ASD (Table 2). ANOVA was used to assess group effects for the global DTI metrics, ICV, brain volume, WM volume, and gray matter volume. For metrics demonstrating significant group effects for children (p < 0.05), comparisons with multiple‐comparisons correction were performed for the controls versus deletion carriers without ASD, controls versus deletion carriers with ASD, and deletion carriers without ASD versus deletion carriers with ASD. Group differences of NVIQ were also assessed in the same manner. All statistics were performed with regression of site, age, and gender.
Table 2.
Diagnoses in CNV carriers
| Pediatric deletion carriers (n = 30) | Pediatric duplication carriers (n = 13) | Adult duplication carriers (n = 22) | Adult deletion carriers (n = 7) | |
|---|---|---|---|---|
| ADHS | 6 | 3 | 1 | 0 |
| Anxiety | 2 | 4 | 8 | 1 |
| Articulation disorder | 20 | 1 | 0 | 0 |
| Behavioral disorder | 4 | 2 | 0 | 0 |
| ASD | 6 | 1 | 2 | 1 |
| Coordination disorder | 12 | 3 | 1 | 0 |
| Enuresis disorder | 8 | 1 | 0 | 0 |
| Language disorder | 10 | 2 | 0 | 0 |
| Learning disorder | 3 | 1 | 1 | 0 |
| Mood disorder | 1 | 1 | 3 | 2 |
| Intellectual disability | 2 | 2 | 1 | 0 |
| Stereotyped motor disorder | 1 | 0 | 0 | 0 |
| Tic/Tourette's | 3 | 2 | 1 | 0 |
Each carrier could have more than one diagnosis. ADHS: attention‐deficit hyperactivity syndrome; ASD: autism spectrum disorder.
RESULTS
Demographic, Clinical and MRI Results
Table 1 reports the demographic, NVIQ, VIQ, SRS, and ICV data for each of the carrier and control cohorts. NVIQ and VIQ are significantly lower in both the pediatric deletion and pediatric duplication cohorts relative to their controls (p < 0.05), while there is no significant difference in either the adult deletion or the adult duplication cohorts relative to their controls. SRS is significantly higher in the pediatric deletion, pediatric duplication, and adult duplication cohorts relative to controls (p < 0.05), but not in the adult deletion carriers. As expected, ICV is significantly higher in the pediatric deletion carriers relative to controls, and significantly lower in the adult duplication carriers relative to controls (p < 0.01). ICV trends higher and lower in the adult deletion carriers and pediatric duplication carriers, respectively, relative to controls, but does not reach significance due to the smaller sample sizes of these two cohorts. Table 2 contains the neuropsychological diagnoses of all of the 16p11.2 CNV carriers, based on clinical assessment.
Table 1.
Subject characteristics
| Pediatric controls | Pediatric deletion carriers | Pediatric duplication carriers | Adult controls | Adult deletion carriers | Adult duplication carriers | |
|---|---|---|---|---|---|---|
| Age (years) | 12.2 ± 2.7 | 11.6 ± 2.3 | 11.2 ± 2.8 | 38.3 ± 10.1 | 39.6 ± 9.3 | 38.4 ± 9.8 |
| Gender | 17F/17M | 15F/15M | 3F/10M | 13F/15M | 3F/4M | 10F/12M |
| Handedness | 27R/7L | 23R/6L/1A | 10R/3L | 24R/3L/1A | 6R/1L | 19R/3L |
| NVIQ | 104.7 ± 12.7 | 92.3 ± 12.8* | 82.8 ± 15.2* | 99.1 ± 15.3 | 90.9 ± 10.0 | 99.7 ± 13.8 |
| VIQ | 106.4 ± 15.8 | 83.2 ± 15.7* | 90.8 ± 18.2* | 101.9 ± 17.9 | 94.1 ± 14.8 | 101.6 ± 12.2 |
| SRS | 17.1 ± 12.8 | 71.2 ± 39.3* | 74.1 ± 39.5* | 22.5 ± 13.3 | 48.5 ± 30.1 | 40.1 ± 30.8* |
| ICV (mL) | 1467 ± 127 | 1600 ± 164* | 1423 ± 185 | 1478 ± 117 | 1582 ± 126 | 1379 ± 145* |
Statistically significant differences between carriers and controls (p < 0.05) are indicated with an asterisk.
Voxel‐Wise Group Differences of DTI
Table 3 indicates contrasts which gave rise to significant voxel‐wise results (p < 0.05 for F‐tests, p < 0.0083 for pairwise comparisons). F‐tests demonstrated significant and extensive differences for all four DTI parameters, for both children and adults. For conciseness, the figures and discussion of these TBSS results will be limited to the pairwise comparisons between controls and deletion carriers, and between controls and duplication carriers. In the pediatric deletion carriers, FA, MD, and AD are extensively increased throughout the supratentorial white matter relative to controls (Fig. 1), as also shown in Owen et al. [2014]. The pediatric duplication carriers are differently affected, demonstrating extensive decreases of FA and elevations of MD and RD (Fig. 2). The adult deletion carriers show increases of AD (like the pediatric deletion carriers) in the internal capsules (Fig. 3). The adult duplication carriers, like the pediatric duplication carriers, exhibit decreased FA and increased RD relative to controls, but with additional extensive decreases in AD (Fig. 4).
Table 3.
TBSS group comparison results
| Child | Adult | |||||||
|---|---|---|---|---|---|---|---|---|
| FA | MD | RD | AD | FA | MD | RD | AD | |
| F test | X | X | X | x | x | x | x | x |
| Controls > Dels | ‐ | ‐ | ‐ | ‐ | ‐ | ‐ | ‐ | ‐ |
| Controls < Dels | x | X | ‐ | x | ‐ | ‐ | ‐ | x |
| Controls > Dups | x | ‐ | ‐ | ‐ | x | ‐ | ‐ | x |
| Controls < Dups | ‐ | X | X | x | ‐ | ‐ | x | ‐ |
| Dels > Dups | x | ‐ | ‐ | x | x | ‐ | ‐ | x |
| Dels < Dups | ‐ | X | X | x | ‐ | ‐ | x | ‐ |
Contrasts which gave rise to significant voxel‐wise results (p < 0.05 for F‐tests, p < 0.0083 pairwise differences) are indicated by an x.
Figure 1.
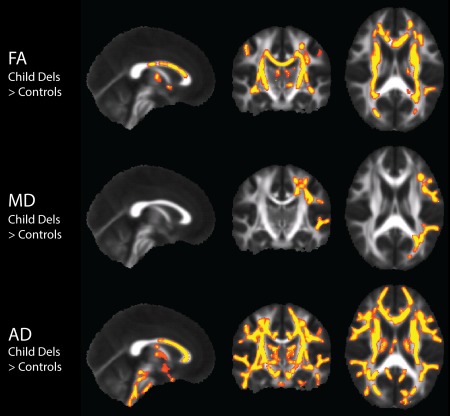
DTI TBSS two‐sample t‐test results in the pediatric 16p11.2 deletion carriers (n = 30) compared to controls (n = 34), with nuisance regression of site, age, and gender. Results show white matter regions of significantly increased FA, MD, and AD in the deletion carriers compared to controls displayed in yellow (p < 0.0083). There were no significant results in any of the remaining pediatric deletion carrier vs pediatric control contrasts. [Color figure can be viewed in the online issue, which is available at http://wileyonlinelibrary.com.]
Figure 2.
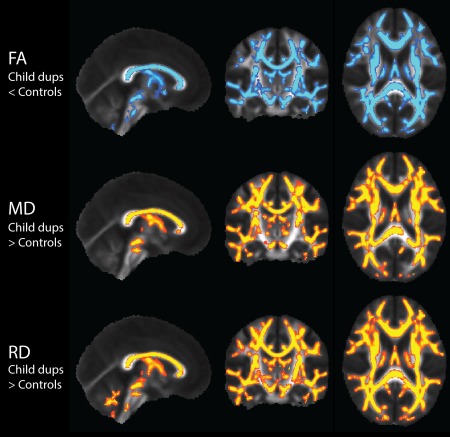
DTI TBSS results in the pediatric 16p11.2 duplication carriers (n = 13) compared to controls (n = 34), with nuisance regression of site, age, and gender. Results show white matter regions with significantly decreased FA displayed in blue, and significantly increased MD and RD displayed in yellow (p < 0.0083). AD also demonstrates elevations in spurious voxels. There were no significant results in any of the remaining pediatric duplication carrier vs pediatric control contrasts. [Color figure can be viewed in the online issue, which is available at http://wileyonlinelibrary.com.]
Figure 3.
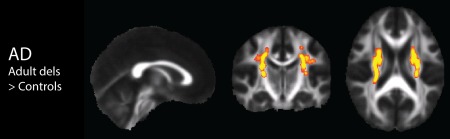
DTI TBSS results in the adult 16p11.2 deletion carriers (n = 7) compared to controls (n = 28), with nuisance regression of site, age, and gender. Results show white matter regions with significantly increased AD displayed in yellow (p < 0.0083). There were no significant results in any of the remaining adult deletion carrier vs adult control contrasts. [Color figure can be viewed in the online issue, which is available at http://wileyonlinelibrary.com.]
Figure 4.
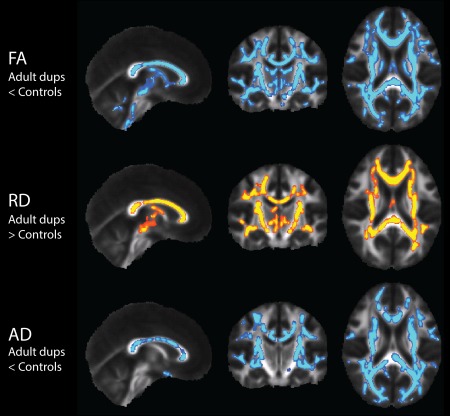
DTI TBSS results in the adult 16p11.2 duplication carriers (n = 22) compared to controls (n = 28), with nuisance regression of site, age, and gender. Results show white matter regions with significantly decreased FA and AD displayed in blue, and significantly increased RD displayed in yellow (p < 0.0083). [Color figure can be viewed in the online issue, which is available at http://wileyonlinelibrary.com.]
Results with covariation of NVIQ (in addition to site, age, and gender) were very similar to the primary analyses; with covariation of NVIQ, elevations of MD in the child deletion carriers, and elevation of AD in the child duplication carriers were not significant after correction for multiple comparisons. Results retaining only one member of each family in a given analysis were very similar to the primary analyses, with the exception that in the analyses with no related subjects, the F‐test for group differences of MD in adults did not yield significant results after correction for multiple comparisons.
Group Differences of Whole‐Brain and Regional DTI Metrics
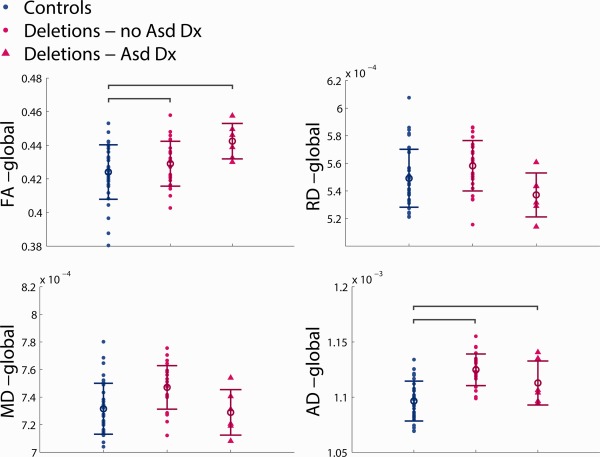
The results of whole‐brain white matter skeleton ANOVA analysis of the DTI metrics between groups (Fig. 5) summarize differences displayed in the voxel‐wise TBSS results and attest to the large spatial extent of many of the observed differences. The ANOVA results of regional white matter group differences in the DTI metrics are displayed in Supporting Information, Table 1 for the pediatric participants and in Supporting Information, Table 2 for the adult participants. The regional results generally agree with the global results. Of note, the adult deletion carriers have elevated AD in the association, limbic, and projection tracts relative to controls; these are the same three classes of tracts in the pediatric deletion carriers observed to exhibit higher AD. P values for the main effect of site are included in Supporting Information, Table 3.
Figure 5.
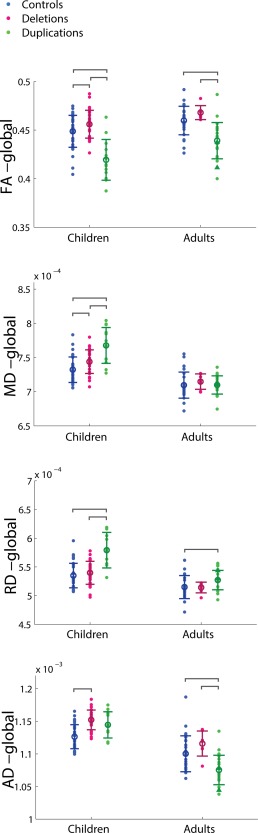
Group difference ANOVA results of whole‐brain white matter DTI values for pediatric and adult carrier–control cohorts, with regression of site, age, and gender. Individual subject data points are shown for each cohort with the mean and standard deviation indicated by the circle with error bars. Significant pairwise comparisons are indicated by brackets, only if the primary ANOVA analysis shows a significant group effect (p < 0.05). [Color figure can be viewed in the online issue, which is available at http://wileyonlinelibrary.com.]
Age Trajectory of Whole‐Brain Diffusion Parameters in Duplication Carriers
In Supporting Information, Figure 3, the whole‐brain DTI parameters are plotted against age, with quadratic models fit separately for controls and duplication carriers. The global FA values follow similarly shaped trajectories for the duplication carriers and controls, but with a constant FA offset between the two groups. In contrast, the global MD values are elevated at younger ages in the duplication carriers compared to their controls, but normalize in adulthood. The global RD values behave in a similar manner to the MD values with strong early elevation in the duplication carriers, and narrowing elevations in adulthood. The global AD values exhibit different trajectories of development in the duplication carriers compared to their controls, with the carriers demonstrating strong decreases in AD over age, while their matched controls demonstrate subtler decreases. This results in overall decreased AD of the duplication carriers in adulthood.
Cognitive and Behavioral Correlations
The results of the cognitive and behavioral correlations are displayed in Figures 6 and 7. For each cognitive/behavioral metric, only the white matter groups which demonstrated any significant correlations after FDR correction are displayed. For the children, there were significant negative correlations for NVIQ versus |z(MD)| and |z(RD)| in the callosal, association, and projection tracts, as well as |z(FA)| in the callosal tracts, and |z(MD| in the global white matter. There were strong trends toward negative correlations for NVIQ with |z(FA)| in the association and projection tracts that did not survive the FDR threshold (Fig. 6). There were no significant correlations of VIQ or SRS with the z‐scored DTI metrics for pediatric subjects after correction for multiple comparisons.
Figure 6.
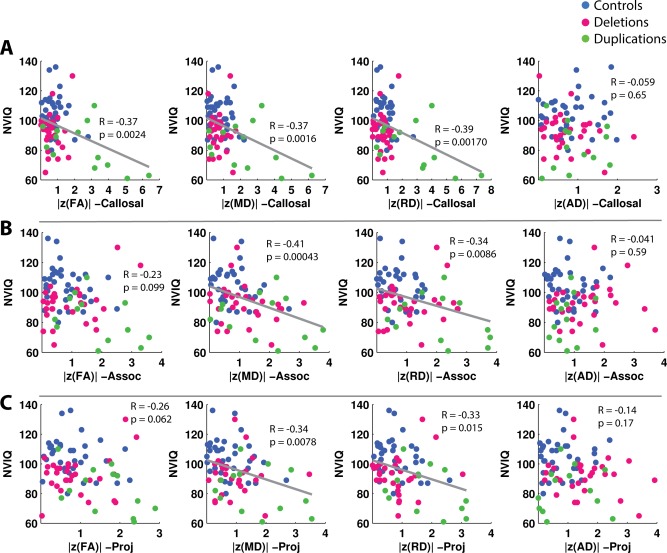
Correlations of NVIQ versus |z(FA)|, |z(MD)|, |z(RD)|, and |z(AD)| in callosal, association, and projection tracts for children. The presence of a gray linear regression line indicates a significant correlation (p < 0.05) after FDR correction for six comparisons, corresponding to the six white matter groups tested—global, callosal, association, projection, limbic, and cerebellar. P values include the effect of regressing for age. Correlations of NVIQ in global white matter are not shown, though a significant correlation was found between NVIQ and global |z(MD)|. [Color figure can be viewed in the online issue, which is available at http://wileyonlinelibrary.com.]
Figure 7.
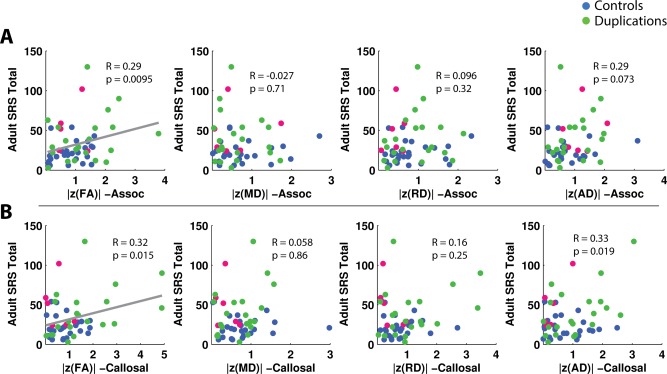
Correlations of the adult SRS versus |z(FA)|, |z(MD)|, |z(RD)|, and |z(AD)| in callosal and association tracts for adults. The presence of a gray regression line indicates a significant correlation (p < 0.05) after FDR correction for six comparisons, corresponding to the six white matter groups tested—global, callosal, association, projection, limbic, and cerebellar. P values include the effect of regressing for age. [Color figure can be viewed in the online issue, which is available at http://wileyonlinelibrary.com.]
For the adults, there were significant positive correlations of SRS, for which a higher score indicates more social impairment, with |z(FA)| in the callosal and association tracts (Fig. 7). There were no significant correlations of NVIQ or VIQ with the z‐scored DTI metrics for the adult subjects.
Prediction of CNV Status
The performance of the linear discriminant models for prediction of CNV status is displayed in Figure 8. The model containing demographic and cognitive variables, volumetrics, and DTI variables performed the best, as expected. The predicted classification accuracy of this model increases with sequentially added features up to 93.6% at ten features. Of the first five added features, three were demographic/cognitive and two were DTI metrics. Of the next five added features, one was a DTI metric, and four were volumetric measures. The predicted classification accuracy of the model with demographic/cognitive and DTI variables increases with sequentially added features up to 90.0% at five features. These first five features are the same as those in the model containing all variables. The predicted classification accuracy of the model with demographic/cognitive and volumetrics increases with sequentially added features up to 87.6% at nine features. Of these nine features, six are demographic/cognitive, and three are volumetric. The predicted classification accuracy of the model with demographics/cognitive variables alone increases up to 73.6% at four features. These four features were the four cognitive variables of NVIQ, VIQ, SRS, and SCQ. Across models, decline in predicted classification accuracies represent the effect of overfitting.
Figure 8.
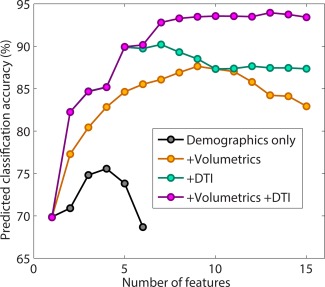
Accuracy of classification of the children into 3 groups (deletion, duplication, and control) for models constructed using linear discriminant analysis with (A) demographics only: NVIQ, age, and gender; (B) demographics + volumetric measures; (C) demographics + DTI metrics; and (D) demographics + volumetric measures + DTI metrics. [Color figure can be viewed in the online issue, which is available at http://wileyonlinelibrary.com.]
ASD Subgroup Comparisons
The results of the ASD subgroup ANOVAs for the pediatric deletion carriers are displayed in Figure 9 and Supporting Information, Figures S1 and S2. Global FA, global AD, and all volumetric measures are significantly elevated in the pediatric deletion carriers without ASD relative to controls, and in the pediatric deletion carriers with ASD relative to controls. The deletion carriers with ASD trend higher in global FA and the volumetric measures relative to the deletion carriers without ASD, though this does not reach statistical significance. NVIQ is significantly lower than controls in child deletion carriers without an ASD diagnosis, but not in child deletion carriers with an ASD diagnosis.
Figure 9.
Group difference ANOVA results of whole‐brain white matter DTI values for pediatric controls, pediatric deletion carriers without an ASD diagnosis, and pediatric deletion carriers with an ASD diagnosis, with regression of site, age, and gender. Individual subject data points are shown for each cohort with the mean and standard deviation indicated by the circle with error bars. Significant pairwise comparisons are indicated by brackets, only if the primary ANOVA analysis shows a significant group effect (p < 0.05). [Color figure can be viewed in the online issue, which is available at http://wileyonlinelibrary.com.]
DISCUSSION
Differential White Matter Alterations in Deletion versus Duplication Carriers
Using similar methodology to that of Owen et al. [2014], we continue to find AD‐driven increases in FA for the pediatric deletion carriers, which could reflect reduced axonal fanning and crossing, or reduced extracellular compartment tortuosity. Conversely, in this investigation, findings for the pediatric duplication carriers suggest decreased axonal density or myelination leading to primarily RD‐driven decreases of FA. Results for the adult duplication carriers could reflect a primary effect of increased axonal fanning, crossing, and/or tortuosity, with a smaller contribution of decreased axonal density, leading to AD‐ and RD‐ driven decreases of FA [Beaulieu, 2002]. In addition to these unique differential alterations, the microstructural alterations in both the pediatric and adult duplication carriers reveal effect sizes surpassing those demonstrated in studies with neuropsychiatrically defined cohorts. A meta‐analysis of DTI studies of ASD found an average Cohen's D effect size of 0.584 for reduction of FA in the corpus callosum [Aoki et al., 2013]. In comparison, the pediatric duplication carriers in this study showed an effect size of 1.34 for reduction of FA in the corpus callosum, while the adult duplication carriers showed an effect size of 1.04. The pediatric deletion carriers do not exhibit a statistically significant increase of FA throughout the corpus callosum, especially in the splenium, likely because normal FA values in the splenium of the corpus callosum are already the highest in the brain.
Relation to ASD and Schizophrenia
As the goal of genetics‐first studies is to better characterize and diagnose etiologically heterogeneous neuropathologies, it is important to relate our findings back to 16p11.2‐associated neuropsychiatric disorders, in particular, ASD and schizophrenia [McCarthy et al., 2009; Zufferey et al., 2012]. Patients diagnosed with ASD have a 10‐fold higher prevalence of 16p11.2 CNVs (both deletions and duplications) relative to an unscreened population [McCarthy et al., 2009]. A recent investigation of 16p11.2 CNV carriers has reported altered structural MRI measures in cortical and subcortical regions overlapping with areas known to be affected in ASD and schizophrenia [Maillard et al., 2014]. While a number of studies using DTI in ASD have suggested decreased FA and increased MD in many white matter tracts including the corpus callosum, cingulum bundle, and tracts connecting aspects of the temporal lobe, other studies have found increases in FA, or no group differences at all [Travers et al., 2012]. The findings we have presented here of the diverging alterations of white matter FA in carriers of the 16p11.2 deletion versus the reciprocal duplication thereby shed light on the heterogeneity of results from DTI studies that group ASD patients without defined genetic causes. Our results in the 16p11.2 duplication carriers show decreases of FA, while results in the pediatric 16p11.2 deletion carriers show increases of FA (Figs. 1, 2, 3, 4, 5); through extrapolation, we can see that analysis of a merged CNV cohort versus controls would have yielded sparse or negligible group FA differences. In addition to highly variable group difference findings, no consistent correlations between DTI measures and ASD symptom severity have been found to date. There is therefore a need to define etiologically homogeneous cohorts within ASD to more meaningfully characterize the neural underpinnings of specific patterns of behavior and cognition. This is especially important as interventions are developed for ASD, and DTI markers of white matter integrity demonstrate sensitivity to intervention‐linked decreased symptom severity [Pardini et al., 2012].
In contrast to ASD, schizophrenia is associated only with the 16p11.2 duplication [McCarthy et al., 2009]. A number of studies using various methodologies have suggested disrupted connectivity of widely distributed brain circuits as being characteristic of schizophrenia [Kubicki et al., 2007]. The most frequent positive findings in DTI studies of schizophrenia have indicated altered white matter (represented most often by decreased FA) in frontotemporal, interhemispheric, and frontothalamic tracts [McIntosh et al., 2008; Voineskos et al., 2010]. Our results in the 16p11.2 duplication carriers follow this general trend of decreases in FA (Figs. 2, 4, and 5). Despite this convergence towards an overarching theory of disconnection, results across both imaging and postmortem histological studies of the schizophrenic brain are still varied and inconclusive with regard to the nature, location, and extent of the white matter pathology [Kubicki et al., 2007]. This is likely a function of the disorder's complex etiology and course of development that blur the line between characterization as a disorder of neurodevelopment and one of neurodegeneration [Chiapponi et al., 2013]. While we find decreased FA in both the pediatric and adult cohort of 16p11.2 duplication carriers, divergent differences of AD in the two different age groups suggest somewhat different biophysical bases behind this aberrant white matter anisotropy.
There is evidence of altered developmental trajectories in both ASD and schizophrenia. Brain size of individuals with ASD is normal at birth [Courchesne et al., 2003; Hazlett et al., 2011], then exhibits rapid growth exceeding that of typically developing children for the first few years of life [Courchesne et al., 2001; Hazlett et al., 2011; Sparks et al., 2002], and finally normalizes by adulthood [Redcay and Courchesne, 2005]. There have also been reports of divergent trajectories of FA changes on a regional basis between individuals with ASD and typically developing controls [Bakhtiari et al., 2012]. Studies using structural and diffusion MRI to investigate age‐related changes in schizophrenia have generated heterogeneous findings, with a majority suggesting divergent trajectories of development, as opposed to convergent or parallel [Kubicki et al., 2007]. Therefore, while there is the possibility of ascertainment bias in our study sample, it is also plausible that the inconsistency we find between the pediatric and adult duplication carriers reflect divergent developmental trajectories. The discrepancy in AD could, for example, reflect stronger accelerating increases of axonal fanning, crossing, and/or tortuousity with age in duplication carriers relative to typically developing controls.
Associations of Cognitive and Behavioral Impairment with Deviation from Normal White Matter Microstructure
The differential alteration of white matter microstructure in the deletion carriers versus the duplication carriers, despite shared functional impairment, necessitates a different approach to link underlying biology to functional impairment than examining for the traditional linear or monotonic relationships. The strong associations of NVIQ and SRS with both increases and decreases of DTI metrics from their normative values in control subjects support the hypothesis that there is a U‐shaped relationship between white matter microstructure and cognitive and behavioral function, with the normal control mean values representing an optimum. This new approach to relating DTI metrics to neuropsychological functioning may prove useful in studies of heterogeneous neuropathologies such as idiopathic ASD and schizophrenia.
The correlations of NVIQ with |z(FA)|, |z(MD)|, and |z(RD)| of the white matter in the pediatric subjects (Fig. 6) are evidence of the broad effects of the 16p11.2 CNVs on brain development. NVIQ has previously been associated with FA and RD in the corpus callosum of ASD subjects [Alexander et al., 2007; Lee et al., 2009]. The associations of adult SRS with the absolute value of the diffusion metrics in callosal and association tracts are reflective of DTI studies of ASD that have demonstrated specific white matter alterations in the corpus callosum and in association tracts such as the superior longitudinal fasciculi [Travers et al., 2012]. While prior studies of ASD have found correlations of FA with autism symptom severity, these results have been inconsistent with regard to implicated behaviors and brain regions [Travers et al., 2012]. A prior investigation on 16p11.2 deletion carriers found that even children who did not meet any psychiatric diagnosis still showed subthreshold challenges in social communication and behavioral traits related to ASD [Hanson et al., 2014]. This observation is consistent with our demonstration of DTI associations with adult SRS in an adult group, where only 2 of the 30 duplication and deletion carriers met an ASD diagnosis (Table 2).
Linking Genes, Brain, and Behavior
One challenge in the interpretation of findings in CNV‐defined cohorts lies in the identification of the specific genes at the locus of interest that drive the observed phenotypes. Golzio et al. [2012] systematically overexpressed and suppressed each of the genes of the human 16p11.2 locus, using zebrafish as a model system. In their study, KCTD13 was identified as the principal gene that induced the macrocephalic phenotype associated with 16p11.2 deletion when suppressed, and the microcephalic phenotype associated with the reciprocal duplication when overexpressed [Golzio et al., 2012]. As KCTD13 is suggested to have a role in the regulation of cell cycle during neurogenesis, it is possible that this gene could drive many of the observed phenotypes in 16p11.2 CNV carriers. Another potential contributor at the 16p11.2 locus is the TAOK2 gene, in which downregulation impairs basal dendrite formation without affecting apical dendrites [de Anda et al., 2012]. Aberrant dendritic arborization can contribute to neurodevelopmental disorders such as ASD [Mukaetova‐Ladinska et al., 2004; Raymond et al., 1996], lending support to TAOK2 as a candidate gene in the 16p11.2 CNV phenotypes. It has also recently been discovered that mice with the equivalent of the human 16p11.2 deletion show altered synaptic plasticity through changes in metabotropic glutamate receptor 5 (mGLuR5) signaling at the postsynaptic terminal [Tian et al., 2015]. This leads to aberrant long‐term depression (LTD) that causes cognitive impairment as reflected in impaired contextual fear conditioning and inhibitory avoidance. Several genes at the human 16p11.2 locus are implicated in the regulation of mGluR5‐related synaptic transmission, including ALDOA, CDIPT, KCTD13, MAPK3, MAZ, MVP, SEZ62L, and TAOK2 [Tian et al., 2015]. The results from this mouse model raises the possibility that the DTI changes we observe in human 16p11.2 CNVs may at least in part be due to aberrant synaptic plasticity resulting in activity‐dependent alterations of white matter microstructure and myelination.
Our results evidence the mediatory role of the brain in the cross‐level relationship between the 16p11.2 CNVs, white matter microstructural alterations, and cognitive and behavioral impairment. This role is particularly demonstrated by the predictive power of brain metrics (and DTI in particular) for determining CNV status, while simultaneously showing strong relationships to cognitive and behavioral function. The opposite, large, and extensive differences of FA in the deletion versus duplication carriers support the theory of dosage‐dependence of genes at the 16p11.2 locus, further linking gene dosage intimately to brain alterations. It will be of particular interest to study gene expression data from the aforementioned candidate genes to more precisely describe the cross‐level relationships between 16p11.2 genes, brain, and behavior.
Study Limitations and Future Directions
Other future directions include subgroup analyses of subjects with neuropsychiatric diagnoses such as articulation disorders, language disorders, and coordination disorders. There may be sufficient statistical power for subgroup comparisons of articulation disorders specifically as these are exhibited in more than half of the pediatric deletion carriers (Table 2). It would be particularly interesting to investigate these group effects on language pathways of the brain. Larger sample sizes of both deletion and duplication carriers would be of value for further investigation of ASD subgroups. Based on the trends observed in our preliminary subgroup analysis, along with the theory of deviance from normal gene dosage and normal WM microstructural metrics being associated with maladaptive behavior, we would hypothesize that deletion carriers diagnosed with clinical ASD would exhibit higher FA than their counterpart without ASD, while duplication carriers diagnosed with clinical ASD would exhibit lower FA than their counterpart without ASD. Finally, to further elucidate the gene–structure–function relationship in these subjects, we will conduct a multimodal analysis with both diffusion and resting‐state functional data.
In sum, our results support the view that specific genetic variations may be more strongly associated with changes in brain structure, including macrostructure [Maillard et al., 2014; Qureshi et al., 2014] and microstructure [Owen et al., 2014], than shared neuropsychiatric diagnosis.
Supporting information
Supporting Information Figure 1.
Supporting Information Figure 2.
Supporting Information Figure 3.
ACKNOWLEDGMENTS
We are grateful to all of the families at the participating Simons Variation in Individuals Project (Simons VIP) sites, as well as the Simons VIP working group (Simons VIP Consortium, Neuron, 73(6):1063–1067, 2012). We appreciate obtaining access to phenotypic data on SFARI Base.
REFERENCES
- Alexander AL, Lee JE, Lazar M, Boudos R, DuBray MB Oakes TR, Miller JN, Lu J, Jeong EK, McMahon WM, Bigler ED, Lainhart JE (2007): Diffusion tensor imaging of the corpus callosum in autism. Neuroimage 34:61–73. [DOI] [PubMed] [Google Scholar]
- Aoki Y, Abe O, Nippashi Y, Yamasue H (2013): Comparison of white matter integrity between autism spectrum disorder subjects and typically developing individuals: a meta‐analysis of diffusion tensor imaging tractography studies. Mol Autism 4:25. [DOI] [PMC free article] [PubMed] [Google Scholar]
- Bakhtiari R, Zurcher NR, Rogier O, Russo B, Hippolyte L Granziera C, Araabi BN, Nili Ahmadabadi M, Hadjikhani N (2012): Differences in white matter reflect atypical developmental trajectory in autism: A Tract‐based Spatial Statistics study. Neuroimage Clin 1:48–56. [DOI] [PMC free article] [PubMed] [Google Scholar]
- Beaulieu C (2002): The basis of anisotropic water diffusion in the nervous system ‐ a technical review. NMR Biomed 15:435–455. [DOI] [PubMed] [Google Scholar]
- Bochukova EG, Huang N, Keogh J, Henning E, Purmann C Blaszczyk K, Saeed S, Hamilton‐Shield J, Clayton‐Smith J, O'Rahilly S, Hurles ME, Farooqi IS (2010): Large, rare chromosomal deletions associated with severe early‐onset obesity. Nature 463:666–670. [DOI] [PMC free article] [PubMed] [Google Scholar]
- Chiapponi C, Piras F, Fagioli S, Piras F, Caltagirone C, Spalletta G (2013) Age‐related brain trajectories in schizophrenia: A systematic review of structural MRI studies. Psychiatry Res 214:83–93. [DOI] [PubMed] [Google Scholar]
- Cook EHJ, Scherer SW (2008): Copy‐number variations associated with neuropsychiatric conditions. Nature 455:919–923. [DOI] [PubMed] [Google Scholar]
- Cooper GM, Coe BP, Girirajan S, Rosenfeld JA, Vu TH, Baker C, Williams C, Stalker H, Hamid R, Hannig V, Abdel‐Hamid H, Bader P, McCracken E, Niyazov D, Leppig K, Thiese H, Hummel M, Alexander N, Gorski J, Kussmann J, Shashi V, Johnson K, Rehder C, Ballif BC, Shaffer LG, Eichler EE (2011): A copy number variation morbidity map of developmental delay. Nat Genet 43: 838–846. [DOI] [PMC free article] [PubMed] [Google Scholar]
- Courchesne E, Karns CM, Davis HR, Ziccardi R, Carper RA Tigue ZD, Tigue ZD, Chisum HJ, Moses P, Pierce K, Lord C, Lincoln AJ, Pizzo S, Schreibman L, Haas RH, Akshoomoff NA, Courchesne RY (2001): Unusual brain growth patterns in early life in patients with autistic disorder: an MRI study. Neurology 57:245–254. [DOI] [PubMed] [Google Scholar]
- Courchesne E, Carper R, Akshoomoff N (2003): Evidence of brain overgrowth in the first year of life in autism. J Am Med Assoc 290:337–344. [DOI] [PubMed] [Google Scholar]
- de Anda FC, Rosario AL, Durak O, Tran T, Gräff J Meletis K, Rei D, Soda T, Madabhushi R, Ginty DD, Kolodkin AL, Tsai LH (2012): Autism spectrum disorder susceptibility gene TAOK2 affects basal dendrite formation in the neocortex. Nat Neurosci 15:1022–1031. [DOI] [PMC free article] [PubMed] [Google Scholar]
- Feuk L, Carson AR, Scherer SW (2006): Structural variation in the human genome. Nat Rev Genet 7:85–97. [DOI] [PubMed] [Google Scholar]
- Fischl B (2012): FreeSurfer. Neuroimage 62:774–781. [DOI] [PMC free article] [PubMed] [Google Scholar]
- Golzio C, Willer J, Talkowski ME, Oh EC, Taniguchi Y Jacquemont S, Reymond A, Sun M, Sawa A, Gusella JF, Kamiya A, Beckmann JS, Katsanis N (2012): KCTD13 is a major driver of mirrored neuroanatomical phenotypes of the 16p11.2 copy number variant. Nature 485:363–367. [DOI] [PMC free article] [PubMed] [Google Scholar]
- Hahamy A, Behrmann M, Malach R (2015): The idiosyncratic brain: distortion of spontaneous connectivity patterns in autism spectrum disorder. Nat Neurosci 18:302–309. [DOI] [PubMed] [Google Scholar]
- Hanson E, Bernier R, Porche K, Jackson FI, Goin‐Kochel RP Snyder LG, Snow AV, Wallace AS, Campe KL, Zhang Y, Chen Q, D'Angelo D, Moreno‐De‐Luca A, Orr PT, Boomer KB, Evans DW, Kanne S, Berry L, Miller FK, Olson J, Sherr E, Martin CL, Ledbetter DH, Spiro JE, Chung WK; Simons Variation in Individuals Project Consortium (2014): The cognitive and behavioral phenotype of the 16p11.2 deletion in a clinically ascertained population. Biol Psychiatry S0006‐3223:00427–00422. [DOI] [PMC free article] [PubMed] [Google Scholar]
- Hazlett HC, Poe MD, Gerig G, Styner M, Chappell C Smith RG, et al. (2011): Early brain overgrowth in autism associated with an increase in cortical surface area before age 2 years. Arch Gen Psychiatry 68:467–476. [DOI] [PMC free article] [PubMed] [Google Scholar]
- Jacquemont S, Reymond A, Zufferey F, Harewood L, Walters RG Kutalik Z, et al. (2011): Mirror extreme BMI phenotypes associated with gene dosage at the chromosome 16p11.2 locus. Nature 478:97–102. [DOI] [PMC free article] [PubMed] [Google Scholar]
- Jenkinson M, Bannister PR, Brady JM, Smith SM (2002): Improved optimisation for the robust and accurate linear registration and motion correction of brain images. NeuroImage 17:825–841. [DOI] [PubMed] [Google Scholar]
- Kaminsky EB, Kaul V, Paschall J, Church DM, Bunke B Kunig D, Vachet C, Piven J (2011): An evidence‐based approach to establish the functional and clinical significance of copy number variants in intellectual and developmental disabilities. Genet Med 7:777–784. [DOI] [PMC free article] [PubMed] [Google Scholar]
- Kubicki M, McCarley R, Westin CF, Park HJ, Maier S Kikinis R, Jolesz FA, Shenton ME (2007): A review of diffusion tensor imaging studies in schizophrenia. J Psychiatr Res 41:15–30. [DOI] [PMC free article] [PubMed] [Google Scholar]
- Lee JE, Chung MK, Lazar M, DuBray MB, Kim J Bigler ED, Lainhart JE, Alexander AL (2009): A study of diffusion tensor imaging by tissue‐specific, smoothing‐compensated voxel‐based analysis. Neuroimage 44:870–883. [DOI] [PMC free article] [PubMed] [Google Scholar]
- Levy D, Ronemus M, Yamrom B, Lee YH, Leotta A Kendall J, Marks S, Lakshmi B, Pai D, Ye K, Buja A, Krieger A, Yoon S, Troge J, Rodgers L, Iossifov I, Wigler M (2011): Rare de novo and transmitted copy‐number variation in autistic spectrum disorders. Neuron 6:886–897. [DOI] [PubMed] [Google Scholar]
- Maillard AM, Ruef A, Pizzagalli F, Migliavacca E, Hippolyte L Adaszewski S, Dukart J (2014): The 16p11.2 locus modulates brain structures common to autism, schizophrenia and obesity. Mol Psychiatry 20:140–147. [DOI] [PMC free article] [PubMed] [Google Scholar]
- McCarthy SE, Makarov V, Kirov G, Addington AM, McClellan J (2009): Microduplications of 16p11.2 are associated with schizophrenia. Nat Genet 41:1223–1227. [DOI] [PMC free article] [PubMed] [Google Scholar]
- McIntosh AM, Maniega SM, Lymer GKS, McKirdy J, Hall J, Sussmann JED (2008): White matter tractography in bipolar disorder and schizophrenia. Biol Psychiatry 64:1088–1092. [DOI] [PubMed] [Google Scholar]
- Mori S, Wakana S, van Zijl PCM, Nagae‐Poetscher LM (2005): MRI Atlas of Human White Matter. Amsterdam: Elsevier. [Google Scholar]
- Mukaetova‐Ladinska EB, Arnold H, Jaros E, Perry R, Perry E (2004): Depletion of MAP2 expression and laminar cytoarchitectonic changes in dorsolateral prefrontal cortex in adult autistic individuals. Neuropathol Appl Neurobiol 30:615–623. [DOI] [PubMed] [Google Scholar]
- Owen JP, Chang YS, Pojman N, Bukshpun P, Wakahiro M Berman JI, Spiro JE, Chung WK, Buckner RL, Roberts TP, Nagarajan SS, Sherr EH, Mukherjee P; Simons VIP Consortium (2014): Aberrant white matter microstructure in children with 16p11.2 deletions. J Neurosci 34:6214–6223. [DOI] [PMC free article] [PubMed] [Google Scholar]
- Pardini M, Elia M, Garaci FG, Guida S, Coniglione F Krueger F, Benassi F, Emberti Gialloreti L (2012): Long‐term cognitive and behavioral therapies, combined with augmentative communication, are related to uncinate fasciculus integrity in autism. J Autism Dev Disord 42:585–592. [DOI] [PubMed] [Google Scholar]
- Qureshi A, Mueller S, Snyder A, Mukherjee P, Berman J Roberts T, Nagarajan SS, Spiro JE, Chung WK, Sherr EH, Buckner RL, Simons VIP Consortium (2014): Opposing brain differences in 16p11.2 deletion and duplication carriers. J Neurosci 34:11199–11211. [DOI] [PMC free article] [PubMed] [Google Scholar]
- Raymond GV, Bauman ML, Kemper TL (1996): Hippocampus in autism: a Golgi analysis. Acta Neuropathol 91:117–119. [DOI] [PubMed] [Google Scholar]
- Redcay E, Courchesne E (2005): When is the brain enlarged in autism? A meta‐analysis of all brain size reports. Biol Psychiatry 58:1–9. [DOI] [PubMed] [Google Scholar]
- Shinawi M, Liu P, Kang SH, Shen J, Belmont JW Scott DA, Probst FJ, Craigen WJ, Graham BH, Pursley A, Clark G, Lee J, Proud M, Stocco A, Rodriguez DL, Kozel BA, Sparagana S, Roeder ER, McGrew SG, Kurczynski TW, Allison LJ, Amato S, Savage S, Patel A, Stankiewicz P, Beaudet AL, Cheung SW, Lupski JR (2010): Recurrent reciprocal 16p11.2 rearrangements associated with global developmental delay, behavioural problems, dysmorphism, epilepsy, and abnormal head size. J Med Genet 47:332–341. [DOI] [PMC free article] [PubMed] [Google Scholar]
- The Simons VIP Consortium (2012): Simons Variation in Individuals Project (Simons VIP): A genetics‐first approach to studying autism spectrum and related neurodevelopmental disorders. Neuron 73:1063–1067. [DOI] [PubMed] [Google Scholar]
- Smith SM, Jenkinson M, Johansen‐Berg H, Rueckert D, Nichols TE, Mackay CE, Watkins KE, Ciccarelli O, Cader MZ, Matthews PM, Behrens TEJ (2006): Tract‐based spatial statistics: Voxelwise analysis of multi‐subject diffusion data. NeuroImage 31:1487–1505. [DOI] [PubMed] [Google Scholar]
- Smith SM, Nichols TE (2009): Threshold‐free cluster enhancement: addressing problems of smoothing, threshold dependence and localisation in cluster inference. NeuroImage 44:83–98. [DOI] [PubMed] [Google Scholar]
- Sparks BF, Friedman SD, Shaw DW, Aylward EH, Echelard D Artru AA, Maravilla KR, Giedd JN, Munson J, Dawson G, Dager SR (2002): Brain structural abnormalities in young children with autism spectrum disorder. Neurology 59:184–192. [DOI] [PubMed] [Google Scholar]
- Stefansson H, Meyer‐Lindenberg A, Steinberg S, Magnusdottir B, Morgen K Arnarsdottir S, Bjornsdottir G, Walters GB, Jonsdottir GA, Doyle OM, Tost H, Grimm O, Kristjansdottir S, Snorrason H, Davidsdottir SR, Gudmundsson LJ, Jonsson GF, Stefansdottir B, Helgadottir I, Haraldsson M, Jonsdottir B, Thygesen JH, Schwarz AJ, Didriksen M, Stensbøl TB, Brammer M, Kapur S, Halldorsson JG, Hreidarsson S, Saemundsen E, Sigurdsson E, Stefansson K (2013): CNVs conferring risk of autism or schizophrenia affect cognition in controls. Nature 505:361–366. [DOI] [PubMed] [Google Scholar]
- Tian D, Stoppel LJ, Heynen AJ, Lindemann L, Jaeschke G, Mills AA, Bear MF (2015): Contribution of mGluR5 to pathophysiology in a mouse model of human chromosome 16p11.2 microdeletion. Nat Neurosci 18:182–184. [DOI] [PMC free article] [PubMed] [Google Scholar]
- Travers BG, Adluru N, Ennis C, Tromp do PM, Destiche D Doran S, Bigler ED, Lange N, Lainhart JE, Alexander AL (2012): Diffusion tensor imaging in autism spectrum disorder: a review. Autism Res 5:289–313. [DOI] [PMC free article] [PubMed] [Google Scholar]
- Voineskos AN, Lobaugh NJ, Bouix S, Rajji TK, Miranda D, Kennedy JL (2010): Diffusion tensor tractography findings in schizophrenia across the adult lifespan. Brain 133:1494–1504. [DOI] [PMC free article] [PubMed] [Google Scholar]
- Walters RG, Jacquemont S, Valsesia A, de Smith AJ, Martinet D, Andersson J (2010): A new highly penetrant form of obesity due to deletions on chromosome 16p11.2. Nature 463:671–675. [DOI] [PMC free article] [PubMed] [Google Scholar]
- Weiss LA, Shen Y, Korn JM, Arking DE, Miller DT Fossdal R, Saemundsen E, Stefansson H, Ferreira MA, Green T, Platt OS, Ruderfer DM, Walsh CA, Altshuler D, Chakravarti A, Tanzi RE, Stefansson K, Santangelo SL, Gusella JF, Sklar P, Wu BL, Daly MJ; Autism Consortium (2008): Autism Consortium: Association between microdeletion and microduplication at 16p11.2 and autism. N Engl J Med 6: 667–675. [DOI] [PubMed] [Google Scholar]
- Zufferey F, Sherr E, Beckmann N, Hanson E, Maillard A Hippolyte L, Macé A, Ferrari C, Kutalik Z, Andrieux J, Aylward E, Barker M, Bernier R, Bouquillon S, Conus P, Delobel B, Faucett WA, Goin‐Kochel RP, Grant E, Harewood L, Hunter JV, Lebon S, Ledbetter DH, Martin CL, Männik K, Martinet D, Mukherjee P, Ramocki MB, Spence SJ, Steinman KJ, Tjernagel J, Spiro JE, Reymond A, Beckmann JS, Chung WK, Jacquemont S; Simons VIP Consortium; 16p11.2 European Consortium (2012): A 600 kb deletion syndrome at 16p11.2 leads to energy imbalance and neuropsychiatric disorders. J Med Genet 49:660–668. [DOI] [PMC free article] [PubMed] [Google Scholar]
Associated Data
This section collects any data citations, data availability statements, or supplementary materials included in this article.
Supplementary Materials
Supporting Information Figure 1.
Supporting Information Figure 2.
Supporting Information Figure 3.