

Abstract
The uncompetitive NMDA receptor antagonist ketamine has been proposed to model symptoms of psychosis. Smooth pursuit eye movements (SPEM) are an established biomarker of schizophrenia. SPEM performance has been shown to be impaired in the schizophrenia spectrum and during ketamine administration in healthy volunteers. However, the neural mechanisms mediating SPEM impairments during ketamine administration are unknown. In a counter‐balanced, placebo‐controlled, double‐blind, within‐subjects design, 27 healthy participants received intravenous racemic ketamine (100 ng/mL target plasma concentration) on one of two assessment days and placebo (intravenous saline) on the other. Participants performed a block‐design SPEM task during functional magnetic resonance imaging (fMRI) at 3 Tesla field strength. Self‐ratings of psychosis‐like experiences were obtained using the Psychotomimetic States Inventory (PSI). Ketamine administration induced psychosis‐like symptoms, during ketamine infusion, participants showed increased ratings on the PSI dimensions cognitive disorganization, delusional thinking, perceptual distortion and mania. Ketamine led to robust deficits in SPEM performance, which were accompanied by reduced blood oxygen level dependent (BOLD) signal in the SPEM network including primary visual cortex, area V5 and the right frontal eye field (FEF), compared to placebo. A measure of connectivity with V5 and FEF as seed regions, however, was not significantly affected by ketamine. These results are similar to the deviations found in schizophrenia patients. Our findings support the role of glutamate dysfunction in impaired smooth pursuit performance and the use of ketamine as a pharmacological model of psychosis, especially when combined with oculomotor biomarkers. Hum Brain Mapp 37:4047–4060, 2016. © 2016 Wiley Periodicals, Inc.
Keywords: smooth pursuit, ketamine, schizophrenia, eye movements, psychosis model system
Abbreviations
- BMI
Body mass index
- BOLD
Blood oxygen level dependent
- FEF
Frontal eye field
- MWT‐b
Mehrfachwahl‐Wortschatz‐Intelligenztest
- NMDAR
N‐methyl‐D‐aspartate receptor
- PCP
Phencyclidine
- PSI
Psychotomimetic States Inventory
- RMSE
Root mean square error
- SPEM
Smooth pursuit eye movements
- TI
Inversion time
- VCPCR
Video‐based combined pupil and corneal reflection
INTRODUCTION
Translational model systems of psychosis constitute a well‐established method to inform the development of treatments for schizophrenia [Chavez‐Noriega et al., 2002; Javitt et al., 2012; Krystal et al., 2003; Stone, 2011]. They may not only lead to a better understanding of the disorder's pathophysiology but may also be able to help explain the diverse reaction to currently available antipsychotic compounds [Stone, 2011; Stone et al., 2010].
A promising model system is the phencyclidine (PCP) derivate ketamine [Abi‐Saab et al., 1998; Javitt et al., 2012; Kantrowitz and Javitt, 2010; Poels et al., 2013]. Like PCP, ketamine is an un‐competitive N‐methyl‐D‐aspartate receptor (NMDAR) antagonist [Joules et al., 2015]. It has a shorter plasma half‐life and less affinity to the NMDAR than PCP and has an excellent safety record in both clinical and experimental psychopharmacological settings [De Simoni et al., 2013; Doyle et al., 2013; Javitt et al., 2012; Krystal et al., 1994; Schmechtig et al., 2013]. Glutamate theories of schizophrenia largely build on the finding that PCP and ketamine evoke transient symptoms that mimic a wide spectrum of schizophrenia symptoms [Krystal et al., 1994; Lahti et al., 2001; Schmechtig et al., 2013]. More specifically, these theories postulate that NMDAR hypofunction is fundamentally related to the pathophysiology of schizophrenia [Kantrowitz and Javitt, 2010; Krystal et al., 2003; Poels et al., 2013]. All three dimensions of psychotic symptoms (positive, negative and cognitive) have been reported during ketamine administration [Krystal et al., 1994]. However, despite this impressive overlap, ketamine does not produce all aspects of the disorder. Schizophrenia is a chronic, episodic, neurodevelopmental disorder and a pharmacological state model cannot represent the full picture of the disorder. Common discrepancies include the inability to mimic all symptoms and the fact that participants know that their symptoms are caused by the drug [Murray et al., 2013; Steeds et al., 2015].
Cognitive deficits in schizophrenia are for the most part resistant to currently available treatments [Stone, 2011]. Given that they lead to fundamental psycho‐social impairments and reduce subjective well‐being, they are an important target for new treatments [Buckley and Stahl, 2007]. Model systems that mimic cognitive symptoms of schizophrenia might further this important development [Javitt et al., 2012].
Smooth pursuit eye movements (SPEM) are a widely studied biomarker of schizophrenia [Avila et al., 2002; Holzman et al., 1973; Koychev et al., 2011; Lee et al., 2001; Sweeney et al., 1992]. Cognitive processes, e.g., motion processing, attention and prediction play key roles in the performance of SPEM [Lencer and Trillenberg, 2008]. The neural correlates of SPEM are well characterized [Leigh and Zee, 2006] and SPEM deficits in the schizophrenia spectrum are highly reliable [Koychev et al., 2011; Lee et al., 2001], which makes them an ideal biomarker for both diagnostic processes and the development and evaluation of new treatments [Klein and Ettinger, 2008; Koychev et al., 2011; Smyrnis, 2008]. Deficits in SPEM have been found in schizophrenia patients [Ettinger et al., 2004; Levy et al., 2010], patients with schizotypal personality disorder [Siever, 1985], people with high levels of psychometric schizotypy [Gooding et al., 2000; Lenzenweger et al., 2006; Meyhöfer et al., 2015; Smyrnis et al., 2007] and first‐degree relatives of schizophrenia patients [Ettinger et al., 2004; Lencer et al., 2003]. SPEM deficits in schizophrenia have been described both globally, using measures such as the root mean square error (RMSE) of eye position, as well as specifically, using measures such as velocity gain and saccadic frequency [Hutton and Kennard, 1998; Levy et al., 1993; O'Driscoll and Callahan, 2008]. Schizophrenia patients show reduced gain, increased saccadic frequency and increased RMSE [Hutton and Kennard, 1998; Levy et al., 1993; O'Driscoll and Callahan, 2008]. On the brain functional level, schizophrenic patients show reduced activity in pursuit‐related areas, such as frontal (FEF) and supplementary eye fields (SEF) [Hong et al., 2005; Keedy et al., 2006]. Furthermore, patients exhibit reduced activity in areas that play an important role in the processing and perception of motion, i.e., area V5 [Hong et al., 2005; Nagel et al., 2012] and primary visual processing [Tregellas et al., 2004].
Schizophrenia‐like deficits in SPEM have been reported in healthy volunteers during acute ketamine administration [Avila et al., 2002; Radant et al., 1998; Schmechtig et al., 2013; Weiler et al., 2000]. More specifically, ketamine leads to reduced velocity gain and increased saccadic frequency. SPEM deficits under the influence of ketamine are dose‐dependent [Radant et al., 1998] and have been reported for doses as low as 50 ng/mL and as high as 200 ng/mL racemic ketamine in plasma [Avila et al., 2002; Radant et al., 1998; Schmechtig et al., 2013; Weiler et al., 2000].
The neural mechanisms mediating SPEM deficits under ketamine are unknown. This is important in order to further characterize (dis‐)similarities in brain function between NMDAR antagonist state models and schizophrenia. Neuroimaging studies in humans have provided evidence that in schizophrenia, functional brain networks express abnormal connectivity patterns at rest [Frohlich and Van Horn, 2014; Nejad et al., 2012]. Similar resting‐state dysconnectivity is found under ketamine influence [Frohlich and Van Horn, 2014]. This may be explained by the influence of NMDA blockage on oscillation of pyramidal cells: NMDA blockage leads to excitation of inhibitory GABAergic interneurons which in turn inhibit and synchronize oscillations of pyramidal cells [Frohlich and Van Horn, 2014]. Fewer studies have investigated task‐related functional connectivity, but there is evidence of abnormal connectivity for memory tasks in both schizophrenia [Wadehra et al., 2013] and under ketamine influence [Driesen et al., 2013].
The first aim of the present study was to replicate previous findings of adverse ketamine effects on SPEM performance in healthy volunteers. On the basis of previous literature on SPEM in schizophrenia [Hutton and Kennard, 1998; Levy et al., 1993; O'Driscoll and Callahan, 2008] and in healthy volunteers under the influence on ketamine [Avila et al., 2002; Radant et al., 1998; Schmechtig et al., 2013; Weiler et al., 2000], we hypothesized that ketamine administration would lead to reduced velocity gain, increased saccadic frequency and increased RMSE. Second, we aimed to replicate the subjective, psychosis‐like effects of ketamine. Third, we aimed to investigate, for the first time, the neural correlates of ketamine‐induced SPEM deficits. On the basis of previous literature [Lencer et al., 1999, 2005; Schmechtig et al., 2013] we hypothesized that ketamine, in comparison to placebo, would lead to reduced activity in FEFs and V5 as well as areas associated with early visual processing, as these regions have been associated with reduced activity in schizophrenia patients during SPEM. Lastly, we investigated whether ketamine influences task‐dependent functional connectivity during SPEM. On the basis of previous literature [Driesen et al., 2014; Frohlich and Van Horn, 2014] we hypothesized that ketamine would lead to dysconnectivity in the SPEM network. As origins of connectivity we investigated the V5 region, which is an important node region for motion processing, and the FEFs, which are an important node for prediction during pursuit [Lencer and Trillenberg, 2008].
METHODS AND MATERIALS
Participants
Twenty‐nine healthy, non‐smoking, right‐handed male volunteers were recruited via ads placed around the campus of the University of Bonn and online, as well as via existing participant pools during a 6‐months period from May until November 2014. Data from this sample have not previously been published. Participants gave written informed consent before entering the study and were paid €200 for participation. We obtained approval of the local ethics committee and the study was conducted in agreement with the latest revision of the Code of Ethics of the World Medical Association (Declaration of Helsinki). The study is registered on http://www.ClinicalTrials.gov (NCT02701933).
Potential participants were pre‐screened via e‐mail and telephone concerning general inclusion criteria, such as MRI‐suitability and suitability for video‐based combined pupil and corneal reflection (VCPCR) eye‐tracking. Suitable participants were then invited for a thorough screening in our lab. Exclusion criteria were any current or history of axis I disorder diagnosis as assessed by the MINI International Neuropsychiatric Interview [Ackenheil et al., 1999], any neurological conditions and heart conditions, use of any prescription or non‐prescription medication up to one week before participation, personal history of head‐injuries, loss of consciousness, eye surgery or impairment of vision (other than corrective lenses), any other relevant medical conditions such as high blood pressure, positive urine drug test (Drug‐Screen Multi 5T, nal von minden GmbH), history of drug use or current drug use, under‐ or overweight [below 20 and above 25 body mass index (BMI) values], as well as any diagnosis of psychotic disorders among first‐degree relatives. All participants had good command of German language.
Participants were instructed to arrive well rested and to take no medicines (prescription and non‐prescription) in the 24 hours before assessment. On the day of assessment, participants stayed abstinent from food and drank only water during the six hours before the start of the infusion. Participants were informed beforehand that they would not be able to operate heavy machinery and that they should go home and rest after both assessment days.
Study Design
Participants who met all inclusion criteria were invited to return for two fMRI assessments. An additional medical screening was performed by the study anesthesiologist (C.N.) before the first infusion. The anesthesiologist also monitored vital signs of participants throughout both assessments and in a supervised post‐infusion period.
The study employed a double‐blind, counter‐balanced, placebo‐controlled and within‐subjects design. An equal number of participants were randomly assigned to receive ketamine first or placebo first. For each participant, assessments took place at least one week apart and at the same time of day (maximum of 1.5 hours difference). The study team carrying out the assessment were not involved in creating the randomization and were not involved in the preparation of the infusion solution.
On one of the two assessment days, participants received racemic ketamine (Ketamin‐Ratiopharm 500 Injektionslösung, Ratiopharm, Ulm, Germany) via a computer‐controlled infusion pump (Graseby 3500 infusion pump, Smith Medical Int. Ltd, Luton, UK) over the course of one hour. Ketamine was administered as a 2 mg/mL solution with a constant target plasma level of 100 ng/mL. On the other assessment day, participants received 0.9% saline solution via the same computer‐controlled infusion pump over the course of one hour. Infusion solutions were prepared by the anesthesiologist shortly before infusion. Participants provided information about their height and weight, which was used to achieve the stable desired ketamine plasma concentration. The solutions were administered as a continuous bolus infusion using the STANPUMP program (Steven L. Shafer, M.D., Anesthesiology Service (112A), PAVAMC, 3801 Miranda Ave., Palo Alto, CA. 94304) and based on the three‐compartment model by Domino et al. [Domino et al., 1982], which has been used in previous study protocols [Schmechtig et al., 2013]. Infusion started five minutes before functional images were recorded.
Data Collection
Questionnaires and test of sustained attention
Participants gave demographic information and completed the Mehrfachwahl‐Wortschatz‐Intelligenztest (MWT‐b) [Lehrl, 2005] test of verbal intelligence during the screening visit. Before, during and after infusion participants completed the Psychotomimetic States Inventory (PSI) [Mason et al., 2008]. To control for confounding effect of ketamine on basic attentional procession, participants completed four lines of the d2 test [Brickenkamp, 2002] of sustained attention during ketamine infusion and four different lines during placebo infusion. The d2 test requires the crossing out of the letter d combined with two dashes amidst letters d and p combined with one, two, three or four dashes and is a well‐established measure of sustained attention.
Blood samples
Blood samples were drawn before, during and after infusion from the non‐infusion arm to ensure that no residual traces of ketamine solution from the infusion site would contaminate the results [Niesters et al., 2012]. They were immediately centrifuged at 1300 rcf for 10 minutes and stored at −80°C.
Eye movements
Movements of the right eye were recorded using the MRI‐compatible EyeLink 1000 (SR Research, Ottawa, Ontario, Canada) eye‐tracker. Sampling rate was 1000 Hz. The minimal spatial resolution of this system was 0.01° and the average accuracy was 0.25° to 0.5°. A central pupil‐tracking algorithm was used to detect pupil and corneal reflection. A horizontal three point spatial calibration (white calibration target on black background) was performed before the task. The task was presented on a NordicNeuroLab LCD monitor (active area 39.2cm height × 52.35cm width, resolution 1024 × 768 pixels, refresh rate 120Hz). Distance from camera to eye (consisting of distance from eye to mirror and from mirror to eye) was 172cm.
The SPEM task was presented in a block design consisting of ten pursuit blocks and nine fixation blocks. The target, a white circle (width and height 15 pixels, 2.55° visual angle) on black background, remained in center position during fixation blocks and moved horizontally in a sinusoidal waveform starting in the center position and subtending a visual angle of ±5.8° in SPEM blocks. Frequency was either 0.2Hz (peak velocity 7.3°/s; five blocks) or 0.4Hz (peak velocity 14.8°/s; five blocks). Each block lasted 30s, with SPEM and fixation blocks alternating. Order of blocks was randomized with the constraint that SPEM and fixation blocks alternated. Order of blocks was the same for all participants. Prior to scanning, participants received written instruction to follow the target with their eyes as accurately as possible and fixate on the stationary target during fixation blocks.
fMRI
fMRI scanning was conducted using a Siemens (Erlangen, Germany) Trio MRI scanner at 3 Tesla field strength. Participants were instructed to lie as still as possible, wore ear plugs to reduce the impact of scanner noise and were surrounded by foam paddings to minimize head movements.
After an initial scan and individual adjustment of the field of view, a high‐resolution structural scan (T1‐weighted) was acquired to exclude participants with apparent brain pathologies and to optimize normalization of the functional MRI data. Scan parameters were as follows: TR = 1570ms; TE = 3.42ms; inversion time (TI) = 800ms; flip angle = 15°; FoV = 256 mm; matrix size = 256 × 256; 160 slices; slice thickness = 1 mm; sequential slice‐order with no inter‐slice gap; voxel size = 1 × 1 × 1 mm. During the experimental task, T2*‐weighted MRI scans were collected with gradient‐echo planar image sequence (TR = 2500ms; TE = 30ms) that displayed the blood oxygen‐level dependent (BOLD) response. A standard 12 channel head coil was used for radio frequency transmission and reception. Slices were oriented parallel to the intercommissural plane (AC‐PC line). Additional scan parameters are as follows: Flip angle = 90°; FoV = 192 mm; matrix size = 96 × 96; 37 slices; slice thickness = 3 mm; sequential slice order with interslice gap of 0.3 mm; voxel size = 2 × 2 × 3 mm. A total of 239 whole‐brain images were collected for each participant.
Data Processing and Statistical Analysis
Questionnaires and test of sustained attention
Questionnaire data were analyzed using SPSS 22 (IBM Corp., Armonk, NY). To ensure that assumptions for statistical analyses were met, data were screened for normality of distribution, sphericity and homogeneity of variances using skewness scores, Shapiro‐Wilk tests, Mauchly's tests and Levene's statistics. Questionnaire scores were transformed (ln(x)), as they violated normality assumptions. Where sphericity assumption was violated, results were Greenhouse‐Geisser corrected, uncorrected degrees of freedom and Greenhouse‐Geisser epsilon are reported [Jennings, 1987].
PSI data were analyzed using mixed‐design ANOVA with the within‐subjects factors Substance (ketamine, placebo) and Application‐Stage (pre infusion, during infusion, post infusion) and the between‐subjects factor Administration‐Order (ketamine first, placebo first). Post‐hoc tests are reported with Bonferroni‐corrected α‐level (α = 0.01). For the d2 attention test, we computed the concentration index as the main outcome measure [Brickenkamp, 2002]. The concentration index is computed by subtracting the number of false alarms (all crossed out letters d combined with more or less than two dashes or letters p combined with any number of dashes) from the number of correct items (all crossed out letters d combined with two dashes). A paired t‐test was conducted to compare d2 performance between placebo and ketamine conditions. Effect sizes for ANOVA are given in partial eta‐squared [Cohen, 1973], effect sizes for t‐tests are given in Cohen's d [Cohen, 1992].
Blood samples
Ketamine concentration in plasma (in ng/mL) was analyzed by an independent biomedical laboratory (Labor Schottdorf MVZ GmbH, Augsburg, Germany). To check the substance manipulation, blood samples were analyzed for pre‐, during‐ and post infusion for both the ketamine and the placebo condition.
Due to technical difficulties, samples could only be analyzed with exact ketamine concentration for 20 participants in the ketamine condition and for 21 participants in the placebo condition. Only these were included in the analyses for mean ketamine concentration scores. It was possible to check manipulation (received ketamine, did not receive ketamine) for all participants.
Eye movements
Eye movement data were analyzed using Data Viewer software (SR Research) and purpose‐written routines in LabVIEW (National Instruments Corporation, Austin, TX). The first and the last half ramp in each block were excluded from analysis and SPEM variables were calculated separately for 0.2 and 0.4 Hz frequencies. Saccade frequencies (N/s) were computed using minimum amplitude 1° and velocity (30°/s) criteria. Time‐weighted average velocity gain was calculated for sections of pursuit in the middle 50% of each ramp, where target velocity was fastest [Lencer and Trillenberg, 2008; Smyrnis et al., 2007], by dividing mean eye velocity by mean target velocity. Saccades and blinks were excluded from these sections. RMSE scores were computed for entire ramps excluding blinks.
To statistically analyze substance effects on saccadic frequency, gain and RMSE scores, repeated measures ANOVAs were conducted with the within‐subjects factors Substance (ketamine, placebo) and Frequency (0.2 Hz, 0.4 Hz) using SPSS 22. No main effects of the factor Administration‐Order and no interactions of Order with Substance or Frequency were found, consequently Administration‐Order was not included in the subsequent analyses to increase the power to determine treatment effects. Effect sizes are reported as partial eta squared [Cohen, 1973]. To ensure that assumptions for statistical analyses were met, data were screened for normality of distribution and homogeneity using skewness scores, Shapiro‐Wilk tests and Levene's statistics. RMSE scores were transformed [ln(x)] as they violated normality assumptions. Additionally, we calculated Pearson correlations between change scores (placebo condition – ketamine condition) of velocity gain, RMSE and saccadic frequency with BOLD signal change (placebo condition – ketamine condition) in the V5 and the FEF regions. Alpha level was Bonferroni corrected (α = 0.008).
fMRI
fMRI data analysis was performed using Statistical Parametric Mapping 8 software (SPM 8; http://www.fil.ion.ucl.ac.uk/spm/software) implemented in Matlab R2013a (The MathWorks, Natick, MA). Preprocessing included the following steps: First, images for each participant were realigned along the mean image in the time series to correct for head motion using a least squares approach and a six‐ parameter rigid‐body transformation. Functional scans were then coregistered to the T1‐weighted anatomical image. Normalization parameters were obtained from segmentation of the structural T1 images and used to transform the functional images into standard space (Montreal Neurological Institute, MNI template). Functional images were resampled at 2 × 2 × 2 mm and finally smoothed with an 8 × 8 x 8 mm Gaussian full width at half maximum filter. Normalization for one participant failed; this participant was subsequently excluded from all fMRI analysis.
At the first (single‐subject) level, data were analyzed using a fixed effects model [Friston et al., 1994] based on a 30s boxcar function as implemented in SPM 8. BOLD response was modeled as a canonical hemodynamic response‐function (hrf). Experimental conditions were modulated parametrically to take into consideration that the Frequency conditions are conceivably dependent on each other. The first‐level model consisted of eight regressors: A SPEM regressor consisting of all SPEM blocks (irrespective of Frequency), a Frequency regressor in which SPEM frequency (0.2Hz and 0.4Hz) was modulated parametrically, and six motion regressors to further control movement‐related confounds. Two main contrasts were computed: For the first contrast (SPEM vs. baseline) we contrasted the SPEM regressor (all 0.2Hz and 0.4Hz SPEM blocks) with the implicit baseline (all fixation blocks). This contrast compares brain activity during SPEM, independently of target frequency, with brain activity during fixation. The second contrast (Frequency vs. baseline) contrasted the Frequency regressor with the implicit baseline (all fixation blocks). The Frequency regressor consisted of all SPEM blocks, but the target frequency (0.2 Hz and 0.4 Hz) was modulated parametrically, which means that 0.2Hz and 0.4Hz target frequency were modeled as two levels of the same factor in the analysis. This contrast compares the differences in brain activity between 0.4 Hz SPEM blocks and Fixation blocks with the difference in brain activity between 0.2 Hz SPEM blocks and Fixation blocks (0.4Hz > 0.2Hz).
Mean scores of each of the six motion parameters were calculated for ketamine and placebo, respectively. Paired t‐tests were performed to compare the ketamine and placebo conditions. Results were corrected for multiple comparisons using Bonferroni correction (α = 0.008). Effect size is given in Cohen's d [Cohen, 1992].
At the second level, random‐effects analyses (one‐sample t‐tests) were carried out for the SPEM vs. baseline and Frequency vs. baseline contrasts for the placebo condition to illustrate the SPEM task network and the effect of Frequency. Random‐effects analyses (paired t‐tests) were performed to identify effects of substance on the SPEM vs. baseline and Frequency vs. baseline contrasts. All analyses were conducted on the whole‐brain level, not masked for any region of interest. No main effects of the factor Administration‐Order and no interactions of Administration‐Order with Substance or Frequency were found, therefore we excluded Administration‐Order from the subsequent analyses reported here to improve clarity of results. Effects of Substance are reported using cluster‐level FWE‐corrections for multiple comparisons based on family‐wise error (FWE) (P < 0.05, smallest significant cluster consisted of 378 voxels). Results of the one‐sample t‐tests are reported using peak voxel FWE‐correction (P < 0.05) in order to increase the anatomic specificity of the core‐regions engaged in the present SPEM task. Anatomical labels were obtained using the Anatomy Toolbox [Eickhoff et al., 2005] and functional localizations were identified from previous literature [Lencer et al., 2004; Nagel et al., 2012].
To assess effects of ketamine on task‐dependent connectivity, a psychophysiological interactions analysis (PPI) was conducted. Whole‐brain seed to voxel PPI analysis was conducted in SPM 8. The seed regions were selected based on previous literature [Nagel et al., 2012] and determined as a 6 mm sphere centered in V5 and FEF, respectively. Four PPI analyses were carried out, one for right V5 [MNI: 44, −72, 2], one for left V5 [MNI: −44, 72, 2], one for right FEF [42, −4, 52] and one for left FEF [−42, −4, 52]. The procedure for each was the same: A time course vector (PPI vector) of the interaction between neural activity in the seed region and the psychological conditions SPEM and fixation was constructed. To identify neural regions temporally correlated with each PPI time course at the individual subject level, each PPI vector, together with the main effects of neural activity and the related psychological task condition, were entered as regressors into subject‐specific fixed‐effects models. Head motion parameters were entered as regressors of no interest. Contrast maps of voxels correlating with the seed PPI time course under SPEM > fixation were generated for each participant. To assess group effects, random‐effects analyses (one‐sample t‐tests) were carried out for the SPEM vs. baseline contrast for the placebo condition to illustrate connectivity in the SPEM task network. Random‐effects analyses (paired t‐tests) were performed to identify substance condition differences in connectivity. In line with the BOLD level analyses results of substance‐related differences are reported using cluster‐level FWE‐correction (P < 0.05) and results of the one‐sample t‐tests are reported using peak voxel FWE‐correction (P < 0.05).
RESULTS
Data Prescreening
Of the 43 individuals initially screened for participation, 29 met all inclusion criteria and were included in the study. Two participants did not participate in the second fMRI assessment and were therefore excluded from all data analysis. One participant was excluded because normalization failed due to considerable movement during fMRI. Therefore, the final sample for analyses consisted of N = 26 participants. Mean age was M = 25.57 (SD = 3.38), mean years of education was M = 17.57 (SD = 2.64). Mean MWT‐b score was M = 29.65 (SD = 2.74), indicating a mean verbal IQ of M = 109 (SD = 10.43). Due to technical limitations of eye‐tracking during fMRI, behavioral SPEM data could not be acquired for all participants. Velocity gain could be calculated for 21 participants (78% of the sample), RMSE for 24 participants (89% of the sample) and saccadic frequency for 19 participants (70% of the sample). Additional statistics are reported in the supplements.
Questionnaires and test of sustained attention
For the d2 concentration index, there was no difference between placebo and ketamine [t(25)=1.05; P = 0.30; d = 0.02], with mean for placebo being M = 170.65 (SD = 16.25) and for ketamine being M = 168.31 (SD = 18.81). Ketamine increased the PSI subscales Perceptual Distortion [F(1,24)=32.84, P < 0.001, ηp2 = 0.57] and Cognitive Disorganization [F(1,24)=9.18, P = 0.006, ηp2 = 0.27] compared to placebo, independently of Application‐Stage and Administration‐Order. Ketamine increased the subscales Delusional Thinking [F(2,48)=8.31, ε = 0.72 P = 0.003, ηp2 = 0.25], Perceptual Distortion [F(2, 48)=29.80, ε = 0.76, P < 0.001, ηp2 = 0.55) and Cognitive Disorganization [F(2,48)=11.36, P < 0.001, ηp2 = 0.32] in interaction with Application‐Stage, with scores being higher only during substance infusion (delusional thinking: t(25)=3.26, P = 0.003, d = 0.64; perceptual distortion: t(25)=6.51, P < 0.001, d = 1.27; cognitive disorganization: t(25)=4.02, P < 0.001, d = 0.78). Ketamine increased the subscales Delusional Thinking [F(1,24)=5.63, P = 0.02, ηp2 = 0.19], Perceptual Distortion [F(1,24)=5.04, P = 0.03, ηp2 = 0.17] and Cognitive Disorganization [F(1,24)=11.76, P = 0.002, ηp2 = 0.32] more when ketamine was administered first compared to when it was administered second. Lastly, there was an interaction of Substance, Applications‐Stage and Administration‐Order for the Mania subscale [F(2,48)=4.07, P = 0.02, ηp2 = 0.14], with ketamine increasing scores more when it was administered first and placebo decreasing scores only when it was administered first. For PSI mean scores please refer to the Supporting Information.
Blood samples
Ketamine concentration was <10 ng/mL plasma in all pre‐, during‐ and post‐placebo samples. Ketamine concentration was <10 ng/mL plasma in all pre ketamine infusion samples and >10 ng/mL in all during‐ketamine infusion samples, indicating that assignment to substance conditions was carried out as planned. The mean ketamine plasma level for during‐ketamine infusion was M = 89.69 ng/mL (SD = 13.27 ng/mL) with a minimum of 54.30 ng/mL and a maximum of 114.0 ng/mL, indicating that the plasma‐levels were close to our target level and that standard deviation was similar to previous studies with low doses of ketamine [Driesen et al., 2014; Krystal et al., 2005].
SPEM Behavioral Results
Velocity gain
There was a main effect of Substance [F(1,20)=7.81, P = 0.01, ηp2 = 0.28], with scores being lower for ketamine, and a main effect of Frequency [F(1,20)=23.66, P < 0.001, ηp2 = 0.54], with scores being lower for the faster condition. There was no interaction between Substance and Frequency (<P 0.05) (Table 1, Fig. 1).
Table 1.
Descriptive statistics of SPEM variables by substance condition
| Velocity gain (n=21) | RMSE (n=23) | Saccadic frequency (n=19) | |
|---|---|---|---|
| Placebo | |||
| 0.2hz | .91 (.07) | 34.85 (25.56) | .41 (.45) |
| 0.4hz | .80 (.23) | 60.69 (15.56) | .90 (.93) |
| Ketamine | |||
| 0.2hz | .79 (.13) | 39.73 (25.80) | .87 (.63) |
| 0.4hz | .68 (.16) | 100.79 (14.88) | 1.88 (1.01) |
Figure 1.

Main effect of Substance for velocity gain (N = 21) and Frequency‐by‐Substance interaction for frequency of saccades (N = 19) and RMSE (N = 24).
Saccadic frequency
There was a main effect of Substance [F(1,18)=9.22, P = 0.007, ηp2 = 0.33], with scores being higher for ketamine than placebo, and a main effect of Frequency [F(1,18)=50.63, P < 0.001, ηp2 = 0.73], with scores being higher for the faster condition. There was an interaction between Substance and Frequency [F(1,18)=6.32, P = 0.02, ηp2 = 0.26], with ketamine increasing saccadic frequency more for faster frequency [t(18) = 7.91, p < 0.001, d = 1.81] (Table 1, Fig. 1).
RMSE
There was a main effect of Substance [F(1,22)=100.50, P < 0.001, ηp2 = 0.82], with scores being higher for ketamine than placebo, and a main effect of Frequency [F(1,22)=88.37, P < 0.001, ηp2 = 0.80], with scores being higher for the faster condition. There was an interaction between Substance and Frequency [F(1,22)=41.70, P < 0.001, ηp2 = 0.65], with ketamine increasing RMSE more for faster frequency [t(22) = 10.93, p < 0.001, d = 2.28] (Table 1, Fig. 1).
fMRI Results
SPEM task‐network and Frequency‐dependent brain activity in placebo condition
Smooth pursuit elicited activity in a large bilateral cluster in the occipital lobe that expanded across primary visual cortex and motion processing areas (lingual gyrus, calcarine gyrus, superior occipital gyrus, middle occipital gyrus) and extended into superior parietal lobule. Smooth pursuit also led to activity bilaterally in the thalamus and the frontal eye fields (FEFs). In addition, during smooth pursuit activity was observed in the left middle cingulate cortex, the right putamen and the left supplementary eye field. Differences in frequency‐dependent (fast > slow) activity were located in primary visual cortices. Refer to supplementary material for a more detailed overview. The reported peak voxels were still present when the analysis was conducted with only those participants whose eye‐tracking data quality was sufficient for analysis (n = 24). There were no significant results for the reverse contrasts.
Ketamine effects on brain activity during SPEM
Motion parameters (total movement) were not affected by Substance (all P > 0.05), arguing against confounding effects of motion differences during placebo and ketamine administration. There was less BOLD response under ketamine compared to placebo in the SPEM vs. baseline contrast in three clusters: The first, right hemispheric, cluster encompassed areas of primary visual cortex, namely the fusiform gyrus, cuneus and lingual gyrus and extended into motion‐sensitive visual‐processing areas V3a and V5 as well as precuneus and the parietal eye fields. The second, left hemispheric, cluster encompassed areas of primary visual cortex, namely the fusiform gyrus, cuneus, calcarine gyrus and lingual gyrus and extended into motion‐sensitive areas V3a and V5 as well as cerebellum and the parietal eye fields. The third cluster consisted of the right FEF (Table 2, Fig. 2). The reported peak voxels were still present when the analysis was conducted with only those participants whose behavioral data quality was high enough for analysis (n = 24). There were no significant results for the reverse contrast. The change scores (placebo condition – ketamine condition) for velocity gain, saccadic frequency and RMSE did not significantly correlate with the BOLD signal change (placebo condition – ketamine condition).
Table 2.
Placebo > ketamine BOLD response during SPEM vs. baseline across all participants.
| Anatomical Label Functional Label | Hemisphere | Cluster size [k] | T‐value | MNI coordinates [mm] | ||
|---|---|---|---|---|---|---|
| Middle occipital gyrus extending into area V5 | Right | 4009 | 8.89 | 30 | −84 | 14 |
| Middle temporal gyrus extending into area V5 | Right | 4.90 | 46 | −72 | −2 | |
| Superior occipital gyrus extending into area V3a | Right | 4.96 | 24 | −70 | 34 | |
| Lingual gyrus | Right | 4.35 | 22 | −68 | −4 | |
| Fusiform gyrus | Right | 6.16 | 28 | −56 | −10 | |
| Precuneus | Right | 4.47 | 14 | −64 | 62 | |
| Cuneus | Right | 6.07 | 18 | −78 | 44 | |
| Cerebellum | Right | 5.14 | 24 | −64 | 58 | |
| Superior parietal lobule Parietal eye field | Right | 4.84 | 18 | −66 | 60 | |
| Middle occipital gyrus extending into area V5 | Left | 3408 | 7.08 | −38 | −78 | 6 |
| Middle temporal gyrus extending into area V5 | Left | 4.63 | −44 | −64 | 2 | |
| Superior occipital gyrus extending into area V3a | Left | 4.85 | −14 | −90 | 4 | |
| Lingual gyrus | Left | 5.11 | −20 | −70 | −8 | |
| Calcarine gyrus | Left | 5.49 | −10 | −92 | 16 | |
| Fusiform gyrus | Left | 5.44 | −28 | −68 | −8 | |
| Cuneus | Left | 6.40 | −18 | −88 | 24 | |
| Cerebellum | Left | 4.59 | −10 | −70 | −20 | |
| Precentral gyrus Frontal eye field | Right | 378 | 5.13 | 42 | 2 | 32 |
| Middle frontal gyrus Frontal eye field | Right | 3.91 | 42 | −4 | 52 | |
Whole‐brain cluster‐level FWE corrected (P < 0.001 uncorrected, smallest significant cluster consisted of 378 voxels).
Figure 2.
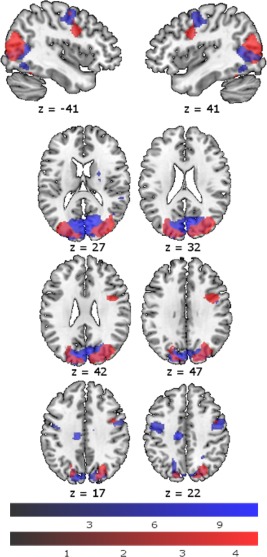
Activation pattern during SPEM compared to baseline (whole‐brain peak‐voxel FWE corrected (p < 0.05, minimum cluster size k = 30 voxels)) during placebo infusion (blue), and difference between placebo and ketamine condition (placebo > ketamine; whole‐brain cluster‐voxel FWE corrected (P < 0.001 uncorrected, smallest significant cluster consisted of 378 voxels)) (red) (N = 26). Color bars represent T‐scores.
Substance effects on functional connectivity
There was more functional connectivity in the SPEM than in the fixation condition for each seed region (right and left V5, right and left FEF). This difference was not altered by ketamine, indicating that despite effects on regional brain activity, ketamine did not disrupt the interplay of the V5 and FEF on the network level. For an overview of the functional connectivity results during SPEM, compared to fixation, refer to Supporting Information.
DISCUSSION
At the behavioral level, the results of our study showed the hypothesized effect of ketamine on SPEM performance [Avila et al., 2002; Radant et al., 1998; Schmechtig et al., 2013]: Velocity gain was significantly higher in the placebo than the ketamine condition, whilst saccadic frequency and RMSE were significantly higher in the ketamine condition than the placebo condition. These results mimic impairments reported in the schizophrenia spectrum [Ettinger et al., 2004; Gooding et al., 2000; Lencer et al., 2003; Lenzenweger et al., 2006; Levy et al., 2010; Meyhöfer et al., 2015; Siever, 1985]. Effect sizes in our study were large [Cohen, 1988, 1992], ranging from d = 0.56 to d = 0.80, although they were somewhat smaller than those reported in a meta‐analysis for schizophrenia patients (ranging from d = 0.70 to d = 0.87) [O'Driscoll and Callahan, 2008]. Importantly, SPEM deficits in this study cannot be explained solely by effects of sedation, as sustained attention performance did not differ between conditions and participants showed elevated scores on PSI scales. Higher target frequency was associated with impaired SPEM [Meyhöfer et al., 2015; Nagel et al., 2008], suggesting higher demands on the SPEM network [Haraldsson et al., 2008; Meyhöfer et al., 2015]. Frequency effects were more pronounced for ketamine than placebo for RMSE and saccadic frequency, which has also been reported for schizophrenia patients [Haraldsson et al., 2008].
On a brain functional level, in the placebo condition activity during SPEM compared to baseline was similar to the network described elsewhere [Dieterich et al., 2009; Lencer and Trillenberg, 2008; Meyhöfer et al., 2015; Petit et al., 1997]. Higher target frequency induced increased activity in areas that play a role in primary visual as well as motion processing and largely overlap with the networks observed in previous studies [Culham et al., 2001; Meyhöfer et al., 2015; Nagel et al., 2008].
Ketamine led to reduced activity when compared to placebo in core regions of the SPEM network. A dampening effect of ketamine has previously been reported at rest [De Simoni et al., 2013]. Regional‐specific decreases in activity during SPEM have been observed in schizophrenia patients, suggesting that here we successfully induced schizophrenia‐like alterations on the neural level [Hong et al., 2005; Keedy et al., 2006; Lencer et al., 2005; Nagel et al., 2012; Tregellas et al., 2004]. Specifically, activity in right and left areas V3a and V5 and right FEF was lower during ketamine than placebo. V3a, V5 and FEF play key roles in SPEM performance. V5 is sensitive to speed, acceleration and direction of moving stimuli [Lencer and Trillenberg, 2008]. V3a also plays a role in motion perception [Tootell et al., 1997]. The FEF generate the oculomotor command for SPEM and contribute to SPEM velocity as well as SPEM initiation and prediction [Lencer and Trillenberg, 2008].
It is important to mention that the literature concerning the role of FEF activity in schizophrenia spectrum is heterogeneous. While some studies have shown reduced FEF activity in schizophrenia patients [Hong et al., 2005; Keedy et al., 2006] as well as healthy relatives of schizophrenia patients with impaired velocity gain [O'Driscoll et al., 1999], some studies have not found decreased FEF activity in schizophrenia patients during SPEM [Lencer et al., 2011; Nagel et al., 2007]. In fact, FEF activity was found to be increased in patients compared to controls in SPEM with target blanking [Nagel et al., 2007]. This has been explained as a compensatory mechanism, with patients relying more strongly on FEFs for SPEM performance [Nagel et al., 2007].
We also found reduced activity under ketamine in the cerebellum. The cerebellum plays a role in SPEM initiation and maintenance via integration of information as part of a frontal‐thalamic‐cerebellar network. It has been proposed that abnormalities in this network may underlie schizophrenia‐related eye‐tracking deficits [Ross et al., 1998]. Our results support the proposition by Avila et al. that ketamine may lead to changes in cerebellar circuitry which in turn leads to SPEM deficits [Avila et al., 2002]. Relatedly, Joules et al. reported that ketamine globally altered cerebellar connectivity [Joules et al., 2015].
Additionally, ketamine led to reduced activity in regions of primary visual processing. Lower activity during SPEM in these areas has previously been reported for schizophrenia patients [Tregellas et al., 2004] and individuals with high schizotypy [Meyhöfer et al., 2015]. SPEM deficits in schizophrenia have been linked both to deficiency of motion detection and impaired visual perception [Nagel et al., 2012] and early visual processing has been shown to be impaired in schizophrenia [Butler and Javitt, 2005; Chen et al., 2004]. NMDA models of schizophrenia discuss early visual and auditory processing deficits as underlying causes for many of the higher order cognitive deficits seen in schizophrenia [Javitt et al., 2012].
In contrast to previous observations in patients, ketamine administration did not alter activity in the SEFs. This pattern thus differentiates our findings from evidence showing that schizophrenia patients have less activity during SPEM in this region [Keedy et al., 2006]. Similarly, we did not find an effect of ketamine on activity in the putamen, as has previously been described in schizophrenia literature [Nagel et al., 2012], although somewhat inconsistently [Tregellas et al., 2004], suggesting that the observed alterations in patients might not be directly associated with NMDA‐dysfunctions.
Similar to our findings, ketamine has previously been found to induce performance deficits together with decreased activity in task‐associated networks on working memory [Driesen et al., 2013] and self‐monitoring [Stone et al., 2011] tasks. However, some studies reported no performance deficit and no reduction of activity in task‐relevant areas but instead an increase in frontal brain activity during ketamine [Daumann et al., 2010; Fu et al., 2005; Honey et al., 2004, 2005; Nagels et al., 2011, 2012]. This increase in frontal brain activity has been hypothesized to represent a compensatory mechanism that maintains task performance in the context of disrupted NMDA‐functioning [Nagels et al., 2011].
It should be noted that, although we found that ketamine reduced brain activity in the SPEM network and impaired performance in the SPEM task, we did not find any significant correlations between velocity gain, saccadic frequency or RMSE difference between placebo and ketamine condition and the difference in BOLD signal change between ketamine and placebo condition. One possible explanation might be that FEFs and V5 are only a part of the network supporting SPEM and that other brain areas might also contribute to changes in behavioral measures of SPEM. Another possible factor might be that the relationship between the decrease in brain activity in FEF and V5 and the impairments in SPEM under the influence of ketamine might not be linear.
Interestingly, despite the pronounced effects of ketamine on performance and activity in task‐related areas, we did not find altered functional connectivity between V5/FEF and other regions. These results do not necessarily contrast with the global dysconnectivity under the influence of ketamine and in schizophrenia patients in the resting state [Frohlich and Van Horn, 2014; Grimm et al., 2015; Joules et al., 2015; Nejad et al., 2012], as we did not test for such a global alteration of functional connectivity. Connectivity differences between task conditions were previously reported under ketamine influence during a working memory task [Driesen et al., 2013], but have, to our knowledge, never before been examined for a SPEM task.
As anticipated, ketamine administration induced psychosis‐like symptoms on the delusional thinking, perceptual distortion and cognitive disorganization subscales of the PSI. These correspond to positive and cognitive disorganized symptoms of schizophrenia, which have been shown to be elevated during ketamine infusion in previous literature [Krystal et al., 1994; Lahti et al., 2001; Schmechtig et al., 2013]. Interestingly, these symptoms were more pronounced when the drug was administered first, perhaps due to an interaction of drug effects and stress due to unfamiliarity with the setting on the first assessment day. This interpretation is in line with reports of worsening of psychotic symptoms under stress [Castro et al., 2015]. We did not find elevated scores of the anhedonia subscale. Negative symptoms, such as anxiety and withdrawal, have previously been described under ketamine infusion [Krystal et al., 1994; Lahti et al., 2001; Malhotra et al., 1997; Schmechtig et al., 2013] but may be dose‐dependent, with one study [Pollak et al., 2015] finding elevated anhedonia scores with a target ketamine plasma concentration of 150 ng/mL but not for lower dose. It should also be noted that we did not assess the entire spectrum of negative symptoms and that participants were in a safe environment, monitored by physicians and psychologists, and knew what was causing their symptoms.
Finally, it is worth commenting that actual ketamine concentrations in plasma indicated that our manipulation was successful and a level close to our 100 ng/mL target concentration was achieved in all participants, with variance similar to that reported by others [Driesen et al., 2014; Krystal et al., 2005].
Limitations
A limitation of this work is that although ketamine is among the most selective NMDAR antagonists available for human studies [Driesen et al., 2013], it has secondary sites of action unrelated to NMDAR, including opioid receptors, cholinergic receptors and σ 1 and 2 receptors [Kohrs and Durieux, 1998]. It has been repeatedly shown, however, that the effects of ketamine are similar to those of more selective NMDAR antagonists used in animal studies [Anis et al., 1983; Moghaddam et al., 1997; Wood et al., 2012].
Another limitation is that the transiently induced symptoms by experimental ketamine applications are not able to induce the entire spectrum of schizophrenia symptoms and impairments. A key difference between the development of schizophrenia symptoms and the ketamine state model of schizophrenia may also be that during ketamine administration, participants are in a safe environment, monitored by physicians and psychologists, and know what is causing their symptoms. This may be of importance especially since interpretation and appraisal of early perceptual dysfunctions have been discussed as an important factor in the development of schizophrenia [Corlett et al., 2007; Nelson et al., 2014].
Also, it should be noted that we did not test for hallucinations specifically. Hallucinations are a key symptom of schizophrenia that has not consistently been reported following ketamine infusion [Krystal et al., 1994; Pomarol‐Clotet et al., 2006; Schmechtig et al., 2013]. Only chronic administration of PCP led to hallucinations in monkeys [Linn et al., 2007]. These findings suggest that hallucinations may be a secondary rather than a primary effect of NMDA hypofunction, which has been discussed to be at least partly caused by downregulation of cortical parvalbumin due to oxidative stress [Javitt et al., 2012].
Finally, a methodological limitation is that due to the technical challenges of MRI eye‐tracking, behavioral data could only be acquired for a subset of our sample. All reported fMRI results, however, still hold for this subset of participants. It is also important to note that we did not administer different doses of ketamine, so we cannot examine dose‐dependent effects. It might be of interest in the future to administer different dosages of ketamine, i.e., 100 ng/mL and 150 ng/mL and directly compare the effects of these dosages. A final limitation of our study is that we did not directly compare the behavioral and neural effect of ketamine to those of schizophrenia patients. Future research may benefit from such a direct comparison.
Conclusions
To conclude, we found subjective symptoms as well as SPEM deficits and task‐related BOLD response during ketamine compared to placebo similar to what has been reported in schizophrenia spectrum populations. These results provide further evidence for an involvement of the glutamatergic system, and more specifically the NMDAR, in the etiology and symptoms of schizophrenia. Overall, these findings confirm that ketamine is a useful pharmacological model of schizophrenia, especially when combined with SPEM. Further research may focus on expanding our understanding of the involvement of the NMDAR in schizophrenia, with a focus on developing drug treatments that target this system. For this, it may be interesting to directly compare schizophrenia patients and healthy controls under the influence of ketamine.
Supporting information
Supporting Information
ACKNOWLEDGMENTS
The authors thank Sam Hutton, Marcel Bartling and Peter Trautner for their excellent technical support. The authors thank Helen Röhrig and Inken Salhofen for their assistance in data collection and all volunteers who participated in the study.
REFERENCES
- Abi‐Saab WM, D'Souza DC, Moghaddam B, Krystal JH (1998): The NMDA antagonist model for schizophrenia: Promise and pitfalls. Pharmacopsychiatry 31:104–109. [DOI] [PubMed] [Google Scholar]
- Ackenheil, M. , Stoltz‐Ingenlath, G. , Dietz‐Bauer, R. , Vossen, A. , 1999. MINI Mini International Neuropsychiatric Interview, German Version 5.0. 0 DSM IV. Psychiatr. Univ; München, Ger. [Google Scholar]
- Anis NA, Berry SC, Burton NR, Lodge D (1983): The dissociative anaesthetics, ketamine and phencyclidine, selectively reduce excitation of central mammalian neurones by N‐methyl‐aspartate. Br J Pharmacol 79:565–575. [DOI] [PMC free article] [PubMed] [Google Scholar]
- Avila MT, Weiler MA, Lahti AC, Tamminga CA, Thaker GK (2002): Effects of ketamine on leading saccades during smooth‐pursuit eye movements may implicate cerebellar dysfunction in schizophrenia. Am J Psychiatry 159 1490–1496. [DOI] [PubMed] [Google Scholar]
- Brickenkamp, R. , 2002. Test d2 Aufmerksamkeits‐Belastungs‐Test.
- Buckley PF, Stahl SM (2007): Pharmacological treatment of negative symptoms of schizophrenia: Therapeutic opportunity or cul‐de‐sac? Acta Psychiatr Scand 115:93–100. [DOI] [PubMed] [Google Scholar]
- Butler PD, Javitt DC (2005): Early‐stage visual processing deficits in schizophrenia. Curr Opin Psychiatry 18:151–157. [DOI] [PMC free article] [PubMed] [Google Scholar]
- Castro MN, Villarreal MF, Bolotinsky N, Papávero E, Goldschmidt MG, Costanzo EY, Drucaroff L, Wainsztein A, de Achával D, Pahissa J, Bär KJ, Nemeroff CB, Guinjoan SM (2015): Brain activation induced by psychological stress in patients with schizophrenia. Schizophr Res 168:313–321. [DOI] [PubMed] [Google Scholar]
- Chavez‐Noriega LE, Schaffhauser H, Campbell UC (2002): Metabotropic glutamate receptors: Potential drug targets for the treatment of schizophrenia. Curr Drug Targets CNS Neurol Disord 1:261–281. [DOI] [PubMed] [Google Scholar]
- Chen Y, Levy DL, Sheremata S, Holzman PS (2004): Compromised late‐stage motion processing in schizophrenia. Biol Psychiatry 55:834–841. [DOI] [PubMed] [Google Scholar]
- Cohen J (1973): Eta‐squared and partial eta‐squared in fixed factor anova designs. Educ Psychol Meas 33:107–112. [Google Scholar]
- Cohen J (1988): Statistical Power Analysis for the Behavioural Sciences, 2nd ed New York: Academic Press. [Google Scholar]
- Cohen J (1992): A power primer. Psychol Bull 112:155–159. [DOI] [PubMed] [Google Scholar]
- Corlett PR, Honey GD, Fletcher PC (2007): From prediction error to psychosis: Ketamine as a pharmacological model of delusions. J Psychopharmacol 21:238–252. [DOI] [PubMed] [Google Scholar]
- Culham J, He S, Dukelow S, Verstraten F. a (2001): Visual motion and the human brain: What has neuroimaging told us? Acta Psychol (Amst) 107:69–94. [DOI] [PubMed] [Google Scholar]
- Daumann J, Wagner D, Heekeren K, Neukirch A, Thiel CM, Gouzoulis‐Mayfrank E (2010): Neuronal correlates of visual and auditory alertness in the DMT and ketamine model of psychosis. J Psychopharmacol 24:1515–1524. [DOI] [PubMed] [Google Scholar]
- De Simoni S, Schwarz AJ, O'Daly OG, Marquand AF, Brittain C, Gonzales C, Stephenson S, Williams SCR, Mehta MA (2013): Test‐retest reliability of the BOLD pharmacological MRI response to ketamine in healthy volunteers. Neuroimage 64:75–90. [DOI] [PubMed] [Google Scholar]
- Dieterich M, Müller‐Schunk S, Stephan T, Bense S, Seelos K, Yousry TA (2009): Functional magnetic resonance imaging activations of cortical eye fields during saccades, smooth pursuit, and optokinetic nystagmus, Ann N Y Acad Sci 282–292. [DOI] [PubMed] [Google Scholar]
- Domino EF, Zsigmond EK, Domino LE, Domino KE, Kothary SP, Domino SE (1982): Plasma levels of ketamine and two of its metabolites in surgical patients using a gas chromatographic mass fragmentographic assay. Anesth Analg 61:87–92. [PubMed] [Google Scholar]
- Doyle OM, De Simoni S, Schwarz a. J, Brittain C, O'Daly OG, Williams SCR, Mehta MA (2013): Quantifying the attenuation of the ketamine pharmacological magnetic resonance imaging response in humans: A validation using antipsychotic and glutamatergic agents. J. Pharmacol. Exp Ther 345:151–160. [DOI] [PubMed] [Google Scholar]
- Driesen NR, McCarthy G, Bhagwagar Z, Bloch MH, Calhoun VD, D'Souza DC, Gueorguieva R, He G, Leung HC, Ramani R, Anticevic A, Suckow RF, Morgan PT, Krystal JH (2013): The impact of NMDA receptor blockade on human working memory‐related prefrontal function and connectivity. Neuropsychopharmacology 38:2613–2622. [DOI] [PMC free article] [PubMed] [Google Scholar]
- Driesen NR, Ph D, Mccarthy G, Bhagwagar Z, Bloch M, Calhoun V, Souza DCD, He G, Ramachandran R, Raymond F, Anticevic A, Morgan PT, Krystal JH (2014): Relationship of Resting Brain Hyperconnectivity and Schizophrenia‐like Symptoms Produced by the NMDA receptor. Antagonist Ketamine Humans 18:1–16. [DOI] [PMC free article] [PubMed] [Google Scholar]
- Eickhoff SB, Stephan KE, Mohlberg H, Grefkes C, Fink GR, Amunts K, Zilles K (2005): A new SPM toolbox for combining probabilistic cytoarchitectonic maps and functional imaging data. Neuroimage 25:1325–1335. [DOI] [PubMed] [Google Scholar]
- Ettinger U, Kumari V, Crawford TJ, Corr PJ, Das M, Zachariah E, Hughes C, Sumich AL, Rabe‐Hesketh S, Sharma T (2004): Smooth pursuit and antisaccade eye movements in siblings discordant for schizophrenia. J Psychiatr Res 38:177–184. [DOI] [PubMed] [Google Scholar]
- Friston KJ, Holmes AP, Worsley KJ, Poline JP, Frith CD, Frackowiak RSJ (1994): Statistical parametric maps in functional imaging: A general linear approach. Hum Brain Mapp 2:189–210. [Google Scholar]
- Frohlich J, Van Horn JD (2014): Reviewing the ketamine model for schizophrenia. J Psychopharmacol 28:287–302. [DOI] [PMC free article] [PubMed] [Google Scholar]
- Fu CHY, Abel KM, Allin MPG, Gasston D, Costafreda SG, Suckling J, Williams SCR, McGuire PK (2005): Effects of ketamine on prefrontal and striatal regions in an overt verbal fluency task: A functional magnetic resonance imaging study. Psychopharmacology (Berl) 183:92–102. [DOI] [PubMed] [Google Scholar]
- Gooding DC, Miller MD, Kwapil TR (2000): Smooth pursuit eye tracking and visual fixation in psychosis‐prone individuals. Psychiatry Res 93:41–54. [DOI] [PubMed] [Google Scholar]
- Grimm O, Gass N, Weber‐Fahr W, Sartorius A, Schenker E, Spedding M, Risterucci C, Schweiger JI, Böhringer A, Zang Z, Tost H, Schwarz AJ, Meyer‐Lindenberg A (2015): Acute ketamine challenge increases resting state prefrontal‐hippocampal connectivity in both humans and rats. Psychopharmacology (Berl) 232:4231–4241. [DOI] [PubMed] [Google Scholar]
- Haraldsson HM, Ettinger U, Magnusdottir BB, Sigmundsson T, Sigurdsson E, Petursson H (2008): Eye movement deficits in schizophrenia. Eur Arch Psychiatry Clin Neurosci 258:373–383. [DOI] [PubMed] [Google Scholar]
- Holzman PS, Proctor LR, Hughes DW (1973): Eye‐tracking patterns in schizophrenia. Science 181:179–181. [DOI] [PubMed] [Google Scholar]
- Honey RAE, Honey GD, O'Loughlin C, Sharar SR, Kumaran D, Bullmore ET, Menon DK, Donovan T, Lupson VC, Bisbrown‐Chippendale R, Fletcher PC (2004): Acute ketamine administration alters the brain responses to executive demands in a verbal working memory task: An FMRI study. Neuropsychopharmacology 29:1203–1214. [DOI] [PMC free article] [PubMed] [Google Scholar]
- Honey GD, Honey RAE, O'Loughlin C, Sharar SR, Kumaran D, Suckling J, Menon DK, Sleator C, Bullmore ET, Fletcher PC (2005): Ketamine disrupts frontal and hippocampal contribution to encoding and retrieval of episodic memory: An fMRI study. Cereb Cortex 15:749–759. [DOI] [PMC free article] [PubMed] [Google Scholar]
- Hong LE, Tagamets M, Avila M, Wonodi I, Holcomb H, Thaker GK (2005): Specific motion processing pathway deficit during eye tracking in schizophrenia: A performance‐matched functional magnetic resonance imaging study. Biol Psychiatry 57:726–732. [DOI] [PubMed] [Google Scholar]
- Hutton S, Kennard C (1998): Oculomotor abnormalities in schizophrenia: A critical review. Neurology 50:604–609. [DOI] [PubMed] [Google Scholar]
- Javitt DC, Zukin SR, Heresco‐Levy U, Umbricht D (2012): Has an angel shown the way? Etiological and therapeutic implications of the PCP/NMDA model of schizophrenia. Schizophr Bull 38:958–966. [DOI] [PMC free article] [PubMed] [Google Scholar]
- Jennings JR (1987): Editorial Policy on Analyses of Variance With Repeated Measures. Psychophysiology 24:474–475. [DOI] [PubMed] [Google Scholar]
- Joules R, Doyle OM, Schwarz AJ, O'Daly OG, Brammer M, Williams SC, Mehta MA (2015): Ketamine induces a robust whole‐brain connectivity pattern that can be differentially modulated by drugs of different mechanism and clinical profile. Psychopharmacology (Berl) 232:4205–4218. [DOI] [PMC free article] [PubMed] [Google Scholar]
- Kantrowitz JT, Javitt DC (2010): Thinking glutamatergically: Changing concepts of schizophrenia based upon changing neurochemical models. Clin Schizophr Relat Psychoses [DOI] [PMC free article] [PubMed] [Google Scholar]
- Keedy SK, Ebens CL, Keshavan MS, Sweeney JA (2006): Functional magnetic resonance imaging studies of eye movements in first episode schizophrenia: Smooth pursuit, visually guided saccades and the oculomotor delayed response task. Psychiatry Res 146:199–211. [DOI] [PubMed] [Google Scholar]
- Klein C, Ettinger U (2008): A hundred years of eye movement research in psychiatry. Brain Cogn 68:215–218. [DOI] [PubMed] [Google Scholar]
- Kohrs R, Durieux ME (1998): Ketamine: Teaching an old drug new tricks. Anesth Analg 87:1186–1193. [DOI] [PubMed] [Google Scholar]
- Koychev I, Barkus E, Ettinger U, Killcross S, Roiser JP, Wilkinson L, Deakin B (2011): Evaluation of state and trait biomarkers in healthy volunteers for the development of novel drug treatments in schizophrenia. J Psychopharmacol 25:1207–1225. [DOI] [PubMed] [Google Scholar]
- Krystal JH, Karper LP, Seibyl JP, Freeman GK, Delaney R, Bremner JD, Heninger GR, Bowers MB, Charney DS (1994): Subanesthetic effects of the noncompetitive NMDA antagonist, ketamine, in humans. Psychotomimetic, perceptual, cognitive, and neuroendocrine responses. Arch Gen Psychiatry 51:199–214. [DOI] [PubMed] [Google Scholar]
- Krystal JH, D'Souza DC, Mathalon D, Perry E, Belger A, Hoffman R (2003): NMDA receptor antagonist effects, cortical glutamatergic function, and schizophrenia: Toward a paradigm shift in medication development. Psychopharmacology (Berl) 169:215–233. [DOI] [PubMed] [Google Scholar]
- Krystal JH, Perry EB, Gueorguieva R, Belger A, Madonick SH, Abi‐Dargham A, Cooper TB, Macdougall L, Abi‐Saab W, D'Souza DC (2005): Comparative and interactive human psychopharmacologic effects of ketamine and amphetamine: Implications for glutamatergic and dopaminergic model psychoses and cognitive function. Arch Gen Psychiatry 62:985–994. [DOI] [PubMed] [Google Scholar]
- Lahti AC, Weiler MA, Michaelidis T, Parwani A, Tamminga CA, Tamara Michaelidis B. a, Parwani A, Tamminga CA (2001): Effects of ketamine in normal and schizophrenic volunteers. Neuropsychopharmacology 25:455–467. [DOI] [PubMed] [Google Scholar]
- Lee KH, Williams LM, Loughland CM, Davidson DJ, Gordon E (2001): Syndromes of schizophrenia and smooth‐pursuit eye movement dysfunction. Psychiatry Res 101:11–21. [DOI] [PubMed] [Google Scholar]
- Lehrl, S. , 2005. Mehrfachwahl‐Wortschatz‐Intelligenztest: MWT‐B [Multiple Choice Vocabulary Test, version B].
- Leigh, R.J. , Zee, D.S. , 2006. The neurology of eye movements. New York: Oxford University Press, Inc. [Google Scholar]
- Lencer R, Keedy SK, Reilly JL, McDonough BE, Harris MSH, Sprenger A, Sweeney JA (2011): Altered transfer of visual motion information to parietal association cortex in untreated first‐episode psychosis: Implications for pursuit eye tracking. Psychiatry Res 194:30–38. [DOI] [PMC free article] [PubMed] [Google Scholar]
- Lencer R, Trillenberg P (2008): Neurophysiology and neuroanatomy of smooth pursuit in humans. Brain Cogn 68:219–228. [DOI] [PubMed] [Google Scholar]
- Lencer R, Malchow CP, Krecker K, Nolte A, Pinnow M, von Siefart SZ, Schwinger E, Arolt V (1999): Smooth pursuit performance in families with multiple occurrence of schizophrenia and nonpsychotic families. Biol Psychiatry 45:694–703. [DOI] [PubMed] [Google Scholar]
- Lencer R, Trillenberg‐Krecker K, Schwinger E, Arolt V (2003): Schizophrenia spectrum disorders and eye tracking dysfunction in singleton and multiplex schizophrenia families. Schizophr. Res 60:33–45. [DOI] [PubMed] [Google Scholar]
- Lencer R, Trillenberg P, Trillenberg‐Krecker K, Junghanns K, Kordon A, Broocks A, Hohagen F, Heide W, Arolt V (2004): Smooth pursuit deficits in schizophrenia, affective disorder and obsessive‐compulsive disorder. Psychol Med 34:451–460. [DOI] [PubMed] [Google Scholar]
- Lencer R, Nagel M, Sprenger A, Heide W, Binkofski F (2005): Reduced neuronal activity in the V5 complex underlies smooth‐pursuit deficit in schizophrenia: Evidence from an fMRI study. Neuroimage 24:1256–1259. [DOI] [PubMed] [Google Scholar]
- Lenzenweger MF, O'Driscoll GA, Driscoll GAO, Leone J, Scott L, Warner J (2006): Smooth pursuit eye movement and schizotypy in the community. J Abnorm Psychol 115:779–786. [DOI] [PubMed] [Google Scholar]
- Levy DL, Holzman PS, Matthysse S, Mendell NR (1993): Eye tracking dysfunction and schizophrenia: A critical perspective. Schizophr Bull 19:461–536. [DOI] [PubMed] [Google Scholar]
- Levy DL, Sereno AB, Gooding DC, O'Driscoll GA (2010): Eye tracking dysfunction in schizophrenia: Characterization and pathophysiology. Curr Top Behav Neurosci 4:311–347. [DOI] [PMC free article] [PubMed] [Google Scholar]
- Linn GS, O'Keeffe RT, Lifshitz K, Schroeder C, Javitt DC (2007): Behavioral effects of orally administered glycine in socially housed monkeys chronically treated with phencyclidine. Psychopharmacology (Berl) 192:27–38. [DOI] [PubMed] [Google Scholar]
- Malhotra AK, Pinals DA, Adler CM, Elman I, Clifton A, Pickar D, Breier A (1997): Ketamine‐induced exacerbation of psychotic symptoms and cognitive impairment in neuroleptic‐free schizophrenics. Neuropsychopharmacology 17:141–150. [DOI] [PubMed] [Google Scholar]
- Mason OJ, Morgan CJM, Stefanovic A, Curran HV (2008): The Psychotomimetic States Inventory (PSI): Measuring psychotic‐type experiences from ketamine and cannabis. Schizophr Res 103:138–142. [DOI] [PubMed] [Google Scholar]
- Meyhöfer I, Steffens M, Kasparbauer A, Grant P, Weber B, Ettinger U (2015): Neural mechanisms of smooth pursuit eye movements in schizotypy. Hum Brain Mapp 36:340–353. [DOI] [PMC free article] [PubMed] [Google Scholar]
- Moghaddam B, Adams B, Verma A, Daly D (1997): Activation of glutamatergic neurotransmission by ketamine: A novel step in the pathway from NMDA receptor blockade to dopaminergic and cognitive disruptions associated with the prefrontal cortex. J Neurosci 17:2921–2927. [DOI] [PMC free article] [PubMed] [Google Scholar]
- Murray RM, Paparelli A, Morrison PD, Marconi A, Di Forti M (2013): What can we learn about schizophrenia from studying the human model, drug‐induced psychosis? Am J Med Genet Part B Neuropsychiatr Genet 162:661–670. [DOI] [PubMed] [Google Scholar]
- Nagel M, Sprenger A, Nitschke M, Zapf S, Heide W, Binkofski F, Lencer R (2007): Different extraretinal neuronal mechanisms of smooth pursuit eye movements in schizophrenia: An fMRI study. Neuroimage 34:300–309. [DOI] [PubMed] [Google Scholar]
- Nagel M, Sprenger A, Hohagen F, Binkofski F, Lencer R (2008): Cortical mechanisms of retinal and extraretinal smooth pursuit eye movements to different target velocities. Neuroimage 41:483–492. [DOI] [PubMed] [Google Scholar]
- Nagel M, Sprenger A, Steinlechner S, Binkofski F, Lencer R (2012): Altered velocity processing in schizophrenia during pursuit eye tracking. PLoS One 7:1–8. [DOI] [PMC free article] [PubMed] [Google Scholar]
- Nagels A, Kirner‐Veselinovic A, Krach S, Kircher T (2011): Neural correlates of S‐ketamine induced psychosis during overt continuous verbal fluency. Neuroimage 54:1307–1314. [DOI] [PubMed] [Google Scholar]
- Nagels A, Kirner‐Veselinovic A, Wiese R, Paulus FM, Kircher T, Krach S (2012): Effects of ketamine‐induced psychopathological symptoms on continuous overt rhyme fluency. Eur Arch Clin Neurosci 262:403–414. [DOI] [PubMed] [Google Scholar]
- Nejad AB, Ebdrup BH, Glenthøj BY, Siebner HR (2012): Brain connectivity studies in schizophrenia: Unravelling the effects of antipsychotics. Curr Neuropharmacol 10:219–230. [DOI] [PMC free article] [PubMed] [Google Scholar]
- Nelson B, Whitford TJ, Lavoie S, Sass LA (2014): What are the neurocognitive correlates of basic self‐disturbance in schizophrenia?: Integrating phenomenology and neurocognition. Part 2 (Aberrant salience). Schizophr Res 152:20–27. [DOI] [PubMed] [Google Scholar]
- Niesters M, Khalili‐Mahani N, Martini C, Aarts L, van Gerven J, van Buchem MA, Dahan A, Rombouts S (2012): Effect of subanesthetic ketamine on intrinsic functional brain connectivity: A placebo‐controlled functional magnetic resonance imaging study in healthy male volunteers. Anesthesiology 117:868–877. [DOI] [PubMed] [Google Scholar]
- O'Driscoll GA, Benkelfat C, Florencio PS, Wolff ALLVG, Joober R, Lal S, Evans AC (1999): Neural correlates of eye tracking deficits in first‐degree relatives of schizophrenic patients. A positron emission tomography study. Arch Gen Psychiatry 56:1127. [DOI] [PubMed] [Google Scholar]
- O'Driscoll GA, Callahan BL (2008): Smooth pursuit in schizophrenia: A meta‐analytic review of research since 1993. Brain Cogn 68:359–370. [DOI] [PubMed] [Google Scholar]
- Petit L, Clark VP, Ingeholm J, Haxby JV (1997): Dissociation of saccade‐related and pursuit‐related activation in human frontal eye fields as revealed by fMRI. J Neurophysiol 77:3386–3390. [DOI] [PubMed] [Google Scholar]
- Poels EMP, Kegeles LS, Kantrowitz JT, Slifstein M, Javitt DC, Lieberman JA, Abi‐Dargham A, Girgis RR (2013): Imaging glutamate in schizophrenia: Review of findings and implications for drug discovery. Mol Psychiatry 19, 20–29. [DOI] [PubMed] [Google Scholar]
- Pollak TA, De Simoni S, Barimani B, Zelaya FO, Stone JM, Mehta MA (2015): Phenomenologically distinct psychotomimetic effects of ketamine are associated with cerebral blood flow changes in functionally relevant cerebral foci: A continuous arterial spin labelling study. Psychopharmacology (Berl) 232:4515–4524. [DOI] [PubMed] [Google Scholar]
- Pomarol‐Clotet E, Honey GD, Murray GK, Corlett PR, Absalom AR, Lee M, McKenna PJ, Bullmore ET, Fletcher PC (2006): Psychological effects of ketamine in healthy volunteers: Phenomenological study. Br J Psychiatry 189:173–179. [DOI] [PMC free article] [PubMed] [Google Scholar]
- Radant AD, Bowdle TA, Cowley DS, Kharasch ED, Roy‐Byrne PP (1998): Does ketamine‐mediated N‐methyl‐D‐aspartate receptor antagonism cause schizophrenia‐like oculomotor abnormalities? Neuropsychopharmacology 19:434–444. [DOI] [PubMed] [Google Scholar]
- Ross RG, Olincy A, Harris JG, Radant A, Adler LE, Freedman R (1998): Anticipatory saccades during smooth pursuit eye movements and familial transmission of schizophrenia. Biol Psychiatry 44:690–697. [DOI] [PubMed] [Google Scholar]
- Schmechtig A, Lees J, Perkins A, Altavilla A, Craig KJ, Dawson GR, William Deakin JF, Dourish CT, Evans LH, Koychev I, Weaver K, Smallman R, Walters J, Wilkinson LS, Morris R, Williams SCR, Ettinger U (2013): The effects of ketamine and risperidone on eye movement control in healthy volunteers. Transl Psychiatry 3:331–345. [DOI] [PMC free article] [PubMed] [Google Scholar]
- Siever LJ (1985): Biological markers in schizotypal personality disorder. Schizophr Bull 11:564–575. [DOI] [PubMed] [Google Scholar]
- Smyrnis N (2008): Metric issues in the study of eye movements in psychiatry. Brain Cogn 68:341–358. [DOI] [PubMed] [Google Scholar]
- Smyrnis N, Evdokimidis I, Mantas A, Kattoulas E, Stefanis NC, Constantinidis TS, Avramopoulos D, Stefanis CN (2007): Smooth pursuit eye movements in 1,087 men: Effects of schizotypy, anxiety, and depression. Exp Brain Res 179:397–408. [DOI] [PubMed] [Google Scholar]
- Steeds H, Carhart‐Harris RL, Stone JM (2015): Drug models of schizophrenia. Ther Adv Psychopharmacol 5:43–58. [DOI] [PMC free article] [PubMed] [Google Scholar]
- Stone JM (2011): Glutamatergic antipsychotic drugs: A new dawn in the treatment of schizophrenia? Ther Adv Psychopharmacol [DOI] [PMC free article] [PubMed] [Google Scholar]
- Stone JM, Abel KM, Allin MPG, van Haren N, Matsumoto K, McGuire PK, Fu CHY (2011): Ketamine‐induced disruption of verbal self‐monitoring linked to superior temporal activation. Pharmacopsychiatry 44:33–48. [DOI] [PubMed] [Google Scholar]
- Stone JM, Raffin M, Morrison P, McGuire PK (2010): Review: The biological basis of antipsychotic response in schizophrenia. J Psychopharmacol 24:953–964. [DOI] [PubMed] [Google Scholar]
- Sweeney J. a, Haas GL, Li S (1992): Neuropsychological and eye movement abnormalities in first‐episode and chronic schizophrenia. Schizophr Bull 18:283–293. [DOI] [PubMed] [Google Scholar]
- Tootell RB, Mendola JD, Hadjikhani NK, Ledden PJ, Liu AK, Reppas JB, Sereno MI, Dale AM (1997): Functional analysis of V3A and related areas in human visual cortex. J Neurosci 17:7060–7078. [DOI] [PMC free article] [PubMed] [Google Scholar]
- Tregellas JR, Tanabe JL, Miller DE, Ross RG, Olincy A, Freedman R (2004): Neurobiology of smooth pursuit eye movement deficits in schizophrenia: An fMRI study. Am J Psychiatry 161:315–321. [DOI] [PubMed] [Google Scholar]
- Wadehra S, Pruitt P, Murphy ER, Diwadkar VA (2013): Network dysfunction during associative learning in schizophrenia: Increased activation, but decreased connectivity: An fMRI study. Schizophr Res 148:38–49. [DOI] [PubMed] [Google Scholar]
- Weiler MA, Thaker GK, Lahti AC, Tamminga CA (2000): Ketamine effects on eye movements. Neuropsychopharmacology 23:645–653. [DOI] [PubMed] [Google Scholar]
- Wood J, Kim Y, Moghaddam B (2012): Disruption of prefrontal cortex large scale neuronal activity by different classes of psychotomimetic drugs. J Neurosci 32:3022–3031. [DOI] [PMC free article] [PubMed] [Google Scholar]
Associated Data
This section collects any data citations, data availability statements, or supplementary materials included in this article.
Supplementary Materials
Supporting Information