

Abstract
Studies have found non‐negligible differences in cortical thickness estimates across versions of software that are used for processing and quantifying MRI‐based cortical measurements, and issues have arisen regarding these differences, as obtained estimates could potentially affect the validity of the results. However, more critical for diagnostic classification than absolute thickness estimates across versions is the inter‐subject stability. We aimed to investigate the effect of change in software version on classification of older persons in groups of healthy, mild cognitive impairment and Alzheimer's Disease. Using MRI samples of 100 older normal controls, 100 with mild cognitive impairment and 100 Alzheimer's Disease patients obtained from the Alzheimer's Disease Neuroimaging Initiative database, we performed a standard reconstruction processing using the FreeSurfer image analysis suite versions 4.1.0, 4.5.0 and 5.1.0. Pair‐wise comparisons of cortical thickness between FreeSurfer versions revealed significant differences, ranging from 1.6% (4.1.0 vs. 4.5.0) to 5.8% (4.1.0 vs. 5.1.0) across the cortical mantle. However, change of version had very little effect on detectable differences in cortical thickness between diagnostic groups, and there were little differences in accuracy between versions when using entorhinal thickness for diagnostic classification. This lead us to conclude that differences in absolute thickness estimates across software versions in this case did not imply lacking validity, that classification results appeared reliable across software versions, and that classification results obtained in studies using different FreeSurfer versions can be reliably compared. Hum Brain Mapp 37:1831–1841, 2016. © 2016 Wiley Periodicals, Inc.
Keywords: cortical thickness, research validity, Alzheimer's disease, FreeSurfer
Abbreviations
- AD
Alzheimer's disease
- ADNI
Alzheimer's Disease Neuroimaging Initiative
- CDR
Clinical Dementia Rating
- FDA
Food and Drug Administration
- GE
General Electric
- GLM
General linear model
- MB
Memory Box
- MCI
Mild cognitive impairment
- MRI
Magnetic resonance imaging
- NC
Normal control
- NIA
National Institute on Aging
- NIBIB
National Institute of Biomedical Imaging and Bioengineering
- PET
Positron emission tomography
- ROI
Region of interest
INTRODUCTION
Alzheimer's disease (AD) is the most common cause of neurodegenerative dementia. The research criteria for the diagnosis were revised to integrate biomarkers of the underlying disease state, and to formalize different disease stages in the diagnosis criteria [Albert et al., 2011; Clifford R. Jack et al., 2011; McKhann et al., 2011; Sperling et al., 2011]. Neuroimaging biomarkers such as cortical thickness reveal a characteristic atrophy pattern in preclinical stages involving especially the medial temporal lobes, paralimbic and temporoparietal cortices [Sperling et al., 2011]. Individual transition points between the asymptomatic and symptomatic predementia phases and the onset of dementia are difficult to define, but knowledge of this continuum is crucial for clinical practice and research [Albert et al., 2011]. It is thus evident that neuroimaging has the potential to provide key support to the diagnostic process of AD, and the reliability and comparative sensitivity and specificity of classification based on MRI‐derived measures are hence critical.
In this study we investigated classification accuracy and sensitivity across three different versions of FreeSurfer measures. The FreeSurfer cortical thickness measurement process and morphometric procedures are validated and well demonstrated across various scanner types and scanning methods [Clarkson et al., 2011; Han et al., 2006; Jovicich et al., 2009; Pantazis et al., 2009; Rosas et al., 2002; Salat et al., 2004]. The continuous development of FreeSurfer implies that the results necessarily could differ between software versions, and its developers recommend not using multiple program versions when processing a data set. This issue was especially addressed by Gronenschild et al. in a recent study in which they tested the reliability of FreeSurfer across software versions, workstation types and operative systems [Gronenschild et al., 2012], finding significant differences in measurements of anatomical volume [on average 8.8 ± 6.6% (range 1.3‐64.0%)) and cortical thickness (on average 2.8 ± 1.3% (range 1.1–7.7%)] when processing the same sets of data under various conditions. This study received much attention, and sparked a discussion in the neuroimaging community [Groneneschild, 2012; Neuroskeptic, 2012].
These results are not surprising ‐ as newer software versions are developed, it is reasonable to expect that absolute measurements will differ somewhat. However, it has not been tested if and how differences in estimated thickness and volume will affect classification of patients. At least from a research perspective, differences in absolute thickness or volume between two software versions will be of less importance if the classification accuracy is stable or improved. Thus, whether the same participant is classified as patient or control across software versions is more critical than whether the absolute thickness of a given region of interest (ROI) deviates.
The objective of this study was to investigate the effect of different FreeSurfer versions on classification of older participants into groups of normal controls (NC), mild cognitive impairment (MCI) and AD. We measured cortical thickness with FreeSurfer versions 4.1.0 (FS41), 4.5.0 (FS45) and 5.1.0 (FS51). We also tested the effect of software version on cortical thickness, and, more crucially, tested how change of software version affected the classification of participants with MCI and AD from NC. For the classification analyses, entorhinal cortex was chosen as ROI, because thickness reductions are most prominent early in the disease in this cortical region [Du et al., 2001; Fjell et al., 2010; van Hoesen et al., 1991]. 300 sample participants that either were NC (n = 100), or had been given the clinical diagnosis AD (n = 100) or MCI (n = 100) were selected (the first 100 available of each diagnosis group were chosen) from the Alzheimer's Disease Neuroimaging Initiative (ADNI) database. Based on previous studies, we hypothesized that: (1) absolute cortical thickness differences would be found across versions, but (2) classification accuracy would differ less.
MATERIALS AND METHODS
Sample
The sample was drawn from the ADNI database (http://adni.loni.usc.edu). The ADNI was launched in 2003 by the National Institute on Aging (NIA), the National Institute of Biomedical Imaging and Bioengineering (NIBIB), the Food and Drug Administration (FDA), private pharmaceutical companies and non‐profit organizations, as a $60 million, 5‐year public‐private partnership. The primary goal of ADNI has been to test whether serial magnetic resonance imaging (MRI), positron emission tomography (PET), other biological markers, and clinical and neuropsychological assessment can be combined to measure the progression of MCI and early AD. Determination of sensitive and specific markers of very early AD progression is intended to aid researchers and clinicians to develop new treatments and monitor their effectiveness, as well as lessen the time and cost of clinical trials. The Principal Investigator of this initiative is Michael W. Weiner, MD, VA Medical Center and University of California – San Francisco. ADNI is the result of efforts of many co‐investigators from a broad range of academic institutions and private corporations, and participants have been recruited from over 50 sites across the U.S. and Canada. The initial goal of ADNI was to recruit 800 adults, ages 55–90, to participate in the research, approximately 200 cognitively normal older individuals to be followed for 3 years, 400 people with MCI to be followed for 3 years and 200 people with early AD to be followed for 2 years. For up‐to‐date information, see http://www.adni-info.org.
The screening process is described in depth in the procedures manuals (ADNI). Prior to scanning, the participants underwent cognitive and global, functional and behavioral assessments. Demographic information was collected, physical and neurological examinations were carried through, patient medical history was recorded, and a baseline diagnosis and symptoms checklist was completed. Based on these assessments, the participants were categorized as having AD, MCI, or being NC. Inclusion criteria for AD were: verified memory complaint by participant or participants partner, below education adjusted cut‐off scores on the Logical Memroy II subcscale (Delayed Paragraph Recall) from the Wechsler Memory Scale, Mini‐Mental State Exam (MMSE) scores between 20 and 26 (inclusive), Clinical Dementia Rating (CDR) = 0.5, Memory Box (MB) score = 1.0 and meeting the NINCDS‐ADRDA criteria for probable AD. In addition to memory complaint and low Logical Memory II scores as in AD, inclusion criteria for MCI were: MMSE scores between 24 and 30 (inclusive), CDR = 0.5, MB score = 0.5 and preservation of general cognition and functional performance as to not meet the criteria for probable AD. The inclusion criteria for NC were: no age‐abnormal memory complaints, normal Logical Memory II scores, MMSE scores between 24 and 30, CDR = 0, MB score = 0 and normal cognitive function.
We selected 100 participants (chronologically by participant ID) from each category, and MRI scans from the screening visit (timepoint 1) were analyzed using FreeSurfer software. In an effort to minimize manual intervention, new participants were chosen to replace those that failed to complete the processing pipeline (described below), to yield a final sample of 100 in each classification group. Table 1 shows the distribution of age and sex of the three groups.
Table 1.
Age (minimum, maximum, mean and standard deviation (sd)) and sex of participants in the study
| Age | Sex | ||||
|---|---|---|---|---|---|
| Min | Max | Mean (sd) | Male | Female | |
| AD | 57 | 91 | 75.3 (7.3) | 51 | 49 |
| MCI | 56 | 89 | 75.2 (7.7) | 67 | 33 |
| NC | 60 | 90 | 76.1 (5.5) | 58 | 42 |
MRI Acquisition and Processing
T1‐weighted MRI scans were acquired according to ADNI protocol [Jack et al., 2008], using either a General Electric (GE) Healthcare, Philips Medical Systems or Siemens Medical Solutions scanner to collect two identical MPRAGE scans for each participant. These scans were controlled for quality (structural abnormalities, motion, noise and intensity homogeneity) and graded, where the best scan was chosen for further processing. Subsequently, the images underwent the following pre‐processing steps: correction of image geometry distortion (gradwarp), B1 correction of image intensity non‐uniformity, and reduction of image intensity non‐uniformity (N3). The images were also associated with phantom‐based scaling measures in order to account for scanner calibration differences between the different acquisition sites [Jack et al., 2008]. In this study we only used images acquired at 1.5 T, and the raw images were downloaded from the LONI Image Data Archive (https://ida.loni.usc.edu/) and transferred to Linux workstations for processing and analysis at the Neuroimaging Analysis Lab, Research Group for Lifespan Changes of Brain and Cognition, Department of Psychology, University of Oslo.
All processing was performed on workstations (Linux 2.6.18‐348.6.1.el5 x86_64) at the Neuroimaging Analysis Lab, utilizing computing resources from the titan grid operated by the Research Computing Services Group at USIT, University of Oslo. We used the FreeSurfer image analysis suite, which is well documented and freely available for download at http://surfer.nmr.mgh.harvard.edu/. The standard processing pipeline begins with registration of the volume to the Talairach atlas, and a B1 bias field is estimated. Then an automated Talairach transformation and correction of motion and intensity variations of the T1‐weighted image is performed, creating a normalized, high‐resolution intensity image [Dale et al., 1999]. A hybrid watershed/surface deformation procedure (skull‐stripping) is then performed to remove extra‐cerebral tissue [Ségonne et al., 2004], followed by a segmentation of the subcortical white matter and deep gray matter structures that also locates the boundary between the gray and white matter (white matter surface) [Fischl et al., 2002]. A model of the pial surface (gray matter surface) is also generated, enabling measurements of cortical thickness to be calculated from the distance between the gray and white matter surfaces [Fischl & Dale, 2000]. This procedure for measuring cortical thickness has been validated against histological [Rosas et al., 2002] and manual [Salat et al., 2004] measurements, and the reliability of the FreeSurfer morphometric procedures is well demonstrated across scanner manufacturers, scanner upgrades, field strengths and MRI acquisition sequences [Han et al., 2006; Jovicich et al., 2009].
Using a training atlas, the cortical and subcortical regions are labeled on the individual preprocessed scans, and the labels are then mapped into a common space, thus enabling point‐to‐point correspondence between all participants [Fischl et al., 2002; Fischl et al., 2004; Rosas et al., 2002; Ségonne et al., 2004]. Entorhinal cortex labels were generated for each participant onto a template entorhinal label, thus enabling the extraction of thickness measures for further interaction analysis.
Each participant was processed three times, once with each of the FreeSurfer versions 4.1.0 (FS41), 4.5.0 (FS45) and 5.1.0 (FS51), and measurements of cortical thickness at each vertex on the cortical mantle as well as entorhinal cortical volume and thickness were extracted for both hemispheres.
To ensure no impact from user intervention, no manual editing was performed. However, in 11 AD, 4 MCI and 5 NC cases for FS41, and 11 AD, 4 MCI and 9 NC cases for FS45, the processing did not complete due to various reasons such as failure of the Talairach QA check, segmentation fault or error in surface validation. In these cases, the participant was replaced by another participant throughout all software versions. The lack of failure occurrences in FS51 is due to major upgrades, in the release of FS50, of underlying functions in the volume and surface based streams, and the inclusion of new features to help improve the accuracy and stability of the processing pipeline. This procedure of replacing participants was chosen to eliminate the effect of operator and manual intervention on the results.
Statistical Analyses
Statistical analyses were carried out using built‐in FreeSurfer functions, SPSS Statistics 20 (IBM Corp., Armonk, NY), the statistical environment R (R Foundation for Statistical Computing, Vienna, Austria) and MATLAB 7.14.0 (R2012a) (Mathworks Inc, Natick, MA). We obtained the following detailed measures of percent difference in cortical thickness between versions (tvA= thickness of FreeSurfer version A, tvB = thickness of FreeSurfer version B): subject‐wise percentage difference (swpd) = (100* ([tvA ‐ tvB]/tvA) and absolute percentage differences which was defined as the square root (sqrt) of swpd = (sqrt(swpd2)). The mean values were then displayed as an overlay on a semi‐inflated average brain for visualization. To allow inspection of the full range of differences between versions, we did not threshold these first maps to show only the vertices with significant differences in thickness. Next, general linear model (GLM) analyses were conducted to test whether FreeSurfer version (FS41, FS45, FS51) affected the diagnostic group‐wise comparison (AD vs. MCI, AD vs. NC, MCI vs. NC), i.e., whether the same vertices would show group differences across FreeSurfer versions. Further, to test whether the effects of FreeSurfer version on cortical thickness were different for the various diagnostic group comparisons, GLMs of the interaction between diagnostic group and FreeSurfer version were conducted on a per vertex basis, with version comparison and diagnostic group comparison as group variables. The results were thresholded according to a conventional criterion for multiple comparison corrections (false discovery rate [FDR] < 0.05) [Genovese et al., 2002]. Employing a custom made MATLAB routine, the thresholded statistical maps were used to compute amount of explained variance in cortical thickness by each group comparison for each FreeSurfer version.
Entorhinal thickness was chosen for region‐of‐interest (ROI) based analyses. Pearson product‐moment correlations were performed in SPSS for entorhinal thickness for different FreeSurfer versions, in order to estimate degree of overlap. Lastly, a test for classification for diagnostic group based on thickness and volume values of entorhinal cortex was carried out using logistic regression.
Finally, for each FreeSurfer version, a vertex‐wise power analysis for unpaired t‐test (P = 0.05, power = 0.80) was performed in R using the package pwr to find the number of subjects (N) necessary in each group to detect group differences. The per‐vertex N was projected onto a surface for each hemisphere in MATLAB, and displayed on a semi‐inflated brain.
RESULTS
Effect of Software Version on Relative and Absolute Cortical Thickness
Pair‐wise comparisons of percentage differences in cortical thickness between FreeSurfer versions were carried out. A summary of the mean and standard deviation of the percentage difference in each comparison is given in Table 2. For the full sample, mean (standard deviation) differences between versions were consistently negative when comparing older versions to newer, with differences ranging from −0.12 (1.17) to −2.11 (10.02). The differences between FS41 vs. FS45 were consistently smaller in order of magnitude than the differences between versions FS41 vs. FS51 and FS45 vs. FS51. Surface plots of percent differences vertex wise across the cortical mantle are presented in Figure 1a. For a few regions, especially in the cingulate, occipital lobe and the lateral and medial temporal cortex, thickness increased from older to newer version, while thickness in most other regions decreased. An overall tendency was found for differences between FreeSurfer versions to be equal in direction across diagnostic groups.
Table 2.
Mean and standard deviation (sd) of percentage difference, and absolute (abs) percentage difference in thickness between FreeSurfer versions 4.1.0, 4.5.0 and 5.1.0 on left (lh) and right (rh) hemispheres
| % Difference | AD | MCI | Controls | Full sample | ||||
|---|---|---|---|---|---|---|---|---|
| lh | rh | lh | rh | lh | rh | lh | rh | |
| 41 vs. 45 | −0.21 (1.35) | −0.12 (1.17) | −0.20 (1.54) | −0.40 (2.57) | −0.29 (2.202) | −0.15 (0.67) | −0.23 (1.65) | −0.22 (1.41) |
| 41 vs. 51 | −1.92 (8.56) | −2.11 (10.01) | −1.51 (7.86) | −1.92 (9.75) | −1.07 (7.33) | −1.12 (8.42) | −1.50 (7.84) | −1.72 (9.31) |
| 45 vs. 51 | −1.90 (7.92) | −2.07 (8.61) | −1.69 (9.25) | −1.78 (9.50) | −0.97 (6.52) | −1.09 (8.35) | −1.52 (7.74) | −1.65 (8.74) |
| 41 vs. 45 | 1.75 (4.22) | 1.71 (4.08) | 1.61 (4.19) | 1.64 (4.81) | 1.67 (4.52) | 1.45 (3.00) | 1.68 (4.30) | 1.60 (3.91) |
| 41 vs. 51 | 5.85 (9.78) | 6.13 (11.26) | 5.66 (9.18) | 5.93 (11.40) | 5.47 (9.28) | 5.45 (9.98) | 5.66 (9.36) | 5.84 (10.83) |
| 45 vs. 51 | 5.83 (9.09) | 6.03 (9.67) | 5.84 (10.70) | 5.91 (11.25) | 5.38 (8.44) | 5.45 (9.80) | 5.68 (9.29) | 5.79 (10.19) |
Figure 1.
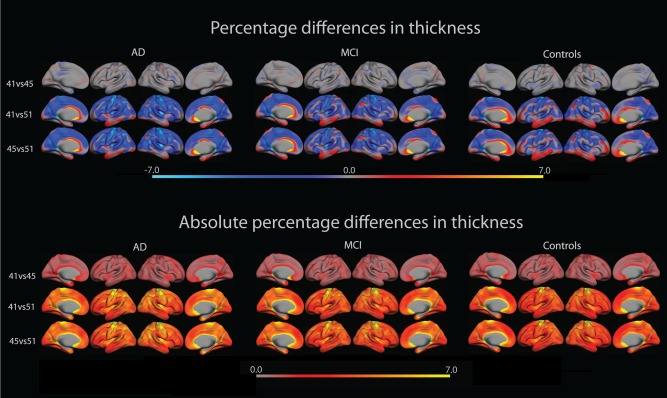
The upper row shows percentage difference in cortical thickness between FreeSurfer versions 4.1.0, 4.5.0 and 5.1.0 overlaid on lateral and medial views of the left and right hemisphere of an average brain (fsaverage). The bottom row shows absolute percentage difference of the same as above. [Color figure can be viewed in the online issue, which is available at http://wileyonlinelibrary.com.]
To further investigate the magnitude of the differences, the absolute percentage difference in cortical thickness was calculated. The overall mean and standard deviation values can be found in Table 2, where differences range from 1.45 (3.00) to 6.03 (9.67). The overlays in Figure 1b revealed a trend for the difference in certain regions to be consistently larger than in other regions, notably the medial temporal lobe, inferior parietal lobule and the precentral gyrus. These magnitudes echo the small differences between FS41 vs. FS45, and the somewhat larger differences between FS41 vs. FS51 and FS45 vs. FS51.
Effect of Diagnostic Group on Cortical Thickness across FreeSurfer Versions
An important question is whether group differences in cortical thickness were stable across FreeSurfer versions. GLMs were used to test for differences in cortical thickness pair‐wise between groups for each FreeSurfer version. The results were thresholded according to FDR < 0.05, and amount of variance in cortical thickness explained by diagnostic group was calculated. As seen in Figure 2 the effects of diagnostic group are almost identical across FreeSurfer versions ‐ the same areas are sensitive across versions.
Figure 2.
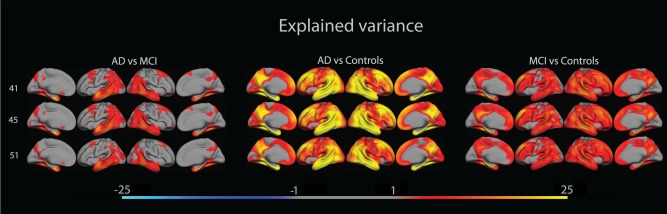
The figure shows amount of variance in cortical thickness that is explained by patient group, overlaid on lateral and medial views of the left and right hemisphere of an average brain (fsaverage). [Color figure can be viewed in the online issue, which is available at http://wileyonlinelibrary.com.]
Interactions between FreeSurfer Versions and Diagnostic Group
Formal tests of interactions between FreeSurfer versions and diagnostic group were then performed to reveal whether any of the plots were significantly different across FreeSurfer versions. A GLM analysis was performed to test the effect of diagnostic group on absolute percentage differences between versions. As seen in Figure 3, significant interaction effects of FreeSurfer versions × AD vs. MCI were found in the anterior parts of the superior frontal lobe in the lateral right hemisphere when changing between FS41 and FS45, and between FS41 and FS51, while interaction effects were found in the insula in the lateral right hemisphere when changing between FS41 and FS51, and between FS45 and FS51. Scattered interaction effects were found between AD and NC in lateral and medial parts of both hemispheres. Here, the supramarginal and middle frontal gyri, medial temporal pole, insula and superior frontal lobe showed significant effects when changing between FS41 and FS51, and between FS45 and FS51. Effects were only seen in the medial temporal and frontal poles, and the middle frontal gyrus when changing between FS41 and FS45. Few areas showed interaction effects between MCI and NC, where the only significant effects were found on the lateral superior frontal cortex when changing between FS41 and FS51. In all comparisons, interactions were negative when going from older to newer versions, i.e., sensitivity increases with version.
Figure 3.
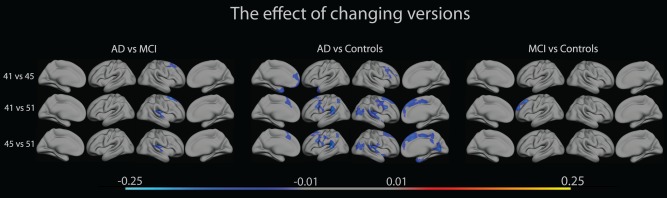
The figure shows interactions between diagnostic group (AD, MCI, NC), and absolute percentage differences between FreeSurfer versions 4.1.0, 4.5.0 and 5.1.0, overlaid on lateral and medial views of the left and right hemisphere of an average brain (fsaverage). [Color figure can be viewed in the online issue, which is available at http://wileyonlinelibrary.com.]
Region of Interest Analyses
The relationships between entorhinal cortex thickness for different FreeSurfer versions were tested with Pearson correlations, finding in all cases Pearson's correlation coefficient, r >= 0.96 (Left hemisphere: FS41vsFS45 r = 0.99, FS41vsFS51 r = 0.96, FS45vsFS51 r = 0.96, right hemisphere: FS41vsFS45 r = 0.99, FS41vsFS51 r = 0.96, FS45vsFS51 r = 0.96). In all cases, the P‐value P < 0.05. For individual data points, see scatterplots in Figure 4.
Figure 4.
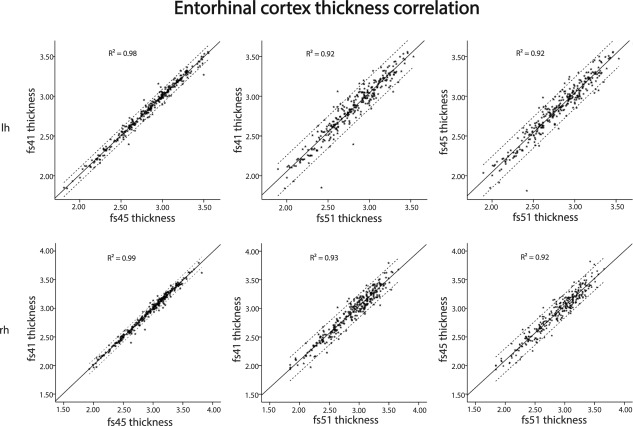
The figure shows correlation (95% confidence intervals) of values of entorhinal thickness between FreeSurfer versions 4.1.0, 4.5.0 and 5.1.0, overlaid on lateral and medial views of the left and right hemisphere of an average brain (fsaverage).
Classification of AD, MCI And NC
A test for diagnostic classification accuracy was performed based on values of entorhinal thickness, comparing diagnosis groups pair‐wise by logistic regression analysis with two diagnostic groups as dependent and entorhinal cortical thickness (mean of left and right hemisphere) as predictor. The results are summarized in Table 3. For NC vs. AD, overall classification accuracy was 86.5% (FS41), 86.0% (FS45) and 84.0% (FS51), for NC vs. MCI 65.5% (FS41), 64.5% (FS45) and 67.0% (FS51), and for MCI vs. AD, 69.5% (FS41), 71.5% (FS45) and 68.5% (FS51). Very few participants changed diagnostic status as a result of change in FreeSurfer version. Table 4 shows an overview of the amount of participants that change diagnostic status.
Table 3.
Classifications of AD vs. MCI, AD vs. NC and MCI vs. NC based on left and right entorhinal thickness
| Predicted | ||||||||||||
| Observed | FS41 | % | FS45 | % | FS51 | % | ||||||
| Status | Correct | Status | Correct | Status | Correct | |||||||
| AD | MCI | AD | MCI | AD | MCI | |||||||
| AD | 70 | 30 | 70 | AD | 73 | 27 | 73 | AD | 71 | 29 | 71 | |
| MCI | 31 | 69 | 69 | MCI | 30 | 70 | 70 | MCI | 34 | 66 | 66 | |
| Overall percentage: | 69,5 | Overall percentage: | 71,5 | Overall percentage: | 68,5 | |||||||
| Predicted | ||||||||||||
| Observed | FS41 | % | FS45 | % | FS51 | % | ||||||
| Status | Correct | Status | Correct | Status | Correct | |||||||
| AD | NC | AD | NC | AD | NC | |||||||
| AD | 82 | 18 | 82 | AD | 83 | 17 | 83 | AD | 81 | 19 | 81 | |
| NC | 9 | 91 | 91 | NC | 11 | 89 | 89 | NC | 13 | 87 | 87 | |
| Overall percentage: | 86,5 | Overall percentage: | 86,0 | Overall percentage: | 84,0 | |||||||
| Predicted | ||||||||||||
| Observed | FS41 | % | FS45 | % | FS51 | % | ||||||
| Status | Correct | Status | Correct | Status | Correct | |||||||
| MCI | NC | MCI | NC | MCI | NC | |||||||
| MCI | 61 | 39 | 61 | MCI | 60 | 40 | 60 | MCI | 60 | 40 | 60 | |
| NC | 30 | 70 | 70 | NC | 31 | 69 | 69 | NC | 26 | 74 | 74 | |
| Overall percentage: | 65,5 | Overall percentage: | 64,5 | Overall percentage: | 67,0 | |||||||
Table 4.
Converters between classification groups. Amount of participants that were incorrectly classified
| FS version | AD to MCI | MCI to AD | AD to NC | NC to AD | MCI to NC | NC to MCI |
|---|---|---|---|---|---|---|
| 41 | 28 | 33 | 18 | 11 | 35 | 29 |
| 45 | 29 | 33 | 17 | 11 | 37 | 30 |
| 51 | 33 | 38 | 16 | 11 | 38 | 24 |
Power Analysis
A vertex‐wise power analysis for unpaired t‐test (P = 0.05, power = 0.80) was performed. The overlays in Figure 5 illustrate, for each FreeSurfer version, the number of subjects (N) in each group needed to detect differences between groups. As the figure shows, fewer subjects are needed to detect differences in areas typical for AD, like the medial temporal lobe, and also, as could be expected, fewer subjects are needed to detect differences between AD and NC than between AD and MCI.
Figure 5.
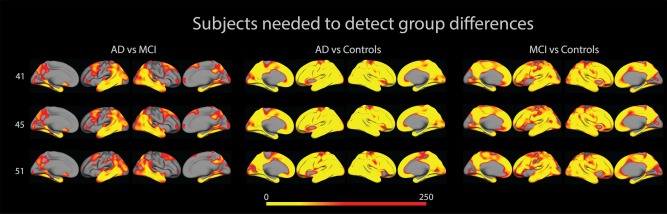
The figure shows number of subjects needed (in each diagnostic group) to detect differences between groups. [Color figure can be viewed in the online issue, which is available at http://wileyonlinelibrary.com.]
For areas in which N > 250, N has been set to 0. We examined ranges of N for entorhinal cortex, and found them to lie between 6 and 105. The ranges are summarized in Table 5.
Table 5.
Number of subjects (min and max values in entorhinal cortex) needed in each diagnostic group to detect differences.
| 41 | 45 | 51 | ||||
|---|---|---|---|---|---|---|
| lh | rh | lh | rh | lh | rh | |
| ADvsMCI | 24–57 | 31–62 | 25–69 | 30–105 | 25–70 | 24–53 |
| ADvsNC | 11–15 | 7–12 | 7–17 | 8–14 | 6–20 | 7–13 |
| MCIvsNC | 20–54 | 25–42 | 22–60 | 37–47 | 20–59 | 28–54 |
DISCUSSION
In this study we found absolute and relative differences in cortical thickness as a function of FreeSurfer version, comparable to those reported previously. Correlations between thicknesses from different FreeSurfer versions were very high. Further, effects of MCI and AD on cortical thickness were practically identical across versions, and classification accuracy was stable. The results are discussed below.
Effects of Software Version on Cortical Thickness
The differences in absolute thickness we found are comparable to Gronenschild et al. [Gronenschild et al., 2012] who found differences in percentage absolute cortical thickness between versions FS41 and FS50. Similarly to us, they found absolute thickness values in a range between 1.2% and 7.7%, with the lowest differences around the transverse temporal gyrus. In sum, our data confirm previous knowledge that change of FreeSurfer version has a non‐negligible effect on cortical thickness estimates, and for that reason it is important to ensure that all data within a study are processed with the same version.
Effect of Version on Explained Variance across Diagnostic Groups
Although FreeSurfer version had effects on cortical thickness, diagnostic group differences were found to be stable across FreeSurfer versions. For all group contrasts, large areas of significant differences in cortical thickness were observed for all FreeSurfer versions. Both in terms of statistical significance, effect size, as well as regional distribution, the group differences appeared very similar across software version, i.e., the same cortical areas proved to be sensitive regardless of which FreeSurfer version was used for group comparisons. In particular, for all group contrasts and FreeSurfer versions, the temporal and parietal lobes, temporal pole and fusiform gyrus showed the largest effect sizes, exceeding 25% explained variance in NC vs. AD comparisons. Thus, change of FreeSurfer version did not lead to substantial differences in the ability to detect group differences. Formal statistical tests of the effect of change in software version on the sensitivity to detect group differences showed very few changes across versions for the AD vs. MCI, and the NC vs. MCI comparisons, and none in the typical AD‐areas, as shown in Figure 3. For the NC vs. AD comparison, where the group differences were largest to begin with, there were scattered areas of different sensitivity across versions, mainly for the FS41 vs. FS51 and the FS45 vs. FS51 comparisons. However, it must be noted that these differences were identified on top of very robust main effects of group for these analyses. For the group contrasts with more moderate effects, FreeSurfer version yielded comparable sensitivity. Thus, even though there were absolute thickness estimation differences across the tested versions, these differences do not to a substantial degree translate into differences in classification accuracy. These findings are similar to those of Dickerson et al. who found that associations between verbal memory performance and cortical thickness in certain ROIs show, both spatial and in magnitude, a reliability across different scan platforms and field strengths [Dickerson et al., 2008].
Correlations for Entorhinal Cortical Thickness
Overall very strong correlations were found between thickness measures of entorhinal cortex across FreeSurfer versions, with r > 0.96 for all comparisons. This reveals a consistency in cortical measurements of a participant relative to group across software versions, where very few participants were measured to have a relatively large entorhinal cortical thickness in one version and a relatively small entorhinal cortical thickness in another version, and vice versa. Thus, even though differences in absolute thickness were observed across versions, the rank‐order of the participants was very robust. This clearly shows that there is not bias between versions in entorhinal thickness estimations, and as long as the same version is used consistently throughout a study, one can expect replicable results.
Classification Accuracy
Finally, an important application of morphometric techniques is in aiding classification of different clinical groups, e.g. in early detection of MCI/AD. Therefore, we wanted to test to what degree changing between software versions would yield inconsistent diagnostic classification of individual participants across the NC, MCI and AD categories. As would be expected due to the largest morphological differences, classifications were most accurate when comparing AD with NC for all versions of FS, and accuracies decreased in the comparisons between AD and MCI, and MCI and NC. Within all diagnostic group comparisons, little difference was found between FreeSurfer versions. Thus, when it comes to classification, results obtained by different software versions can be reliably compared. The final power analyses revealed that, for all group comparisons, using N = 100 was sufficient to detect differences. Classification accuracy can be improved by the addition of multidimensional MRI images (T2, ADC, DCE), but it is yet unknown to what degree processing on different FreeSurfer versions would affect these measures. This could be a worthwhile topic of interest for future studies.
CONCLUSION
Our results confirmed that changing FreeSurfer versions might lead to non‐negligible differences in cortical thickness estimate. The continuation of the best practice of not interchanging software versions in studies that rely on presenting such measures is therefore further advised. However, we also showed that when using FreeSurfer for classification, little difference is found when comparing results obtained by different versions, which leads us to conclude that one may reliably compare results obtained in studies where different software versions have been used. This is promising with regard to the validity of this approach in studies of degenerative conditions.
ACKNOWLEDGMENTS
The Canadian Institutes of Health Research provides funds to support Canadian ADNI clinical sites, and private sector contributions are facilitated by the Foundation for the National Institutes of Health (http://www.fnih.org). The grantee organization is the Northern California Institute for Research and Education, and the study coordinator is the Alzheimer's Disease Cooperative Study at the University of California, San Diego. ADNI data are distributed by the Laboratory for Neuro Imaging at the University of California, Los Angeles.
Data used in preparation of this article were obtained from the Alzheimer's Disease Neuroimaging Initiative (ADNI) database (http://adni.loni.ucla.edu). As such, the investigators within the ADNI contributed to the design and implementation of ADNI and/or provided data but did not participate in analysis or writing of the report. A complete listing of ADNI investigators can be found at: http://adni.loni.ucla.edu/wp-content/uploads/how_to_apply/ADNI_Acknowledgement_List.pdf
REFERENCES
- ADNI . ADNI I General Procedures Manual.
- Albert MS, DeKosky ST, Dickson D, Dubois B, Feldman HH, Fox NC, Phelps CH (2011): The diagnosis of mild cognitive impairment due to Alzheimer's disease: Recommendations from the National Institute on Aging‐Alzheimer's Association workgroups on diagnostic guidelines for Alzheimer's disease. Alzheimer's & Dementia 7:270–279. [DOI] [PMC free article] [PubMed] [Google Scholar]
- Clarkson MJ, Cardoso MJ, Ridgway GR, Modat M, Leung KK, Rohrer JD, Ourselin S (2011): A comparison of voxel and surface based cortical thickness estimation methods. NeuroImage 57:856–865. [DOI] [PubMed] [Google Scholar]
- Dale AM, Fischl B, Sereno MI (1999): Cortical surface‐based analysis I: Segmentation and surface reconstruction. NeuroImage 9:179–194. [DOI] [PubMed] [Google Scholar]
- Dickerson BC, Fenstermacher E, Salat DH, Wolk DA, Maguire RP, Desikan R, Fischl B (2008): Detection of cortical thickness correlates of cognitive performance: Reliability across MRI scan sessions, scanners, and field strengths. NeuroImage 39:10–18. [DOI] [PMC free article] [PubMed] [Google Scholar]
- Du AT, Schuff N, Amend D, Laakso MP, Hsu YY, Jagust WJ, Weiner MW (2001): Magnetic resonance imaging of the entorhinal cortex and hippocampus in mild cognitive impairment and Alzheimer's disease. J Neurol, Neurosurg Psychiatry 71:441–447. [DOI] [PMC free article] [PubMed] [Google Scholar]
- Fischl B, Dale AM (2000): Measuring the thickness of the human cerebral cortex from magnetic resonance images. Proc Natl Acad Sci USA 97:11050–11055. [DOI] [PMC free article] [PubMed] [Google Scholar]
- Fischl B, Salat DH, Busa E, Albert M, Dieterich M, Haselgrove C, Dale AM (2002): Whole brain segmentation: Automated labeling of neuroanatomical structures in the human brain. Neuron 33:341–355. [DOI] [PubMed] [Google Scholar]
- Fischl B, van der Kouwe A, Destrieux C, Halgren E, Ségonne F, Salat DH, Kennedy D (2004): Automatically parcellating the human cerebral cortex. Cereb Cortex 14:11–22. [DOI] [PubMed] [Google Scholar]
- Fjell AM, Walhovd KB, Fennema‐Notestine C, McEvoy LK, Hagler DJ, Holland D, Dale AM (2010): CSF biomarkers in prediction of cerebral and clinical change in mild cognitive impairment and Alzheimer's disease. J Neurosci 30:2088–2101. [DOI] [PMC free article] [PubMed] [Google Scholar]
- Genovese CR, Lazar NA, Nichols T (2002): Thresholding of statistical maps in functional neuroimaging using the false discovery rate. NeuroImage 15:870–878. [DOI] [PubMed] [Google Scholar]
- Groneneschild, E. (2012). Re: Recent paper on FreeSurfer reliability [Online forum comment]. Available at: http://www.mail-archive.com/freesurfer%40nmr.mgh.harvard.edu/msg23189.html, accessed on Decmeber 10, 2014.
- Gronenschild EHBM, Habets P, Jacobs HIL, Mengelers R, Rozendaal N, Os Jv, Marcelis M (2012): The effects of FreeSurfer version, workstation type, and macintosh operating system version on anatomical volume and cortical thickness measurements. PLoS One 7:e38234. [DOI] [PMC free article] [PubMed] [Google Scholar]
- Han X, Jovicich J, Salat D, Kouwe Avd, Quinn B, Czanner S, Fischl B (2006): Reliability of MRI‐derived measurments of human cerebral cortical thickness: The effects of field strength, scanner upgrade and manufacturer. NeuroImage 32:180–194. [DOI] [PubMed] [Google Scholar]
- Jack CR, Bernstein MA, Fox NC, Thompson P, Alexander G, Harvey D, Weiner MW (2008): The Alzheimer's disease neuroimaging initiative (ADNI): MRI methods. J Magn Reson Imaging 27:685–691. [DOI] [PMC free article] [PubMed] [Google Scholar]
- Jack CR, Albert MS, Knopman DS, McKhann GM, Sperling RA, Carrillo MC, Phelps CH (2011): Introduction to the recommendations from the National Institute on Aging‐Alzheimer's Association workgroups on diagnostic guidelines for Alzheimer's disease. Alzheimers Dement 7:6 [DOI] [PMC free article] [PubMed] [Google Scholar]
- Jovicich J, Czanner S, Han X, Salat D, Kouwe Avd, Quinn B, Fischl B (2009): MRI‐derived measurements of human subcortical, ventricular and intracranial brain volumes: Reliability effects of scan sessions, acquisition sequences, data analyses, scanner upgrade, scaner vendors and field strengths. NeuroImage 46:177–192. [DOI] [PMC free article] [PubMed] [Google Scholar]
- McKhann GM, Knopman DS, Chertkow H, Hyman BT, Jrr CRJ, Kawas CH, Phelps CH (2011): The diagnosis of dementia due to Alzheimer's disease: Recommendations from the National Institute on Aging‐Alzheimer's Association workgroups on diagnostic guidelines for Alzheimer's disease. Alzheimers Dement 7:263–269. [DOI] [PMC free article] [PubMed] [Google Scholar]
- Neuroskeptic . (2012). Brains are Different on Macs. Available at: http://blogs.discovermagazine.com/neuroskeptic/2012/06/14/brains-are-different-on-macs/, last accessed on December 18, 2014.
- Pantazis D, Joshi A, Jiang J, Shattuck DW, Bernstein LE, Damasio H, Leahy RM (2009): Comparison of landmark‐based and automatic methods for cortical surface registration. NeuroImage 49:2479–2493. [DOI] [PMC free article] [PubMed] [Google Scholar]
- Rosas HD, Liu AK, Hersch S, Glessner M, Ferrante RJ, Salat DH, Fischl B (2002): Regional and progressive thinning of the cortical ribbon in Huntington's disease. Neurology 58:695–701. [DOI] [PubMed] [Google Scholar]
- Salat DH, Buckner RL, Snyder AZ, Greve DN, Desikan RSR, Busa E, Fischl B (2004): Thinning of the cerebral cortex in aging. Cereb Cortex 14:721–730. [DOI] [PubMed] [Google Scholar]
- Ségonne F, Dale AM, Busa E, Glessner M, Salat D, Hahn HK, Fischl B (2004): A hybrid approach to the skull stripping problem in MRI. NeuroImage 22:1060–1075. [DOI] [PubMed] [Google Scholar]
- Sperling RA, Aisen PS, Beckett LA, Bennett DA, Craft S, Fagan AM, Phelps CH (2011): Toward defining the preclinical stages of Alzheimer's disease: Recommendations from the National Institute on Aging‐Alzheimer's Association workgroups on diagnostic guidelines for Alzheimer's disease. Alzheimer's & Dementia 7:280–292. [DOI] [PMC free article] [PubMed] [Google Scholar]
- van Hoesen GW, Hyman BT, Damasio AR (1991): Entorhinal cortex pathology in Alzheimer's disease. Hippocampus 1:1–8. [DOI] [PubMed] [Google Scholar]