

Abstract
The hippocampus (HPC) is functionally heterogeneous along the longitudinal anterior–posterior axis. In rodent models, gene expression maps define at least three discrete longitudinal subregions, which also differ in function, and in anatomical connectivity with the rest of the brain. In humans, equivalent HPC subregions are less well defined, resulting in a lack of consensus in neuroimaging approaches that limits translational study. This study determined whether a data‐driven analysis, namely independent component analysis (ICA), could reproducibly define human HPC subregions, and map their respective intrinsic functional connectivity (iFC) with the rest of the brain. Specifically, we performed ICA of resting‐state fMRI activity spatially restricted within the HPC, to determine the configuration and reproducibility of functional HPC components. Using dual regression, we then performed multivariate analysis of iFC between resulting HPC components and the whole brain, including detailed connectivity with the hypothalamus, a functionally important connection not yet characterized in human. We found hippocampal ICA resulted in highly reproducible longitudinally discrete components, with greater functional heterogeneity in the anterior HPC, consistent with animal models. Anterior hippocampal components shared iFC with the amygdala, nucleus accumbens, medial prefrontal cortex, posterior cingulate cortex, midline thalamus, and periventricular hypothalamus, whereas posterior hippocampal components shared iFC with the anterior cingulate cortex, retrosplenial cortex, and mammillary bodies. We show that spatially masked hippocampal ICA with dual regression reproducibly identifies functional subregions in the human HPC, and maps their respective brain intrinsic connectivity. Hum Brain Mapp 37:462–476, 2016. © 2015 Wiley Periodicals, Inc.
Keywords: hippocampus, hypothalamus, resting state, independent component analysis, intrinsic connectivity
INTRODUCTION
The hippocampus (HPC) contains multiple functionally distinct domains along the longitudinal (anterior–posterior) axis. These domains also differ in gene expression, and in anatomical connections with the rest of the brain, while having relatively similar neural circuitry, and a similar composition of the CA subfields 1–3, dentate gyrus, and subiculum [Moser and Moser, 1998; Fanselow and Dong, 2010; Strange et al., 2014]. In rodent, where the ventral–dorsal axis is equivalent to the human anterior–posterior axis, gene expression patterns define at least three domains: ventral, mid, and dorsal [Dong et al., 2009]. The ventral HPC is involved in motivational behavior, emotional memory, and regulation of neuroendocrine and autonomic activity, via connectivity with the amygdala, medial prefrontal cortex (mPFC), and periventricular hypothalamus, among other areas. The dorsal HPC is specialized for aspects of declarative memory and spatial navigation, and anatomically connects with anterior cingulate cortex (ACC), retrosplenial cortex (RSC), and mammillary bodies [Moser and Moser, 1998; Fanselow and Dong, 2010]. The function of the mid HPC is less understood [Strange et al., 2014]. As yet, this model of ventral, mid and dorsal thirds remains provisional, given evidence for additional gene expression and behavioral domains, particularly in the ventral HPC [Thompson et al., 2008], and for graded, rather than discrete longitudinal variation in anatomical connectivity [Strange et al., 2014].
In human, multiple neuroimaging techniques have been used to investigate functional anatomical variation along the anterior–posterior axis of the HPC, including diffusion tensor imaging [Adnan et al., 2015], high‐resolution structural magnetic resonance imaging (MRI) [Coras et al., 2014] and resting state blood oxygen level‐dependent (BOLD) functional MRI (fMRI). In particular, anterior and posterior hippocampal subregions were found to show distinct patterns of BOLD fMRI intrinsic functional connectivity with various extra‐hippocampal brain areas. Intrinsic functional connectivity (iFC) refers to temporal coherence in low frequency BOLD signal fluctuations, and is known to closely correlate with both anatomical connectivity, and task related activation [Mezey et al., 2000; Fox and Raichle, 2007; Smith et al., 2009]. Previous authors investigated hippocampal–brain iFC for specific anterior–posterior subregions by longitudinally segmenting the HPC with arbitrary, a priori defined anatomical seeds. Varying seed configurations were used across studies, including anterior–posterior halves [Poppenk and Moscovitch, 2011], anterior, mid, and posterior thirds [Chen and Etkin, 2013], or many finely spaced longitudinal seeds [Kahn et al., 2008; Granjeiro et al., 2011]. Alternatively, Zarei et al (2012) took the approach of mapping continuous iFC along the anterior–posterior axis for several select brain regions of interest (ROIs), namely the thalamus, posterior cingulate cortex (PCC), and mPFC; Libby et al. (2012) took a similar approach, with the peri‐rhinal cortex (PRC) and parahippocampal gyrus (PHG) as ROIs. The entorhinal cortex (ERC), responsible for hippocampal–neocortical communications, was also found to show a similar anterior‐posterior gradient in iFC with the PRC and ERC, using high‐resolution (7T) resting‐state fMRI [Maass et al., 2015].
This literature makes apparent the current lack of a consensus system for longitudinally segmenting the human HPC [Poppenk et al., 2013]. Problematically, studies of gene expression or histological anatomical connectivity that could potentially define relevant intrahippocampal boundaries in human are limited; moreover, equivalent findings in rodent are not necessarily informative to human, as the human anterior HPC is substantially expanded relative to rodent ventral HPC, and the human posterior HPC significantly reduced, relative to rodent dorsal HPC [Insausti, 1993; Ding, 2013]. Yet the alternative of using arbitrary seeds may be associated with several problems, as follows. Large seeds may mask underlying heterogeneity—this is particularly plausible for the anterior HPC, as the analogous ventral HPC in rodent contains heterogeneous genetic and functional domains [Thompson et al., 2008]. Further, putative functional or genomic domains in the hippocampal head may be differentiated in the medial‐lateral as well as anterior‐posterior axis, because the anterior tip of the HPC curves rostromedially to form the uncus, as evident in high resolution structural imaging [Coras et al., 2014; Yushkevich et al., 2015]. On the other hand, high‐resolution seeds may optimize heterogeneity, but not reproducibility, as slight variations in location dramatically affect iFC [Cole et al., 2010]. In addition to these concerns, univariate seed‐based analyses provide a limited estimate of subregional iFC, as they do not control for overall regional patterns of functional connectivity, as achieved by multivariate analyses [Leech et al., 2012; Braga et al., 2013]. Finally, previous studies documented hippocampal iFC with a limited number of brain ROIs.
Improved accuracy and reproducibility in mapping hippocampal iFC is of clinical relevance, as subregional hippocampal dysfunction is implicated in epilepsy, schizophrenia, Alzheimer's disease, anxiety disorders, and major depressive disorder [Grace, 2010; Tanti and Belzung, 2013; Coras et al., 2014; Maruszak and Thuret, 2014; Stevens et al., 2014]. We therefore sought to determine whether human longitudinal hippocampal components can be reproducibly defined using a data‐driven analysis, specifically, independent component analysis (ICA). When performed within the whole brain, or defined brain region, ICA identifies a set of independent components, i.e., a set of spatial maps and associated time courses, by maximizing the mutual statistical independence in patterns of activity between components [Beckmann and Smith, 2004]. Importantly, no a priori assumptions are required regarding the spatial configuration of these components. Component time courses then yield multivariate estimates of brain iFC, using dual regression [Zuo et al., 2010]. This approach successfully identified connectivity networks in the whole brain [Cole et al., 2010], as well as subregional networks within spatially masked brain areas, including the PCC [Leech et al., 2012], cerebellum [Dobromyslin et al., 2012], motor cortex [Sohn et al., 2012], operculo‐insular cortex [Rebola et al., 2012], brainstem [Beissner et al., 2013], spinal cord [Kong et al., 2014], and temporoparietal cortex [Igelstrom et al., 2015].
Here, in healthy human subjects, we use masked hippocampal ICA to empirically determine the spatial configuration and reproducibility of functionally independent components, followed by dual regression, to determine their respective iFC with the rest of the brain, including cortical and subcortical regions. We extend upon previous studies by investigating hippocampal iFC with the hypothalamus, a functionally important connection not yet assessed in human. In animal models, connections between the ventral HPC and the medial and periventricular hypothalamus functionally contribute to motivational behavior and neuroendocrine regulation, whereas dorsal HPC connections with the mammillary bodies contribute to spatial navigation and memory [Moser and Moser, 1998; Fanselow and Dong, 2010]. We provide the first report of equivalent hypothalamic functional connectivity for the human HPC.
METHODS
Participants
Subjects included an initial group of 131 healthy subjects (64 male) with no current medical illness, or history of neurological or psychiatric illness, 31 of which were subsequently excluded due to left‐handedness, excessive motion (>1 mm peak‐to‐peak), or incomplete MRI or physiological data. The remaining 100 subjects were divided into two age and sex matched groups of 50 subjects (discovery and confirmation samples). Discovery subjects (27 male) were 20–38 years of age, mean 24.3 ± 4.1 years, and were of normal weight (BMI: 22.5 ± 2.4). Confirmation subjects (24 male) were 19–52 years of age, mean 24.3 ± 5.8 years, and BMI: 23.0 ± 3.0. This study was conducted according to the Declaration of Helsinki. All participants gave written informed consent, in accordance with the guidelines of the ethics committee of the University Hospital, Jena, Germany.
Data Acquisition
All MRI data were obtained with a 3 T whole‐body MR scanner (MAGNETOM Trio Tim, Siemens Medical Solutions, Erlangen, Germany) with a 12‐channel head matrix coil. Participants underwent a functional (resting state) run followed by an anatomical scan. All participants were asked to relax and remain still with their eyes open during the scan. The functional sequence was gradient‐echo echo‐planar imaging (GRE‐EPI) accelerated with parallel imaging (GRAPPA factor of 2). Scan parameters were TE: 30 ms; TR: 2.52 s; PE direction: anterior–posterior; FOV: 220 × 210 mm2; matrix size: 88 × 84; in‐plane resolution: 2.5 × 2.5 mm2; slice thickness: 2.5 mm; inter‐slice gap: 0.625 mm; number of slices: 45, image acquisition direction: ascending. The functional run comprised 240 volumes with a total length of 10 min and 5 s. The T1‐weighted anatomical scan sequence was magnetization prepared rapid gradients echo (MPRAGE) with the following parameters: TE: 3.03 ms; TR: 2.3 s, matrix size: 256 × 256; FOV: 280 × 280 mm2; number of slices: 192; in‐plane resolution: 1.09 × 1.09 mm2.
For physiological noise modeling, the electrocardiogram (ECG) and respiratory activity (RESP) were recorded during MRI using a BIOPAC MP150 polygraph (BIOPAC Systems Inc., Goleta, CA, USA) at a sampling rate of 500 Hz. ECG electrodes were arranged in a modified Einthoven's triangle, and signals were band‐pass filtered (0.05–35 Hz). The RESP signal was temporally smoothed over 100 samples. To detect heartbeats, ECG data underwent wavelet analysis to identify cardiac R‐waves by their high‐frequency content. A 10th‐order Daubechies wavelet was used to separate the frequency ranges of interest.
Data Preprocessing
A flow‐chart of our preprocessing and analysis stream can be found in Supporting Information, Figure S1. Data were processed using tools from SPM8 (Wellcome Department of Imaging Neuroscience, UCL, London, UK, http://www.fil.ion.ucl.ac.uk/spm), FSL5.0 (Oxford Centre for Functional MRI of the Brain, Oxford, UK, http://www.fmrib.ox.ac.uk/fsl/), and scripts written in MATLAB (MathWorks, Natick, MA, USA). Anatomical images were segmented into gray matter, white matter and cerebrospinal fluid (CSF) using SPM's segment algorithm [Ashburner and Friston, 2005]. Gray and white matter maps were then used as masks to create a brain‐extracted version of the anatomical images, which were then normalized to the non‐linear and nonsymmetrized version of the ICBM152 (http://www.bic.mni.mcgill.ca/ServicesAtlases/ICBM152NLin2009) using FSL FLIRT and FNIRT, at 1 and 2 mm isotropic resolution.
Functional images were corrected for head motion by realigning each volume to the first volume of the run. Data from subjects with peak‐to‐peak motion exceeding 1 mm in any direction were excluded. Physiological noise correction was applied using FSL's physiological noise modeling (PNM) [Kong et al., 2012]. Regressors were created for cardiac and respiratory signals (principal frequencies as well as first three harmonics), and their interactions [Kong et al., 2012]. Altogether, thirty‐two physiological nuisance regressors were included and treated as voxel‐wise confounds in FSL FEAT. As PNM is not tailored for application in an ICA context, regression was performed in a general linear model (GLM) before running the ICA, using a linear ramp function as the regressor of interest, effectively excluding low frequencies irrelevant to fMRI experiments. In addition to PNM, white‐matter and CSF signals were extracted from the normalized images with a 3 x 3 x 3 voxel cube centered at MNI coordinates x = −26, y = −22, z = 28 (left‐hemispheric parietal white matter), and x = 4, y = 10, z = 8 (third ventricle). These signals (white matter signal, CSF signal) were later used as confounding regressors in the dual regression, together with motion parameters (three translations, three rotations).
Filtered functional images were linearly co‐registered to the anatomical scan, using FLIRT with boundary‐based registration [Greve and Fischl, 2009], and nonlinearly transformed to the nonlinear nonsymmetrized ICBM152 using the transformation parameters and derived from the anatomical scan. During this procedure, images were up‐sampled to an isotropic resolution of 2 mm. Goodness of this normalization was controlled by eye (see Supporting Information, Figs. S2 and S3) and quantified by segmenting the hippocampus in each individual using the model‐based segmentation tool FSL First [Patenaude et al., 2011], then applying the normalization transformation to the binarized hippocampal masks (Supporting Information, Figs. S4 and S5). As a quantitative measure for the goodness of normalization, we assessed the overlap (i.e., similarity) of the normalized hippocampal masks by calculating the conformity measure [Chang et al., 2009] for all possible combinations. The values of 0.549 ± 0.086 (mean ± S.D.) for the left and 0.593 ± 0.063 for the right hippocampus indicated high similarity.
For hypothalamic analyses, the whole‐brain normalization was repeated, this time followed by resampling to 1 mm isotropic resolution and cropping of the resulting image, retaining a 4 × 4 × 4 cm cube centered in the hypothalamus that was large enough to hold the hypothalamic mask used in later analysis steps. The goodness of this normalization was controlled by eye (see Supporting Information, Figs. S6–S9). All functional data were high‐pass filtered with a cut‐off frequency of 0.01 Hz. Whole‐brain data were spatially smoothed using a Gaussian kernel of 5 mm FWHM. For the hypothalamus, smoothing was omitted, as up‐sampling from 2.5 to 1 mm generated a sufficiently smooth image.
Data Analysis
Spatially restricted hippocampal ICA
Functionally independent HPC subregions were identified in the discovery sample using probabilistic ICA (pICA) [Beckmann and Smith, 2004] performed upon temporally concatenated group data [Do Monte et al., 2013], see Supporting Information, Fig. S1. Analysis was restricted within the bilateral HPC. Our HPC mask was derived from the Harvard‐Oxford atlas, using a tissue probability threshold of 50%. Preprocessed data were temporally concatenated and analyzed by pICA using FSL MELODIC 3.14. Data were projected into a 10‐dimensional subspace using probabilistic principal component analysis after voxel‐wise de‐meaning of the data, and normalization by the voxel‐wise variance. Whitened observations were then decomposed into time‐courses and maps by optimizing for non‐Gaussian spatial distributions using a fixed‐point iteration technique [Hyvarinen, 1999]. Estimated group‐level component maps were divided by the standard deviation of the residual noise, and thresholded by fitting a mixture model to the histogram of intensity [Beckmann and Smith, 2004]. A dimensionality of 10 was chosen after automated estimation yielded a value of 77, which is unsuitably high, given known features of hippocampal organization from animal studies. In a series of pre‐tests, we thus tried different dimensionalities (increasing step‐wise from 5–10 dimensions) to identify the optimal number of dimensions. The optimum was defined as the dimensionality at which existing components had separated into the maximum number of subcomponents, without generating qualitatively new components. These pre‐tests resulted in an optimum dimensionality of 10. Additional support for this value came from a split‐half reproducibility analysis we ran on our data using the masked ICA toolbox (http://www.nitrc.org/projects/mica). In each of the fifty iterations, data were split into two sub‐samples, for each of which a masked ICA was computed. Components of each pair of sub‐samples were then matched, and the averaged spatial correlation coefficient of the matched components was used as a measure for reproducibility (Supporting Information, Fig. S10). We found that a dimensionality of 10 was indeed a favorable choice as it maximizes the overall reproducibility of the results.
Functional connectivity analyses using dual regression
Multivariate functional connectivity between HPC components and the whole brain was assessed via a modified dual regression approach [Zuo et al., 2010, Leech et al., 2012], see Supporting Information, Figure S1. In the first step of dual regression, a GLM including the spatial maps of all 10 resulting hippocampal group ICA components as a design matrix was used to derive subject‐specific time series associated with each component. In the second step of dual regression, these subject‐specific independent component time series were used in a second GLM, to derive the full set of voxels, or spatial map associated with that time series. This second step was performed separately for the hypothalamic, and the whole‐brain fMRI data. Significance was assessed using a voxel‐wise non‐parametric permutation test (RANDOMISE 2.9 FSL) with 1000 permutations and a p‐value of 0.05, corrected for multiple comparisons using family‐wise error. Activation clusters of 5 or more, or 50 or more voxels were reported for the hypothalamic and whole brain analyses, respectively.
As many previous studies have used cluster‐based thresholds, we also repeated significance testing using a p‐value of 0.05 corrected by threshold free cluster enhancement (TFCE) [Smith and Nicols et al., 2009]. Despite our general impression that this threshold produced too liberal results, we nevertheless included them in the supplementary material for the sake of comparability.
For the whole‐brain analysis, activation clusters were anatomically identified using the probabilistic Harvard–Oxford Atlas [Desikan et al., 2006] and Juelich histological atlas [Eickhoff et al., 2005]. For the hypothalamus, analysis was restricted to voxels within a hypothalamic mask, which notably included the third ventricle, so did not mask any signals arising from the CSF (Supporting Information, Figs. S8 and S9). It should be noted, however, that partial volume effects could not be excluded, as they would not be corrected by the up‐sampling to 1 mm. For interpretation of hypothalamic results, and production of Figure 3, coronal slices of the whole hypothalamic ROI were tilted and registered with 15 corresponding atlas images from Mai et al. [Mai et al., 2008], beginning 1 mm anterior to the anterior commissure, through to the posterior mammillary body. Coherence across hypothalamic landmarks (optic chiasm, fornix, anterior commissure, mammillary bodies) was verified by eye. Connectivity clusters resulting from hippocampal–hypothalamic connectivity analyses were localized by comparing their MNI coordinates and locations within each coronal section relative to this atlas of Mai et al, and also the human hypothalamic MRI atlas of Baroncini et al. [Baroncini et al., 2012]. All nuclei encompassed within the current effective spatial resolution (2.5 mm) of relevant clusters were reported.
Figure 3.
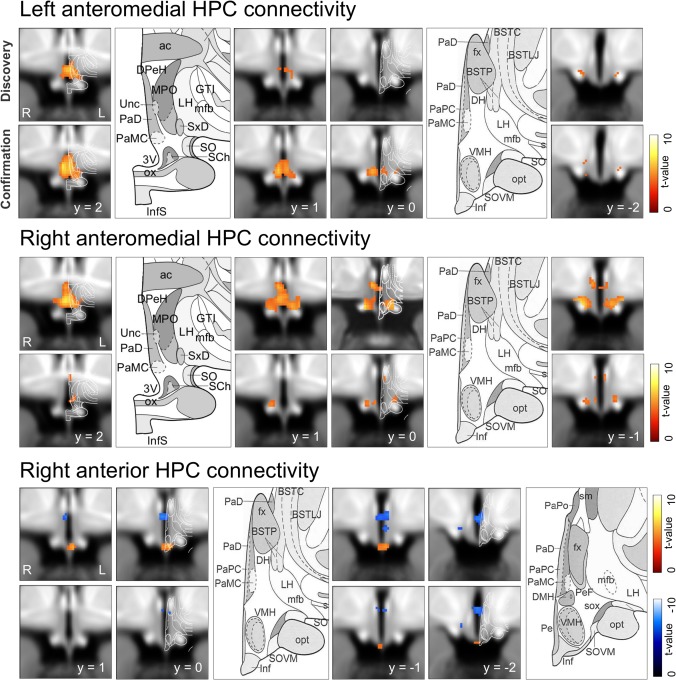
Hippocampal–hypothalamic connectivity. Conjunction analysis results show functional connectivity between each of three HPC components and the hypothalamus. For each component, four serial coronal sections are shown adjacent to corresponding coronal atlas sections (Mai et al., 2008). Abbreviations for atlas sections: DMH, dorsomedial hypothalamic nucleus; Inf, infundibular nucleus; MM, mammillary body; MPO, medial preoptic nucleus; PaD, PaPC, PaMC, PaPo, paraventricular nuclei, dorsal, parvocellular, magnocellular, and posterior divisions; SCh, suprachiasmatic nuclei; SO, supraoptic nuclei; SOVM, supraoptic nucleus; ventromedial part, VMH, ventromedial hypothalamic nucleus.
Comparison between multivariate and univariate dual regression results
The current estimates of iFC using dual regression are multivariate, in that the time‐course for each HPC component is derived while controlling for the variance explained by other components. This process results in a set of components with more mutually distinct time courses, relative to a set of time courses derived from averaging within equivalent spatial subregions (seeds), which share more mutual similarity; hence multivariate estimates of brain iFC derived from dual regression may differ to those derived from univariate methods [Leech et al., 2012]. To compare results produced by multivariate analysis and univariate analysis, the mean time courses associated with the spatial HPC components resulting from group ICA were entered into the GLM independently, an approach similar to seed‐based analyses.
Test–retest reliability
The reproducibility (test–retest reliability) of hippocampal ICA components between confirmation and discovery samples was assessed by conjunction analysis, which involved taking the minimum thresholded z‐value of the discovery and confirmation sample. We also calculated Pearson spatial correlations between the un‐thresholded spatial maps of the independent components of both samples. In both cases, we identified matching components between samples by solving the linear assignment problem using the Hungarian sorting algorithm [Kuhn, 2005]. Reproducibility of whole‐brain connectivity results was assessed analogously by calculating conjunction of the thresholded and Pearson's correlation of the un‐thresholded t‐maps.
RESULTS
Hippocampal ICA Yields Reproducible Longitudinally Discrete Components
Spatially restricted hippocampal ICA resulted in highly longitudinally discrete components, with some overlap, that were also mostly lateralized, with a similar configuration in right and left HPC (Fig. 1 and Table 1). In each HPC, three of five components had peak activation located within the anatomical anterior third of the current mask, and were termed Anterior, Anteromedial, and Anterolateral. The Anterior component was confined entirely within the HPC head (defined as anterior to the posterior limit of the uncal apex, y = −21) [Poppenk et al., 2013]. The Anteromedial component was situated medially, and more posteriorly, with overlap into the HPC body to a posterior extent of MNI y = −26. The Anterolateral component was at a similar anterior posterior extent, but located more laterally. The remaining mid and posterior thirds of the hippocampal mask each wholly contained only one component, termed Mid or Posterior, respectively. Results, produced using a 10‐dimensional ICA, were qualitatively similar using dimensionalities of 7 or 15. Component reproducibility (test–retest reliability) was moderate to very high, with Pearson spatial correlations ranging between 0.73 and 0.95 for left HPC components (mean ± S.D. = 0.88 ± 0.09), and 0.48–0.65 for the right HPC components (0.62 ± 0.05) (Fig. 1 and Table 2). The readily apparent higher reproducibility of left, compared to right components was unexpected and significant: P = 0.0013.
Figure 1.
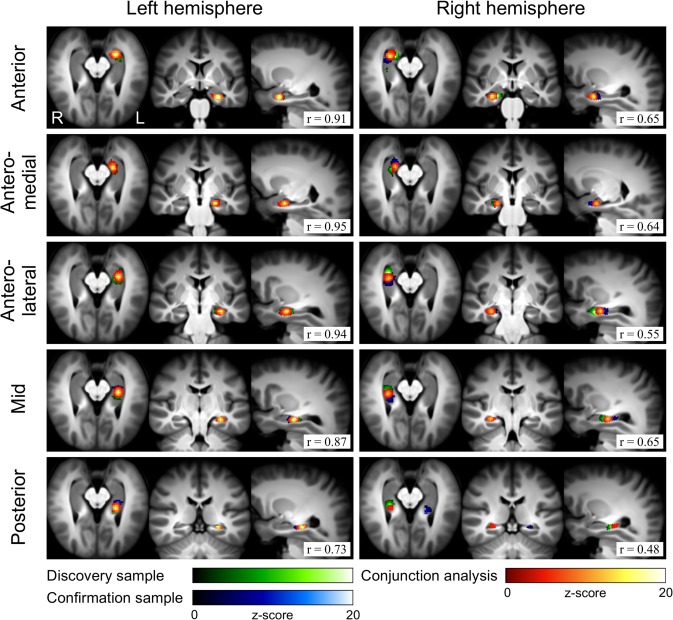
Components produced by independent component analysis restricted within the hippocampus. Discovery sample, confirmation sample, and conjunction analysis results are shown. Pearson spatial correlation coefficients (r, bottom right) indicate component reproducibility between samples.
Table 1.
Independent components resulting from spatially restricted hippocampal ICA
| Component | Side | Cluster size (voxels) | MNI coordinates (mm) | Z max | Reproducibility* (r) | ||
|---|---|---|---|---|---|---|---|
| x | y | z | |||||
| Anterior | L | 154 | −26 | −12 | −24 | 20.8 | 0.91 |
| R | 154 | 28 | −12 | −22 | 15.3 | 0.65 | |
| Anteromedial | L | 166 | −22 | −16 | −18 | 15.2 | 0.95 |
| R | 103 | 20 | −16 | −20 | 12.8 | 0.64 | |
| Anterolateral | L | 186 | −30 | −18 | −18 | 17.4 | 0.94 |
| R | 152 | 30 | −20 | −16 | 14.2 | 0.55 | |
| Mid | L | 138 | −30 | −28 | −12 | 18.5 | 0.87 |
| R | 115 | 30 | −28 | −10 | 13.0 | 0.65 | |
| Posterior | L | 84 | −26 | −36 | −4 | 16.6 | 0.73 |
| R | 70 | 24 | −36 | −2 | 5.69 | 0.48 | |
Conjunction analysis results are shown. Reproducibility, r, Pearson spatial correlations for the best matching components between discovery and confirmation samples.
*p < 0.001 for all correlation coefficients.
Table 2.
Intrinsic functional connectivity between hippocampal components and the whole brain
| Component | Area | Cluster size (voxels) | MNI coordinates (mm) | tmax | ||
|---|---|---|---|---|---|---|
| x | Y | z | ||||
| Anterior (l) | ParaHipp, Hipp, Amy (l), Temp. Fusif. Gyr., ITG | 1415 | −24 | −12 | −22 | 47.2 |
| OFC, IFG | 111 | −50 | 28 | −12 | 5.95 | |
| Temp. Fusif. Gyr, ITG | 89 | 40 | −18 | −30 | 6.05 | |
| Hipp, Amy (r) | 1047 | 26 | −12 | −18 | −10.3 | |
| Hipp, Amy (l) | 645 | −22 | −18 | −16 | −23.1 | |
| Lingual Gyr., Occ. Fusif. Gyr. | 352 | 4 | −86 | −18 | −6.82 | |
| RSC | 174 | −2 | −38 | 2 | −6.97 | |
| Thalamus (PVN) | 100 | 0 | −6 | 8 | −7.01 | |
| Cer (Crus I) | 29 | 0 | 2 | 22 | −4.99 | |
| Anteromedial (l) | Precuneus, Frontal Pole, PCC, Paracingulate Gyr., mPFC, Subcallosal Cortex, NAcc, Amy (l+r), ParaHipp | 13504 | −22 | −16 | −18 | 54.7 |
| Cer (Crus I+II) | 1172 | 26 | −90 | −38 | 7.13 | |
| Temporal Pole, MTG, STG | 1101 | −56 | −6 | −14 | 7.58 | |
| Temporal Pole, STG, MTG | 824 | 58 | 0 | −18 | 8.24 | |
| LOC, Angular Gyr, IPL | 715 | −46 | −70 | 34 | 7.53 | |
| Cer (IX, Vermis IX, VIIIb, Vermis IX) | 435 | 0 | −60 | −48 | 7.33 | |
| Cer (Crus I+II) | 360 | −10 | −88 | −38 | 6.33 | |
| SFG, Frontal Pole, MFG | 318 | −20 | 32 | 44 | 6.62 | |
| LOC, Angular Gyr, IPL | 311 | 56 | −62 | 20 | 6.53 | |
| M1, S1 | 208 | 30 | −26 | 56 | 6.29 | |
| Cer (IX) | 121 | −8 | −50 | −38 | 6.00 | |
| SFG, MFG, Frontal Pole | 100 | 22 | 34 | 48 | 5.79 | |
| Thalamus (PVN) | 99 | 0 | −8 | 10 | 6.33 | |
| STG, MTG, Planum Temporale | 85 | −62 | −24 | 0 | 6.01 | |
| VTA | 69 | 0 | −14 | −14 | 6.3 | |
| STG, MTG, Supramarginal Gyr. | 52 | 60 | −34 | 4 | 5.69 | |
| M1, S1 | 51 | 44 | −14 | 56 | 5.38 | |
| Cer (X) | 49 | −16 | −40 | −44 | 5.71 | |
| Frontal Pole, OFC | 43 | 34 | 36 | −12 | 6.02 | |
| SFG, MFG | 38 | −26 | 18 | 54 | 5.35 | |
| Paracingulate Cortex, aMCC | 31 | −10 | 46 | 12 | 3.47 | |
| OFC, Frontal Pole | 30 | −36 | 34 | −14 | 5.11 | |
| Hipp, ParaHipp, Temp. Fusif. Gyr, Amy (l) | 215 | −32 | −22 | −16 | −10.9 | |
| Anterolateral (l) | Hipp, Amy (r), ParaHipp, Temp. Fusif. Gyr. | 779 | −28 | −18 | −18 | 47.0 |
| Hipp, Amy (l), ParaHipp | 442 | −20 | −10 | −24 | −21.7 | |
| Hipp | 210 | −28 | −30 | −10 | −16.2 | |
| Hipp, ParaHipp | 142 | 32 | −18 | −18 | −8.42 | |
| Hipp | 67 | 28 | −32 | −6 | −6.43 | |
| Hipp, Amy (r) | 41 | 16 | −14 | −16 | −3.84 | |
| Mid (l) | Hipp, ParaHipp, Temp. Fusif. Gyr. | 749 | −28 | −28 | −12 | 48.7 |
| Hipp, Amy (l), ParaHipp | 73 | −22 | −8 | −26 | 9.32 | |
| Hipp, Amy (l), ParaHipp | 400 | −28 | −16 | −20 | −25.9 | |
| Hipp | 219 | −22 | −40 | −2 | −18.9 | |
| Hipp, Amy (r) | 155 | 22 | −14 | −18 | −8.67 | |
| Hipp | 125 | 34 | −24 | −14 | −10.5 | |
| Posterior (l) | Hipp, ParaHipp, Thalamus | 748 | −26 | −34 | −4 | 50.0 |
| Hipp, ParaHipp, Temp. Fusif. Gyr. | 333 | −30 | −22 | −14 | −23.3 | |
| Hipp, Amy (r), ParaHipp | 293 | 30 | −16 | −18 | −10.8 | |
| Hipp, Amy (l), ParaHipp | 282 | −24 | −8 | −26 | −12.4 | |
| Hipp | 166 | 28 | −32 | −6 | −15.1 | |
Results from conjunction analysis for all left‐sided HPC components are shown.
Abbreviations: Amy, amygdala; Hipp, hippocampus; IFG, inferior frontal gyrus; IPL, inferior parietal lobule; ITG, inferior temporal gyrus; LOC, lateral occipital cortex; M1, primary motor cortex; MFG, medial frontal gyrus; NAcc, nucleus accumbens; OFC, orbitofrontal cortex; ParaCing, paracingulate gyrus; ParaHipp, para‐hippocampal gyrus; PCC, posterior cingulate cortex; RSC, retrosplenial cortex; S1, primary somatosensory cortex; SFG, superior frontal gyrus; SPL, superior parietal lobule; STG, superior temporal gyrus; Temp Fusiform Gyr, temporal fusiform gyrus; V1–V4, visual areas V1–V4; VTA, ventral tegmental area.
Anterior HPC Components Show Distinct Patterns of Whole Brain Connectivity
Anterior and Anteromedial components shared reproducible iFC with distinct sets of subcortical and cortical brain areas (Fig. 2 and Table 2). For Anteromedial components, cortical iFC included the anterior and ventral mPFC, posterior cingulate cortex (PCC), RSC, precuneus, and inferior parietal lobule (IPL) (all part of the default mode network (DMN) [Andrews‐Hanna et al., 2010; Biswal et al., 2010]), as well as widespread temporal areas. Anteromedial subcortical iFC included bilateral amygdala, paraventricular thalamus, nucleus accumbens (NAcc), and ventral tegmental area (VTA), as well as discrete areas within the ipsi‐ and contralateral HPC. Anterior HPC components shared connectivity with the anterolateral inferior temporal gyrus, temporal pole, fusiform area, orbitolateral PFC, and ipsilateral amygdala, and paraventricular thalamus (Fig. 2 and Table 2). Results, shown for all left components, were qualitatively similar for right components. Anterolateral components did not show extrahippocampal connectivity using the current multivariate analysis and thresholding, but did show intrahippocampal and para‐hippocampal connectivity (Fig. 4 and Table 2). By contrast, extrahippocampal iFC was evident using a univariate approach, and included brain regions common to both the Anterior, and Anteromedial components (Supporting Information, Fig. S11). Using TFCE‐based thresholding with multivariate analysis produced similar results (Supporting Information, Fig. S12).
Figure 2.
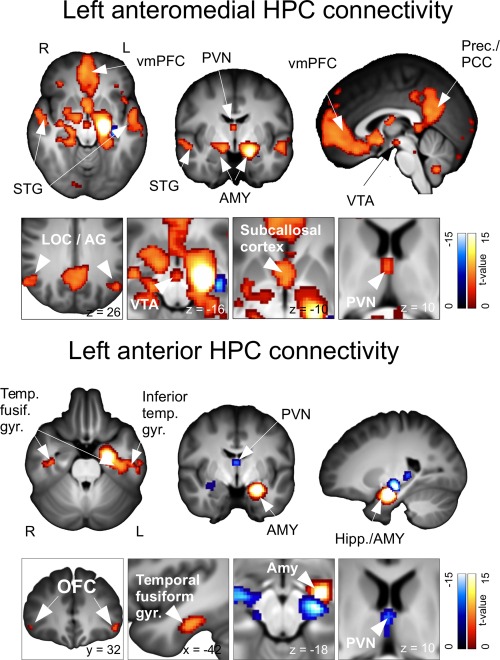
Connectivity of Anteromedial and Anterior hippocampal components with the whole brain. Conjunction analysis results are shown. Abbreviations: AG, angular gyrus; Amy, amygdala; Hipp, hippocampus; LOC, lateral occipital cortex; OFC, orbitofrontal cortex; PCC, posterior cingulate cortex; Prec, Precuneus; PVN, paraventricular thalamus; STG, superior temporal gyrus; Temp Fusiform Gyr, temporal fusiform gyrus; vmPFC, ventromedial prefrontal cortex; VTA, ventral tegmental area.
Figure 4.
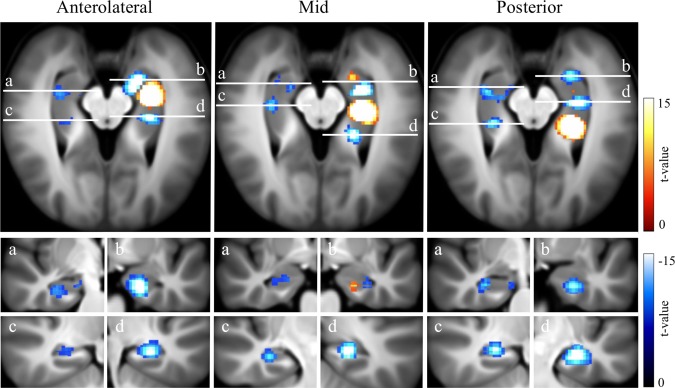
Connectivity for Anterolateral, Mid, and Posterior HPC components. Conjunction analysis results are shown.
Anteromedial and Anterior components both showed robust iFC within the hypothalamus, with differing patterns of connectivity (Fig. 3 and Table 3). For the Anteromedial component, multiple bilateral local maxima were evident in the rostral medial and paraventricular zones. Hypothalamic nuclei within 2.5 mm (the effective resolution) of connectivity clusters included the paraventricular nucleus (PVN), suprachiasmatic nucleus (SCH), supraoptic nucleus (SOX), ventromedial hypothalamus (VMH), dorsomedial hypothalamic nucleus (DMH), and mammillary bodies (MM). Connectivity was similar for right and left Anteromedial components. The right Anterior component showed negative iFC with an area corresponding to the PVN and DMH, and positive iFC with an inferior midline region corresponding to the infundibular (arcuate) nucleus. Reproducibility (test–retest reliability) for these three components was high to very high (Fig. 3 and Table 3). For the left Anterior component and Anterolateral components, iFC was not reproducible.
Table 3.
Functional connectivity between hippocampal components and the hypothalamus
| Component | Side | Cluster size (voxels) | MNI coordinates (mm) | |||||
|---|---|---|---|---|---|---|---|---|
| x | y | z | Z max | Reproducibility* (r) | Atlas | |||
| Anterior | l | – | – | – | – | – | – | – |
| r | 5 | −2 | −1 | −22 | 4.28 | 0.72 | Inf/Arc, VMH | |
| 10 | −3 | −4 | −8 | −4.34 | “ | PVN, DMH | ||
| Anteromedial | l | 97 | −3 | 3 | −13 | 7.06 | 0.81 | PVN, SCh, MPO, SO, VMH |
| r | 40 | −4 | 3 | −15 | 5.18 | 0.87 | PVN, VMH | |
| 24 | 3 | 1 | −17 | 4.82 | „ | SO | ||
| 6 | −8 | 0 | −16 | 4.62 | „ | SO | ||
| 3 | 3 | −7 | −16 | 4.44 | „ | MM | ||
Reproducibility (r) values indicate Pearson spatial correlation between discovery and confirmation samples.
Corresponding hypothalamic regions from atlas registration are shown. Abbreviations: PVN, paraventricular nucleus; SCh, suprachiasmatic nucleus; SO, supraoptic nucleus; Inf/Arc, infundibular/arcuate nucleus; MM, mammillary body; VMH, ventromedial hypothalamus; DMH, dorsomedial hypothalamus.
*p < 0.001 for all correlation coefficients.
Connectivity of Mid and Posterior HPC Components is Modified by Multivariate Analysis
Using the current multivariate analysis with dual regression, Mid and Posterior hippocampal components did not show significant whole brain or hypothalamic iFC, but did show robust and reproducible iFC within the ipsi‐ and contralateral HPC, and surrounding parahippocampal‐ and fusiform gyri (Fig. 4 and Table 2). Intrahippocampal iFC included discrete foci in proximal and distal HPC segments, and was similar for corresponding left and right components. Using a univariate analysis (similar to seed‐based), the Mid and Posterior components showed connectivity with the RSC, pre‐ and subgenual ACC, and thalamus, as well as hypothalamus and mammillary bodies. This result indicates that Mid and Posterior iFC is modified by multivariate, as opposed to univariate analysis. Using multivariate analysis, but with a different threshold, the Posterior component also showed connectivity with the PCC, precuneus, ACC, and thalamus. Altering the threshold did not affect results for the Mid component. Thus our current threshold, corrected for multiple comparisons, may account for discrepancies between current and previous results.
DISCUSSION
Hippocampal Group Independent Component Analysis
Currently, investigation of functional‐anatomical variation along the anterior‐posterior axis of the human HPC is limited by the lack of a consensus approach to defining functional subregions. We demonstrate that a data‐driven approach to this problem, namely masked hippocampal ICA, results in highly reproducible components that should be readily identified across data sets, and which generate reproducible patterns of iFC with cortical and subcortical brain regions.
The longitudinally discrete configuration of resulting hippocampal components is remarkable, given ICA does not favor any particular spatial distribution or orientation, and is reminiscent of gene expression domains in rodent [Thompson et al., 2008; Dong et al., 2009]. While the current components may lack the spatial resolution to distinguish equivalent domains in human, some broad similarities are apparent: the anterior hippocampal third included three functionally independent components, whereas the posterior, and mid thirds each comprised only one. In rodent models, the ventral CA1 subfield shows four distinct gene expression subdomains, whereas mid and dorsal CA1 each contain only one [Dong et al., 2009]. Moreover, topographically organized bidirectional projections between the lateral septal complex and hypothalamus suggest the ventral CA1 and subiculum each comprise four distinct structural‐functional subdomains, whereas mid and dorsal segments together comprise one equivalent structural‐functional domain [Lin et al., 2009]. The current results suggest a similar increase in functional‐anatomical heterogeneity in the human anterior, compared to mid, and posterior hippocampal segments.
Components were lateralized, suggesting functional independence of bilateral counterparts. While functional differences between the right and left HPC are known to exist [Fanselow and Dong, 2010; Deiana et al., 2012], to our knowledge, this is the first report in healthy subjects showing their functional independence in the resting state. Further formal tests of laterality could determine whether corresponding left and right components show distinct iFC, potentially explaining this finding. Interestingly, right compared with left components showed lower reproducibility, suggesting increased spatiotemporal variability in right HPC activity. Further analysis of component time series and spatial extents within, and across individuals may provide insight to this variability.
Intrinsic Functional Connectivity of Anterior Hippocampal Components
The current data‐driven approach extends previous seed based studies of the anterior hippocampus (aHPC). Our results support previous comparable studies, i.e. those with seeds overlapping the current Anteromedial component, in showing preferential iFC with multiple DMN regions, including the anterior and ventral mPFC, PCC, RSC, precuneus and iPL [Kahn et al., 2008; Andrews‐Hanna et al., 2010; Zarei et al., 2012]. Also consistent, a recent study of human subicular iFC found that the anterior subiculum shared stronger iFC with DMN areas compared with the posterior subiculum, which showed preferential connectivity with task‐positive brain regions [Chase et al., 2015]. Anterior hippocampal connectivity with the anterior and ventral mPFC is consistent with robust direct anatomical connectivity between the primate aHPC equivalent and mPFC areas 14, 25, and 32 [Fanselow and Dong, 2010; Aggleton, 2012]. By contrast, anterior and mid HPC showed relatively light anatomical connectivity with the RSC/PCC [Aggleton, 2012]; thus aHPC connectivity with the PCC, and other DMN regions may result from polysnaptic connectivity – potentially via the anterior mPFC, which has strong distributed connectivity with all DMN regions [Andrews‐Hanna et al., 2010]. Connectivity of the Anterior component with the anterior lateral temporal lobe and temporal pole is also supported by anatomical connectivity [Aggleton, 2012], and agrees with previous findings [Kahn et al., 2008]. The minimal extrahippocampal iFC of Anterolateral components (with multivariate analysis) likely indicates shared variance, as detailed further. Overall, cortical results support seed based iFC studies in finding dissociable aHPC subregions, which share iFC with the DMN and anterolateral systems, respectively.
We provide the first report of hippocampal‐hypothalamic connectivity, and also the first report, to our knowledge, of subregional hypothalamic iFC derived using independent component time courses (generally previous studies used whole hypothalamic seeds) [Di Perri et al., 2013; Moulton et al., 2014]. Resulting hippocampal‐hypothalamic iFC was highly reproducible, suggesting minimal contribution from physiological or scanner artifacts, which show low to moderate reproducibility [Zuo et al., 2010]. Connectivity was also subregionally specific, consistent with animal models, in which distinct ventral HPC domains topgraphically connect with distinct hypothalamic domains [Petrovich et al., 2001; Lin et al., 2009]. We took the approach of reporting all hypothalamic nuclei within the current effective resolution (2.5 mm), but note this approach could not distinguish nuclei within this area. Reported nuclei included the PVN, which contains corticotropin releasing hormone neurons, integral to the hypothalamic‐pituitary‐adrenal (HPA) axis and stress response [Ulrich‐Lai and Herman, 2009]; the arcuate nucleus, integral to appetite regulation [Betley et al., 2013], and the supraoptic nucleus, which contains vasopressin and oxytocin releasing neurons. These results are consistent with rodent models, in which the ventral HPC forms direct connections with hypothalamic regions containing these nuclei, as well as polysynaptic connections, via the lateral septal complex, bed nucleus of stria terminalis, midline thalamus, and amygdala [Petrovich et al., 2001]; similar connections exist in primate [Ding, 2013].
Anterior and Anteromedial components shared iFC with the amygdala, midline thalamus, NAcc, and VTA, in addition to their cortical and hypothalamic connectivity. This is consistent with animal models, in which these respective subcortical areas anatomically connect with the ventral HPC, with the infralimbic cortex (vmPFC), with the medial and periventricular hypothalamus, and with one another, forming a reciprocally connected forebrain network [Swanson, 1981; Groenewegen et al., 1987; Canteras and Swanson, 1992; Cullinan et al., 1993; Kishi et al., 2006; Vertes and Hoover, 2008; Ding, 2013]. Proposed roles of the ventral HPC in neuroendocrine regulation and motivational behavior involve ventral CA1 and subicular neurons interacting with cortical, subcortical and lower brain areas within this network [Moser and Moser, 1998; Strange and Dolan, 2006; Ulrich‐Lai and Herman, 2009; Fanselow and Dong, 2010; Radley, 2012]. We provide the first report including anterior hippocampal cortical, subcortical and hypothalamic connectivity, providing the means to assess equivalent functional‐connectivity in human. Our results are also broadly consistent with previous seed based studies of anterior hippocampal iFC with the NAcc, VTA and amygdala [Chen and Etkin, 2013; Kahn and Shohamy, 2013].
Intrinsic Functional Connectivity of Mid and Posterior Hippocampal Components
Connectivity of the Posterior and Mid components with the RSC, ACC, anterior thalamic nucleus, and mammillary bodies—areas known to preferentially anatomically connect with the posterior rather than anterior HPC [Aggleton, 2012]—was modified by multivariate analysis. This result does not contradict these established anatomical connections, but rather indicates that other hippocampal components in the multivariate model shared temporal variance both with these brain areas, and with the posterior hippocampus (pHPC). In particular, the Anteromedial component shared iFC with the RSC, ACC, thalamus, and mammillary bodies, potentially accounting for this effect. This result contrasts with previous studies comparing iFC of the aHPC and pHPC [Poppenk and Moscovitch, 2011; Chen and Etkin, 2013], however relevant methods were not equivalent, as they involved anatomical seeds, with distinct spatial coordinates. Overall, findings show that multivariate comparisons modify iFC for the mid, and posterior HPC, potentially due to the strong connectivity of the anteromedial segment with the DMN.
Mid and Posterior components showed robust and reproducible iFC within the ipsilateral and contralateral HPC, including regions in the aHPC. This connectivity was mostly negative, consistent with previous reports of functional antagonism between the anterior and posterior HPC [Duarte et al., 2014]. Anterior, Anteromedial and Anterolateral components showed a similar pattern. Given direct anatomical connectivity between the anterior third, and mid‐posterior two thirds of the HPC is limited, this likely reflects polysynaptic connectivity, which could arise via multiple cortical and subcortical connections between the anterior and posterior HPC [Strange et al, 2014].
Limitations and Future Directions
This study had several limitations. The current resolution was not sufficient to identify the subfield composition of the various HPC components, which may vary along the longitudinal axis. We also did not examine iFC with the entorhinal cortex, parahippocampal gyrus, or perirhinal cortex, which show selective patterns of connectivity with the aHPC and pHPC, and with respectively associated cortical areas [Moser and Moser, 1998; Libby et al., 2012; Maass et al., 2015]. In future studies, the current analysis may prove useful for investigating hippocampal contributions to stress, hypothalamic‐pituitary axis regulation, and motivational behavior, i.e., processing of threat and reward. The current results provide participant level maps of anterior hippocampal connectivity with cortical, subcortical, and hypothalamic areas that are integral to these functions, and such maps may predict functional activation in relevant tasks, or peripheral neuroendocrine measures [Mennes et al., 2010]. Future studies may also determine how these relationships are affected by stress‐related neuropsychiatric disorders proposed to involve hippocampal dysfunction.
CONCLUSIONS
Masked ICA reproducibly identifies functional hippocampal components, with a configuration that supports longitudinal segmentation of HPC function, with increased heterogeneity in the anterior HPC. Anterior hippocampal components share iFC with the DMN, anterolateral system, amygdala, midline thalamus, NAcc, VTA and periventricular hypothalamus, consistent with animal models and previous studies. Intrinsic functional connectivity of Mid and Posterior components is modified by multivariate models.
Supporting information
Supplementary Figure 1
Supplementary Figure 2
Supplementary Figure 3
Supplementary Figure 4
Supplementary Figure 5
Supplementary Figure 6
Supplementary Figure 7
Supplementary Figure 8
Supplementary Figure 9
Supplementary Figure 10
Supplementary Figure 11
Supplementary Figure 12
ACKNOWLEDGMENT
The authors thank Susanne Mueller and Marco Loggia for helpful discussions.
Conflict of Interest: The authors have no conflict of interest to declare.
REFERENCES
- Adnan A, Barnett A, Moayedi M, McCormick C, Cohn M, McAndrews MP (2015): Distinct hippocampal functional networks revealed by tractography‐based parcellation. Brain Struct Funct. [DOI] [PubMed] [Google Scholar]
- Aggleton JP (2012): Multiple anatomical systems embedded within the primate medial temporal lobe: Implications for hippocampal function. Neurosci Biobehav Rev 36:1579–1596. [DOI] [PubMed] [Google Scholar]
- Andrews‐Hanna JR, Reidler JS, Sepulcre J, Poulin R, Buckner RL (2010): Functional‐anatomic fractionation of the brain's default network. Neuron 65:550–562. [DOI] [PMC free article] [PubMed] [Google Scholar]
- Ashburner J, Friston KJ (2005): Unified segmentation. Neuroimage 26:839–851. [DOI] [PubMed] [Google Scholar]
- Baroncini M, Jissendi P, Balland E, Besson P, Pruvo JP, Francke JP, Dewailly D, Blond S, Prevot V (2012): MRI atlas of the human hypothalamus. Neuroimage 59:168–180. [DOI] [PubMed] [Google Scholar]
- Beckmann CF, Smith SM (2004): Probabilistic independent component analysis for functional magnetic resonance imaging. IEEE Trans Med Imaging 23:137–152. [DOI] [PubMed] [Google Scholar]
- Beissner F, Schumann A, Brunn F, Eisentrager D, Bar KJ (2013): Advances in functional magnetic resonance imaging of the human brainstem. Neuroimage 86:91–98. [DOI] [PubMed] [Google Scholar]
- Betley JN, Cao ZF, Ritola KD, Sternson SM (2013): Parallel, redundant circuit organization for homeostatic control of feeding behavior. Cell 155:1337–1350. [DOI] [PMC free article] [PubMed] [Google Scholar]
- Biswal BB, Mennes M, Zuo XN, Gohel S, Kelly C, Smith SM, Beckmann CF, Adelstein JS, Buckner RL, Colcombe S, Dogonowski AM, Ernst M, Fair D, Hampson M, Hoptman MJ, Hyde JS, Kiviniemi VJ, Kotter R, Li SJ, Lin CP, Lowe MJ, Mackay C, Madden DJ, Madsen KH, Margulies DS, Mayberg HS, McMahon K, Monk CS, Mostofsky SH, Nagel BJ, Pekar JJ, Peltier SJ, Petersen SE, Riedl V, Rombouts SA, Rypma B, Schlaggar BL, Schmidt S, Seidler RD, Siegle GJ, Sorg C, Teng GJ, Veijola J, Villringer A, Walter M, Wang L, Weng XC, Whitfield‐Gabrieli S, Williamson P, Windischberger C, Zang YF, Zhang HY, Castellanos FX, Milham MP (2010): Toward discovery science of human brain function. Proc Natl Acad Sci USA 107:4734–4739. [DOI] [PMC free article] [PubMed] [Google Scholar]
- Braga RM, Sharp DJ, Leeson C, Wise RJ, Leech R (2013): Echoes of the brain within default mode, association, and heteromodal cortices. J Neurosci 33:14031–14039. [DOI] [PMC free article] [PubMed] [Google Scholar]
- Canteras NS, Swanson LW (1992): Projections of the ventral subiculum to the amygdala, septum, and hypothalamus: A PHAL anterograde tract‐tracing study in the rat. J Comp Neurol 324:180–194. [DOI] [PubMed] [Google Scholar]
- Chang HH, Zhuang AH, Valentino DJ, Chu WC (2009): Performance measure characterization for evaluating neuroimage segmentation algorithms. Neuroimage 47:122–135. [DOI] [PubMed] [Google Scholar]
- Chase HW, Clos M, Dibble S, Fox P, Grace AA, Phillips ML, Eickhoff SB (2015): Evidence for an anterior‐posterior differentiation in the human hippocampal formation revealed by meta‐analytic parcellation of fMRI coordinate maps: Focus on the subiculum. Neuroimage 113:44–60. [DOI] [PMC free article] [PubMed] [Google Scholar]
- Chen AC, Etkin A (2013): Hippocampal network connectivity and activation differentiates post‐traumatic stress disorder from generalized anxiety disorder. Neuropsychopharmacology 38:1889–1898. [DOI] [PMC free article] [PubMed] [Google Scholar]
- Cole DM, Smith SM, Beckmann CF (2010): Advances and pitfalls in the analysis and interpretation of resting‐state FMRI data. Front Syst Neurosci 4:8 [DOI] [PMC free article] [PubMed] [Google Scholar]
- Coras R, Milesi G, Zucca I, Mastropietro A, Scotti A, Figini M, Muhlebner A, Hess A, Graf W, Tringali G, Blumcke I, Villani F, Didato G, Frassoni C, Spreafico R, Garbelli R (2014): 7T MRI features in control human hippocampus and hippocampal sclerosis: An ex vivo study with histologic correlations. Epilepsia 55:2003–2016. [DOI] [PubMed] [Google Scholar]
- Cullinan WE, Herman JP, Watson SJ (1993): Ventral subicular interaction with the hypothalamic paraventricular nucleus: Evidence for a relay in the bed nucleus of the stria terminalis. J Comp Neurol 332:1–20. [DOI] [PubMed] [Google Scholar]
- Deiana S, Watanabe A, Yamasaki Y, Amada N, Arthur M, Fleming S, Woodcock H, Dorward P, Pigliacampo B, Close S, Platt B, Riedel G (2012): Plasma and brain pharmacokinetic profile of cannabidiol (CBD), cannabidivarine (CBDV), Delta(9)‐tetrahydrocannabivarin (THCV) and cannabigerol (CBG) in rats and mice following oral and intraperitoneal administration and CBD action on obsessive‐compulsive behaviour. Psychopharmacology (Berl) 219:859–873. [DOI] [PubMed] [Google Scholar]
- Desikan RS, Segonne F, Fischl B, Quinn BT, Dickerson BC, Blacker D, Buckner RL, Dale AM, Maguire RP, Hyman BT, Albert MS, Killiany RJ (2006): An automated labeling system for subdividing the human cerebral cortex on MRI scans into gyral based regions of interest. Neuroimage 31:968–980. [DOI] [PubMed] [Google Scholar]
- Di Perri C, Bastianello S, Bartsch AJ, Pistarini C, Maggioni G, Magrassi L, Imberti R, Pichiecchio A, Vitali P, Laureys S, Di Salle F (2013): Limbic hyperconnectivity in the vegetative state. Neurology 81:1417–1424. [DOI] [PubMed] [Google Scholar]
- Ding SL (2013): Comparative anatomy of the prosubiculum, subiculum, presubiculum, postsubiculum, and parasubiculum in human, monkey, and rodent. J Comp Neurol 521:4145–4162. [DOI] [PubMed] [Google Scholar]
- Do Monte FH, Souza RR, Bitencourt RM, Kroon JA, Takahashi RN (2013): Infusion of cannabidiol into infralimbic cortex facilitates fear extinction via CB1 receptors. Behav Brain Res 250:23–27. [DOI] [PubMed] [Google Scholar]
- Dobromyslin VI, Salat DH, Fortier CB, Leritz EC, Beckmann CF, Milberg WP, McGlinchey RE (2012): Distinct functional networks within the cerebellum and their relation to cortical systems assessed with independent component analysis. Neuroimage 60:2073–2085. [DOI] [PMC free article] [PubMed] [Google Scholar]
- Dong HW, Swanson LW, Chen L, Fanselow MS, Toga AW (2009): Genomic‐anatomic evidence for distinct functional domains in hippocampal field CA1. Proc Natl Acad Sci USA 106:11794–11799. [DOI] [PMC free article] [PubMed] [Google Scholar]
- Duarte IC, Ferreira C, Marques J, Castelo‐Branco M (2014): Anterior/posterior competitive deactivation/activation dichotomy in the human hippocampus as revealed by a 3D navigation task. PLoS One 9:e86213 [DOI] [PMC free article] [PubMed] [Google Scholar]
- Eickhoff SB, Stephan KE, Mohlberg H, Grefkes C, Fink GR, Amunts K, Zilles K (2005): A new SPM toolbox for combining probabilistic cytoarchitectonic maps and functional imaging data. Neuroimage 25:1325–1335. [DOI] [PubMed] [Google Scholar]
- Fanselow MS, Dong HW (2010): Are the dorsal and ventral hippocampus functionally distinct structures? Neuron 65:7–19. [DOI] [PMC free article] [PubMed] [Google Scholar]
- Fox MD, Raichle ME (2007): Spontaneous fluctuations in brain activity observed with functional magnetic resonance imaging. Nat Rev Neurosci 8:700–711. [DOI] [PubMed] [Google Scholar]
- Grace AA (2010): Dopamine system dysregulation by the ventral subiculum as the common pathophysiological basis for schizophrenia psychosis, psychostimulant abuse, and stress. Neurotox Res 18:367–376. [DOI] [PMC free article] [PubMed] [Google Scholar]
- Granjeiro EM, Gomes FV, Guimaraes FS, Correa FM, Resstel LB (2011): Effects of intracisternal administration of cannabidiol on the cardiovascular and behavioral responses to acute restraint stress. Pharmacol Biochem Behav 99:743–748. [DOI] [PubMed] [Google Scholar]
- Greve DN, Fischl B (2009): Accurate and robust brain image alignment using boundary‐based registration. Neuroimage 48:63–72. [DOI] [PMC free article] [PubMed] [Google Scholar]
- Groenewegen HJ, Vermeulen‐Van der Zee E, te Kortschot A, Witter MP (1987): Organization of the projections from the subiculum to the ventral striatum in the rat. A study using anterograde transport of Phaseolus vulgaris leucoagglutinin. Neuroscience 23:103–120. [DOI] [PubMed] [Google Scholar]
- Hyvarinen A (1999): Fast and robust fixed‐point algorithms for independent component analysis. IEEE Trans Neural Netw 10:626–634. [DOI] [PubMed] [Google Scholar]
- Igelstrom KM, Webb TW, Graziano MS (2015): Neural Processes in the Human Temporoparietal Cortex Separated by Localized Independent Component Analysis. J Neurosci 35:9432–9445. [DOI] [PMC free article] [PubMed] [Google Scholar]
- Insausti R (1993): Comparative anatomy of the entorhinal cortex and hippocampus in mammals. Hippocampus 3 Spec No:19–26. [PubMed] [Google Scholar]
- Kahn I, Andrews‐Hanna JR, Vincent JL, Snyder AZ, Buckner RL (2008): Distinct cortical anatomy linked to subregions of the medial temporal lobe revealed by intrinsic functional connectivity. J Neurophysiol 100:129–139. [DOI] [PMC free article] [PubMed] [Google Scholar]
- Kahn I, Shohamy D (2013): Intrinsic connectivity between the hippocampus, nucleus accumbens, and ventral tegmental area in humans. Hippocampus 23:187–192. [DOI] [PMC free article] [PubMed] [Google Scholar]
- Kishi T, Tsumori T, Yokota S, Yasui Y (2006): Topographical projection from the hippocampal formation to the amygdala: A combined anterograde and retrograde tracing study in the rat. J Comp Neurol 496:349–368. [DOI] [PubMed] [Google Scholar]
- Kong Y, Eippert F, Beckmann CF, Andersson J, Finsterbusch J, Buchel C, Tracey I, Brooks JC (2014): Intrinsically organized resting state networks in the human spinal cord. Proc Natl Acad Sci USA 111:18067–18072. [DOI] [PMC free article] [PubMed] [Google Scholar]
- Kong Y, Jenkinson M, Andersson J, Tracey I, Brooks JC (2012): Assessment of physiological noise modelling methods for functional imaging of the spinal cord. Neuroimage 60:1538–1549. [DOI] [PubMed] [Google Scholar]
- Kuhn HW (2005): The Hungarian Method for the assignment problem. Nav Res Log 52:7–21. [Google Scholar]
- Leech R, Braga R, Sharp DJ (2012): Echoes of the brain within the posterior cingulate cortex. J Neurosci 32:215–222. [DOI] [PMC free article] [PubMed] [Google Scholar]
- Libby LA, Ekstrom AD, Ragland JD, Ranganath C (2012): Differential connectivity of perirhinal and parahippocampal cortices within human hippocampal subregions revealed by high‐resolution functional imaging. J Neurosci 32:6550–6560. [DOI] [PMC free article] [PubMed] [Google Scholar]
- Lin HC, Mao SC, Su CL, Gean PW (2009): The role of prefrontal cortex CB1 receptors in the modulation of fear memory. Cereb Cortex 19:165–175. [DOI] [PubMed] [Google Scholar]
- Maass A, Berron D, Libby LA, Ranganath C, Duzel E (2015): Functional subregions of the human entorhinal cortex. Elife 4:e06426. [DOI] [PMC free article] [PubMed] [Google Scholar]
- Mai JK, Paxinos G, Voss T (2008): Atlas of the human brain. Academic Press. [Google Scholar]
- Maruszak A, Thuret S (2014): Why looking at the whole hippocampus is not enough‐a critical role for anteroposterior axis, subfield and activation analyses to enhance predictive value of hippocampal changes for Alzheimer's disease diagnosis. Front Cell Neurosci 8:95 [DOI] [PMC free article] [PubMed] [Google Scholar]
- Mennes M, Kelly C, Zuo XN, Di Martino A, Biswal BB, Castellanos FX, Milham MP (2010): Inter‐individual differences in resting‐state functional connectivity predict task‐induced BOLD activity. Neuroimage 50:1690–1701. [DOI] [PMC free article] [PubMed] [Google Scholar]
- Mezey E, Toth ZE, Cortright DN, Arzubi MK, Krause JE, Elde R, Guo A, Blumberg PM, Szallasi A (2000): Distribution of mRNA for vanilloid receptor subtype 1 (VR1), and VR1‐like immunoreactivity, in the central nervous system of the rat and human. Proc Natl Acad Sci USA 97:3655–3660. [DOI] [PMC free article] [PubMed] [Google Scholar]
- Moser MB, Moser EI (1998): Functional differentiation in the hippocampus. Hippocampus 8:608–619. [DOI] [PubMed] [Google Scholar]
- Moulton EA, Becerra L, Johnson A, Burstein R, Borsook D (2014): Altered hypothalamic functional connectivity with autonomic circuits and the locus coeruleus in migraine. PLoS One 9:e95508 [DOI] [PMC free article] [PubMed] [Google Scholar]
- Patenaude B, Smith SM, Kennedy DN, Jenkinson M (2011): A Bayesian model of shape and appearance for subcortical brain segmentation. Neuroimage 56:907–922. [DOI] [PMC free article] [PubMed] [Google Scholar]
- Petrovich GD, Canteras NS, Swanson LW (2001): Combinatorial amygdalar inputs to hippocampal domains and hypothalamic behavior systems. Brain Res Brain Res Rev 38:247–289. [DOI] [PubMed] [Google Scholar]
- Poppenk J, Evensmoen HR, Moscovitch M, Nadel L (2013): Long‐axis specialization of the human hippocampus. Trends Cogn Sci 17:230–240. [DOI] [PubMed] [Google Scholar]
- Poppenk J, Moscovitch M (2011): A hippocampal marker of recollection memory ability among healthy young adults: Contributions of posterior and anterior segments. Neuron 72:931–937. [DOI] [PubMed] [Google Scholar]
- Radley JJ (2012): Toward a limbic cortical inhibitory network: Implications for hypothalamic‐pituitary‐adrenal responses following chronic stress. Front Behav Neurosci 6:7 [DOI] [PMC free article] [PubMed] [Google Scholar]
- Rebola J, Castelhano J, Ferreira C, Castelo‐Branco M (2012): Functional parcellation of the operculo‐insular cortex in perceptual decision making: An fMRI study. Neuropsychologia 50:3693–3701. [DOI] [PubMed] [Google Scholar]
- Smith SM, Fox PT, Miller KL, Glahn DC, Fox PM, Mackay CE, Filippini N, Watkins KE, Toro R, Laird AR, Beckmann CF (2009): Correspondence of the brain's functional architecture during activation and rest. Proc Natl Acad Sci USA 106:13040–13045. [DOI] [PMC free article] [PubMed] [Google Scholar]
- Smith SM, Nichols TE (2009): Threshold‐free cluster enhancement: addressing problems of smoothing, threshold dependence and localisation in cluster inference. Neuroimage 44:83–98. [DOI] [PubMed] [Google Scholar]
- Sohn WS, Yoo K, Jeong Y (2012): Independent component analysis of localized resting‐state functional magnetic resonance imaging reveals specific motor subnetworks. Brain Connect 2:218–224. [DOI] [PubMed] [Google Scholar]
- Stevens JS, Almli LM, Fani N, Gutman DA, Bradley B, Norrholm SD, Reiser E, Ely TD, Dhanani R, Glover EM, Jovanovic T, Ressler KJ (2014): PACAP receptor gene polymorphism impacts fear responses in the amygdala and hippocampus. Proc Natl Acad Sci USA 111:3158–3163. [DOI] [PMC free article] [PubMed] [Google Scholar]
- Strange BA, Dolan RJ (2006): Anterior medial temporal lobe in human cognition: Memory for fear and the unexpected. Cogn Neuropsychiatry 11:198–218. [DOI] [PMC free article] [PubMed] [Google Scholar]
- Strange BA, Witter MP, Lein ES, Moser EI (2014): Functional organization of the hippocampal longitudinal axis. Nat Rev Neurosci 15:655–669. [DOI] [PubMed] [Google Scholar]
- Swanson LW (1981): A direct projection from Ammon's horn to prefrontal cortex in the rat. Brain Res 217:150–154. [DOI] [PubMed] [Google Scholar]
- Tanti A, Belzung C (2013): Neurogenesis along the septo‐temporal axis of the hippocampus: Are depression and the action of antidepressants region‐specific? Neuroscience 252:234–252. [DOI] [PubMed] [Google Scholar]
- Thompson CL, Pathak SD, Jeromin A, Ng LL, MacPherson CR, Mortrud MT, Cusick A, Riley ZL, Sunkin SM, Bernard A, Puchalski RB, Gage FH, Jones AR, Bajic VB, Hawrylycz MJ, Lein ES (2008): Genomic anatomy of the hippocampus. Neuron 60:1010–1021. [DOI] [PubMed] [Google Scholar]
- Ulrich‐Lai YM, Herman JP (2009): Neural regulation of endocrine and autonomic stress responses. Nat Rev Neurosci 10:397–409. [DOI] [PMC free article] [PubMed] [Google Scholar]
- Vertes RP, Hoover WB (2008): Projections of the paraventricular and paratenial nuclei of the dorsal midline thalamus in the rat. J Comp Neurol 508:212–237. [DOI] [PubMed] [Google Scholar]
- Yushkevich PA, Amaral RS, Augustinack JC, Bender AR, Bernstein JD, Boccardi M, Bocchetta M, Burggren AC, Carr VA, Chakravarty MM, Chetelat G, Daugherty AM, Davachi L, Ding SL, Ekstrom A, Geerlings MI, Hassan A, Huang Y, Iglesias JE, La Joie R, Kerchner GA, LaRocque KF, Libby LA, Malykhin N, Mueller SG, Olsen RK, Palombo DJ, Parekh MB, Pluta JB, Preston AR, Pruessner JC, Ranganath C, Raz N, Schlichting ML, Schoemaker D, Singh S, Stark CE, Suthana N, Tompary A, Turowski MM, Van Leemput K, Wagner AD, Wang L, Winterburn JL, Wisse LE, Yassa MA, Zeineh MM (2015): Quantitative comparison of 21 protocols for labeling hippocampal subfields and parahippocampal subregions in in vivo MRI: Towards a harmonized segmentation protocol. Neuroimage 111:526–541. [DOI] [PMC free article] [PubMed] [Google Scholar]
- Zarei M, Beckmann CF, Binnewijzend MA, Schoonheim MM, Oghabian MA, Sanz‐Arigita EJ, Scheltens P, Matthews PM, Barkhof F (2012): Functional segmentation of the hippocampus in the healthy human brain and in Alzheimer's disease. Neuroimage 66C:28–35. [DOI] [PubMed] [Google Scholar]
- Zuo XN, Kelly C, Adelstein JS, Klein DF, Castellanos FX, Milham MP (2010): Reliable intrinsic connectivity networks: Test–retest evaluation using ICA and dual regression approach. Neuroimage 49:2163–2177. [DOI] [PMC free article] [PubMed] [Google Scholar]
Associated Data
This section collects any data citations, data availability statements, or supplementary materials included in this article.
Supplementary Materials
Supplementary Figure 1
Supplementary Figure 2
Supplementary Figure 3
Supplementary Figure 4
Supplementary Figure 5
Supplementary Figure 6
Supplementary Figure 7
Supplementary Figure 8
Supplementary Figure 9
Supplementary Figure 10
Supplementary Figure 11
Supplementary Figure 12