

Abstract
Disease‐specific patterns of gray matter atrophy in Alzheimer's disease (AD) and behavioral variant frontotemporal dementia (bvFTD) overlap with distinct structural covariance networks (SCNs) in cognitively healthy controls. This suggests that both types of dementia target specific structural networks. Here, we study SCNs in AD and bvFTD. We used structural magnetic resonance imaging data of 31 AD patients, 24 bvFTD patients, and 30 controls from two centers specialized in dementia. Ten SCNs were defined based on structural covariance of gray matter density using independent component analysis. We studied group differences in SCNs using F‐tests, with Bonferroni corrected t‐tests, adjusted for age, gender, and study center. Associations with cognitive performance were studied using linear regression analyses. Cross‐sectional group differences were found in three SCNs (all P < 0.0025). In bvFTD, we observed decreased anterior cingulate network integrity compared with AD and controls. Patients with AD showed decreased precuneal network integrity compared with bvFTD and controls, and decreased hippocampal network and anterior cingulate network integrity compared with controls. In AD, we found an association between precuneal network integrity and global cognitive performance (P = 0.0043). Our findings show that AD and bvFTD target different SCNs. The comparison of both types of dementia showed decreased precuneal (i.e., default mode) network integrity in AD and decreased anterior cingulate (i.e., salience) network integrity in bvFTD. This confirms the hypothesis that AD and bvFTD have distinct anatomical networks of degeneration and shows that structural covariance gives valuable insights in the understanding of network pathology in dementia. Hum Brain Mapp 37:978–988, 2016. © 2015 Wiley Periodicals, Inc.
Keywords: AD, frontotemporal lobar degeneration, gray matter, independent component analysis, magnetic resonance imaging, SCN, T1 weighted
Abbreviations
- AD
Alzheimer's disease
- ANCOVA
Analysis of covariance
- bvFTD
Behavioral variant frontotemporal dementia
- CDR
Clinical Dementia Rating scale
- FAB
Frontal assessment battery
- FSL
Functional magnetic resonance imaging of the brain software library
- FWE
Family‐Wise Error
- GDS
Geriatric depression scale
- ICA
Independent component analysis
- MMSE
Mini mental state examination
- MNI
Montreal neurological institute
- MRI
Magnetic resonance imaging
- SCN
Structural covariance network
- TFCE
Threshold‐free cluster enhancement
INTRODUCTION
The most common types of early‐onset dementia are Alzheimer's disease (AD) and behavioral variant frontotemporal dementia (bvFTD) [Ratnavalli et al., 2002]. Patients with AD typically present with deficits in episodic and working memory [McKhann, 2011], whereas bvFTD is mainly characterized by changes in behavior [Rascovsky et al., 2011].
Both types of dementia are associated with gray matter loss [Krueger et al., 2010]. In AD, gray matter atrophy is most often found in the hippocampus, precuneus, posterior cingulate cortex, parietal, and occipital brain regions [Buckner et al., 2005; Krueger et al., 2010; Seeley et al., 2009]. Patients with bvFTD show atrophy most prominent in the anterior cingulate cortex, frontoinsula, and frontal brain regions [Krueger et al., 2010; Seeley et al., 2009].
These disease‐specific patterns of gray matter atrophy spatially overlap with distinct structural covariance networks (SCNs) based on covariance of gray matter density [Seeley et al., 2009]. Studying anatomical networks allows us to investigate inter‐regional dependencies, which might provide additional valuable information to the common analyses that consider voxels separately. Network approaches have the potential to give more insights in dementia pathology than voxel‐based approaches that focus on local gray matter atrophy, since brain disorders appear not to be localized in one specific brain area, but rather in networks of a multitude of brain regions [Evans, 2013; Fornito et al., 2015].
Here, we used structural magnetic resonance imaging (MRI) to study whether SCNs differ between AD and bvFTD. The typical atrophy pattern in AD shows overlap with the default mode SCN in cognitively healthy controls and gray matter atrophy in bvFTD shows overlap with the salience SCN in controls [Seeley et al., 2009]. This spatial colocalization of atrophy and anatomical brain networks suggests that both types of dementia target specific anatomical networks. The aim of this study was to test this hypothesis that both types of dementia have distinct anatomical networks of degeneration (i.e., the default mode anatomical network in AD and the salience anatomical network in bvFTD).
MATERIALS AND METHODS
Participants
We included 31 patients with probable AD, 24 patients with probable bvFTD, and 30 control participants (Table 1). All subjects were recruited from two Dutch centers specialized in dementia: the Alzheimer Center of the VU University Medical Center Amsterdam, and the Alzheimer Center of the Erasmus University Medical Center Rotterdam, as described previously [Hafkemeijer et al., 2015].
Table 1.
Characteristics of the study population
| Characteristic | bvFTD (n=24) | AD (n=31) | HC (n=30) |
|---|---|---|---|
| Age (years) | 61.5 (7.3) | 65.3 (7.0) | 62.8 (5.0) |
| Gender (male/female) | 18/6 | 19/12 | 18/12 |
| Study center (VUMC/LUMC)a | 16/8 | 20/11 | 17/13 |
| Level of educationb | 5.1 (1.6) | 4.9 (1.3) | 5.4 (1.2) |
| Duration of symptoms (months) | 50.2 (49.2) | 41.9 (30.7) | n/a |
| CSF Total Tau (ng/L) | 321.1 (125.5) | 668.1 (385.3) | n/a |
| CSF Phospho Tau (ng/L) | 41.3 (14.2) | 84.7 (35.7) | n/a |
| CSF Amyloid Beta (ng/L) | 1019.9 (231.9) | 478.7 (121.2) | n/a |
| MMSE (max score: 30) | 24.6 (3.6) | 22.7 (2.8) | 28.7 (1.6) |
| FAB (max score: 18) | 14.1 (2.5) | 13.3 (3.4) | 17.4 (1.0) |
| CDR (max score: 3) | 0.7 (0.4) | 0.8 (0.3) | 0.0 (0.0) |
| GDS (max score: 15) | 3.8 (3.3) | 2.8 (2.9) | 1.2 (1.4) |
Abbreviations: bvFTD = behavioral variant frontotemporal dementia; AD = Alzheimer's disease; HC = healthy controls; CSF = Cerebrospinal Fluid; MMSE = Mini‐Mental State Examination; FAB = Frontal Assessment Battery; CDR = Clinical Dementia Rating Scale; GDS = Geriatric Depression Scale.
Values are means (standard deviation) for continuous variables or numbers for dichotomous variables.
Imaging was performed either in the Alzheimer Center of the VU University Medical center (VUMC) or in the Leiden University Medical Center (LUMC) in the Netherlands.
Level of education was determined on a Dutch 7‐point scale ranging from 1 (less than elementary school) to 7 (university or technical college).
All patients underwent a standardized dementia screening including medical history, informant‐based history, physical and neurological examination, blood tests, extensive neuropsychological assessment, and an MRI of the brain. Diagnoses were established in a multidisciplinary consensus meeting according to the core clinical criteria of the National Institute on Aging and the Alzheimer's Association workgroup for probable AD [McKhann, 2011] and according to the clinical diagnostic criteria for bvFTD [Rascovsky et al., 2011]. Cerebral spinal fluid measures of amyloid beta, total tau, and phosphorylated tau were available to gain diagnostic certainty. To minimize center effects, all diagnoses were re‐evaluated in a panel including clinicians from both Alzheimer centers.
The control participants were screened to exclude memory complaints, drugs‐ or alcohol abuse, major psychiatric disorder, and neurological or cerebrovascular diseases. They underwent an assessment including medical history, physical examination, extensive neuropsychological assessment, and an MRI of the brain, comparable to the work‐up of the patients.
This study was performed in compliance with the Code of Ethics of the World Medical Association (Declaration of Helsinki). Ethical approval was obtained from the local ethics committees [VU University Medical Center Amsterdam (CWO‐nr 11‐04, METC‐nr 2011/55) and Leiden University Medical Center (2011/55 P11.146)]. Written informed consent from all participants was obtained.
Data Acquisition
All participants underwent an MRI of the brain on a 3 Tesla scanner either in the VU University Medical Center (Signa HDxt, GE Healthcare, Milwaukee, WI), or in the Leiden University Medical Center (Achieva, Philips Medical Systems, Best, The Netherlands), using a standard eight‐channel head coil.
For each participant, a three‐dimensional T1‐weighted anatomical image was acquired. Imaging parameters in the VU University Medical Center were: TR = 7.8 msec, TE = 3 msec, flip angle = 12º, 180 slices, resulting in a voxel size of 0.98 × 0.98 × 1.00 mm. Imaging parameters in the Leiden University Medical Center were: TR = 9.8 msec, TE = 4.6 msec, flip angle = 8°, 140 slices, resulting in a voxel size of 0.88 × 0.88 × 1.20 mm.
Data Analysis
Before analysis, all MRI scans were submitted to a visual quality control check to ensure that no gross artifacts were present in the data. Data analysis was performed with Functional Magnetic Resonance Imaging of the Brain Software Library (FSL 5.0.1, Oxford, United Kingdom) [Smith et al., 2004].
Preprocessing
The SCNs analyses were performed as described in our previous work [Hafkemeijer et al., 2014]. First, nonbrain tissue (e.g. scalp) was removed from the T1‐weighted images using the brain extraction tool as implemented in FSL [Smith, 2002]. Next, tissue‐type segmentation was performed using the voxel‐based morphometry tool [Ashburner and Friston, 2000]. We performed a control check after each preprocessing step to ensure appropriate brain extraction and tissue‐type segmentation. To correct for the partial volume effect (i.e., voxels “containing” more than one tissue type), the tissue‐type segmentation was carried out with partial volume estimation. For each partial volume voxel, the proportion of each tissue type is estimated, that is, a partial volume vector is formed, with each element being a “fraction” of a specific tissue type and having a sum of one [Zhang et al., 2001]. The segmented images have values that indicate the probability of a given tissue type.
The gray matter partial volume images were aligned to the gray matter MNI 152 standard space image (Montreal Neurological Institute, Montreal, QC, Canada) [Jenkinson et al., 2002], followed by nonlinear registration [Andersson et al., 2007]. The resulting images were averaged to create a study‐specific gray matter template, to which the native gray matter segmented images were nonlinearly re‐registered [Ashburner and Friston, 2000; Good et al., 2001]. As a result of nonlinear spatial registration, the volume of some brain structures may grow, whereas others may shrink. To correct for these enlargements and contractions, a further processing step (modulation) was applied, as recommended [Ashburner and Friston, 2000; Good et al., 2001]. In this additional step, each voxel of each registered gray matter image was multiplied by the Jacobian of the warp field, which defines the direction (larger or smaller) and the amount of modulation. The modulated segmented images were finally spatially smoothed with an isotropic Gaussian kernel with a sigma of 3 mm.
Gray Matter Volume
To study group differences in local voxel‐based gray matter volume between patient groups, a general linear model approach using two‐sample t‐tests was applied, including age, gender, and study center as covariate in the statistical model. Voxel‐wise non‐parametric permutation testing [Nichols and Holmes, 2001] with 5,000 permutations was performed using FSL randomise correcting for multiple comparisons across space (statistical threshold was set at P < 0.05, Family‐Wise Error (FWE) corrected), using the threshold‐free cluster enhancement (TFCE) technique [Smith and Nichols, 2009].
Structural Covariance Networks
The modulated gray matter images in MNI space were concatenated into a four dimensional data set on which an independent component analysis (ICA) was applied using the multivariate exploratory linear optimised decomposition into independent components tool [Beckmann et al., 2005]. To avoid bias towards any particular group, networks were defined on gray matter images of three groups of equal size (i.e., 24 bvFTD patients, 24 AD patients (randomly selected), and 24 controls (randomly selected)), balanced between centers. ICA is a statistical technique that decomposes a set of signals into spatial component maps of maximal statistical independence [Beckmann and Smith, 2004]. When applied on gray matter images of different subjects, this method defines spatial components based on the structural covariance of gray matter density among subjects (i.e., SCNs) [Douaud et al., 2014; Hafkemeijer et al., 2014], without a priori selected regions of interest. Structural covariance and resting state functional networks are in general investigated using eight to ten components [Beckmann et al., 2005; Damoiseaux et al., 2006; Segall et al., 2012; Smith et al., 2009; Zielinski et al., 2012]. Therefore, in this study the ICA output was restricted to ten components.
A mixture model was used to assign significance to individual voxels within a spatial map, using a standard threshold level of 0.5 [Beckmann and Smith, 2004]. This indicates that a voxel “survives” thresholding as soon as the probability of being in the ‘nonbackground’ class exceeds the probability of being in the ‘background’ noise class. A threshold of 0.5 indicates that an equal loss is placed on false positives and false negatives. Anatomical regions of the SCNs were determined using the Harvard‐Oxford cortical and subcortical structures atlas integrated in FSL.
Statistical Analysis
The ICA approach provides for the 24 bvFTD patients, 24 AD patients, and 24 controls an index that reflects the degree to which each subject expresses the identified network pattern (i.e., SCN integrity score) [Segall et al., 2012]. We want to study cross‐sectional group differences in SCN integrity using data of all participants (i.e., 31 AD patients, 24 bvFTD patients, and 30 controls). Therefore, an additional step was performed to obtain the SCN integrity scores of these participants. Individual SCN integrity was calculated using the four‐dimensional data set of gray matter images in a spatial regression against the ten SCN probability maps (general linear model approach integrated in FSL) [Filippini et al., 2009]. This procedure gives for all subjects the SCN integrity scores, i.e., the beta weights of the regression analysis, which can be negative or positive. The higher the score, the stronger the expression of the identified SCN. Group differences in SCN integrity were studied using analysis of covariance (ANCOVA), adjusted for age, gender, and study center, with post hoc Bonferroni corrected t‐tests (IBM SPSS Statistics Version 20, IBM Corp., Somers, NY, USA). To further correct for multiple network testing, the statistical threshold was set at P < 0.0025 (= 0.05/20, based on 10 × 2 = 20 comparisons (ten networks, two‐tailed)).
Associations with Cognitive Performance
We investigated the possible associations between SCN integrity and global cognitive performance, mini mental state examination (MMSE) score [Folstein et al., 1975] in AD and frontal assessment battery (FAB) score [Dubois et al., 2000] in bvFTD, using linear regression analyses (IBM SPSS Statistics Version 20, IBM Corp., Somers, NY, USA), adjusted for age, gender, and study center (statistical threshold was set at P < 0.05).
RESULTS
Demographic Characteristics
Demographic data for all participants are summarized in Table 1. There were no significant differences between the groups with regard to age, gender, study center distribution, level of education, or duration of symptoms (all P > 0.05). As expected, both dementia groups performed worse on cognitive tests compared with controls (all P < 0.05). Patients with AD performed worse on MMSE compared with bvFTD patients (P = 0.037). FAB (P = 0.367), Clinical Dementia Rating Scale (CDR, P = 0.455), and Geriatric Depression Scale (GDS, P = 0.279) scores did not differ significantly between AD and bvFTD.
Regional Gray Matter Volume
The regional voxel‐based gray matter analysis revealed group differences in gray matter volume (Fig. 1). Patients with AD showed less gray matter compared with bvFTD in precuneal and posterior cingulate cortex (Fig. 1A). Patients with bvFTD had less gray matter compared with AD in insular cortex (Fig. 1B).
Figure 1.
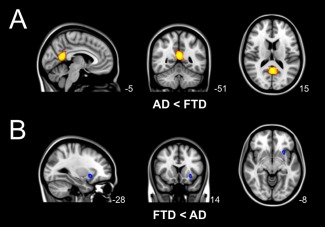
Group differences in regional voxel‐based gray matter volume. Differences in gray matter volume between behavioral variant frontotemporal dementia (FTD) and Alzheimer's disease (AD) (TFCE, FWE‐corrected). (A) Local gray matter was decreased in patients with AD compared with patients with bvFTD in precuneal and posterior cingulate cortex (yellow). (B) Local gray matter was decreased in patients with bvFTD compared with AD in insular cortex (blue).
Structural Covariance Networks
Ten SCNs were defined based on gray matter structural covariance (Fig. 2A, Table 2): (a) anterior cingulate network, (b) precuneal network, (c) parahippocampal network, (d) hippocampal network, (e) subcortical network, (f) lateral occipital network, (g) precentral network, (h–j) cerebellar networks.
Figure 2.
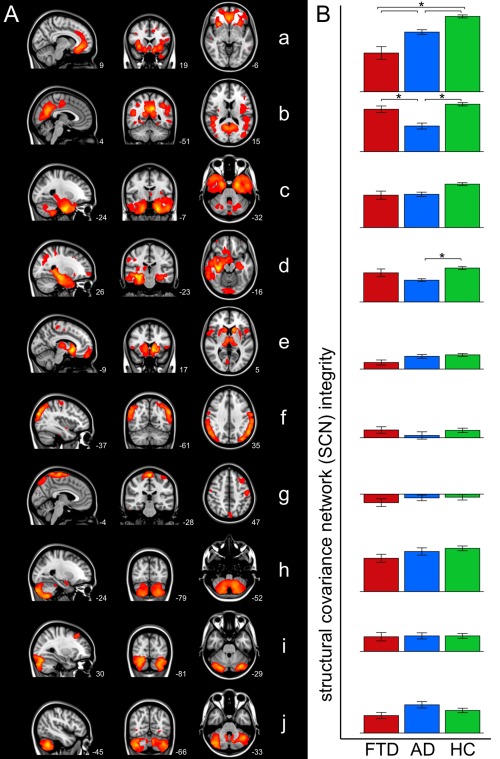
Group differences in structural covariance networks. (A) Overview of SCNs defined on gray matter structural covariance. Networks are overlaid on the most informative sagittal, coronal, and transverse slices of the MNI‐152 standard anatomical image (x, y, and z coordinates of each slice are given). (B) Bar graphs show SCN integrity in patients with behavioral variant frontotemporal dementia (FTD, red), patients with Alzheimer's disease (AD, blue), and healthy controls (HC, green) (± standard error). Group differences were found in anterior cingulate network (a), precuneal network (b), and hippocampal network (d) (indicated with asterisks, Bonferroni corrected, adjusted for age, gender, and study center).
Table 2.
Brain clusters of the structural covariance networks
| Brain clustera | MNI coordinates | |||
|---|---|---|---|---|
| x | y | z | ||
| Network a | Anterior cingulate cortex | −2 | 34 | −14 |
| cluster also contains insular cortex, paracingulate | ||||
| gyrus, and frontal medial cortex | ||||
| (Inferior temporal gyrus) | 46 | −6 | −50 | |
| Paracingulate gyrus | −6 | 8 | 46 | |
| (Middle frontal gyrus) | −24 | −2 | 48 | |
| (Superior frontal gyrus) | 20 | 32 | 36 | |
| Network b | Precuneal cortex | −8 | −52 | 34 |
| cluster also contains posterior cingulate cortex | ||||
| Lateral occipital cortex | 52 | −74 | −2 | |
| Lingual gyrus | −22 | −60 | −10 | |
| (Inferior temporal gyrus) | 48 | −22 | −18 | |
| (Middle frontal gyrus) | −36 | 20 | 24 | |
| Network c | Parahippocampal gyrus | −24 | −8 | −38 |
| cluster also contains hippocampus, temporal fusiform | ||||
| cortex, inferior temporal gyrus, and temporal pole | ||||
| (Cuneal cortex) | 2 | −88 | 30 | |
| Cerebellum | 0 | −86 | −34 | |
| Network d | Hippocampus | 36 | −26 | −14 |
| cluster also contains temporal fusiform cortex and | ||||
| temporal pole | 0 | −92 | −10 | |
| Occipital pole | 42 | 14 | 56 | |
| (Middle frontal gyrus) | 26 | 60 | −6 | |
| (Frontal pole) | −30 | −74 | 20 | |
| Lateral occipital cortex | ||||
| Network e | Nucleus accumbens | −10 | 14 | −8 |
| cluster also contains caudate nucleus, putamen, and | ||||
| thalamus | ||||
| Frontal pole | 4 | 62 | −12 | |
| Precentral gyrus | −4 | −10 | 54 | |
| (Intracalcarine cortex) | 8 | −74 | 4 | |
| Inferior frontal gyrus | 56 | 10 | 4 | |
| Network f | Lateral occipital cortex | −36 | −84 | 28 |
| Supramarginal gyrus | 56 | −30 | 46 | |
| (Superior parietal lobule) | −18 | −54 | 74 | |
| Network g | Precentral gyrus | 0 | −28 | 72 |
| cluster also contains precuneal cortex and middle | ||||
| frontal gyrus | −58 | −4 | −32 | |
| (Middle temporal gyrus) | −14 | −74 | −38 | |
| (Cerebellum) | −18 | 42 | 34 | |
| (Frontal pole) | ||||
| Network h | Cerebellum | −18 | −62 | −56 |
| Amygdala | −20 | −6 | −18 | |
| (Putamen) | 34 | −14 | −10 | |
| Network i | Cerebellum | 34 | −74 | −22 |
| cluster also contains lateral occipital cortex | ||||
| Middle frontal gyrus | 32 | 28 | 46 | |
| (Frontal pole) | −32 | 52 | 22 | |
| Network j | Cerebellum | 36 | −68 | −44 |
| (Pallidum) | 24 | −4 | −6 | |
| (Precentral gyrus) | 40 | −16 | 56 | |
| (Insular cortex) | −34 | −24 | −2 | |
Abbreviation: MNI, Montreal Neurological Institute 152 standard space image.
Each SCN is divided in brain clusters using the cluster tool integrated in FSL. MNI x‐, y‐, and z‐coordinates of each cluster are given. Brain structures are anatomically identified using the Harvard‐Oxford atlas integrated in FSL. Figure 2 shows the most informative sagittal, coronal, and transverse slices. Structures in parentheses in the table are not visible in Figure 2.
SCN Group Differences
Cross‐sectional group differences were found in three SCNs: the anterior cingulate network (SCN a), the precuneal network (SCN b), and the hippocampal network (SCN d) (Fig. 2B). The results of post hoc testing showed decreased anterior cingulate network (SCN a) integrity in bvFTD compared with AD (P = 0.0002) and compared with controls (P < 0.0001). Patients with AD showed decreased precuneal network (SCN b) integrity compared with bvFTD (P = 0.0002) and compared with controls (P < 0.0001), and decreased anterior cingulate network (SCN a) and hippocampal network (SCN d) integrity compared with controls (P = 0.0006, P = 0.0022). No cross‐sectional group differences were found in the other seven networks (SCNs c, e‐j).
Associations with Global Cognitive Performance
We found a positive association between SCN integrity and MMSE score in the precuneal network (SCN b) in AD (P = 0.0043, R 2 = 0.316, Beta = 0.508). No associations between SCN integrity and FAB scores were found (P > 0.05).
DISCUSSION
This is the first study that compares networks of structural covariance between patients with AD and patients with bvFTD. Our results show that AD and bvFTD are associated with different networks of degeneration. The comparison of both types of dementia showed decreased anterior cingulate network integrity in bvFTD and decreased precuneal network integrity in AD.
We used structural MRI data to study anatomical networks based on structural covariance of gray matter density. Until now structural covariance had not been compared between patients with AD and patients with bvFTD. However, the spatial colocalization of local gray matter atrophy in AD and bvFTD with the topography of SCNs in cognitively healthy elderly [Seeley et al., 2009], suggests that both types of dementia target different SCNs (i.e., the default mode network in AD and the salience network in bvFTD).
In bvFTD, we found decreased anterior cingulate network integrity compared with AD and controls. This SCN includes the anterior cingulate cortex, insular cortex, paracingulate gyrus, and frontal medial cortex. These brain areas show typical bvFTD pathology [Krueger et al., 2010; Seeley et al., 2009], with more severe gray matter atrophy in the anterior cingulate cortex and insula in bvFTD compared with AD [Rabinovici et al., 2008]. Deficits in social‐emotional functioning, which are common in bvFTD, rely on structures including the anterior cingulate cortex and insula [Broe et al., 2003; Rosen et al., 2002]. In general, SCNs show spatial overlap with functional connectivity networks [Segall et al., 2012]. Visual inspection of our data shows overlap between the anterior cingulate SCN and the salience functional connectivity network, which is related to social‐emotional processing [Seeley et al., 2007]. Decreased functional connectivity within the salience network has been observed in bvFTD [Agosta et al., 2013; Borroni et al., 2012; Farb et al., 2013; Filippi et al., 2013; Rytty et al., 2013; Zhou et al., 2010].
In AD, we found decreased precuneal network integrity compared with bvFTD and controls. This SCN includes the precuneal cortex, posterior cingulate cortex, lateral occipital cortex, and lingual gyrus, which are brain areas that typically show AD pathology [Buckner et al., 2005; Krueger et al., 2010; Seeley et al., 2009]. Our findings are in line with the observations of decreased network integrity [Montembeault et al., 2015; Spreng and Turner, 2013; Tijms et al., 2013] and cortical shrinking [He et al., 2008; Reid and Evans, 2013] in this network in AD compared with controls. Visual inspection shows overlap between the precuneal SCN and the default mode functional connectivity network, which is related to episodic memory [Buckner et al., 2005; Seeley et al., 2009]. Decreased functional connectivity within the default mode network has been found in AD [Balthazar et al., 2014; Greicius et al., 2004; Hafkemeijer et al., 2012; Zhou et al., 2010]. In addition to decreased precuneal network integrity, we found decreased hippocampal network integrity in AD compared with controls. This network includes the hippocampus, temporal fusiform cortex, occipital and temporal pole, brain areas that show typical AD pathology [Buckner et al., 2005; Krueger et al., 2010; Seeley et al., 2009].
SCNs show spatial overlap with functional connectivity networks [Segall et al., 2012]. In addition to structural covariance, functional connections were studied using resting state fMRI data of the patients included in the current study [Hafkemeijer et al., 2015]. We showed that functional connections are different between AD and bvFTD, but less abundant than in the current SCN study. This suggests that SCNs are more sensitive to detect average dementia network pathology in the mild to moderate stage.
We investigated whether SCN integrity is related with cognitive performance. The MMSE score [Folstein et al., 1975], which is a general measurement of cognitive performance, and the integrity of the precuneal SCN are positively associated in AD, which is in line with our expectations. This relationship between SCN integrity and global cognitive performance, suggest the potential of SCNs to monitor disease severity. However, MMSE is a general screening tool and should not be regarded as an extensive neuropsychological assessment. We expected to find an association between FAB score [Dubois et al., 2000], which is a general screening tool for bvFTD, and the integrity of the anterior cingulate network. The inability to find this association might be related to the relatively small number of subjects that was included in the bvFTD group and the more limited range in FAB scores. Further research is recommended to study whether SCN integrity is related to dysfunction in specific cognitive domains and to investigate its potential to monitor disease progression.
The whole‐brain gray matter networks were based on structural covariance of gray matter density, using the ICA method [Beckmann et al., 2005]. This multivariate approach takes into account inter‐regional dependencies rather than the common analyses that consider voxels separately. Multivariate approaches have the potential to give more insights in dementia pathology than univariate approaches that focused on local gray matter atrophy, since brain disorders appear not to be localized in one specific brain area, but rather in networks of a multitude of brain regions [Evans, 2013; Fornito et al., 2015]. Cognitive dysfunction might not just be the consequence of localized brain damage, but of a damaged brain network as well. Therefore, studying the brain as a network of connected regions might give valuable information. Analyzing networks in dementia increases sensitivity compared with regional voxel‐based methods [Rombouts et al., 2009]. The current study also suggests a higher sensitivity of multivariate SCNs to detect disease‐specific patterns.
An advantage of the ICA approach is that it defines fully automatically spatial components without a priori selected region of interest. However, a limitation of this technique is that the number of components to estimate (i.e., the number of SCNs) is arbitrarily chosen. The topic of choosing the number of components and the effect of the dimensionality on the statistical results is currently an active area of research. There is no consensus on the optimal number of components [Cole et al., 2010], which may vary depending on the data and the research question. In the current study, we decided to use a dimensionality within the range of the most often applied dimensionality in studies of brain networks, that is use eight to ten components [Beckmann et al., 2005; Damoiseaux et al., 2006; Segall et al., 2012; Smith et al., 2009; Zielinski et al., 2012]. However, varying the dimensionality may impact the spatial organization of the networks. For example, increasing the dimensionality will split networks into several subnetworks.
In the current study, we decided to use all available data to define the SCNs, i.e., we used three equal‐sized groups including both patients and controls for the ICA approach. Although network approaches are widely applied, the way to define networks has not been standardized [Griffanti et al., 2015]. Brain networks can be defined in subjects from all groups or on the control subjects only [Jafri et al., 2008], with both approaches having their own advantages. Using all groups and therefore more data may increase the robustness of the defined networks. However, a potential disadvantage is its decreased sensitivity for group differences [Griffanti et al., 2015; Rytty et al., 2013].
A limitation of our study is the possibility of misdiagnosis of the patients. The diagnosis FTD or AD can only be confirmed by brain autopsy after death. In this study, postmortem data were not available. Nevertheless, all patients underwent an extensive dementia screening and were evaluated in a multidisciplinary panel including clinicians from different centers specialized in dementia. Only dementia patients that fulfilled the most recent clinical criteria for probable bvFTD [Rascovsky et al., 2011] and probable AD [McKhann, 2011] were included in the present study.
CONCLUSION
This is the first study that used structural MRI data to compare whole‐brain networks of gray matter structural covariance between patients with AD and patients with bvFTD. Our findings show that AD and bvFTD target different SCNs. The comparison of both types of dementia showed bvFTD pathology in the anterior cingulate network (i.e., salience network) and AD pathology in the precuneal network (i.e., default mode network). This confirms the hypothesis that AD and bvFTD have specific anatomical networks of degeneration and shows that structural covariance gives valuable insights in the understanding of network pathology in dementia.
W. van der Flier has received research support from Boehringer Ingelheim, Piramal Imaging, Roche BV, Janssen‐Stellar, and speaker honoraria from Boehringer Ingelheim. All funds were paid to her institution. H. Vrenken has received research support from Merck‐Serono, Novartis, and Pfizer, and speaker honoraria from Novartis. All funds were paid to his institution. F. Barkhof serves/has served on the advisory boards of: Bayer‐Schering Pharma, Sanofi‐Aventis, Biogen Idec, UCB, Merck‐Serono, Novaritis, and Roche. He has been a speaker at symposia organized by the Serono Symposia Foundation. For all his activities he receives no personal compensation. P. Scheltens serves/has served on the advisory boards of: Genentech, Novaritis, Roche, Danone, Nutricia, Baxter and Lundbeck. He has been a speaker at symposia organized by Lundbeck, Merz, Danone, Novartis, Roche and Genentech. He serves on the editorial board of Alzheimer's Research & Therapy and Alzheimer's Disease and Associated Disorders. And he is a member of the scientific advisory board of the EU Joint Programming Initiative and the French National Plan Alzheimer. For all his activities he receives no personal compensation. A. Hafkemeijer, C. Möller, E. Dopper, L. Jiskoot, A. van den Berg‐Huysmans, J. van Swieten, Y. Pijnenburg, J. van der Grond, and S. Rombouts report no conflicts of interest.
REFERENCES
- Agosta F, Sala S, Valsasina P, Meani A, Canu E, Magnani G, Cappa SF, Scola E, Quatto P, Horsfield MA, Falini A, Comi G, Filippi M (2013): Brain network connectivity assessed using graph theory in frontotemporal dementia. Neurology 81:134–143. [DOI] [PubMed] [Google Scholar]
- Andersson JLR, Jenkinson M, Smith S (2007): Non‐linear registration aka Spatial normalisation. FMRIB Tech Rep TR07JA2 from http://www.fmrib.ox.ac.uk/analysis/techrep. Last accessed June 26, 2015. [Google Scholar]
- Ashburner J, Friston KJ (2000): Voxel‐based morphometry ‐ the methods. Neuroimage 11:805–821. [DOI] [PubMed] [Google Scholar]
- Balthazar MLF, de Campos BM, Franco AR, Damasceno BP, Cendes F (2014): Whole cortical and default mode network mean functional connectivity as potential biomarkers for mild Alzheimer's disease. Psychiatry Res 221:37–42. [DOI] [PubMed] [Google Scholar]
- Beckmann CF, Smith SM (2004): Probabilistic independent component analysis for functional magnetic resonance imaging. IEEE Trans Med Imaging 23:137–152. [DOI] [PubMed] [Google Scholar]
- Beckmann CF, Deluca M, Devlin JT, Smith SM (2005): Investigations into resting‐state connectivity using independent component analysis. Phil Trans R Soc B 360:1001–1013. [DOI] [PMC free article] [PubMed] [Google Scholar]
- Borroni B, Alberici A, Cercignani M, Premi E, Serra L, Cerini C, Cosseddu M, Pettenati C, Turla M, Archetti S, Gasparotti R, Caltagirone C, Padovani A, Bozzali M (2012): Granulin mutation drives brain damage and reorganization from preclinical to symptomatic FTLD. Neurobiol Aging 33:2506–2520. [DOI] [PubMed] [Google Scholar]
- Broe M, Hodges JR, Schofield E, Shepherd CE, Kril JJ, Halliday GM (2003): Staging disease severity in pathologically confirmed cases of frontotemporal dementia. Neurology 60:1005–1011. [DOI] [PubMed] [Google Scholar]
- Buckner RL, Snyder AZ, Shannon BJ, LaRossa G, Sachs R, Fotenos AF, Sheline YI, Klunk WE, Mathis CA, Morris JC, Mintun MA (2005): Molecular, structural, and functional characterization of Alzheimer's disease: Evidence for a relationship between default activity, amyloid, and memory. J Neurosci 25:7709–7717. [DOI] [PMC free article] [PubMed] [Google Scholar]
- Cole DM, Smith SM, Beckmann CF (2010): Advances and pitfalls in the analysis and interpretation of resting‐state fMRI data. Front Syst Neurosci 4:1–15. [DOI] [PMC free article] [PubMed] [Google Scholar]
- Damoiseaux JS, Rombouts SARB Barkhof F, Scheltens P, Stam CJ, Smith SM Beckmann CF (2006): Consistent resting‐state networks across healthy subjects. Proc Natl Acad Sci USA 103:13848–13853. [DOI] [PMC free article] [PubMed] [Google Scholar]
- Douaud G, Groves AR, Tamnes CK, Westlye LT, Duff EP, Engvig A, Walhovd KB, James A, Gass A, Monsch AU, Matthews PM, Fjell AM, Smith SM, Johansen‐Berg H (2014): A common brain network links development, aging, and vulnerability to disease. Proc Natl Acad Sci USA 111:17648–17653. [DOI] [PMC free article] [PubMed] [Google Scholar]
- Dubois B, Slachevsky A, Litvan I, Pillon B (2000): The FAB: A frontal assessment battery at bedside. Neurology 55:1621–1626. [DOI] [PubMed] [Google Scholar]
- Evans AC (2013): Networks of anatomical covariance. Neuroimage 80:489–504. [DOI] [PubMed] [Google Scholar]
- Farb NAS, Grady CL, Strother S, Tang‐Wai DF, Masellis M, Black S, Freedman M, Pollock BG, Campbell KL, Hasher L, Chow TW (2013): Abnormal network connectivity in frontotemporal dementia: Evidence for prefrontal isolation. Cortex 49:1856–1873. [DOI] [PubMed] [Google Scholar]
- Filippi M, Agosta F, Scola E, Canu E, Magnani G, Marcone A, Valsasina P, Caso F, Copetti M, Comi G, Cappa SF, Falini A (2013): Functional network connectivity in the behavioral variant of frontotemporal dementia. Cortex 49:2389–2401. [DOI] [PubMed] [Google Scholar]
- Filippini N, MacIntosh BJ, Hough MG, Goodwin GM, Frisoni GB, Smith SM, Matthews PM, Beckmann CF, Mackay CE (2009): Distinct patterns of brain activity in young carriers of the APOE‐epsilon4 allele. Proc Natl Acad Sci USA 106:7209–7214. [DOI] [PMC free article] [PubMed] [Google Scholar]
- Folstein MF, Folstein SE, McHugh PR (1975): Mini‐mental state: A practical method for grading the cognitive state of patients for the clinician. J Psychiat Res 12:189–198. [DOI] [PubMed] [Google Scholar]
- Fornito A, Zalesky A, Breakspear M (2015): The connectomics of brain disorders. Nat Rev Neurosci 16:159–172. [DOI] [PubMed] [Google Scholar]
- Good CD, Johnsrude IS, Ashburner J, Henson RN, Friston KJ, Frackowiak RS (2001): A voxel‐based morphometric study of ageing in 465 normal adult human brains. Neuroimage 14:21–36. [DOI] [PubMed] [Google Scholar]
- Greicius MD, Srivastava G, Reiss AL, Menon V (2004): Default‐mode network activity distinguishes Alzheimer's disease from healthy aging: Evidence from functional MRI. Proc Natl Acad Sci USA 101:4637–4642. [DOI] [PMC free article] [PubMed] [Google Scholar]
- Griffanti L, Rolinski M, Szewczyk‐Krolikowski K, Menke RA, Filippini N, Zamboni G, Jenkinson M, Hu MTM, Mackay CE (2015): Challenges in the reproducibility of clinical studies with resting state fMRI: An example in early Parkinson's disease. Neuroimage 16:704–713. [DOI] [PMC free article] [PubMed] [Google Scholar]
- Hafkemeijer A, van der Grond J, Rombouts SARB (2012): Imaging the default mode network in aging and dementia. Biochim Biophys Acta 1822:431–441. [DOI] [PubMed] [Google Scholar]
- Hafkemeijer A, Altmann‐Schneider I, de Craen AJM, Slagboom PE van der Grond J, Rombouts SARB (2014): Associations between age and gray matter volume in anatomical brain networks in middle‐aged to older adults. Aging Cell 13:1068–1074. [DOI] [PMC free article] [PubMed] [Google Scholar]
- Hafkemeijer A, Möller C, Dopper EG, Jiskoot LC, Schouten M, Swieten JC, Van Flier WM, Van Der Vrenken H, Pijnenburg Ya, Barkhof F, Scheltens P, Grond J Van Der Rombouts SA (2015): Resting state functional connectivity differences between behavioral variant frontotemporal dementia and Alzheimer's disease. Front Hum Neurosci 9:1–12. [DOI] [PMC free article] [PubMed] [Google Scholar]
- He Y, Chen Z, Evans A (2008): Structural insights into aberrant topological patterns of large‐scale cortical networks in Alzheimer's disease. J Neurosci 28:4756–4766. [DOI] [PMC free article] [PubMed] [Google Scholar]
- Jafri M, Pearlson G, Stevens M, Calhoun V (2008): A method for functional network connectivity among spatially independent resting‐state components in schizophrenia. Neuroimage 39:1666–1681. [DOI] [PMC free article] [PubMed] [Google Scholar]
- Jenkinson M, Bannister P, Brady M, Smith S (2002): Improved optimization for the robust and accurate linear registration and motion correction of brain images. Neuroimage 17:825–841. [DOI] [PubMed] [Google Scholar]
- Krueger CE, Dean DL, Rosen HJ, Halabi C, Weiner M, Miller BL, Kramer JH (2010): Longitudinal rates of lobar atrophy in frontotemporal dementia, semantic dementia, and Alzheimer's disease. Alzheimer Dis Assoc Disord 24:43–48. [DOI] [PMC free article] [PubMed] [Google Scholar]
- McKhann GM (2011): Changing concepts of Alzheimer disease. Jama 305:2458–2459. [DOI] [PubMed] [Google Scholar]
- Montembeault M, Rouleau I, Provost J‐S, Brambati SM (2015): Altered gray matter structural covariance networks in early stages of Alzheimer's disease. Cereb Cortex 1–13. [DOI] [PMC free article] [PubMed] [Google Scholar]
- Nichols TE, Holmes AP (2001): Nonparametric permutation tests for functional neuroimaging: A primer with examples. Hum Brain Mapp 15:1–25. [DOI] [PMC free article] [PubMed] [Google Scholar]
- Rabinovici GD, Seeley WW, Kim EJ, Gorno‐Tempini ML, Rascovsky K, Pagliaro TA, Allison SC, Halabi C, Kramer JH, Johnson JK, Weiner MW, Forman MS, Trojanowski JQ, DeArmond SJ, Miller BL, Rosen HJ (2008): Distinct MRI atrophy patterns in autopsy‐proven Alzheimer's disease and frontotemporal lobar degeneration. Am J Alzheimers Dis Other Demen 22:474–488. [DOI] [PMC free article] [PubMed] [Google Scholar]
- Rascovsky K, Hodges JR, Knopman D, Mendez MF, Kramer JH, Neuhaus J, van Swieten JC, Seelaar H, Dopper EGP, Onyike CU, Hillis AE, Josephs KA, Boeve BF, Kertesz A, Seeley WW, Rankin KP, Johnson JK, Gorno‐Tempini M‐L, Rosen H, Prioleau‐Latham CE, Lee A, Kipps CM, Lillo P, Piguet O, Rohrer JD, Rossor MN, Warren JD, Fox NC, Galasko D, Salmon DP, Black SE, Mesulam M, Weintraub S, Dickerson BC, Diehl‐Schmid J, Pasquier F, Deramecourt V, Lebert F, Pijnenburg Y, Chow TW, Manes F, Grafman J, Cappa SF, Freedman M, Grossman M, Miller BL (2011): Sensitivity of revised diagnostic criteria for the behavioural variant of frontotemporal dementia. Brain 134:2456–2477. [DOI] [PMC free article] [PubMed] [Google Scholar]
- Ratnavalli E, Brayne C, Dawson K, Hodges JR (2002): The prevalence of frontotemporal dementia. Neurology 58:1615–1621. [DOI] [PubMed] [Google Scholar]
- Reid AT, Evans AC (2013): Structural networks in Alzheimer's disease. Eur Neuropsychopharmacol 23:63–77. [DOI] [PubMed] [Google Scholar]
- Rombouts SARB, Damoiseaux JS, Goekoop R, Barkhof F, Scheltens P, Smith SM, Beckmann CF (2009): Model‐free group analysis shows altered BOLD fMRI networks in dementia. Hum Brain Mapp 30:256–266. [DOI] [PMC free article] [PubMed] [Google Scholar]
- Rosen HJ, Gorno‐Tempini ML, Goldman WP, Perry RJ, Schuff N, Weiner M, Feiwell R, Kramer JH, Miller BL (2002): Patterns of brain atrophy in frontotemporal dementia and semantic dementia. Neurology 58:198–208. [DOI] [PubMed] [Google Scholar]
- Rytty R, Nikkinen J, Paavola L, Abou Elseoud A, Moilanen V, Visuri A, Tervonen O, Renton AE, Traynor BJ, Kiviniemi V, Remes AM (2013): GroupICA dual regression analysis of resting state networks in a behavioral variant of frontotemporal dementia. Front Hum Neurosci 7:1–10. [DOI] [PMC free article] [PubMed] [Google Scholar]
- Seeley WW, Menon V, Schatzberg AF, Keller J, Glover GH, Kenna H, Reiss AL, Greicius MD (2007): Dissociable intrinsic connectivity networks for salience processing and executive control. J Neurosci 27:2349–2356. [DOI] [PMC free article] [PubMed] [Google Scholar]
- Seeley WW, Crawford RK, Zhou J, Miller BL, Greicius MD (2009): Neurodegenerative diseases target large‐scale human brain networks. Neuron 62:42–52. [DOI] [PMC free article] [PubMed] [Google Scholar]
- Segall JM, Allen EA, Jung RE, Erhardt EB, Arja SK, Kiehl K, Calhoun VD (2012): Correspondence between structure and function in the human brain at rest. Front Neuroinform 6:1–17. [DOI] [PMC free article] [PubMed] [Google Scholar]
- Smith SM (2002): Fast robust automated brain extraction. Hum Brain Mapp 17:143–155. [DOI] [PMC free article] [PubMed] [Google Scholar]
- Smith SM, Nichols TE (2009): Threshold‐free cluster enhancement: Addressing problems of smoothing, threshold dependence and localisation in cluster inference. Neuroimage 44:83–98. [DOI] [PubMed] [Google Scholar]
- Smith SM, Jenkinson M, Woolrich MW, Beckmann CF, Behrens TEJ, Johansen‐berg H, Bannister PR, Luca M, De Drobnjak I, Flitney DE, Niazy RK, Saunders J, Vickers J, Zhang Y, Stefano N, De Brady JM Matthews PM (2004): Advances in functional and structural MR image analysis and implementation as FSL. Neuroimage 23:208–219. [DOI] [PubMed] [Google Scholar]
- Smith SM, Fox PT, Miller KL, Glahn DC, Fox PM, Mackay CE, Filippini N, Watkins KE, Toro R, Laird AR, Beckmann CF (2009): Correspondence of the brain's functional architecture during activation and rest. Proc Natl Acad Sci USA 106:13040–13045. [DOI] [PMC free article] [PubMed] [Google Scholar]
- Spreng RN, Turner GR (2013): Structural covariance of the default network in healthy and pathological aging. J Neurosci 33:15226–15234. [DOI] [PMC free article] [PubMed] [Google Scholar]
- Tijms BM, Moller C, Vrenken H, Wink AM, De Haan W, Van der Flier WM, Stam CJ, Scheltens P, Barkhof F (2013): Single‐subject grey matter graphs in Alzheimer's disease. PLoS One 8:1–9 [DOI] [PMC free article] [PubMed] [Google Scholar]
- Zhang Y, Brady JM, Smith SM (2001): An HMRF‐EM algorithm for partial volume segmentation of brain MRI. FMRIB Tech Rep TR01YZ1. Available at: http://www.fmrib.ox.ac.uk/analysis/techrep, Last accessed June 26, 2015. [Google Scholar]
- Zhou J, Greicius MD, Gennatas ED, Growdon ME, Jang JY, Rabinovici GD, Kramer JH, Weiner M, Miller BL, Seeley WW (2010): Divergent network connectivity changes in behavioural variant frontotemporal dementia and Alzheimer's disease. Brain 133:1352–1367. [DOI] [PMC free article] [PubMed] [Google Scholar]
- Zielinski BA, Anderson JS, Froehlich AL, Prigge MBD, Nielsen JA, Cooperrider JR, Cariello AN, Fletcher PT, Alexander AL, Lange N, Bigler ED, Lainhart JE (2012): scMRI reveals large‐scale brain network abnormalities in autism. PLoS One 7:e49172–e49172 [DOI] [PMC free article] [PubMed] [Google Scholar]