

Abstract
Objective
Several neuroimaging meta‐analyses have summarized structural brain changes in major depression using coordinate‐based methods. These methods might be biased toward brain regions where significant differences were found in the original studies. In this study, a novel voxel‐based technique is implemented that estimates and meta‐analyses between‐group differences in grey matter from individual MRI studies, which are then applied to the study of major depression.
Methods
A systematic review and meta‐analysis of voxel‐based morphometry studies were conducted comparing participants with major depression and healthy controls by using statistical parametric maps. Summary effect sizes were computed correcting for multiple comparisons at the voxel level. Publication bias and heterogeneity were also estimated and the excess of heterogeneity was investigated with metaregression analyses.
Results
Patients with major depression were characterized by diffuse bilateral grey matter loss in ventrolateral and ventromedial frontal systems extending into temporal gyri compared to healthy controls. Grey matter reduction was also detected in the right parahippocampal and fusiform gyri, hippocampus, and bilateral thalamus. Other areas included parietal lobes and cerebellum. There was no evidence of statistically significant publication bias or heterogeneity.
Conclusions
The novel computational meta‐analytic approach used in this study identified extensive grey matter loss in key brain regions implicated in emotion generation and regulation. Results are not biased toward the findings of the original studies because they include all available imaging data, irrespective of statistically significant regions, resulting in enhanced detection of additional areas of grey matter loss. Hum Brain Mapp 37:1393‐1404, 2016. © 2016 Wiley Periodicals, Inc.
Keywords: magnetic resonance imaging, depression, affective disorders, meta‐analysis
INTRODUCTION
Understanding brain circuitry underlying affective regulation is a research priority and a necessary step to unravel brain pathology in depression and to precisely guide treatment. Major depression has an estimated life prevalence in high income countries of 15% [Bromet et al., 2011], and is the largest contributor to number of years lived with a disability worldwide [World Health Organization, 2002]. Despite these statistics, there has been little change in diagnosis, treatment, and disease outcome over the past two decades [Insel, 2012]. Undoubtedly, the complexity of brain circuitry poses a considerable obstacle to progress [Kapur et al., 2012], often complicated by the clinical and biological heterogeneity of depression and the inconsistency of research methodology. Voxel‐based morphometry (VBM) and region‐of‐interest (ROI) magnetic resonance imaging (MRI) have revealed a pattern of morphometric brain changes in depression that point toward specific brain circuitry implicated in affective regulation [Wise et al., 2014]. Key nodes involved in affective regulation, in which morphometric reductions have been described, include medial prefrontal areas such as the anterior cingulate cortex, orbitofrontal cortex, and also dorsolateral prefrontal regions, ventral striatum (caudate and putamen), middle temporal regions and limbic structures such as the amygdala, and hippocampus/parahippocampal gyrus [Arnone et al., 2012a; Frodl et al., 2008; Wise et al., 2014]. A major challenge in neuroimaging research has been the definition of valid and generalizable brain maps of abnormal affective circuitry that survive individual study variability. This process has benefited from meta‐analyses that summarize structural brain changes in major depression across several datasets using ROI approaches and VBM coordinate‐based methods [Arnone et al., 2012a; Bora et al., 2012; Lai, 2013]. These techniques are undoubtedly valid and do not require individual patient data, but their findings are often biased toward brain regions in which significant differences were reported in the original studies, for example, the anterior cingulate cortex in recent VBM meta‐analyses by Lai, Bora, and others [Bora et al., 2012; Lai, 2013]. To circumvent this limitation, here we implement a novel meta‐analysis technique that includes all of the between‐group imaging data from each VBM study. In this study, we applied our novel meta‐analytic method to the investigation of structural MRI changes in major depression. In keeping with current models of affective circuitry [Wise et al., 2014], we predicted that we would find widespread neuroanatomical abnormalities in top–down regulatory systems such as the prefrontal cortex, but also abnormalities in key areas involved in bottom–up processing of emotional information, such as the limbic system.
METHODS
Search Strategy and Inclusion/Exclusion Criteria
Studies were identified by conducting comprehensive literature searches using the following keywords: “Depression,” “Affective disorders,” “Bipolar disorder,” and “MRI” or “voxel‐based morphometry (VBM).” Databases, which included “EMBASE, OVID, and PubMed,” were searched until early 2012. Inclusion/exclusion criteria were operationalized and the Preferred Reporting Items for Systematic Reviews and Meta‐Analyses (PRISMA) guidelines [Moher et al., 2009] were followed in this meta‐analysis. Studies were included if they used VBM to compare current or remitted moderate to severe major depression vs. healthy controls, provided demographic and clinical information, used comparable criteria for diagnosis according to the Diagnostic and Statistical Manual of Mental Disorders [American Psychiatric Association, 2000] or with the International Classification of Disease [Sartorius et al., 1993] and assessment of severity, and were published in English. Effort was made to minimize heterogeneity by excluding treatment resistant illness, studies in children and adolescents, Axis I comorbidity, and studies that specifically investigated depression with geriatric onset. In case of multiple articles from the same research group which included overlapping samples, the most recent study with the overall largest number of participants was selected. As there is no VBM optimal approach, all methods were included.
Image Processing and Statistical Analysis
As previously described by Selvaraj et al. [2012], each T‐map was inspected for position and alignment in Montreal Neurological Institute (MNI) space using SPM12 (http://www.fil.ion.ucl.ac.uk/spm/software/spm12 /). Subsequently, T‐maps header files and published results were scrutinized in relation to identified T‐maps and were resampled into 2‐mm isotropic voxels using seventh degree sinc‐interpolation for the same bounding boxes and data types (SPM12). In Matlab (version 8.3.0.532; The MathWorks Inc., Natick, MA, USA), Cohen's d (an effect size measure for a t‐test on means) was calculated voxel‐by‐voxel for each of the T‐maps [Cooper and Hedges, 1994; Egger et al., 1997; Sutton et al., 2002]:
where n 1 is the number of depressed subjects and n 2 is the number of healthy subjects for the respective ith study's T‐map, ti is the t‐value from each study T‐map, and di is Cohen's d for each voxel in the study's T‐map.
Next, we calculated , the overall estimate of pooled effect (fixed effects) on a voxel‐wise basis, given by the following two equations; the variance of d, , is shown separately for clarity:
| (0) |
, where k is the number of studies (T‐maps).
Next, we calculated Q, the heterogeneity test statistic, for example, the reciprocal of the sum of the between‐ and within‐study variances:
The weight attached to a particular study was given by:
Using Der Simonian and Laird random‐effects models [Cooper and Hedges, 1994; Egger et al., 1997; Sutton et al., 2002], , the estimated component of variance due to interstudy variation in effect size was given by
and = 0 if Q ≤ k − 1; then the adjusted weights, , for each of the studies:
the pooled effect size, , (random effects):
the standard error, :
and the overall effect size, Z‐image, by
Finally, in addition to a Z‐image, the algorithm generated summary images for the standard error of the pooled effect size ( ), the pooled effect size ( ), the heterogeneity test statistic (Q) image, individual standard error ( ), and effect size ( ) images for each study.
Correction for multiple comparisons at voxel level was implemented with random field theory [Worsley and Friston, 1995], using the Oxford Center for Functional MRI of the Brain (FMRIB) Software Library (FSL) toolbox, version 5.0.1 (Oxford, UK). FSLs “smoothest” tool was used to estimate the smoothness of the Z‐image, giving “full‐width at half‐maximum” of x = 17.4, y = 20.0, z = 18.6 (mm) smoothness, and FSL's “ptoz” was used to give a p‐corrected = 0.05 equivalent Z‐threshold of Z = 4.01, for our Z‐image at voxel level (equivalent uncorrected p < 0.00003).
A custom Matlab script was used to prepare the voxel‐corrected data for use with the MNI Space utility (MSU), which was used to report localization of voxels in terms of MNI anatomical region labels. Additionally, localization was performed with FSL's probabilistic “atlasquery,” using the Harvard–Oxford Cortical and Subcortical Structural Atlases.
Publication and reporting bias, which describes the usual tendency of small studies to report large effect sizes, was examined using Egger's test [Egger et al., 1997] with a significance level of p < 0.05. Meta regressions were run using the “rma” function from the “metaphor” package in R. Random/mixed‐effects models were fitted using the DerSimonian–Laird estimator. Power calculations, calculated using G*Power [Faul et al., 2009, 2007], are shown in Table 2. We give the estimated sample size N to achieve the given effect size (dRE, pooled effect size), at a power of 80%, and an alpha of α = 0.05. To detect all the effects shown in our results, a sample size for the whole group of approximately n = 120 would be required.
Table 2.
| MNI coordinates Maxima | Z | Q | I2 | mm3 | dRE/estimated sample size | Region |
|---|---|---|---|---|---|---|
|
14 −72 −24 22 −70 −14 |
4.69 4.39 |
9.52 10.83 |
0.00 0.00 |
632 | 0.293/86 | Right: cerebellum, fusiform gyrus, lingual gyrus, declive, Brodmann area 19 |
| 34 −12 −38 | 4.26 | 7.25 | 0.00 | 80 | 0.266/106 | Right: fusiform gyrus, parahippocampal gyrus, uncus, Brodmann area 20 |
| 64 −28 −22 | 4.41 | 10.03 | 0.00 | 160 | 0.276/98 | Right: inferior temporal gyrus, middle temporal gyrus, Brodmann area 20 |
|
20 −40 −12 26 −34 −20 |
4.44 4.36 |
10.77 10.56 |
0.00 0.00 |
232 | 0.277/97 | Right: fusiform gyrus, parahippocampal gyrus, hippocampus, Brodmann area 36 |
| 24 8 −20 | 4.25 | 13.55 | 0.19 | 24 | 0.299/82 | Right: frontal orbital cortex, amygdala, inferior frontal gyrus, Brodmann area 47 |
| −6 36 −10 | 4.13 | 11.70 | 0.06 | 16 | 0.267/105 | Left: paracingulate gyrus, anterior cingulate, medial frontal cortex, Brodmann area 32 |
| 34 24 −2 | 4.25 | 11.05 | 0.00 | 80 | 0.266/106 | Right: insular cortex, orbital frontal cortex, inferior frontal gyrus |
| 42 10 −2 | 4.11 | 12.10 | 0.09 | 24 | 0.271/101 | Right: insula, Brodmann area 13 |
| −2 −8 2 | 4.19 | 15.50 | 0.29 | 40 | 0.317/52 | Right & left: thalamus |
| −34 16 4 | 4.25 | 9.80 | 0.00 | 80 | 0.265/106 | Left: insula, frontal operculum |
|
50 −16 10 52 −12 8 |
4.39 4.27 |
5.76 11.58 |
0.00 0.05 |
104 | 0.274/99 | Right: transverse temporal gyrus, superior temporal gyrus, precentral gyrus, central opercular cortex, Heschl's gyrus (includes H1 and H2), planum temporale, planum polare, Brodmann areas 13, 22, 41 |
| −12 −72 32 | 4.03 | 10.90 | 0.00 | 8 | 0.252/118 | Left: cuneus, Brodmann area 7 |
Results from the Montreal Neurological Institute (MNI) Space Utility. Anatomical regions are given in the right‐hand column with relevant Brodmann Areas shown when indicated. The Z‐image was thresholded at equivalent p < 0.05 corrected. Q is the heterogeneity test statistic used in the analysis and I 2 is the measure of the magnitude of heterogeneity calculated using the formula (Q − df)/Q. Pooled effect size (random effect) is given by “dRE”. Sample size is the estimated sample size N to achieve the given effect size at a power of 80%, and an alpha of α = 0.05, two‐tailed. To detect the effects given here, a sample size of approximately n = 120 would be required.
RESULTS
Systematic Search
Searches identified over 4500 studies, of which 180 VBM reports were examined in detail. Forty‐two articles that investigated major depression were further selected for close examination, of which 19 met the inclusion criteria listed above. Details of excluded studies are provided in the Supplementary Table. After contacting the authors, t‐maps were obtained from 12 studies [Abe et al., 2010; Amico et al., 2011; Arnone et al., 2013; Cheng et al., 2010; Colloby et al., 2011; De Azevedo‐Marques Périco et al., 2011; Kim et al., 2008; Koolschijn et al., 2010; Lee et al., 2011; Salvadore et al., 2011; Van Tol et al., 2010; Wagner et al., 2011] (63%), and were included in the meta‐analysis (Table 1). It was not possible to obtain t‐maps for the other 7 studies [Bergouignan et al., 2009; Leung et al., 2009; Li et al., 2010; Mak et al., 2009; Peng et al., 2011; Treadway et al., 2009; Vasic et al., 2008]. A total number of 472 patients and 680 controls were included. The majority of patients were currently depressed at the time of scanning. The mean age was 43 years, 29% of participants were men, the mean duration of illness was around 8.5 years and 56% of patients received treatment with psychotropic medication at the time of scanning. Scanner strength included 1.5 and 3 T (Table 1).
Table 1.
| Study | Year | MDD/HC (N) | Age (Mean) | Sex M/F | Age onset (Years) | State | Scanner (Tesla) | GM type | Analysis | Outcome |
|---|---|---|---|---|---|---|---|---|---|---|
| Abe et al. | 2010 | 21/42 | 48.1 | 11/10 | 42.1 |
Current Remitted |
1.5 | Volume | SPM5 |
↓GMV R: PHG/H/ACC/sTG L: PL/OL R/L: mFG |
| Amico et al. | 2011 | 33/64 | 32 | 19/14 | 28.7 | Current | 1.5 | Volume | SPM5 |
↓GMV L: dmPFC/ACC R: C |
| Arnone et al. | 2013 | 39/66 | 36.3 | 12/27 | 22 | Current | 1.5 | Volume | SPM8 |
↓GMV R/L: H |
| Cheng et al. | 2010 | 68/68 | 29.91 | 21/47 | 28.94 | Current | 1.5 | Volume | SPM5 |
↓GMV R: SMA |
| Colloby et al. | 2011 | 38/30 | 74.1 | 11/27 | 51.8 |
Current Remitted |
3 | Volume | SPM8 | No difference |
| Kim et al. | 2008 | 22/25 | 38.5 | 0/22 | NS | Current | 1.5 | Volume | SPM2 |
↓GMV R/L: T, C |
| Koolschijn et al. | 2010 | 28/38 | 64.04 | 0/28 | 33.04 | Current | 1.5 | Density | ANIMAL | No difference |
| Lee et al. | 2011 | 47/51 | 46 | 5/42 | NS | Current | 1.5 | Density | SPM2 |
↓GMD R/L: H/FG/A/LG/Ins/sTG/T/CG/Cer |
| Perico et al. | 2011 | 20/94 | 29.9 | 5/15 | NS | Current | 1.5 | Volume | SPM2 |
↓GMV R/L: dLPFC |
| Salvadore et al. | 2011 | 58/107 | 38.8 | 37/21 | NS | Current | 3 | Volume | SPM5 |
↓GMV L: iFG R: mFG/sFG |
| Van Tol et al. | 2010 | 68/65 | 37.16 | 24/44 | 25.62 |
Current Remitted |
3 | Volume | SPM5 |
↓GMV R/L: rdACC R: iFC |
| Wagner et al. | 2011 | 30/30 | 37.6 | 5/25 | 31.6 | Current | 1.5 | Density | SPM2 |
↓GMD R/L: C/sC/H/A L: sFG/OF R: iFG |
Studies included in the meta‐analysis. GMV/GMD, grey matter volume/density; C, caudate nucleus; PHG, parahippocampal gyrus; H, hippocampus; A, amygdala; ACC, anterior cingulate cortex; rdACC, rostro‐dorsal ACC; CG, cingulate gyrus; Cer, cerebellum; sC, subgenual cortex; MB, midbrain; iFC, inferior frontal cortex; dmPFC, dorso‐medial prefrontal cortex; dLPFC, dorso‐lateral prefrontal cortex; Ins, Insula; iFG, inferior frontal gyrus; FG, fusiform gyrus; mFG, middle frontal gyrus; sFG, superior frontal gyrus; iFG, inferior frontal gyrus; sTG, superior temporal gyrus; PL, parietal lobe, LG, lingual gyrus; OL, occipital lobe; SMA, supplementary motor area; T, thalamus.
Grey Matter Differences in Major Depression vs Healthy Controls
The analysis indicated several clusters of grey matter reduction in major depression vs. healthy controls (Table 1). The area maxima (Z‐peak = 4.69; 14, 72, −24 and Z‐peak= 4.39; 22, −70, −14) was located in the right hemisphere and incorporated the fusiform gyrus, lingual gyrus, Broadmann area 19, declive and cerebellum. The Forest plot for the summary effect size in the right inferior temporal gyrus (Broadmann area 20) with both random and fixed effect models (Figure 1) suggested a summary effect size of −0.29 (CI: −0.42, −0.17) with absence of heterogeneity in the analysis (I 2 = 0%, p = 0.57). This was confirmed by calculating Q‐statistics after rendering the images in standard brain template at p‐uncorrected <0.05 (I 2 = 0%, Table 2). Metaregression analyses of well‐represented demographic and clinical variables which included age, sex, duration of depressive episode, severity of illness (expressed as Hamilton Depression Rating Scale equivalent) [Heo et al., 2007], and % of medicated patients did not produce significant results (all p's > 0.05). Linear regression test of funnel plot asymmetry suggested no evidence of publication bias (t = −1.49, p = 0.17). Figure 2 shows the Z‐image of significant clusters with crosshairs in the peak voxel. Table 2 and Figure 3 describe in detail the regions of grey matter detected by the analyses in major depression vs. healthy controls. In brief areas of grey matter loss included bilateral ventro‐medial and ventro‐lateral regions of the prefrontal cortex involved in regulating executive functions and emotional behaviors [Wise et al., 2014] incorporating dorsolateral prefrontal cortex, orbitofrontal cortex (BA 11), the “pars orbitalis” of the inferior frontal cortex (BA 47), and the anterior cingulate cortex (including BA 24 and 32). The analysis also demonstrated bilateral grey matter loss in superior, middle, and inferior temporal gyri, uncus, further extending into medial temporal areas to include the insula (BA 13), projecting into limbic structures which included the right hippocampus, parahippocampal, and fusiform gyri. Furthermore, grey matter loss was detected in the thalamus incorporating the medial dorsal component known to relay inputs from the amygdala to the prefrontal cortex [Phillips et al., 2008]. Other areas included integrative pathways in parietal regions involved in the processing of sensory perception (e.g., inferior parietal lobule) and coordination centers in the cerebellum.
Figure 1.
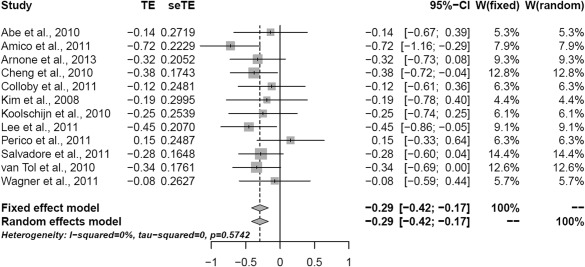
Forrest plot for the summary effect size in the right inferior temporal gyrus (Brodmann area 20) (x = 64, y = −28, z = −22 MNI). TE: weighted mean difference for each study; seTE: TE standard error; CI = confidence interval W: study weight.
Figure 2.
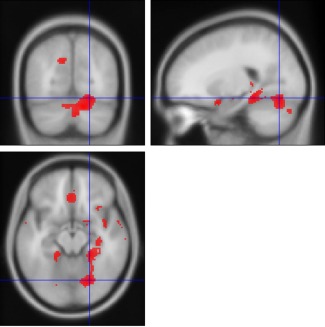
Red areas denote regions where less grey matter was measured in the largest cluster in subjects with depression than in control participants, with a threshold at Z > 4.01. The cross‐hairs are in the area maxima located in the right lingual gyrus, Z = 4.39, Montreal Neurological Institute (MNI) coordinates x = 22, y = −70, z = −14. [Color figure can be viewed in the online issue, which is available at http://wileyonlinelibrary.com.]
Figure 3.
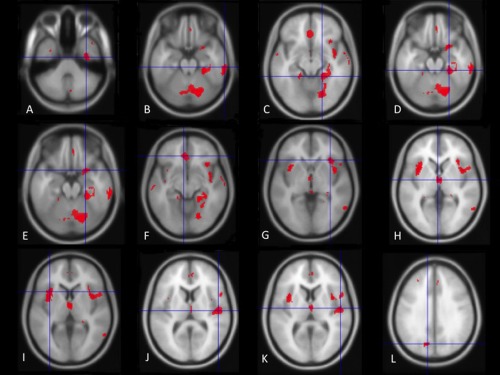
Red areas denote further regions where less grey matter was measured in subjects with depression than in control participants as illustrated in Table 2. See Table 1 for a detailed description. Cross‐hairs are placed on the following brain regions: (A) right fusiform gyrus (x = 34, y = −12, z = −38); (B) right inferior temporal gyrus (x = 64, y = −28, z = −22); (C) right fusiform gyrus (x = 20, y = −40, z = −12); (D) right parahippocampal gyrus (x = 26, y = −34, z = −20); (E) right inferior frontal gyrus (x = 24, y = 8, z = −20); (F) left medial frontal gyrus (x = −6, y = 36, z = −10); (G) right insula (x = 34, y = 24, z = −2); (H) left thalamus (x = −2, y = −8, z = 2); (I) left insula (x = 34, y = 24, z = −2); (J) right superior temporal gyrus (x = 50, y = −16, z = 10); (K) right superior temporal gyrus (x = 52, y = −12, z = 8); (L) left cuneus (x = −12, y = −72, z = 32). [Color figure can be viewed in the online issue, which is available at http://wileyonlinelibrary.com.]
DISCUSSION
The novel computational meta‐analytic approach used in this study identified grey matter loss in key brain regions implicated in emotion generation and regulation. This is the first time this approach has been applied to VBM studies in major depression. The major advantage of this technique is that results are not biased toward findings of the original studies because they include all available imaging data and not only those regions that were reported as statistically significant. Hence, this technique should increase sensitivity to detect additional areas of grey matter loss. Consistent with previous meta‐analyses, morphometric reductions were detected in the anterior cingulate cortex [Bora et al., 2012; Du et al., 2012; Lai, 2013], medial frontal cortex, and inferior frontal gyri [Du et al., 2012], dorsal anterior cingulate cortex [Bora et al., 2012], hippocampus [Du et al., 2012], and thalamus [Du et al., 2012].
Importantly, additional areas of grey matter loss were localized bilaterally in frontal areas, including both ventro‐lateral and ventro‐medial systems involved in top‐down coordination of higher functions including the modulation of emotional behaviors [Wise et al., 2014]. Grey matter loss in the medial system included medial prefrontal cortex, orbitofrontal, and anterior cingulate cortices involved in integrating information between lateral and ventromedial prefrontal areas and in engaging subcortical structures responsible for regulating emotions including thalamus, parahippocampal gyrus/fusiform gyrus, hippocampus, amygdala, and dorsal striatum. Further grey matter loss was also identified in temporal regions involved in the integration of cognitive information. These regions include the superior, middle and inferior temporal gyri (BAs 22, 21, 20, 28, 35, 36 and 42), posterior inferior temporal gyrus (BA 37), insula (BA 13), known to interface neocortex with extended limbic regions such as parahippocampus, fusiform gyrus, and hippocampus, also shown to be morphometrically reduced in this meta‐analysis.
Evidence of volumetric reduction in the prefrontal cortex was initially described in postmortem studies indicating a reduction in number and size of neurons and glia in the subgenual anterior cingulate cortex (sgACC, BA25) [Ongür et al., 1998], orbitofrontal and dorsolateral [Rajkowska et al., 1999] prefrontal cortices. Structural MRI studies have consistently reported volumetric reduction in the same regions in vivo [Arnone et al., 2012a; Koolschijn et al., 2009]. The sgACC is an integral component of a metabolically coherent, anatomically interconnected, affective circuit described by Mayberg and others as the “anterior compartment” which also includes the amygdala and the anterior insula [Mayberg et al., 1999]. Baseline increased metabolic activity in the sgACC in depression has often been reported to “normalize” following successful response to treatment [Mayberg et al., 2000]. In contrast, baseline hypoactivation in this region has been shown to predict treatment refractoriness [Mayberg et al., 1997]. The sgACC is a central node for deep neurosurgical stimulation for the treatment of depression that is refractory to treatment [Berlim et al., 2014; Mayberg et al., 2005]. The insula is a functional node responsible for the integration of sensory (somatic, visceral, autonomic) and motor information via the thalamus and basal ganglia, believed to be central to self‐awareness and homeostatic control [Singer et al., 2009]. It is also becoming increasing evident that this structure, and particularly its anterior portion, is of paramount importance in integrating social, affective, and motivational behavior to generate integrated “affective states” and guide individuals in decision‐making behaviors central to social interactions [Singer et al., 2009]. More recently, differential baseline metabolic activity in the insula has been shown to predict treatment response in depression with hypermetabolism being associated with remission following treatment with the antidepressant escitalopram and hypometabolism associated with remission after cognitive behavior therapy [McGrath et al., 2013]. This finding complements elevated metabolism in depression in limbic regions, for example, amygdala at baseline in response to negative emotional stimuli [Arnone et al., 2012b; Drevets et al., 2002] with normalization of aberrant neural responses following clinical improvement and pharmacological treatment [Arnone et al., 2012b; Fu et al., 2007].
This work indicates the presence of morphometric thalamic reduction in unipolar major depression which complements previous findings of neuroanatomical, functional, and metabolic abnormalities demonstrated in this region [Anand et al., 2005; Drevets et al., 1992; Greicius et al., 2007; Nugent et al., 2013; Young et al., 2004]. As a component of the limbic–cortical–striatial–pallidal–thalamic network [Drevets et al., 2008; Sheline, 2000], the thalamus is a complex sensory information node constituted by many nuclei [Nugent et al., 2013]. Further work is necessary to better understand how structural and functional abnormalities in the nuclear components of this node affect mood regulation [Nugent et al., 2013].
Our finding of grey matter loss in hippocampus and parahippocampal gyrus is consistent with Du et al.'s [2012] results and represents the most frequently replicated morphometric abnormality in major depression [Arnone et al., 2012a; Koolschijn et al., 2009; Schmaal et al., 2015]. Postmortem studies in depression often attribute the volumetric loss measured in the hippocampus to significant structural reorganization resulting in neuropil reduction and decreased soma size of pyramidal neurons [Arnone et al., 2012a; Koolschijn et al., 2009; Stockmeier et al., 2004] likely to be mediated by changes in brain‐derived neurotrophic factor and glucocorticoids, precipitated by stress and reversed by antidepressants via complex signal transduction pathways [Duman, 2004]. There is evidence that prenatal stress and childhood maltreatment is associated with hippocampal volume reduction as well as an abnormally developing HPA system [Frodl and O'Keane, 2013] and findings in first episode patients might indicate that some brain structural changes may already be present before the onset of the disease [Frodl et al., 2002].
Grey matter loss in depression in temporal grey matter structures involved in language generation and comprehension is a novel finding. The inferior temporal gyrus is in close proximity of the hippocampus and parahippocampal gyrus and is posited to be involved in working memory [Yoo et al., 2004]. The middle temporal gyrus is involved in deductive reasoning [Goel et al., 1998], while the right superior temporal sulcus has been shown to play a pivotal role in the generation of affective prosody [Wildgruber et al., 2005]. Hence, the involvement of temporal regions in depression is not entirely surprising considering that complex cognitive tasks of emotional significance often require language and prosody. Furthermore, in the context of complex cognitive processes (e.g., reasoning), associative cortical integration occurs between temporal regions and networks in the frontal cortex (e.g., dorsolateral and orbital frontal cortices and cingulate gyrus) participating in top–down and bottom–up circuitries which also include thalamus and the insula involved in multisensory emotion recognition and processing [Adolphs, 2002; Fusar‐Poli et al., 2009; Goel et al., 1998; Phillips et al., 2008; Wildgruber et al., 2005; Yoo et al., 2004]. High‐baseline metabolic activity has recently been shown in the pulvinar, a large nucleus of the thalamus, which shares connections with the insula and dorsal anterior cingulate cortex and plays a role in the processing of emotional attention and awareness [Hamilton et al., 2012]. Functional MRI studies have demonstrated increased neural activity at rest in the thalamus and also in the subgenual cingulate cortex [Greicius et al., 2007]. Functional abnormalities at rest might be explained by lowered structural network connectivity in fronto‐limbic and default network nodes resulting in desynchronization of integrative mood circuits [Korgaonkar et al., 2014], topological reorganization of functional connectivity leading to increased activity at rest in limbic and medial frontal regions and reduced nodal centralities in occipital, parietal, orbitofrontal, and temporal regions [Zhang et al., 2011]. Other brain regions where grey matter loss was detected in this meta‐analysis included the inferior parietal lobule and the cerebellum. Parietal associative areas are involved in the processing and integration of sensory signals [Adolphs, 2002; Zhang et al., 2011] and have generally been understudied in depression [Arnone et al., 2012a]. The declive is an area of the cerebellum shown to be active in the processing of face emotions [Fusar‐Poli et al., 2009]. The finding of bilateral morphometric reduction in this region in this work supports its involvement in emotion regulation in keeping with the known extensive connectivity of the cerebellum with limbic and cortical associative areas [Fusar‐Poli et al., 2009]. We also measured grey matter reduction in the culmen in the anterior vermis or the cerebellum, where decreased resting‐state neural activity has been demonstrated in major depression, particularly enhanced in case of treatment refractoriness [Guo et al., 2012].
Taken altogether the above findings suggest a multiregional pattern of morphometric grey matter reduction in depression consistent with the brain regions described in current depression models. These models propose that behavioral and cognitive manifestations of depression generally result from increased activity in limbic regions coexisting with decreased activity in cortical regions [Phillips et al., 2008; Mayberg, 2009]. Findings also suggest that refinement of these models might in the future expand to include more brain areas in cortical and subcortical networks. While research studies designed to compare major depression with other psychiatric conditions are required to evaluate cross‐diagnostic specificity [Arnone et al., 2009], more controlled experiments are needed to refine our understanding of the contribution of predisposing factors, effect of treatment, compensatory mechanisms, and multiple episodes of illness on brain morphology and function.
We should note that selective reporting is an important limitation of this work, intrinsic to the technique adopted, which is entirely reliant on obtaining available brain maps. Thus, a bias due to small studies cannot be definitively excluded, although Cohen's d correction for small sample size was used in the analyses and publication bias was not detected. Importantly, both random and fixed effect models did not show significant levels of heterogeneity, and none of the metaregressions we conducted was significant. Given the manifest clinical and causal heterogeneity of depression [Levinson et al., 2014; Ripke et al., 2013], and the effects of gene–environment effects on brain structure [Rabl et al., 2014], this result is somewhat surprising. While tests of heterogeneity are often of low power, the exclusion of treatment‐refractoriness in our inclusion criteria may have reduced this heterogeneity. Also, although meta‐analyses can test for between‐study heterogeneity, their ability to detect or resolve causal heterogeneity at the level of individuals is limited. In order to address this issue, individual patient data are needed in large imaging samples preferably with a longitudinal design. There is paucity of such studies in the literature although these are preferable to identify the time of grey matter loss in relation to insurgence of symptoms, treatment, and clinical response [Arnone et al., 2013; Frodl et al., 2008].
In addition to previous meta‐analyses which used activation likelihood estimation, and consistent with ROI meta‐analyses in depression, this study supports widespread grey matter loss affecting a range of cortical and subcortical areas, some of which were not clearly associated with unipolar depression. The involvement and the role of some of these structures in depression would benefit from replication and further clarification in future studies. Complementary imaging approaches might be best suited to model structure and function of complex brain circuits.
CONCLUSION
In conclusion, this work provides further evidence for the presence of diffuse morphometric abnormalities in unipolar depression affecting ventrolateral and ventromedial prefrontal areas, temporal regions, and limbic systems involved in top–down and bottom–up regulation of emotional behaviors.
Supporting information
Supporting Information
ACKNOWLEDGMENTS
DA would like to thank colleagues who supplemented their published work with detailed auxiliary information and Dr Shane McKie and Professor Ian Anderson for their support. Conflict of interest: Nothing to declare. Role of the funding source: Nothing to declare. DA would like to acknowledge the support of the Academy of Medical Sciences (reference AMS‐SGCL8) and AMM of the Wellcome Trust (reference 104036/Z/14/Z).
REFERENCES
- Abe O, Yamasue H, Kasai K, Yamada H, Aoki S, Inoue H, et al (2010): Voxel‐based analyses of gray/white matter volume and diffusion tensor data in major depression. Psychiatry Res 181:64–70. [DOI] [PubMed] [Google Scholar]
- Adolphs R (2002): Neural systems for recognizing emotion. Curr Opin Neurobiol 12:169–177. [DOI] [PubMed] [Google Scholar]
- American Psychiatric Association (2000): Diagnostic and Statistical Manual of Mental Disorders, 4th ed Washington, DC: American Psychiatric Association. [Google Scholar]
- Amico F, Meisenzahl E, Koutsouleris N, Reiser M, Möller H‐J, Frodl T (2011): Structural MRI correlates for vulnerability and resilience to major depressive disorder. J Psychiatry Neurosci JPN 36:15–22. [DOI] [PMC free article] [PubMed] [Google Scholar]
- Anand A, Li Y, Wang Y, Wu J, Gao S, Bukhari L, et al (2005): Activity and connectivity of brain mood regulating circuit in depression: A functional magnetic resonance study. Biol Psychiatry 57:1079–1088. [DOI] [PubMed] [Google Scholar]
- Arnone D, Cavanagh J, Gerber D, Lawrie SM, Ebmeier KP, McIntosh AM (2009): Magnetic resonance imaging studies in bipolar disorder and schizophrenia: Meta‐analysis. Br J Psychiatry J Ment Sci 195:194–201. [DOI] [PubMed] [Google Scholar]
- Arnone D, McIntosh AM, Ebmeier KP, Munafò MR, Anderson IM (2012): Magnetic resonance imaging studies in unipolar depression: Systematic review and meta‐regression analyses. Eur Neuropsychopharmacol J Eur Coll Neuropsychopharmacol 22:1–16. [DOI] [PubMed] [Google Scholar]
- Arnone D, McKie S, Elliott R, Juhasz G, Thomas EJ, Downey D, et al (2013): State‐dependent changes in hippocampal grey matter in depression. Mol Psychiatry 18:1265–1272. [DOI] [PubMed] [Google Scholar]
- Arnone D, McKie S, Elliott R, Thomas EJ, Downey D, Juhasz G, et al (2012): Increased amygdala responses to sad but not fearful faces in major depression: Relation to mood state and pharmacological treatment. Am J Psychiatry 169:841–850. [DOI] [PubMed] [Google Scholar]
- Bergouignan L, Chupin M, Czechowska Y, Kinkingnéhun S, Lemogne C, Le Bastard G, et al (2009): Can voxel based morphometry, manual segmentation and automated segmentation equally detect hippocampal volume differences in acute depression? NeuroImage 45:29–37. [DOI] [PubMed] [Google Scholar]
- Berlim MT, McGirr A, Van den Eynde F, Fleck MPA, Giacobbe P (2014): Effectiveness and acceptability of deep brain stimulation (DBS) of the subgenual cingulate cortex for treatment‐resistant depression: A systematic review and exploratory meta‐analysis. J Affect Disord 159:31–38. [DOI] [PubMed] [Google Scholar]
- Bora E, Fornito A, Pantelis C, Yücel M (2012): Gray matter abnormalities in major depressive disorder: A meta‐analysis of voxel based morphometry studies. J Affect Disord 138:9–18. [DOI] [PubMed] [Google Scholar]
- Bromet E, Andrade LH, Hwang I, Sampson NA, Alonso J, de Girolamo G, et al (2011): Cross‐national epidemiology of DSM‐IV major depressive episode. BMC Med 9:90 [DOI] [PMC free article] [PubMed] [Google Scholar]
- Cheng Y‐Q, Xu J, Chai P, Li H‐J, Luo C‐R, Yang T, et al (2010): Brain volume alteration and the correlations with the clinical characteristics in drug‐naïve first‐episode MDD patients: A voxel‐based morphometry study. Neurosci Lett 480:30–34. [DOI] [PubMed] [Google Scholar]
- Colloby SJ, Firbank MJ, Vasudev A, Parry SW, Thomas AJ, O'Brien JT (2011): Cortical thickness and VBM‐DARTEL in late‐life depression. J Affect Disord 133:158–164. [DOI] [PubMed] [Google Scholar]
- Cooper, HM , Hedges, LV (1994): The Handbook of Research Synthesis, Illustrated Edition. New York: Russell Sage Foundation. [Google Scholar]
- De Azevedo‐Marques Périco C, Duran FLS, Zanetti MV, Santos LC, Murray RM, Scazufca M, et al (2011): A population‐based morphometric MRI study in patients with first‐episode psychotic bipolar disorder: Comparison with geographically matched healthy controls and major depressive disorder subjects. Bipolar Disord 13:28–40. [DOI] [PubMed] [Google Scholar]
- Drevets WC, Price JL, Bardgett ME, Reich T, Todd RD, Raichle ME (2002): Glucose metabolism in the amygdala in depression: Relationship to diagnostic subtype and plasma cortisol levels. Pharmacol Biochem Behav 71:431–447. [DOI] [PubMed] [Google Scholar]
- Drevets WC, Price JL, Furey ML (2008): Brain structural and functional abnormalities in mood disorders: Implications for neurocircuitry models of depression. Brain Struct Funct 213:93–118. [DOI] [PMC free article] [PubMed] [Google Scholar]
- Drevets WC, Videen TO, Price JL, Preskorn SH, Carmichael ST, Raichle ME (1992): A functional anatomical study of unipolar depression. J Neurosci 12:3628–3641. [DOI] [PMC free article] [PubMed] [Google Scholar]
- Du M‐Y, Wu Q‐Z, Yue Q, Li J, Liao Y, Kuang W‐H, et al (2012): Voxelwise meta‐analysis of gray matter reduction in major depressive disorder. Prog Neuropsychopharmacol Biol Psychiatry 36:11–16. [DOI] [PubMed] [Google Scholar]
- Duman RS (2004): Neural plasticity: Consequences of stress and actions of antidepressant treatment. Dialogues Clin Neurosci 6:157–169. [DOI] [PMC free article] [PubMed] [Google Scholar]
- Egger M, Davey Smith G, Schneider M, Minder C (1997): Bias in meta‐analysis detected by a simple, graphical test. BMJ 315:629–634. [DOI] [PMC free article] [PubMed] [Google Scholar]
- Faul F, Erdfelder E, Buchner A, Lang A‐G (2009): Statistical power analyses using G*Power 3.1: Tests for correlation and regression analyses. Behav Res Methods 41:1149–1160. [DOI] [PubMed] [Google Scholar]
- Faul F, Erdfelder E, Lang A‐G, Buchner A (2007): G*Power 3: A flexible statistical power analysis program for the social, behavioral, and biomedical sciences. Behav Res Methods 39:175–191. [DOI] [PubMed] [Google Scholar]
- Frodl T, Meisenzahl EM, Zetzsche T, Born C, Groll C, Jäger M, et al (2002): Hippocampal changes in patients with a first episode of major depression. Am J Psychiatry 159:1112–1118. [DOI] [PubMed] [Google Scholar]
- Frodl T, O'Keane V (2013): How does the brain deal with cumulative stress? A review with focus on developmental stress, HPA axis function and hippocampal structure in humans. Neurobiol Dis 52:24–37. [DOI] [PubMed] [Google Scholar]
- Frodl TS, Koutsouleris N, Bottlender R, Born C, Jäger M, Scupin I, et al (2008): Depression‐related variation in brain morphology over 3 years: Effects of stress? Arch Gen Psychiatry 65:1156–1165. [DOI] [PubMed] [Google Scholar]
- Fu CHY, Williams SCR, Brammer MJ, Suckling J, Kim J, Cleare AJ, et al (2007): Neural responses to happy facial expressions in major depression following antidepressant treatment. Am J Psychiatry 164:599–607. [DOI] [PubMed] [Google Scholar]
- Fusar‐Poli P, Placentino A, Carletti F, Landi P, Allen P, Surguladze S, et al (2009): Functional atlas of emotional faces processing: A voxel‐based meta‐analysis of 105 functional magnetic resonance imaging studies. J Psychiatry Neurosci JPN 34:418–432. [PMC free article] [PubMed] [Google Scholar]
- Goel V, Gold B, Kapur S, Houle S (1998): Neuroanatomical correlates of human reasoning. J Cogn Neurosci 10:293–302. [DOI] [PubMed] [Google Scholar]
- Greicius MD, Flores BH, Menon V, Glover GH, Solvason HB, Kenna H, et al (2007): Resting‐state functional connectivity in major depression: Abnormally increased contributions from subgenual cingulate cortex and thalamus. Biol Psychiatry 62:429–437. [DOI] [PMC free article] [PubMed] [Google Scholar]
- Guo W, Liu F, Chen J, Gao K, Xue Z, Xu X, et al (2012): Abnormal neural activity of brain regions in treatment‐resistant and treatment‐sensitive major depressive disorder: A resting‐state fMRI study. J Psychiatr Res 46:1366–1373. [DOI] [PubMed] [Google Scholar]
- Hamilton JP, Etkin A, Furman DJ, Lemus MG, Johnson RF, Gotlib IH (2012): Functional neuroimaging of major depressive disorder: A meta‐analysis and new integration of base line activation and neural response data. Am J Psychiatry 169:693–703. [DOI] [PMC free article] [PubMed] [Google Scholar]
- Heo M, Murphy CF, Meyers BS (2007): Relationship between the Hamilton Depression Rating Scale and the Montgomery‐Asberg Depression Rating Scale in depressed elderly: A meta‐analysis. Am J Geriatr Psychiatry 15:899–905. [DOI] [PubMed] [Google Scholar]
- Insel TR (2012): Next‐generation treatments for mental disorders. Sci Transl Med 4:155ps19 [DOI] [PubMed] [Google Scholar]
- Kapur S, Phillips AG, Insel TR (2012): Why has it taken so long for biological psychiatry to develop clinical tests and what to do about it? Mol Psychiatry 17:1174–1179. [DOI] [PubMed] [Google Scholar]
- Kim MJ, Hamilton JP, Gotlib IH (2008): Reduced caudate gray matter volume in women with major depressive disorder. Psychiatry Res 164:114–122. [DOI] [PMC free article] [PubMed] [Google Scholar]
- Koolschijn PCMP, van Haren NEM, Lensvelt‐Mulders GJLM, Hulshoff Pol HE, Kahn RS (2009): Brain volume abnormalities in major depressive disorder: A meta‐analysis of magnetic resonance imaging studies. Hum Brain Mapp 30:3719–3735. [DOI] [PMC free article] [PubMed] [Google Scholar]
- Koolschijn PCMP, van Haren NEM, Schnack HG, Janssen J, Hulshoff Pol HE, Kahn RS (2010): Cortical thickness and voxel‐based morphometry in depressed elderly. Eur Neuropsychopharmacol J Eur Coll Neuropsychopharmacol 20:398–404. [DOI] [PubMed] [Google Scholar]
- Korgaonkar MS, Fornito A, Williams LM, Grieve SM (2014): Abnormal structural networks characterize major depressive disorder: A connectome analysis. Biol Psychiatry 76:567–574. [DOI] [PubMed] [Google Scholar]
- Lai C‐H (2013): Gray matter volume in major depressive disorder: A meta‐analysis of voxel‐based morphometry studies. Psychiatry Res 211:37–46. [DOI] [PubMed] [Google Scholar]
- Lee H‐Y, Tae WS, Yoon H‐K, Lee B‐T, Paik J‐W, Son K‐R, et al (2011): Demonstration of decreased gray matter concentration in the midbrain encompassing the dorsal raphe nucleus and the limbic subcortical regions in major depressive disorder: An optimized voxel‐based morphometry study. J Affect Disord 133:128–136. [DOI] [PubMed] [Google Scholar]
- Leung K‐K, Lee TMC, Wong MMC, Li LSW, Yip PSF, Khong P‐L (2009): Neural correlates of attention biases of people with major depressive disorder: A voxel‐based morphometric study. Psychol Med 39:1097–1106. [DOI] [PubMed] [Google Scholar]
- Levinson DF, Mostafavi S, Milaneschi Y, Rivera M, Ripke S, Wray NR, Sullivan PF (2014): Genetic studies of major depressive disorder: Why are there no genome‐wide association study findings and what can we do about it? Biol Psychiatry 76:510–512. [DOI] [PMC free article] [PubMed] [Google Scholar]
- Li C‐T, Lin C‐P, Chou K‐H, Chen I‐Y, Hsieh J‐C, Wu C‐L, et al (2010): Structural and cognitive deficits in remitting and non‐remitting recurrent depression: A voxel‐based morphometric study. NeuroImage 50:347–356. [DOI] [PubMed] [Google Scholar]
- Mak AKY, Wong MMC, Han S‐H, Lee TMC (2009): Gray matter reduction associated with emotion regulation in female outpatients with major depressive disorder: A voxel‐based morphometry study. Prog Neuropsychopharmacol Biol Psychiatry 33:1184–1190. [DOI] [PubMed] [Google Scholar]
- Mayberg HS (2009): Targeted electrode‐based modulation of neural circuits for depression. J Clin Invest 119:717–725. [DOI] [PMC free article] [PubMed] [Google Scholar]
- Mayberg HS, Brannan SK, Mahurin RK, Jerabek PA, Brickman JS, Tekell JL, et al (1997): Cingulate function in depression: A potential predictor of treatment response. Neuroreport 8:1057–1061. [DOI] [PubMed] [Google Scholar]
- Mayberg HS, Brannan SK, Tekell JL, Silva JA, Mahurin RK, McGinnis S, Jerabek PA (2000): Regional metabolic effects of fluoxetine in major depression: Serial changes and relationship to clinical response. Biol Psychiatry 48:830–843. [DOI] [PubMed] [Google Scholar]
- Mayberg HS, Liotti M, Brannan SK, McGinnis S, Mahurin RK, Jerabek PA, et al (1999): Reciprocal limbic‐cortical function and negative mood: Converging PET findings in depression and normal sadness. Am J Psychiatry 156:675–682. [DOI] [PubMed] [Google Scholar]
- Mayberg HS, Lozano AM, Voon V, McNeely HE, Seminowicz D, Hamani C, et al (2005): Deep brain stimulation for treatment‐resistant depression. Neuron 45:651–660. [DOI] [PubMed] [Google Scholar]
- McGrath CL, Kelley ME, Holtzheimer PE, Dunlop BW, Craighead WE, Franco AR, et al (2013): Toward a neuroimaging treatment selection biomarker for major depressive disorder. JAMA Psychiatry 70:821–829. [DOI] [PMC free article] [PubMed] [Google Scholar]
- Moher D, Liberati A, Tetzlaff J, Altman DG, PRISMA Group (2009): Preferred reporting items for systematic reviews and meta‐analyses: The PRISMA statement. Ann Intern Med 151: 264–269, W64. [DOI] [PubMed] [Google Scholar]
- Nugent AC, Davis RM, Zarate CA, Drevets WC (2013): Reduced thalamic volumes in major depressive disorder. Psychiatry Res 213:179–185. [DOI] [PMC free article] [PubMed] [Google Scholar]
- Ongür D, Drevets WC, Price JL (1998): Glial reduction in the subgenual prefrontal cortex in mood disorders. Proc Natl Acad Sci USA 95:13290–13295. [DOI] [PMC free article] [PubMed] [Google Scholar]
- Peng J, Liu J, Nie B, Li Y, Shan B, Wang G, Li K (2011): Cerebral and cerebellar gray matter reduction in first‐episode patients with major depressive disorder: A voxel‐based morphometry study. Eur J Radiol 80:395–399. [DOI] [PubMed] [Google Scholar]
- Phillips ML, Ladouceur CD, Drevets WC (2008): A neural model of voluntary and automatic emotion regulation: Implications for understanding the pathophysiology and neurodevelopment of bipolar disorder. Mol Psychiatry 13:829,833–857. [DOI] [PMC free article] [PubMed] [Google Scholar]
- Rabl U, Meyer BM, Diers K, Bartova L, Berger A, Mandorfer D, et al (2014): Additive gene‐environment effects on hippocampal structure in healthy humans. J Neurosci 34:9917–9926. [DOI] [PMC free article] [PubMed] [Google Scholar]
- Rajkowska G, Miguel‐Hidalgo JJ, Wei J, Dilley G, Pittman SD, Meltzer HY, et al (1999): Morphometric evidence for neuronal and glial prefrontal cell pathology in major depression. Biol Psychiatry 45:1085–1098. [DOI] [PubMed] [Google Scholar]
- Ripke S, Wray NR, Lewis CM, Hamilton SP, Weissman MM Major Depressive Disorder Working Group of the Psychiatric GWAS Consortium , et al (2013): A mega‐analysis of genome‐wide association studies for major depressive disorder. Mol Psychiatry 18:497–511. [DOI] [PMC free article] [PubMed] [Google Scholar]
- Salvadore G, Nugent AC, Lemaitre H, Luckenbaugh DA, Tinsley R, Cannon DM, et al (2011): Prefrontal cortical abnormalities in currently depressed versus currently remitted patients with major depressive disorder. NeuroImage 54:2643–2651. [DOI] [PMC free article] [PubMed] [Google Scholar]
- Sartorius N, Kaelber CT, Cooper JE, Roper MT, Rae DS, Gulbinat W, et al (1993): Progress toward achieving a common language in psychiatry. Results from the field trial of the clinical guidelines accompanying the WHO classification of mental and behavioral disorders in ICD‐10. Arch Gen Psychiatry 50:115–124. [DOI] [PubMed] [Google Scholar]
- Schmaal L, Veltman DJ, van Erp TGM, Sämann PG, Frodl T, Jahanshad N, et al (2015): Subcortical brain alterations in major depressive disorder: Findings from the ENIGMA Major Depressive Disorder working group. Mol Psychiatry. doi: 10.1038/mp.2015.69. [DOI] [PMC free article] [PubMed] [Google Scholar]
- Selvaraj S, Arnone D, Job D, Stanfield A, Farrow TF, Nugent AC, et al (2012): Grey matter differences in bipolar disorder: A meta‐analysis of voxel‐based morphometry studies. Bipolar Disord 14:135–145. [DOI] [PubMed] [Google Scholar]
- Sheline YI (2000): 3D MRI studies of neuroanatomic changes in unipolar major depression: The role of stress and medical comorbidity. Biol Psychiatry 48:791–800. [DOI] [PubMed] [Google Scholar]
- Singer T, Critchley HD, Preuschoff K (2009): A common role of insula in feelings, empathy and uncertainty. Trends Cogn Sci 13:334–340. [DOI] [PubMed] [Google Scholar]
- Stockmeier CA, Mahajan GJ, Konick LC, Overholser JC, Jurjus GJ, Meltzer HY, et al (2004): Cellular changes in the postmortem hippocampus in major depression. Biol Psychiatry 56:640–650. [DOI] [PMC free article] [PubMed] [Google Scholar]
- Sutton AJ, Abrams KR, Jones DR (2002): Generalized synthesis of evidence and the threat of dissemination bias. the example of electronic fetal heart rate monitoring (EFM). J Clin Epidemiol 55:1013–1024. [DOI] [PubMed] [Google Scholar]
- Treadway MT, Grant MM, Ding Z, Hollon SD, Gore JC, Shelton RC (2009): Early adverse events, HPA activity and rostral anterior cingulate volume in MDD. PloS One 4:e4887 [DOI] [PMC free article] [PubMed] [Google Scholar]
- Van Tol M‐J, van der Wee NJA, van den Heuvel OA, Nielen MMA, Demenescu LR, Aleman A, et al (2010): Regional brain volume in depression and anxiety disorders. Arch Gen Psychiatry 67:1002–1011. [DOI] [PubMed] [Google Scholar]
- Vasic N, Walter H, Höse A, Wolf RC (2008): Gray matter reduction associated with psychopathology and cognitive dysfunction in unipolar depression: A voxel‐based morphometry study. J Affect Disord 109:107–116. [DOI] [PubMed] [Google Scholar]
- Wagner G, Koch K, Schachtzabel C, Schultz CC, Sauer H, Schlösser RG (2011): Structural brain alterations in patients with major depressive disorder and high risk for suicide: Evidence for a distinct neurobiological entity? NeuroImage 54:1607–1614. [DOI] [PubMed] [Google Scholar]
- Wildgruber D, Riecker A, Hertrich I, Erb M, Grodd W, Ethofer T, Ackermann H (2005): Identification of emotional intonation evaluated by fMRI. NeuroImage 24:1233–1241. [DOI] [PubMed] [Google Scholar]
- Wise T, Cleare AJ, Herane A, Young AH, Arnone D (2014): Diagnostic and therapeutic utility of neuroimaging in depression: An overview. Neuropsychiatr Dis Treat 10:1509–1522. [DOI] [PMC free article] [PubMed] [Google Scholar]
- World Health Organization (2002): Reducing Risks, Promoting Health Life. France: World Health Rep. [Google Scholar]
- Worsley KJ, Friston KJ (1995): Analysis of fMRI time‐series revisited–again. NeuroImage 2:173–181. [DOI] [PubMed] [Google Scholar]
- Yoo S‐S, Paralkar G, Panych LP (2004): Neural substrates associated with the concurrent performance of dual working memory tasks. Int J Neurosci 114:613–631. [DOI] [PubMed] [Google Scholar]
- Young KA, Holcomb LA, Yazdani U, Hicks PB, German DC (2004): Elevated neuron number in the limbic thalamus in major depression. Am J Psychiatry 161:1270–1277. [DOI] [PubMed] [Google Scholar]
- Zhang J, Wang J, Wu Q, Kuang W, Huang X, He Y, Gong Q (2011): Disrupted brain connectivity networks in drug‐naive, first‐episode major depressive disorder. Biol Psychiatry 70:334–342. [DOI] [PubMed] [Google Scholar]
Associated Data
This section collects any data citations, data availability statements, or supplementary materials included in this article.
Supplementary Materials
Supporting Information