Supplemental Digital Content is available in the text.
Abstract
Background.
Early detection of rejection in kidney transplant recipients holds the promise to improve clinical outcomes. Development and implementation of more accurate, noninvasive methods to detect allograft rejection remain an ongoing challenge. The limitations of existing allograft surveillance methods present an opportunity for donor-derived cell-free DNA (dd-cfDNA), which can accurately and rapidly differentiate patients with allograft rejection from patients with stable organ function.
Methods.
This study evaluated the analytical performance of a massively multiplexed polymerase chain reaction assay that targets 13 962 single-nucleotide polymorphisms, characterized and validated using 66 unique samples with 1064 replicates, including cell line-derived reference samples, plasma-derived mixtures, and transplant patient samples. The dd-cfDNA fraction was quantified in both related and unrelated donor-recipient pairs.
Results.
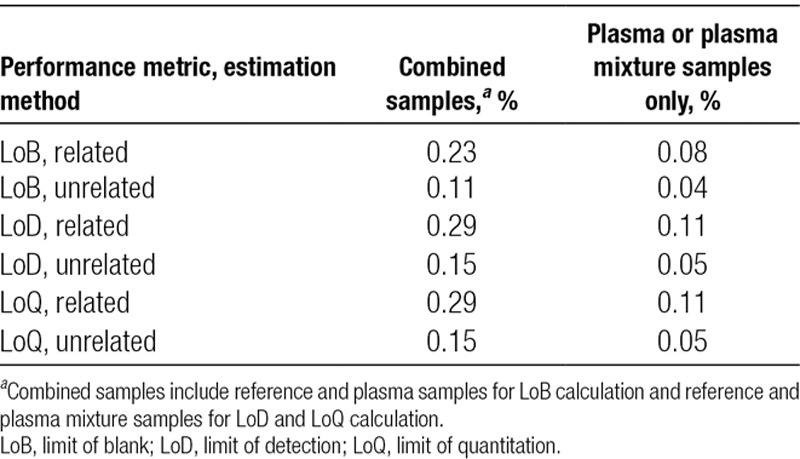
The dd-cfDNA assay showed a limit of blank of 0.11%, a limit of detection and limit of quantitation of 0.15% for unrelated donors, and limit of blank of 0.23%, a limit of detection and limit of quantitation of 0.29% for related donors. All other metrics (linearity, accuracy, and precision) were observed to be equivalent between unrelated and related donors. The measurement precision of coefficient of variation was 1.8% (repeatability, 0.6% dd-cfDNA) and was <5% for all the different reproducibility measures.
Conclusions.
This study validates the performance of a single-nucleotide polymorphism-based massively multiplexed polymerase chain reaction assay to detect the dd-cfDNA fraction with improved precision over currently available tests, regardless of donor-recipient relationships.
INTRODUCTION
Kidney transplantation is the best option for patients with end-stage renal disease.1 According to the United Network for Organ Sharing, more than 19 000 kidneys were transplanted in the United States in 2016 and approximately 200 000 patients are living with a functional kidney transplant (KT).1 Despite lifelong immunosuppressive maintenance regimens designed to optimize the therapeutic outcome,2 approximately 20%–30% of patients experience overall renal graft failure within the first 5 years,3 and only 55% of transplanted kidneys survive for 10 years.4,5 Thus, a compelling need exists for new strategies to avoid or minimize acute or subclinical rejection episodes, nephrotoxicity, other comorbidities, and otherwise improve clinical outcomes.6 Optimal implementation of new methods would require a simple, accurate way to monitor allograft health, allowing early detection of treatable pathology and with the goal of preventing graft loss by optimizing immunosuppressive regimens. Current clinical options to monitor allograft rejection in transplant recipients, most notably biopsies and assessing dynamic changes in serum creatinine (SCr), have significant drawbacks.
Biopsy with detailed pathology is the “gold standard” for the diagnosis of active rejection (AR). Although some centers recommend asymptomatic surveillance “protocol” biopsies, their clinical utility is significantly limited due to invasiveness, cost, inadequate sampling, and poor reproducibility.7-11 “For-cause” biopsies, typically ordered in response to changes in clinical symptoms and declining renal function, for example rising SCr and proteinuria, share similar limitations and are often performed only after substantial allograft injury.12 Subclinical rejection, without significant changes in renal function or proteinuria, is predicted by previous active rejection events and rising donor-specific antibody titers but requires biopsy for confirmation.13
SCr levels are commonly used to screen patients for AR and indicate when biopsy and histological evaluation of renal tissue are warranted.8,14 Although easy to measure, SCr is a poor marker due to its low sensitivity and specificity. Furthermore, it is a lagging indicator of renal injury;15 by the time SCr levels increase, the allograft may have undergone severe and irreversible damage.6,16 Thus, there is a need for a simple, noninvasive, highly accurate assay that can detect ongoing AR.
Donor-derived cell-free DNA (dd-cfDNA) found in the plasma of transplant patients is a proven noninvasive biomarker for KT rejection.2,9,14,17-19 dd-cfDNA has also been utilized in assessing graft function in other organ transplants (liver, heart, lung, and bone marrow).2,20-26 We have previously demonstrated accurate quantification of cell-free DNA (cfDNA) mixture proportions using a single-nucleotide polymorphism (SNP)-based massively multiplexed polymerase chain reaction (SNP-mmPCR) methodology in the prenatal and multiplexed PCR (mPCR) methodology in oncology context.27-30 Leveraging this technology, we have developed a noninvasive assay that estimates dd-cfDNA fraction (DF) in KT recipients by measuring the allele frequency at 13 962 SNPs chosen to maximize informative genotypes across ethnicities. A recent clinical validation study demonstrated the ability of this method to discriminate AR from nonrejection with a sensitivity of 88.7%, specificity of 72.6%, and area under the curve (AUC) of 0.87 using a DF cutoff of 1%.14 In the current study, we analytically validate our clinical-grade next-generation sequencing (NGS) assay by determining the limit of blank (LoB), limit of detection (LoD), limit of quantitation (LoQ), linearity, precision (reproducibility and repeatability), and accuracy in measuring the DF in KT recipients in both related and unrelated donors.
MATERIALS AND METHODS
Samples
Plasma Mixture Samples
Whole blood samples (20 mL) were collected from healthy volunteers (n = 31) and transplant patients (n = 6) in Cell-Free DNA BCT tubes (Streck, Omaha, NE) in accordance with the Institutional Review Board (IRB)-approved protocol (Ethical and Independent IRB, Corte Madera, CA; approval number: IRB00007807, protocol number: 18-141) and the Declaration of Helsinki. All participants provided signed informed consents. Plasma (5–10 mL) was isolated from blood after centrifugation at 3220g for 30 minutes at 22°C and stored at −80°C. cfDNA was extracted using either Natera’s in-house spin column-based chemistry for extraction (San Carlos, CA) or QIAamp Circulating Nucleic Acid Kit (Qiagen, Germatown, MD) and was used as either blanks (n = 15) for LoB or plasma mixture samples (n = 16). Plasma mixture samples were developed from 3 unrelated (1 male designated donor and 3 female designated recipient; StemExpress, Folsom, CA) and 6 related (3 mother-son pairs, 2 brother-sister pairs, and 1 uncle-niece pair) binary mixture samples. cfDNA concentration of plasma mixture samples was quantified using Quant-iT or Qubit dsDNA kits (Thermo Fisher, Carlsbad, CA).
Reference Samples (Cell-line Derived)
Reference samples were procured from SeraCare Life Sciences (Milford, MA) and were developed by mixing genomic DNA from 5 different cell lines to generate 3 binary female (recipient) to male (donor) reference mixtures (1 related and 2 unrelated) at specific targeted DFs (0%, 0.1%, 0.3%, 0.6%, 1.2%, 2.4%, 5%, 10%, and 15%). The DF in each reference mixture was verified by digital droplet polymerase chain reaction (ddPCR) by SeraCare. The genomic DNA mixtures were sheared by sonication and size selected to mimic expected cfDNA fragments of 160 base pairs by SeraCare. cfDNA concentration of the reference samples was quantified using Quant-iT or Qubit dsDNA kits.
Targeted Amplification, SNP Selection, Sequencing Data Analysis, and Quality Control
All samples were used as input for library preparation followed by targeted PCR amplification.27 Targeted amplification was achieved by performing mmPCR as previously described, with a modification to the primer pool, which targeted 13 926 SNP positions (Figure 1).29 Biallelic SNPs were selected on chromosomes 2, 13, 18, 21, 22, and X although only chromosomes 2, 13, 18, and 21 were included in the DF analysis. To ensure accurate DF estimate regardless of patient ethnicity, SNPs were required to have high minor allele frequency across the major ethnic groups as defined in the 1000 Genomes Project.31
FIGURE 1.

Workflow of a clinical grade next-generation sequencing assay. Donor-derived cfDNA is released from renal allograft into circulation; blood is drawn and centrifuged, and plasma is isolated. cfDNA is extracted from plasma samples and used for library preparation followed by targeted PCR amplification of 13 926 SNPs, performed using mmPCR. Amplicons are sequenced on a next-generation sequencer, and sequencing data are analyzed using a maximum likelihood estimate method to give a dd-cfDNA fraction, which is reported to the physician. cfDNA, cell-free DNA; dd-cfDNA, donor-derived cell-free DNA; mmPCR, massively multiplexed polymerase chain reaction; PCR, polymerase chain reaction; SNP, single-nucleotide polymorphism.
The PCR amplicons generated after targeted amplification were barcoded and combined to generate 32-plex pools, which were sequenced using NGS technology (Illumina NextSeq 500 instrument, 50 cycles, single-end reads). Approximately 940 DNA copies were sequenced per locus. Sequenced reads were demultiplexed and mapped to the hg19 reference genome using Novoalign version 2.3.4 (http://www.novocraft.com/products/novoalign/). Bases with Phred quality score <30 and reads with mapping quality score <30 were filtered. Multiple quality checks (QCs) (cluster density, mapping rate, etc) were applied to the sequencing run, and each sample was confirmed to have the desired number of reads (8 million) after filtering. Any pool failing sequencing run QCs was resequenced. Any sample that failed to produce the necessary number of reads was removed from the analysis.
DF Calculation
For each sample, DF was estimated on the basis of the minor allele frequencies measured for all SNPs where the recipient was estimated to be homozygous. The DF calculation is a maximum likelihood estimate over a search range from 0.01% to 25% at increments of 0.01%. While the technology places no upper limit on the dynamic range of the assay, 25% was chosen for this study on the basis of the DF ranges observed in KT patients. Our approach did not include a separate donor sample. Donor genotype determination was not performed. Rather, a probability model was employed. No heuristic adjustment was needed for related donors because the algorithm does not incorporate prior assumptions regarding the level of genotype concordance between the recipient and the donor. Instead, the corresponding genotype inheritance constraints were incorporated into the donor genotype probability model when the donor and the recipient were related. This estimate mode was referred as “related estimate,” and the unconstrained estimate was referred as “unrelated estimate.”
Experimental Plan and Statistical Analysis
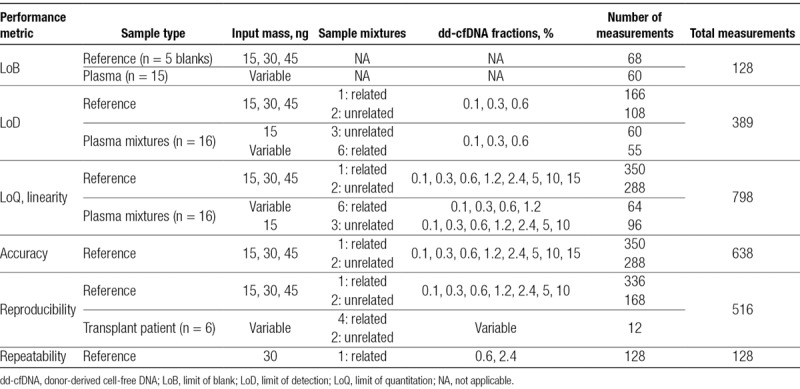
To evaluate analytical performance of the test, LoB, LoD, LoQ, linearity, precision, and accuracy were measured on the basis of Clinical and Laboratory Standards Institute (CLSI) guidelines (EP-17A2, EP05-A3).32,33 Experimental design with sample type, input mass, DFs, and number of measurements for each study is listed in Table 1. All samples were tested with a minimum input amount of 15 ng and run in a minimum of triplicates, except for clinical samples, which were tested in duplicates (Section S1: Table S1, SDC, http://links.lww.com/TP/B701). Statistical analysis was performed using Python programming language (Python Software Foundation, version 3.6, https://www.python.org/).
TABLE 1.
Experimental design
Limit of Blank
LoB was established using reference samples (blanks or single genome), obtained from SeraCare (n = 5), and plasma samples (n = 15) collected from healthy blood donors with no history of organ transplant or recent blood transfusion (Table 1). Reference samples were prepared at different targeted library input amounts to mimic the expected range of cfDNA yields achieved from 20mL blood collections. Plasma samples were used at their unadjusted concentrations to reflect the variable cfDNA yields typical from real samples. In compliance with Clinical and Laboratory Standards Institute guidelines (EP-17A2),32 samples were tested in triplicate on 3 different days with 2 different sequencing reagent lots that consisted of at least 60 measurements per lot.
LoB is defined as the empirical 95th percentile value measured from a set of blank (no-analyte) samples. The calculation is performed for the reference samples and plasma samples from each reagent lot (lots 1 and 2) and for each DF estimation method, that is, unrelated and related. For each estimation method, the final LoB was the maximum of the 2 per-lot results.
Limit of Detection and Limit of Quantitation
LoD and LoQ were measured using both reference samples and plasma mixture samples from healthy volunteers at different cfDNA input amounts. LoD was measured at the three lowest DFs by 2 operators on different days using different reagent lots and sequencing instruments. LoQ analysis was performed on the same samples as LoD with additional replicates at higher DFs (Table 1).
LoD was calculated following the parametric estimate method specified in EP-17A2,32 which computes LoD by adding an standard deviation (SD) term to the LoB. LoDs for reference samples and plasma mixture samples for each reagent lot were calculated for each DF estimation method by combining the corresponding LoBs and SD measurements. Similar to LoB, for each estimation method, the final LoD value was calculated using the maximum value of lots 1 and 2, calculated with the corresponding method. Furthermore, LoDs were also calculated separately for each DF estimation method for plasma mixture samples and reference samples, at each input amount.
An appropriate LoQ assessment was selected on the basis of the quantification requirements of the test process. LoQ is defined as the lowest DF at which a sufficient relative measurement precision is achieved, lower bounded by the LoD. We defined sufficient relative measurement precision as 20% coefficient of variation (CV). The relationship between DF and its CV was modeled as CV = a + b × exp(−c × DF), where the model parameters a, b, and c were estimated from the data using a nonlinear least-squares procedure. The CV model (described by parameters a, b, and c) was estimated for each DF estimate method and used to evaluate the LoQ criterion mentioned previously. This model-based approach requires inclusion of higher DF measurements for the LoQ assessment to ensure convergence to an appropriate constant value at high DF. In line with the aforementioned LoD calculation, LoQs for reference samples and plasma mixture samples were calculated for each reagent lot and DF estimation method. The final LoQ value was calculated from the maximum of the values of lots 1 and 2, calculated using the corresponding method. LoQs were also calculated for each DF estimation method separately for plasma mixture samples and for reference samples at each input amount.
Linearity and Accuracy
Linearity and accuracy were measured using the same sample set as described for LoQ, with the accuracy measurement restricted to reference samples only. Linearity was evaluated on the basis of the R2 value produced by a standard linear regression analysis of the relationship between measured DF and targeted mixture fractions for each DF estimation method. Linearity was evaluated for both reference and plasma mixture samples separately for each DF estimation method. Accuracy was evaluated on the basis of the linear regression analysis of the relationship between measured DF and the orthogonal ddPCR measurement for each DF estimation method.
Precision
Precision was measured by testing reproducibility (interrun) and repeatability (intrarun) across reference and transplant samples. Matched blood draws (4 tubes per patient) from transplant recipients were run in duplicates and were evaluated for reproducibility in clinical samples. Reproducibility samples were processed by 2 different operators on 8 different days (24 runs across 23 days) with 3 reagent lots and 17 sequencing instruments. Repeatability was determined by measuring variability between technical replicates of samples measured under similar conditions. One related (mother-son) reference mixture at 2 DFs was assayed by a single operator, reagent lot, and instrument.
Repeatability, defined as the CV measured across the set of replicates at a single targeted DF, under matched conditions was calculated once at 0.6% and once at 2.4% DF. Reproducibility was also measured using CV, calculated separately for each combination of DNA input amount and mixture fraction.
RESULTS
Limit of Blank
LoB was calculated using 64 measurements from lots 1 and 2 each. The LoB was found to be 0.11% for the unrelated donor estimate and 0.23% for the related donor estimate. Evaluation of plasma sample measurements only (60 measurements total, combined across both lots) resulted in LoB of 0.04% (unrelated) and 0.08% (related), suggesting a significantly lower LoB in plasma samples when compared with that of reference samples. Figure 2 shows histograms of the relevant DF measurements broken down by method and lot (Section S2: Figure S1 and Tables S2 and S3, SDC, http://links.lww.com/TP/B701).
FIGURE 2.

Histograms of measured dd-cfDNA for LoB analysis. A, Related method, lot 1. B, Unrelated method, lot 1. C, Related method, lot 2. D, Unrelated method, lot 2. dd-cfDNA, donor-derived cell-free DNA; LoB, limit of blank.
LoD and LoQ
LoD was calculated from 168 and 220 measurements from unrelated and related samples, respectively, resulting in LoD of 0.15% (unrelated) and 0.29% (related). One sample was excluded from the analysis due to failed QC. The difference in LoD for related versus unrelated donors was approximately equal to the difference in corresponding LoB, meaning that the measurement variance near the LoD was approximately the same in the two methods. The LoD was not significantly different at the different DNA input amounts (Section S3: Figures S2 and S3 and Table S4, SDC, http://links.lww.com/TP/B701). Restricting the measurements to plasma mixture samples yielded lower estimated LoD: 0.05% (unrelated) and 0.11% (related), although the number of measurements performed was less (54, related and 60, unrelated) than suggested by the guidelines (Section S3: Table S5, SDC, http://links.lww.com/TP/B701).
LoQ was calculated from 381 and 412 measurements from unrelated and related samples, respectively, after exclusion of 5 samples that failed QC. Upper LoQ is the largest DF tested, which is 15%. The empirical CVs were all found to be <20% at each targeted DF, including reference and plasma mixture samples. Empirical CVs and the resulting parametric models are shown in Figure 3. The modeled CVs were also found to be <20% for all DFs greater than or equal to the LoD. Thus, the LoQ is equal to the LoD for all relevant scenarios. This was observed to be true when the analysis was restricted to plasma mixture samples only, as well as to reference samples only, at each input amount (Section S4: Figures S4 and S5 and Table S6, SDC, http://links.lww.com/TP/B701). For ease of reference, Table 2 summarizes the results of LoB, LoD, and LoQ.
FIGURE 3.
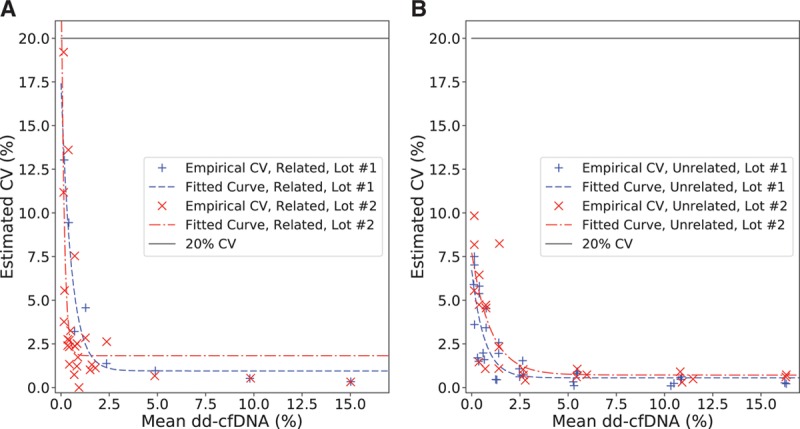
Measured CV values (%) as a function of the corresponding empirical means (%) for LoQ analysis. A, Related samples. B, Unrelated samples. CV, coefficient of variation; LoQ, limit of quantitation.
TABLE 2.
LoB, LoD, and LoQ values for each estimation method and various sample types
Linearity, Accuracy, and Precision
Linearity was measured from 381 unrelated and 412 related samples, after removal of 5 samples that failed QC. Accuracy was measured from the subset of these (reference samples) for which ddPCR-measured DF was available as a reference (285 unrelated and 349 related samples), excluding 4 that failed QC. Linearity was also evaluated for 6 clinical transplant patient samples using 12 measurements, all of which passed QC. The individual measurements and linear regression lines are shown in Figure 4 (linearity) and Figure 5 (accuracy). Figure 6 shows the measured DFs from lot 2 plotted against those from lot 1 and the linear regression line for clinical transplant patient samples.
FIGURE 4.
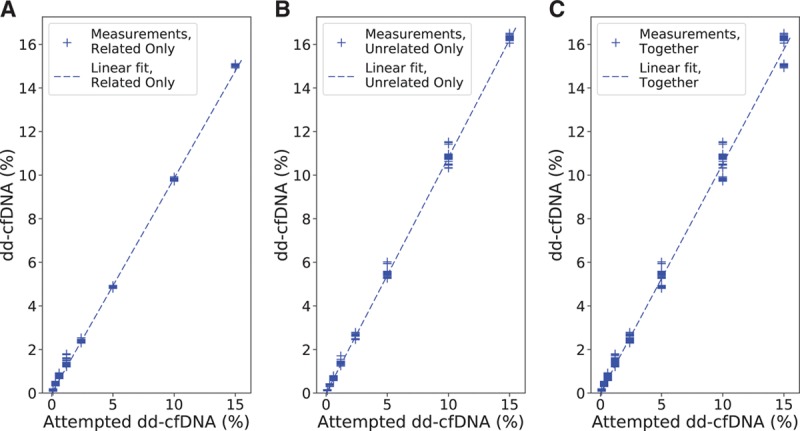
Measured dd-cfDNA as a function of the corresponding attempted spike levels, along with the calculated linear fit, for linearity analysis. A, Related only. B, Unrelated only. C, Related and unrelated cases together. dd-cfDNA, donor-derived cell-free DNA.
FIGURE 5.
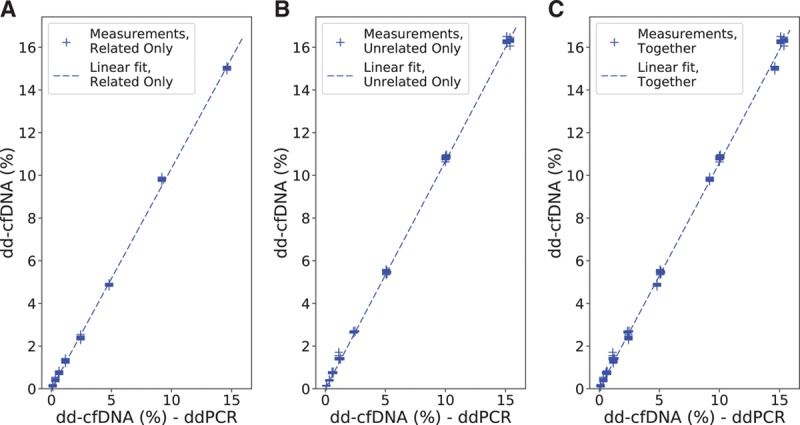
Measured dd-cfDNA as a function of the corresponding ddPCR values, along with the calculated linear fit for accuracy analysis. A, Related only. (b) Unrelated only. (c) Related and unrelated cases together. dd-cfDNA, donor-derived cell-free DNA; ddPCR, digital droplet polymerase chain reaction.
FIGURE 6.
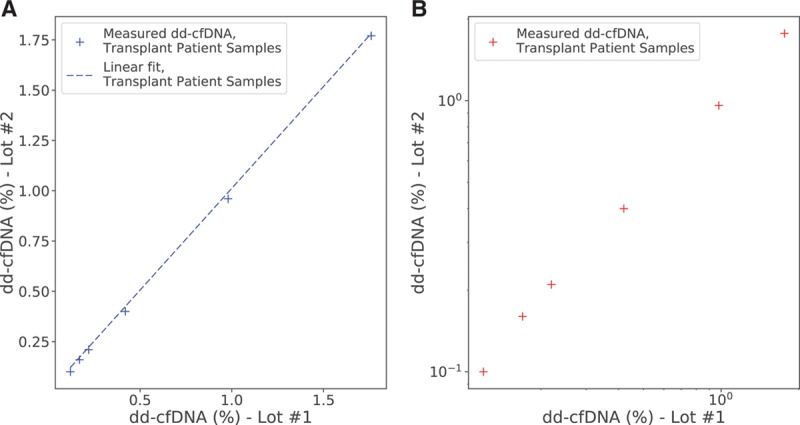
Measured dd-cfDNA from lot 2 as a function of the values from lot 1. A, On linear scale, along with the calculated linear fit. B, On log-log scale. dd-cfDNA, donor-derived cell-free DNA.
Linearity was measured by linear regression against the targeted DF, and accuracy was measured by linear regression against the ddPCR-measured DF. Linearity for clinical transplant patient samples was measured by a linear regression of the measured DF from lot 2 plotted against that from lot 1. The linear regression results are given in Table 3. The DF measurement was observed to be highly linear (R2 >0.99 in all models) and accurate (slope approximately 1, intercept approximately 0) with no significant difference between related and unrelated donors. Linearity and accuracy analyses restricted to plasma mixture and reference samples only are provided in the Supplemental Material and Methods (Section S5: Figures S6 and S7 and Table S7; Section S6: Figure S8 and Table S8, SDC, http://links.lww.com/TP/B701).
TABLE 3.
Linear regression results for linearity and accuracy, including 95% CI

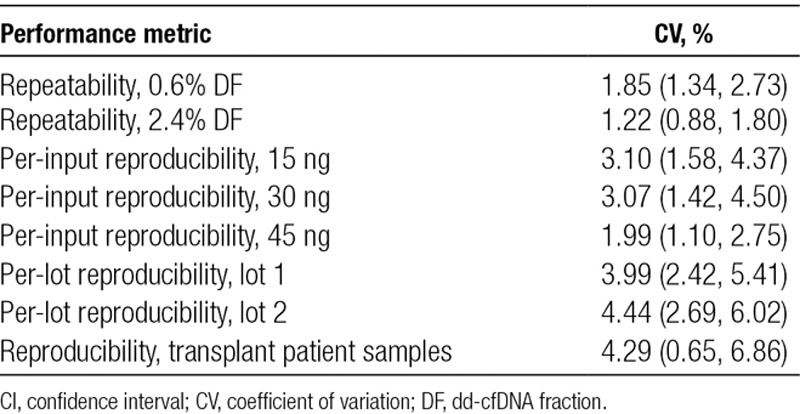
Precision was estimated by evaluating CV in 2 scenarios: repeatability within a single set of conditions and reproducibility across a varied set of conditions. CV calculations combined samples with related and unrelated donors. Repeatability was measured at 2 targeted DFs (0.6% and 2.4%), each using 64 reference sample measurements with all samples passing QC.
Per-input reproducibility was calculated by using 498 measurements, excluding 6 samples that failed QC. Per-lot reproducibility was calculated from a subset of the aforementioned samples, whose cardinality was 374, excluding 4 samples that failed QC. Reproducibility of DF in clinical transplant patient samples was calculated using the aforementioned 12 measurements. The estimated CVs, along with 95% confidence interval (CI), are provided in Table 4. Finally, for clinical transplant patient samples, 100% concordance of clinical calls was observed (95% CI: 54.07%–100%) between replicates (Section S7: Figure S9, SDC, http://links.lww.com/TP/B701).
TABLE 4.
Estimated CVs, including 95% CI, for repeatability and reproducibility for different scenarios
DISCUSSION
Early detection of rejection in KT recipients holds promise for improved outcomes, but this goal remains unmet due to the unavailability of accurate, noninvasive methods to detect allograft rejection before substantial injury has occurred. Given the limitations associated with current allograft monitoring practices, most notably SCr and biopsy, there exists an opportunity to develop better tools for early detection of allograft rejection.
Several studies have shown the clinical relevance of noninvasive dd-cfDNA assays, which gives an assessment of the likelihood of AR in recipients of KT.14,18 In 2017, Bloom et al.18 using a different targeted NGS approach, correlated plasma DF and rejection status in 107 biopsy-matched specimens, demonstrating a significant difference in median DF between cases with AR (1.6%) and nonrejection (0.3%; P < 0.001) using a predefined cutoff of >1%, with sensitivity and specificity of 59% and 85%, respectively. In a more recent study, Sigdel et al.14 evaluated DF in 217 biopsy-matched plasma samples and showed the superior performance of dd-cfDNA in differentiating AR (including subclinical rejection) from nonrejection (including stable, borderline, and other injury cases) compared with estimated glomerular filtration rate, with a sensitivity of 88.7% versus 67.7%, specificity of 72.6% versus 65.3%, and AUCs of 0.87 versus 0.74, respectively. The study showed similar performance of the dd-cfDNA assay in protocol and for-cause biopsies, as well as the ability to detect both antibody-mediated and T cell-mediated rejection.14 The assay did not need prior genotype information and was robust to different donor-recipient relationships.
The current study addresses the analytical validity of the DF quantification method used in Sigdel et al. Patients with DF of ≥1% are classified as “at increased risk of organ rejection”;14 analytical performance should be interpreted in the context of accurately classifying a sample with respect to this threshold. In this study, LoD and LoQ were shown to be 0.15% for unrelated donors and 0.29% for related donors, indicating an ability to accurately quantify DF at a level significantly lower than the classification threshold. When analysis was restricted to plasma mixture samples, which are more reflective of clinical samples, the LoD and LoQ were observed to be significantly lower (0.05% LoD and LoQ for unrelated donors). This difference can be partly attributed to the significantly higher per-base insert error rate in reference samples compared with that in plasma samples in the LoB calculation (0.001355 versus 0.001170, P < 0.0001, independent t-test). Contrived reference samples are commonly substituted for plasma samples in analytical testing, and this difference in the error rate is negligible in evaluations other than LoB. Analytical performance of a different SNP-based assay2 for measuring DF in KT recipients reported similar LoD and LoQ (0.15%, and 0.2%, respectively) but did not report any distinction between reference and plasma samples although they were both evaluated.
The current method was also confirmed to have high accuracy on the basis of linear regression analysis, comparing measurements on >600 samples to an orthogonal DF measurement, ddPCR. Performance was evaluated with respect to a range of DNA input masses, selected to represent the expected distribution of cfDNA yields achieved from the clinical protocol-specified 20mL blood collections. No detectable performance difference was observed at different DNA input levels. Precision studies showed that the DF measurement was stable across intrarun and interrun replicates, across multiple lots of critical reagents, and between repeat (concurrent) blood draws from the same patient. This indicates that the test is appropriate for large-scale implementation in a clinical laboratory setting.
This assay achieved superior measurement precision close to the classification range, as compared to a previously published assay,2 with a CV of 1.85% versus 9.2% (within run, at 0.6% DF) and a CV of 1.99% (across runs, at 45 ng input) versus 4.5% (across runs, at 60 ng input). The approximately 5-fold difference in CV measured within run at a DF relatively close to the classification threshold indicates that this assay has improved precision; taken in combination with the higher AUC demonstrated previously,14 this suggests that the higher precision may have a positive impact on clinical accuracy. Several factors may account for this improvement in performance. The library preparation step reduces variability caused by the long DNA fragments. Also, the very large number of targeted SNPs (13926) and the probability model for donor genotypes enable an accurate DF estimation independent of the degree of relationship between the donor and the recipient. This is important due to the concern that the higher rate of genotype concordance (implying a lower rate of informative genotypes) in a related donor scenario might limit the accuracy of DF estimates. This study tested a large number of mixture sample replicates from mother-child and other related donor pairings and showed an LoB that was higher in related donor pairs, which led to correspondingly higher LoD, although these limits were still substantially below the assay’s clinical threshold. All the other metrics, including linearity, accuracy, and the various precision metrics, were equivalent between related and unrelated donor pairs, showing that the quantitative performance of the test is not meaningfully impacted by the reduced number of informative genotypes. The previously published method addressed this concern through in silico estimates but did not confirm test performance on reference samples or plasma mixture samples from related individuals.2
Several other methods have been used to measure dd-cfDNA levels in transplant recipients. Beck et al20 described a fast, inexpensive ddPCR method and demonstrated its use in heart, liver, and KT patients; the CV was shown to range from 4% to 14%, and precision was not measured <2%, which is above the cutoff used in the current study. De Vlaminck et al.21,24 described a shotgun NGS method, which was shown to detect mild and moderate-to-severe rejection events with an AUC of 0.75; the method required prior genotyping of the donor and recipient before transplant. Sharon et al.25 recently described another shotgun NGS method that overcomes the need for prior genotyping of the donor, although not the recipient, that estimated dd-cfDNA in both related and unrelated donor-recipients. None of these methods have been validated for clinical use. The SNP-based mmPCR assay described in the current study does not require prior genotyping of either donor or recipient and detects DF with a high precision (a CV of <2%), irrespective of the donor-recipient relationship. Although this study has only validated the assay for use in KT, we expect that it will show clinical value in other organ transplants such as heart, liver, and bone marrow.
CONCLUSIONS
With an unacceptably high rate of allograft rejection in KT recipients, a paradigm shift in the management of renal allograft health is overdue. Routine measurement of dd-cfDNA, with its ability to detect rejection early and noninvasively, represents a key strategy to improve clinical outcomes. Ongoing registry studies seek to demonstrate the efficacy of dd-cfDNA to detect allograft rejection, and its corresponding utility for optimizing biopsy use, immunosuppressive regimen, and improving graft survival rates. This study demonstrates the analytical validity of an accurate, noninvasive SNP-based dd-cfDNA assay. Taken alongside the clinical validation of this assay, demonstrated by Sigdel et al,14 this heralds a new diagnostic tool for nephrologists with the promise of better patient management and outcomes.
ACKNOWLEDGMENTS
The authors would like to acknowledge the support of Felipe Acosta Archila for developing the DF calculation, Christina Ng for assistance with sequencing, Derrick Renner for assistance with sequencing and sample preparation, and Daniel McCarthy and Alexis Ah Yo for assistance with reagent procurement for the study.
Supplementary Material
Footnotes
Y.A., N.L., and R.R. contributed equally to this work.
All authors are employees of Natera, Inc. with stock or options to own stock in the company.
This study was funded by Natera, Inc.
Y.A., R.R., R.K.S., N.L., B.Z., A.R., E.A., H.R., M.B., and P.R.B. were involved in conceptualization and study design. Y.A., R.R., R.K.S., N.L., E.A., and H.R. performed investigation and research performance. Y.A., R.R., N.L., A.R., E.A., and H.R. contributed to data acquisition and data analysis or interpretation. Y.A., E.A., and A.R. assisted with statistical analysis. Y.A., E.A., and P.R.B. provided resources and analytical tools. Y.A., R.R., N.L., A.R., M.M., Z.P.D., and H.R. performed manuscript drafting. Y.A., R.R., R.K.S., N.L., B.Z., A.R., M.M., Z.P.D., E.A., H.R., M.B., and P.R.B. were involved in manuscript revision and intellectual contribution. R.K.S., B.Z., A.R., Z.P.D., H.R., M.B., and P.R.B. aided in supervision.
The authors declare no conflicts of interest.
Supplemental digital content (SDC) is available for this article. Direct URL citations appear in the printed text, and links to the digital files are provided in the HTML text of this article on the journal’s Web site (www.transplantjournal.com).
REFERENCES
- 1.United States Renal Data System. National Institutes of Health, National Institute of Diabetes and Digestive and Kidney Diseases; 2018. 2018 USRDS annual data report: epidemiology of kidney disease in the United States. Available at https://www.usrds.org/2018/view/v2_06.aspx. Accessed December 12, 2018. [Google Scholar]
- 2.Grskovic M, Hiller DJ, Eubank LA, et al. Validation of a clinical-grade assay to measure donor-derived cell-free DNA in solid organ transplant recipients. J Mol Diagn 201618890–902 [DOI] [PubMed] [Google Scholar]
- 3.Tanriover B, Jaikaransingh V, MacConmara MP, et al. Acute rejection rates and graft outcomes according to induction regimen among recipients of kidneys from deceased donors treated with tacrolimus and mycophenolate. Clin J Am Soc Nephrol 2016111650–1661 [DOI] [PMC free article] [PubMed] [Google Scholar]
- 4.Lamb KE, Lodhi S, Meier-Kriesche HU. Long-term renal allograft survival in the United States: a critical reappraisal. Am J Transplant 201111450–462 [DOI] [PubMed] [Google Scholar]
- 5.Arnaud CH. Uncovering the hidden signs of organ transplant rejection. Chem Eng News. 2018;96:5. [Google Scholar]
- 6.Serón D, Arns W, Chapman JR. Chronic allograft nephropathy—clinical guidance for early detection and early intervention strategies. Nephrol Dial Transplant 2008232467–2473 [DOI] [PubMed] [Google Scholar]
- 7.Sigdel TK, Vitalone MJ, Tran TQ, et al. A rapid noninvasive assay for the detection of renal transplant injury. Transplantation 20139697–101 [DOI] [PMC free article] [PubMed] [Google Scholar]
- 8.Ahmad I. Biopsy of the transplanted kidney. Semin Intervent Radiol 200421275–281 [DOI] [PMC free article] [PubMed] [Google Scholar]
- 9.García Moreira V, Prieto García B, Baltar Martín JM, et al. Cell-free DNA as a noninvasive acute rejection marker in renal transplantation. Clin Chem 2009551958–1966 [DOI] [PubMed] [Google Scholar]
- 10.Veronese FV, Manfro RC, Roman FR, et al. Reproducibility of the Banff classification in subclinical kidney transplant rejection. Clin Transplant 200519518–521 [DOI] [PubMed] [Google Scholar]
- 11.Morgan TA, Chandran S, Burger IM, et al. Complications of ultrasound-guided renal transplant biopsies. Am J Transplant 2016161298–1305 [DOI] [PubMed] [Google Scholar]
- 12.Stegall MD, Gaston RS, Cosio FG, et al. Through a glass darkly: seeking clarity in preventing late kidney transplant failure. J Am Soc Nephrol 20152620–29 [DOI] [PMC free article] [PubMed] [Google Scholar]
- 13.Nankivell BJ, Chapman JR. The significance of subclinical rejection and the value of protocol biopsies. Am J Transplant 200662006–2012 [DOI] [PubMed] [Google Scholar]
- 14.Sigdel TK, Archila FA, Constantin T, et al. Optimizing detection of kidney transplant injury by assessment of donor-derived cell-free DNA via massively multiplex PCR. J Clin Med. 2018;8:E19. doi: 10.3390/jcm8010019. [DOI] [PMC free article] [PubMed] [Google Scholar]
- 15.Slocum JL, Heung M, Pennathur S. Marking renal injury: can we move beyond serum creatinine? Transl Res 2012159277–289 [DOI] [PMC free article] [PubMed] [Google Scholar]
- 16.Bromberg JS, Brennan DC, Poggio E, et al. Biological variation of donor-derived cell-free DNA in renal transplant recipients: clinical implications. J App Lab Med 20172309–321 [DOI] [PubMed] [Google Scholar]
- 17.Lo YM, Tein MS, Pang CC, et al. Presence of donor-specific DNA in plasma of kidney and liver-transplant recipients. Lancet 19983511329–1330 [DOI] [PubMed] [Google Scholar]
- 18.Bloom RD, Bromberg JS, Poggio ED, et al. Cell-free DNA and active rejection in kidney allografts. J Am Soc Nephrol 2017282221–2232 [DOI] [PMC free article] [PubMed] [Google Scholar]
- 19.Jordan SC, Bunnapradist S, Bromberg JS, et al. Donor-derived cell-free DNA identifies antibody-mediated rejection in donor specific antibody positive kidney transplant recipients. Transplant Direct. 2018;4:e379. doi: 10.1097/TXD.0000000000000821. [DOI] [PMC free article] [PubMed] [Google Scholar]
- 20.Beck J, Bierau S, Balzer S, et al. Digital droplet PCR for rapid quantification of donor DNA in the circulation of transplant recipients as a potential universal biomarker of graft injury. Clin Chem 2013591732–1741 [DOI] [PubMed] [Google Scholar]
- 21.De Vlaminck I, Valantine HA, Snyder TM, et al. Circulating cell-free DNA enables noninvasive diagnosis of heart transplant rejection. Sci Transl Med. 2014;6:241ra77. doi: 10.1126/scitranslmed.3007803. [DOI] [PMC free article] [PubMed] [Google Scholar]
- 22.Hidestrand M, Tomita-Mitchell A, Hidestrand PM, et al. Highly sensitive noninvasive cardiac transplant rejection monitoring using targeted quantification of donor-specific cell-free deoxyribonucleic acid. J Am Coll Cardiol 2014631224–1226 [DOI] [PMC free article] [PubMed] [Google Scholar]
- 23.Oellerich M, Walson PD, Beck J, et al. Graft-derived cell-free DNA as a marker of transplant graft injury. Ther Drug Monit 201638Suppl 1S75–S79 [DOI] [PubMed] [Google Scholar]
- 24.De Vlaminck I, Martin L, Kertesz M, et al. Noninvasive monitoring of infection and rejection after lung transplantation. Proc Natl Acad Sci U S A 201511213336–13341 [DOI] [PMC free article] [PubMed] [Google Scholar]
- 25.Sharon E, Shi H, Kharbanda S, et al. Quantification of transplant-derived circulating cell-free DNA in absence of a donor genotype. PLoS Comput Biol. 2017;13:e1005629. doi: 10.1371/journal.pcbi.1005629. [DOI] [PMC free article] [PubMed] [Google Scholar]
- 26.Beck J, Oellerich M, Schulz U, et al. Donor-derived cell-free DNA is a novel universal biomarker for allograft rejection in solid organ transplantation. Transplant Proc 2015472400–2403 [DOI] [PubMed] [Google Scholar]
- 27.Zimmermann B, Hill M, Gemelos G, et al. Noninvasive prenatal aneuploidy testing of chromosomes 13, 18, 21, X, and Y, using targeted sequencing of polymorphic loci. Prenat Diagn 2012321233–1241 [DOI] [PMC free article] [PubMed] [Google Scholar]
- 28.Pergament E, Cuckle H, Zimmermann B, et al. Single-nucleotide polymorphism-based noninvasive prenatal screening in a high-risk and low-risk cohort. Obstet Gynecol 20141242 Pt 1210–218 [DOI] [PMC free article] [PubMed] [Google Scholar]
- 29.Ryan A, Hunkapiller N, Banjevic M, et al. Validation of an enhanced version of a single-nucleotide polymorphism-based noninvasive prenatal test for detection of fetal aneuploidies. Fetal Diagn Ther 201640219–223 [DOI] [PubMed] [Google Scholar]
- 30.Jamal-Hanjani M, Wilson GA, Horswell S, et al. Detection of ubiquitous and heterogeneous mutations in cell-free DNA from patients with early-stage non-small-cell lung cancer. Ann Oncol 201627862–867 [DOI] [PubMed] [Google Scholar]
- 31.Auton A, Brooks LD, Durbin RM, et al. ; 1000 Genomes Project Consortium A global reference for human genetic variation. Nature 201552668–74 [DOI] [PMC free article] [PubMed] [Google Scholar]
- 32.Clinical and Laboratory Standards Institute (CLSI) Evaluation of detection capability for clinical laboratory measurement procedures: approved guideline. CLSI document EP17-A2. 2nd ed. Vol 32. Wayne, PA: Clinical and Laboratory Standards Institute; 2012. [Google Scholar]
- 33.Clinical and Laboratory Standards Institute (CLSI) Evaluation of precision of quantitative measurement procedures: approved guideline. CLSI document EP05-A3. 3rd ed. Vol 34. Wayne, PA: Clinical and Laboratory Standards Institute; 2014. [Google Scholar]


