Abstract
We aimed to evaluate the prognostic value of clinical and pathologic factors in rectal squamous cell carcinomas (SCC) and to construct a nomogram for their outcome prediction.
The study cohort was selected from Surveillance, Epidemiology, and End Results (SEER) program between January 2004 and December 2013. Univariate and multivariate analyses were performed using Cox proportional hazards regression model to evaluate the prognostic value of involved variables. All prognostic factors were combined to construct a nomogram to predict the overall survival (OS), followed by discrimination as well as calibration plots and receiver operating characteristic (ROC) curves for assessing the predictive accuracy of the nomogram.
We identified 806 patients with a median follow-up time of 35 months. Multivariate analyses revealed that marital status (P < .001), age (P < .001), T stage (P = .008), M stage (P < .001), surgery (P = .004), chemotherapy (P = .003) and radiotherapy (P = .016) were independent prognostic factors of OS. Finally, the 7 variables were combined to construct a 3-year and 5-year OS nomogram. The concordance indexes (C-indexes) of OS were 0.756 (95% CI, 0.726–0.786) for the internal validation and 0.729 (95% CI, 0.678–0.780) for the external validation. Additionally, there was superior discrimination power of the nomogram over the SEER stage or the 8th edition AJCC TNM staging classification (P < .001). Calibration plots further showed good consistency between the nomogram prediction and actual observation. The area under the curve (AUC) of ROC curves for 3-year OS was 0.811 (95% CI: 0.769–0.853) in the training cohort and 0.748 (95% CI: 0.681–0.815) in the validation cohort. The AUC for 5-year OS was 0.770 (95% CI: 0.721–0.819) in the training cohort and 0.797 (95% CI: 0.731–0.863) in the validation cohort. Finally, Kaplan-Meier analysis further validates the predictive potential of the nomogram.
Marital status, age, T stage, M stage, surgery, chemotherapy and radiotherapy were significantly associated with OS of patients with rectal SCC. This predictive model has the potential to provide an individualized risk estimate of survival in patients with rectal SCC.
Keywords: nomogram, overall survival, prognosis, Rectal squamous cell carcinomas
1. Introduction
Colorectal cancer (CRC) ranks the third commonest of all malignancies in the United States (US), accounting for substantial morbidity and mortality rate. In terms of tumor location, rectum is considered as the second most common following the proximal colon[1]. The vast majority of rectal malignancies are adenocarcinomas (AC), while a minority of them (0.25–1.0%) is squamous cell carcinomas (SCC).[1,2] Due to the rare incidence of rectal SCC, the majority of data concerning rectal SCC are acquired from small, mono-centric, retrospective researches, from clinical experience or by extrapolation from randomized prospective studies of rectal AC.[3] In addition, Studies had shown that SCC of the rectum was different from AC, and its prognosis was better.[4,5] Therefore, it is essential to estimate the prognosis of the patient with rectal SCC, thus enabling individualization of patient therapy, according to the risk, and facilitating treatment optimization.
TNM staging classification is a common tool for predicting the outcomes of cancer patients by evaluating tumor size or location (T), regional lymph node involvement (N) as well as distant metastases (M).[6] However, TNM classification may be insufficient for outcome prediction of all rectal cancers, due to a lack of encompassed tumor biology, especially for rectal SCC. Furthermore, other clinical indicators, including age, tumor size, grade as well as treatments can also influence the prognosis of rectal SCC patients as well.[5,7] It is emergent to establish a novel stage classification by taking patient status and tumor characteristics in to consideration.
Nomogram, a simple statistical predictive tool, has been shown to compare favorably to the traditional TNM staging systems in multiple types of cancers.[8,9,10,11] Nevertheless, there has been no study using the nomogram to evaluate the prognosis of patients with rectal SCC. In this study, after extracting accessible data from the Surveillance, Epidemiology, and End Results (SEER) dataset, we established and further confirmed a novel prognostic model on the basis of personalized demographic, pathologic and therapeutic information.
2. Materials and methods
2.1. Ethics statement
The National Cancer Institute's SEER program uses population-based data to develop comprehensive sources, which was initiated from 1973 and annually updated,[12] covering about 30% of the US population throughout several states.[13] The SEER Research Data Agreement was signed for accessing SEER information by using the reference number 16462-Nov2016. Data were extracted following approved guidelines. The data analysis was considered by the Office for Human Research Protection to be non-human subjects who were researched by the US Department of Health and Human Services, and they were publicly accessible and de-identified. Therefore, it did not require approval from the institutional review board or consents from patients.
2.2. Study population
Data about the population consisted of all patients with a diagnosis of rectal SCC and were extracted from the SEER 18 registries (1975–2016 varying). The SEER∗State v8.3.5 tool, released March 6, 2018, was employed to select and identify eligible patients. The study duration ranged from January 1, 2004 to December 31, 2013. The inclusion criteria for data screening were as follows:
-
(1)
age at diagnosis >20 years;
-
(2)
patients with primary rectal SCC; and
-
(3)
The International Classification of Diseases for Oncology 3rd edition was used to identify rectal SCC using site codes (C20.9) and histology codes (8070–8077).
The exclusion criteria were as follows:
-
(1)
age at the diagnosis ≤20 years;
-
(2)
patients with more than one primary cancer;
-
(3)
patients with missing or incomplete survival data;
-
(4)
patients were only clinically diagnosed;
-
(5)
patients with inadequate clinicopathological information, including: American Joint Committee on Cancer (AJCC) tumor stage; SEER summary stage, specific surgery type.
The remained were considered as SEER primary cohort. In the SEER primary cohort, subjects from eight randomly selected registries (Louisiana, New Jersey, New Mexico, Rural Georgia, San Francisco-Oakland SMSA, San José Monterey, Seattle, UT) were defined as validation set, and the rest of population were considered as training set
2.3. Covariates and endpoint
The following demographic as well as clinical data were extracted from the SEER dataset: age at diagnosis, sex, race, marital status, grade, T, N, and M stages, tumor size, surgery, chemotherapy, radiotherapy, and follow-up information. The widowed or single (never married or having a domestic partner) or divorced or separated patients was classified into unmarried. 8th edition stage group was calculated for each patient according CS recorded, 6th and 7th edition T/N/M stages. Continuous variables, including age and tumor size, were further transformed into categorical variables based on the well-defined cut-off values.
The endpoint in this study was overall survival (OS), which defined as the duration from diagnosis to the most recent follow-up date, or date of death. There was a predetermined cut-off date based on the SEER 2016 submission database, containing death information until 2014. Therefore, the study used a cut-off date of December 31, 2014.
2.4. Statistical analysis
2.4.1. Nomogram establishment
Categorical variables were presented as frequencies and proportions, and chi-square test or Fisher exact test was used for comparison. Cox proportional hazard regression model was employed to determine the hazard ratio along with corresponding 95% confidence interval (CI) for all possible risk factors. We successfully identified all independent risk factors by using the backward stepwise in the Cox proportional hazards (PH) regression model. Nomogram model was constructed on the basis of training set. By referring to the outcomes of Cox PH regression, all independent prognostic indicators were combined to establish a nomogram model to predict the 3-year and 5-year OS, facilitated by the package of rms in R software version 3.51.
2.4.2. Nomogram validation
Nomograms were validated through the measurement of discrimination and calibration both internally (training cohort) and externally (validation cohort). Concordance index (C-index) determining the differences in predictive ability between observational and predicted outcome, was employed to assess the discrimination of the nomogram.[14] To be specific, a higher C-index suggested a superior capacity for patient separation with different survival outcomes. Rcorrp.cens package in Hmisc in R was utilized for compare between the nomogram and TNM staging or SEER summary stage, followed by assessment of C-index. The marginal estimate versus model was utilized to construct a calibration plot, which represented the calibration between nomogram-predicted and observational survival. A calibration plot along the 45-degree line implicated a perfect calibration model, with great consistency between the predicted and actual outcomes. Receiver operating characteristic (ROC) curves were also used to verify the nomogram score. The total score of nomogram of each patient was calculated according to the score of each variable in the contour diagram of the modeling group. The survminer and maxstat package of R software can provide the selection of the truncated value of the continuity of survival analysis. According to this value, we divided the patients into low-risk group and high-risk group. The Kaplan–Meier method was used to estimate, along with log-rank test in order to assess the differences of OS between the two groups. SPSS software (SPSS Inc., Chicago, USA, version 23) and R software version 3.51 (www.r-project.org) were used for statistical analysis. A P < .05 was considered as statistical significance.
3. Results
3.1. Patient screening process
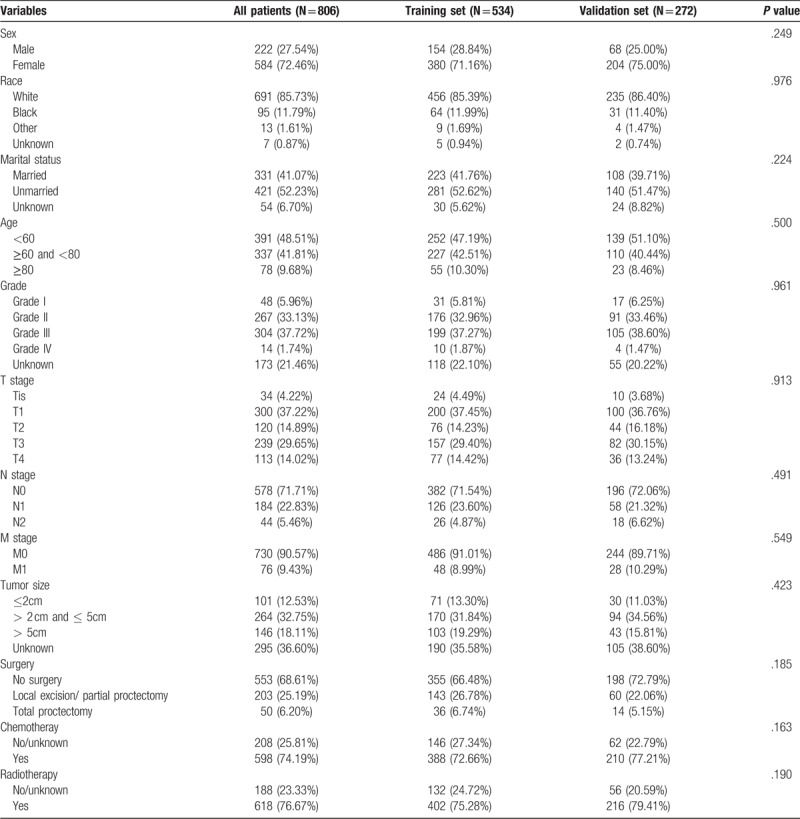
A total of 806 eligible patients with rectal SCC diagnosed through January 2004 to December 2013 were enrolled in the research. The specific screening process was shown in Figure 1, with a median follow-up of 35 months (range: 0–131 months). Of the 806 subjects, 534 were assigned to the training set, and the rest 272 to the validation set. Median age at diagnosis was 60 years old (20–99 years). The 12 variables were not significantly different between two groups. The demographic as well as clinicopathological characteristics were shown in Table 1.
Figure 1.
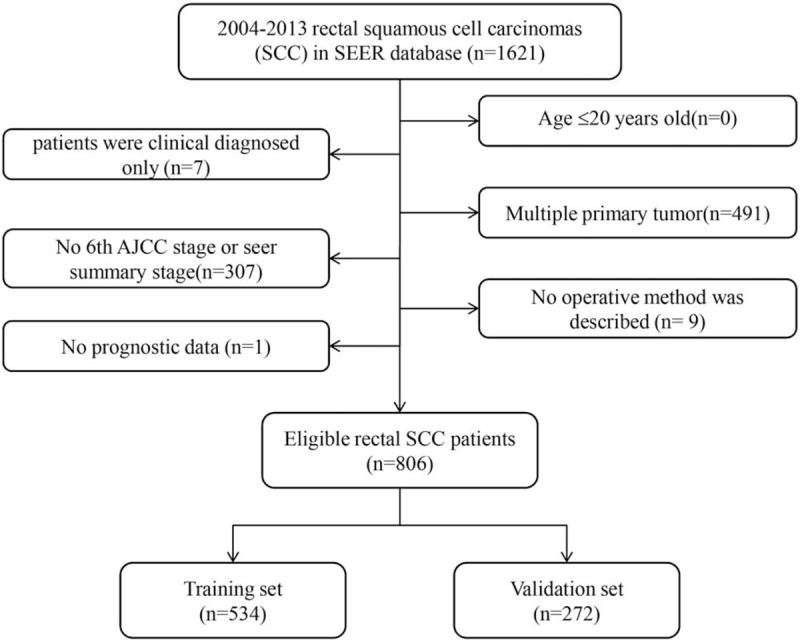
Flow chart for screening eligible patients.
Table 1.
The demographics and pathological characteristics of including patients.
3.2. Nomogram establishment
The factors that independently and significantly influenced OS in the multivariate analysis were shown in Table 2. After risk factors adjustment, the following 7 factors turned out to be independent predictive, including marital status (P < .001), age (P < .001), T stage (P = .008), M stage (P < .001), surgery (P = .004), chemotherapy (P = .003) and radiotherapy (P = .016). All independent factors in the training set were combined to establish a nomogram to predict the 3- and 5-year OS (Fig. 2). The score addition of every variable could facilitate in the easy calculation of the survival probability of each patient.
Table 2.
Univariate and multivariate analyses of overall survival in the training set.
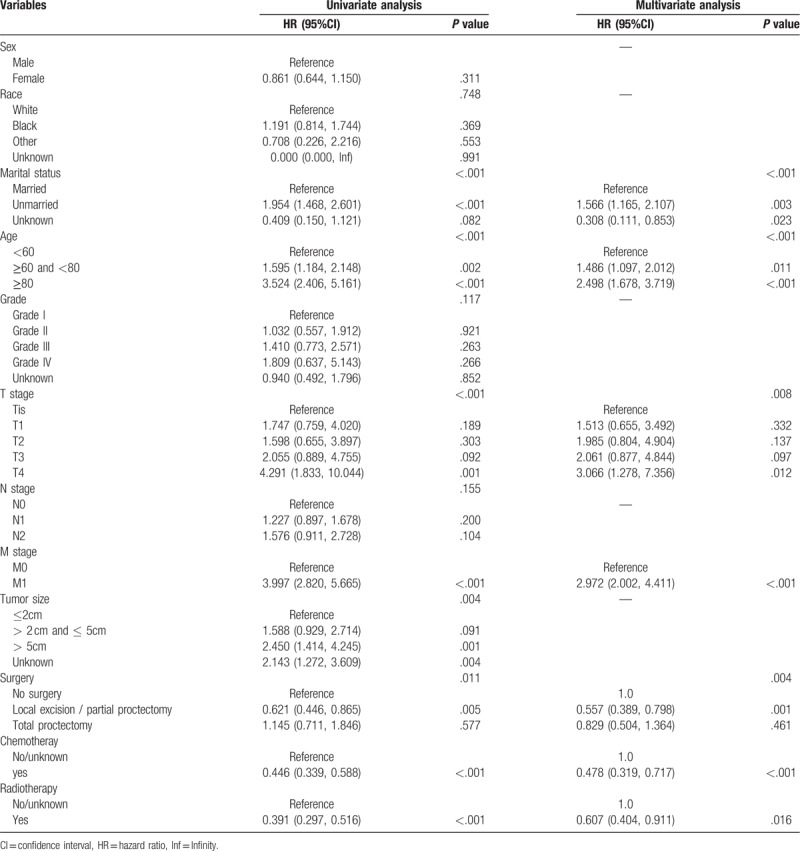
Figure 2.
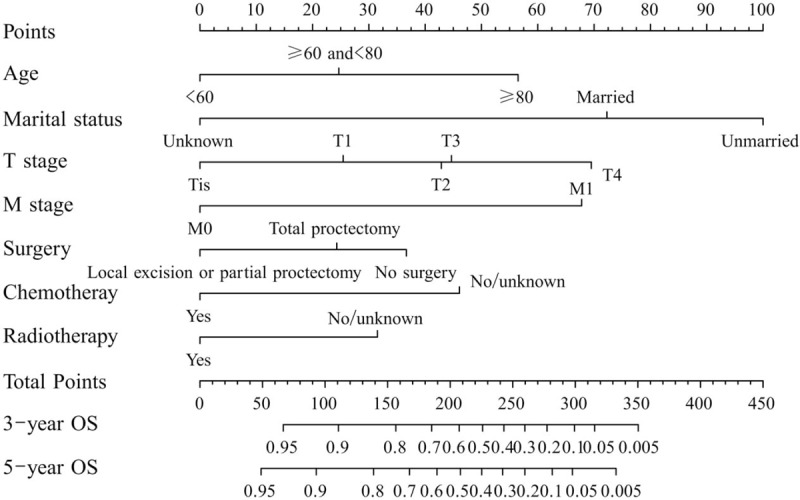
A nomogram for predicting 3- and 5-year overall survival (OS) of patients with rectal squamous cell carcinomas. The nomogram is used by summing the points identified on the top scale for each independent variable and drawing a vertical line from the total points scale to the 3- and 5-year OS to obtain the probability of survival. The total points projected to the bottom scale indicate the % probability of the 3- and 5-year survival.
3.3. Nomogram validation
Internal and external validations were conducted on the nomogram. Consequently, internal validation of the training set revealed that the C-index of the nomogram in OS prediction was 0.756 (95% CI, 0.726–0.786). External validation of the validation cohort showed that the C-index of the nomogram for OS prediction was 0.729 (95% CI, 0.678–0.780). Moreover, the discriminative capacity of the nomogram was compared to that of the SEER stage and 8th edition TNM staging classification, which showed a significant superiority of the nomogram discrimination over the SEER or 8th edition TNM staging classification in training and validation sets in OS prediction (P < .001) (Table 3). Additionally, the internal and external calibration plots of OS displayed good consistency between nomogram predictions and actual observation (Fig. 3). The associated ROC of the training and validation cohort was shown in Figure 4. The area under the curve (AUC) for 3-year OS was 0.811 (95% CI: 0.769–0.853) in the training cohort and 0.748 (95% CI: 0.681–0.815) in the validation cohort. The AUC for 5-year OS was 0.770 (95% CI: 0.721–0.819) in the training cohort and 0.797 (95% CI: 0.731–0.863) in the validation cohort. The cutoff value of ROC curve of 3-year in training group was 180.42, and in validation group was 193.84, while that of 5-year was 180.85 and 187.85, respectively.
Table 3.
C-indexes for the nomograms and other stage systems in patients with rectal squamous cell carcinomas.

Figure 3.
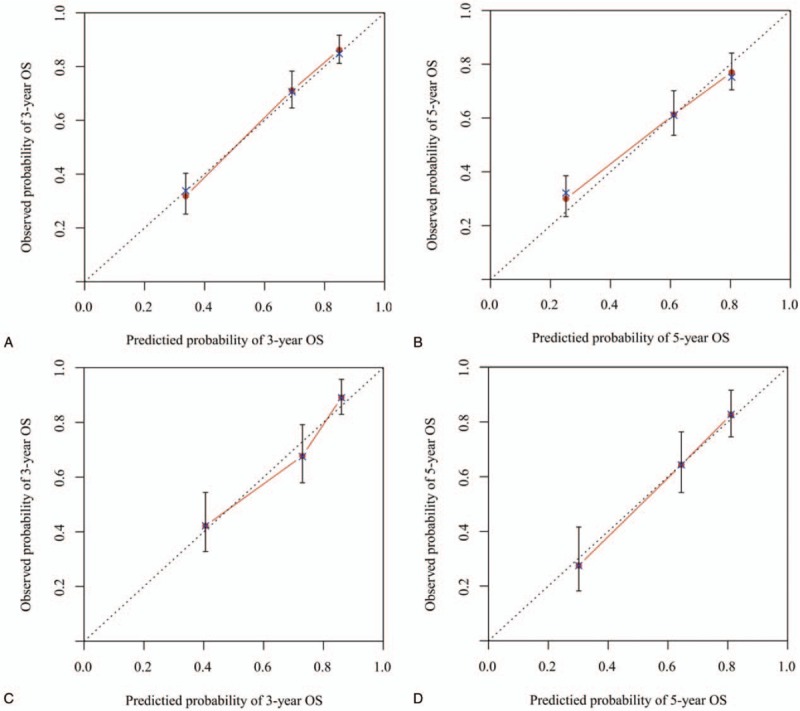
Calibration plots of the nomogram for 3-and 5-year overall survival (OS) (A, B) prediction in the training set, and 3-and 5-year OS (C, D) prediction in the validation set. The X-axis represents the nomogram-predicted probability of survival; the Y-axis represents the actual OS probability. Plots along the 45-degree line indicate a perfect calibration model in which the predicted probabilities are identical to the actual outcomes. Vertical bars indicate 95% confidence intervals.
Figure 4.
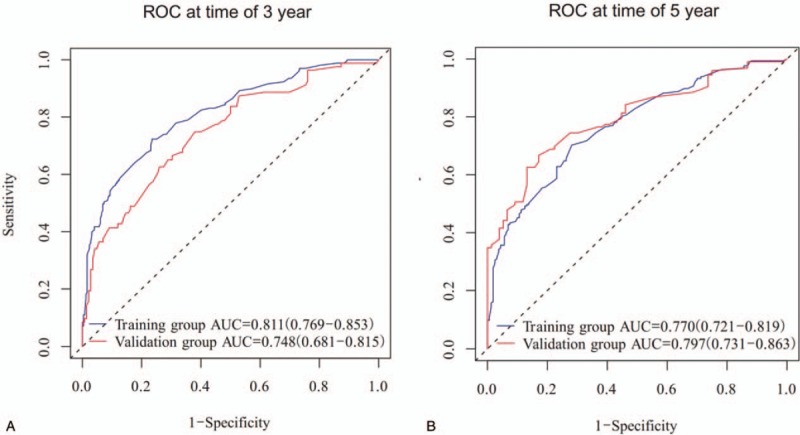
Discriminatory accuracy for predicting OS assessed by receiver operator characteristics (ROC) analysis calculating area under the curve (AUC). 3-year OS in the training and validation cohort (A). 5-year OS in the training and validation cohort (B).
The results showed that the best cutoff value of the nomogram was 247 points. Based on this, we divided the data of the training group and the validation group into low-risk group (≤247) and high-risk group (>247). It can be seen that there is a significant difference in survival between the 2 groups (Fig. 5, both P < .0001), and it also confirms that the nomogram has a good ability to distinguish the prognosis of patients.
Figure 5.
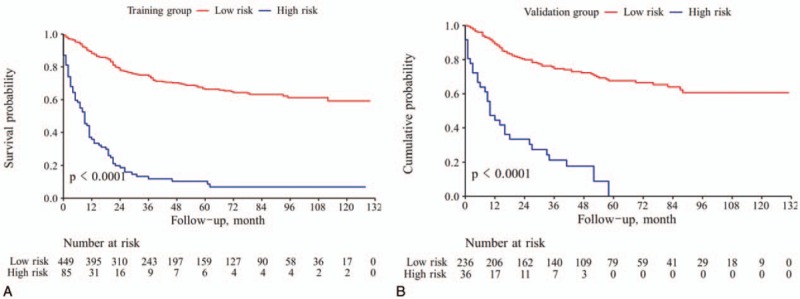
Kaplan-Meier survival curves of patients with different risk group in training set (A) and validation cohort (B).
4. Discussion
In the present research, clinicopathological prognostic indicators were incorporated to establish a novel nomogram for better OS prediction in rectal SCC patients. A Nomogram was successfully established for 3- and 5-year OS prediction in rectal SCC, with favorable discrimination and calibration as demonstrated by internal and external validation. Moreover, a more powerful predictive capacity was shown in the nomogram, compared to that of the SEER stage and 8th edition TNM staging classification.
Raiford first reported the case of rectal SCC in 1933, with limited number of reports ever since then.[15] Rectal SCC has been revealed as an etiologically distinct entity from AC, with different prognostic factors and therapeutic approaches.[16] At present, it remains unclear whether SCC of the rectum should be treated like rectal AC or rather like SCC of the anal canal.[17] There is also an absence of distinct recommendations of rectal SCC in clinical guidelines.[18] Surgical resection or multimodal therapy based surgery is generally the first consideration.[7,17] However, accumulating studies have been showing the therapeutic advantage of definitive concurrent chemoradiotherapy using the anal SCC paradigm.[17,19,20] Chiu even found that surgery failed to bring any survival benefits to rectal SCC patients.[5] In this study, we found that patients undergoing total proctectomy did not harbor a higher survival time, while patients with local excision or partial proctectomy did, indicating that surgery is beneficial to patients to some extent, but a wider range of surgery is not necessary. Meanwhile, patients also benefit significantly from chemotherapy and radiotherapy, confirming the effectiveness of concurrent chemoradiotherapy for rectal SCC to some extent.
The effect of marriage on the prognosis of rectal cancer patients has been reported in some studies. Most studies have concluded that married patients have better prognosis, which is consistent with our study. Wang et al analyzed 27,498 patients from SEER database and found that marriage was an independent prognostic factor of rectal cancer patients at each TNM stage. Moreover, widowed patients had worse 5-year cause-specific survival compared to married, never married, and divorced/separated.[21] Li et al found that married aged patients experienced a significant benefit of OS than the unmarried.[22]
Nomogram plays an important role in modern medical decision-making,[23] which is a graphical presentation of statistical prediction models.[24,25] Therefore, only easily accessible and measurable factors could be considered. Evidence has demonstrated that nomogram harbors more powerful predictive capacity compared to the conventional TNM staging classification in several types of cancer. Thus, the application of nomogram might be an alternative or even a novel standard.[8,9]
The followings were the advantages of this study. The detailed clinicopathological data of rectal SCC patients extracted from the SEER dataset ensured the accuracy of the prognostic nomogram. Moreover, more potent discriminative capacity was shown in the nomogram compared to the SEER and 8th edition TNM staging classification in terms of OS prediction. Calibration was further utilized to validate the presentation and validity of the nomogram. Widely and easily-accessible, clinical factors were utilized for the convenient application of the nomogram.
There were also some limitations in our study. To begin with, the nomogram establishment was based on retrospective information from the SEER dataset, which might cause possible selection bias. Secondly, certain critical clinicopathological indicators related to prognosis, such as molecular information, vascular invasion and surgical margin status were unavailable in the SEER dataset. Thirdly, our study only included data available online and more external validation is still required. Finally, as a user-friendly method in decision-making, not all prognostic indicators were enrolled in the nomogram, which, thus, could not always supply accurate prognostic prediction in clinical practice.
5. Conclusion
In conclusion, our study is the first one to construct a prognosis nomogram for rectal SCC. The proposed nomogram was easily used clinical tools that facilitate the popularization of patient counseling and personalized treatment. However, it is necessary to further mine the unknown prognostic factors to optimize the nomogram, and more external validation is still required.
Acknowledgments
We thank the staff members of the National Cancer Institute and their colleagues across the United States and at Information Management Services, Inc., who have been involved with the Surveillance, Epidemiology, and End Results (SEER) Program.
Author contributions
Conceptualization: Hong-Xia Cui, Ming-Wei Bu, Yong-Jing Yang.
Data curation: Ming-Wei Bu, Dan Yue.
Formal analysis: Jian Dong Diao, Dan Yue.
Investigation: Hong-Xia Cui.
Software: Chun-Jiao Wu, Xue Wang.
Supervision: Xue Wang.
Writing – original draft: Jian Dong Diao, Yong-Jing Yang.
Writing – review & editing: Yan-Ling Liu, Yong-Jing Yang.
Footnotes
Abbreviations: AC = adenocarcinomas, CI = confidence interval, C-index = Concordance index, CRC = Colorectal cancer, OS = overall survival, PH =proportional hazards, ROC = receiver operating characteristic, SCC = squamous cell carcinomas, SEER = surveillance, epidemiology, and end results.
How to cite this article: Diao Jd, Wu Cj, Cui Hx, Bu Mw, Yue D, Wang X, Liu YL, Yang YJ. Nomogram predicting overall survival of rectal squamous cell carcinomas patients based on the SEER database. Medicine. 2019;98:46(e17916).
YLL and YJY contributed equally to this study.
As this study is based on a publicly available database without identifying patient information, informed consent was not needed.
The authors have no funding and conflicts of interest to disclose.
References
- [1].Siegel R, Desantis C, Jemal A. Colorectal cancer statistics, 2014. CA Cancer J Clin 2014;64:104–17. [DOI] [PubMed] [Google Scholar]
- [2].Kang H, O’Connell JB, Leonardi MJ, et al. Rare tumors of the colon and rectum: a national review. Int J Colorectal Dis 2007;22:183–9. [DOI] [PubMed] [Google Scholar]
- [3].Franklin RA, Giri S, Valasareddy P, et al. Comparative survival of patients with anal adenocarcinoma, squamous cell carcinoma of the anus, and rectal adenocarcinoma. Clin Colorectal Cancer 2016;15:47–53. [DOI] [PubMed] [Google Scholar]
- [4].Nahas CS, Shia J, Joseph R, et al. Squamous-cell carcinoma of the rectum: a rare but curable tumor. Dis Colon Rectum 2007;50:1393–400. [DOI] [PubMed] [Google Scholar]
- [5].Chiu MS, Verma V, Bennion NR, et al. Comparison of outcomes between rectal squamous cell carcinoma and adenocarcinoma. Cancer Med 2016;5:3394–402. [DOI] [PMC free article] [PubMed] [Google Scholar]
- [6].Burke HB. Outcome prediction and the future of the TNM staging system. J Natl Cancer Instit 2004;96:1408–9. [DOI] [PubMed] [Google Scholar]
- [7].Steinemann DC, Muller PC, Billeter AT, et al. Surgery is essential in squamous cell cancer of the rectum. Langenbeck's Arch Surg 2017;402:1055–62. [DOI] [PubMed] [Google Scholar]
- [8].Roberto M, Botticelli A, Strigari L, et al. Prognosis of elderly gastric cancer patients after surgery: a nomogram to predict survival. Med Oncol (Northwood, London, England) 2018;35:111. [DOI] [PubMed] [Google Scholar]
- [9].Wang C, Yang C, Wang W, et al. A prognostic nomogram for cervical cancer after surgery from SEER database. J Cancer 2018;9:3923–8. [DOI] [PMC free article] [PubMed] [Google Scholar]
- [10].Jiang S, Zhao R, Li Y, et al. Prognosis and nomogram for predicting postoperative survival of duodenal adenocarcinoma: a retrospective study in China and the SEER database. Sci Rep 2018;8:7940. [DOI] [PMC free article] [PubMed] [Google Scholar]
- [11].Huang ZN, Chen QY, Zheng CH, et al. Are the indications for postoperative radiotherapy in the NCCN guidelines for patients with gastric adenocarcinoma too broad? A study based on the SEER database. BMC Cancer 2018;18:1064. [DOI] [PMC free article] [PubMed] [Google Scholar]
- [12].Duggan MA, Anderson WF, Altekruse S, et al. The Surveillance, Epidemiology, and End Results (SEER) Program and Pathology: Toward Strengthening the Critical Relationship. Am J Surg Pathol 2016;40:e94–102. [DOI] [PMC free article] [PubMed] [Google Scholar]
- [13].Cronin KA, Ries LA, Edwards BK. The Surveillance, Epidemiology, and End Results (SEER) Program of the National Cancer Institute. Cancer 2014;120Suppl 23:3755–7. [DOI] [PubMed] [Google Scholar]
- [14].Wolbers M, Koller MT, Witteman JC, et al. Prognostic models with competing risks: methods and application to coronary risk prediction. Epidemiology (Cambridge, Mass) 2009;20:555–61. [DOI] [PubMed] [Google Scholar]
- [15].Lafreniere R, Ketcham AS. Primary squamous carcinoma of the rectum. Report of a case and review of the literature. Dis Colon Rectum 1985;28:967–72. [DOI] [PubMed] [Google Scholar]
- [16].Dyson T, Draganov PV. Squamous cell cancer of the rectum. World J Gastroenterol 2009;15:4380–6. [DOI] [PMC free article] [PubMed] [Google Scholar]
- [17].Musio D, De Felice F, Manfrida S, et al. Squamous cell carcinoma of the rectum: The treatment paradigm. Eur J Surg Oncol 2015;41:1054–8. [DOI] [PubMed] [Google Scholar]
- [18].Pox C, Aretz S, Bischoff SC, et al. S3-guideline colorectal cancer version 1.0. Z Gastroenterol 2013;51:753–854. [DOI] [PubMed] [Google Scholar]
- [19].Rasheed S, Yap T, Zia A, et al. Chemo-radiotherapy: an alternative to surgery for squamous cell carcinoma of the rectum–report of six patients and literature review. Colorectal Dis 2009;11:191–7. [DOI] [PubMed] [Google Scholar]
- [20].Tronconi MC, Carnaghi C, Bignardi M, et al. Rectal squamous cell carcinoma treated with chemoradiotherapy: report of six cases. Int J Colorectal Dis 2010;25:1435–9. [DOI] [PubMed] [Google Scholar]
- [21].Wang X, Cao W, Zheng C, et al. Marital status and survival in patients with rectal cancer: An analysis of the Surveillance, Epidemiology and End Results (SEER) database. Cancer Epidemiol 2018;54:119–24. [DOI] [PubMed] [Google Scholar]
- [22].Li Z, Wang K, Zhang X, et al. Marital status and survival in patients with rectal cancer: a population-based STROBE cohort study. Medicine 2018;97:e0637. [DOI] [PMC free article] [PubMed] [Google Scholar]
- [23].Balachandran VP, Gonen M, Smith JJ, et al. Nomograms in oncology: more than meets the eye. Lancet Oncol 2015;16:e173–180. [DOI] [PMC free article] [PubMed] [Google Scholar]
- [24].Kattan MW, Leung DH, Brennan MF. Postoperative nomogram for 12-year sarcoma-specific death. J Clin Oncol 2002;20:791–6. [DOI] [PubMed] [Google Scholar]
- [25].Bochner BH, Kattan MW, Vora KC. Postoperative nomogram predicting risk of recurrence after radical cystectomy for bladder cancer. J Clin Oncol 2006;24:3967–72. [DOI] [PubMed] [Google Scholar]


