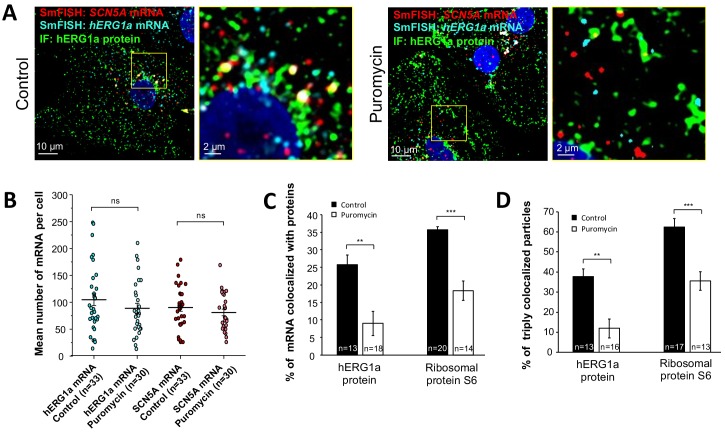
Figure 6. Distribution and association of hERG1a and SCN5A transcripts under puromycin treatment in iPSC-CMs.
(A) Representative confocal images and enlargement (outlined in yellow) of iPSC-CMs subjected to immunofluorescence combined with smFISH for control cells (left panel) or cells treated with 100 µM puromycin for 15 min (right panel). (B) The number of mRNAs detected per cell was plotted for SCN5A and hERG1a in the presence of puromycin and compared to control cells (lines represent mean ±SE). (C) Histogram showing the reduction of association between hERG1a mRNA and hERG1a protein after puromycin treatment compared to non-treated cells (mean ±SE). (D) Histogram showing that the % of triply colocalized particles (hERG1a protein or the ribosomal subunit S6 associated with both hERG1a and SCN5A mRNAs) is decreased upon puromycin treatment (mean ±SE).

