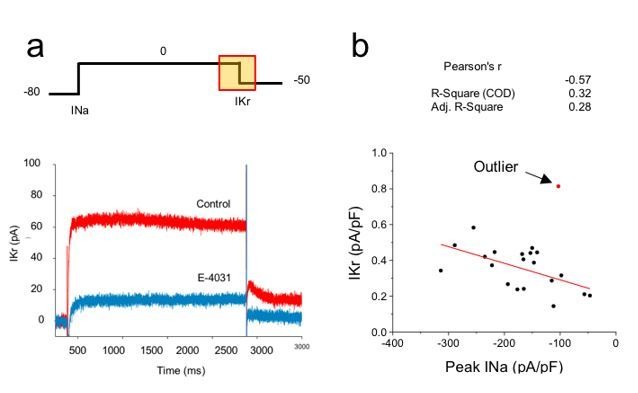
Author response image 1. Correlation analysis of hERG and sodium currents.

(A) Voltage step protocol used to measure both sodium (INa) and hERG (IKr) currents in the same cell, using cesium as the charge carrier for hERG channels. The region from where IKr was measured is highlighted in the protocol (yellow square). Representative traces before (Control) and after perfusing E-4031 (10 µM) to block hERG channels, validating that the recorded current is IKr. (B) Current density of hERG channels were plotted in function of Nav1.5 current density and correlation coefficients are shown on top of the graph. One cell (red dot) was excluded from the correlation analysis as it meets the outlier criteria. n = 20 cells of 2 independent experiments (N = 2).
