Figure 14.
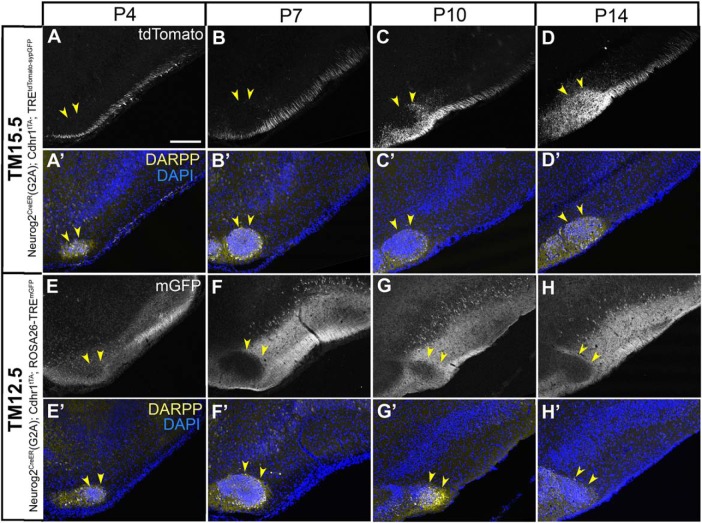
Development of axon projections to the aiCAP. A-D, Coronal sections prepared from P4 (A), P7 (B), P10 (C), and P14 (D) Neurog2CreER(G2A); Cdhr1tTA; TREtdTomato-sypGFP mice that were given TM15.5. E-H, Coronal sections prepared from P4 (E), P7 (F), P10 (G), and P14 (H) Neurog2CreER(G2A); Cdhr1tTA; ROSA26-TREmGFP mice that were given TM12.5. Medial is to the left and dorsal is to the top in all panels. Images for tdTomato (A–D) and mGFP (E–H) reporters. Lower panels (A’–H’) show counterstaining images for DAPI and DARPP, which marks the aiCAP (yellow arrowheads) by P4. Scale bar = 200 μm.

