Abstract
Background
Long noncoding RNAs (lncRNAs) participate in the carcinogenesis of many different cancers. This study aimed to detect expression of lncRNA CTA‐941F9.9 in colorectal cancer tissues compared with matched nontumorous adjacent tissues (NATs). Moreover, we investigated whether this molecule is able to influence carcinogenesis in colorectal cancer (CRC).
Methods
Colorectal cancer tissues and NATs from two cohorts of patients were examined. Quantitative PCR was performed to quantify levels of CTA‐941F9.9 expression in these samples. The association between CTA‐941F9.9 expression and clinicopathological features, including receiver operating characteristic (ROC) curves, was also analyzed to evaluate the diagnostic value of CTA‐941F9.9 in CRC. Potential effects of lncRNA CTA‐941F9.9 on CRC cells were assessed via autophagy, transwell assay, CCK8 assays, and flow cytometry.
Results
Our experimental results showed lncRNA CTA‐941F9.9 to be significantly downregulated in CRC tissues in both cohorts, with areas under the ROC curve (AUC) of 0.802 and 0.876. However, no significant correlations between CTA‐941F9.9 expression levels and clinicopathological characteristics or patient outcomes were observed. We also found that CTA‐941F9.9 promotes autophagy in CRC cell lines but no significant function of CTA‐941F9.9 in regulating cancer cell proliferation or migration.
Conclusions
LncRNA CTA‐941F9.9 is frequently downregulated in CRC compared with NATs and might play an important role in CRC carcinogenesis.
Keywords: biomarker, carcinogenesis, colorectal cancer, CTA‐941F9.9, long noncoding RNAs
1. INTRODUCTION
In 2018, almost 1.8 million cases and 881 000 deaths globally were recorded for colorectal cancer (CRC), the third most prevalently diagnosed cancer and second in terms of mortality, accounting for 10% of all cancer deaths.1 In China, CRC ranks among the top five most diagnosed cancers and types associated with mortality.2 Although medical technology and treatment strategies have strongly progressed, 60% of CRC patients are still diagnosed at advanced stages, and only 5% of patients with distant metastasis survive for more than 5 years.3 Therefore, it is critical to identify novel diagnostic biomarkers that can contribute to the diagnosis of CRC.
Long noncoding RNAs (lncRNAs) consist of more than 200 nucleotides but have no capacity to encode proteins.4, 5 Over the past few years, growing evidence has suggested that lncRNAs may be associated with the progression of numerous diseases.6 For example, lncRNA‐KRTAP5‐AS1 and lncRNA‐TUBB2A can promote cell proliferation, invasion, and EMT in gastric cancer cell lines; lnc‐XLEC1 is downregulated in endometrial carcinoma and associated with its incidence and prognosis.7 High expression of lnc‐SNHG15 in CRC patients correlates with lymph node and liver metastases, and patients with high lncRNA‐SNHG15 expression have a shorter median overall survival.8 Moreover, downregulation of lncRNA MEG3 indicates poor prognosis in CRC, and by regulating cell proliferation, MEG3 has been demonstrated to participate in the onset and progression of CRC.9 Qi et al10 also indicated that lncRNA might be used as a biomarker for the early detection of metastasis in CRC. As lncRNA dysregulation plays a crucial role in CRC development, lncRNAs are regarded as novel biomarkers and therapeutic targets for CRC patients.
LncRNA CTA‐941F9.9 (ENSG00000238120) is a novel lncRNA of 548 nucleotides expressed from chromosome 22. However, the level of CTA‐941F9.9 expression between CRC tissues and matched NATs has not been reported. Therefore, this study aimed to quantify CTA‐941F9.9 expression in CRC tissues and NATs and to evaluate the biological function of CTA‐941F9.9 in carcinogenesis processes in CRC.
2. MATERIAL AND METHODS
2.1. Ethical approval of the study protocol
This study was conducted according to the principles established in the Declaration of Helsinki. Informed consent forms were signed by all participants before experimental samples were extracted. The informed consent of the participants and the institutional ethical principles were reviewed and authorized by the Research Ethics Committee of China Medical University.
2.2. Tissue samples
All tissue samples were obtained from First Hospital of China Medical University. One cohort consisted of 74 patients who received radical resection surgery for CRC in 2010; the second comprised 59 patients who underwent surgery from December 2015 to March 2016. CRC was histopathologically confirmed in all patients. Pair‐matched tissues were obtained from an area more than 5 cm away from the lesions. All tissue samples were snap‐frozen in liquid nitrogen and stored at −80°C before use. No patient received preoperative chemotherapy or radiotherapy prior to resection. Tumor histological grades were assessed using World Health Organization guidelines as the standard criterion. The eighth edition of the International Union Against Cancer tumor‐node‐metastasis (TNM) staging system was applied for classifying pT (depth of invasion) and pN (primary node). Follow‐up investigations were performed every 3‐6 months after surgery. The overall survival (OS) time was considered as the interval between surgery and the last follow‐up investigation or death.
2.3. RNA isolation and reverse transcription
Total RNA was extracted from CRC tissues and NATs using TRIzol (Invitrogen) according to the manufacturer's instructions. Total RNA was solubilized in RNase‐free dH2O, and RNA concentration and purity were measured using a nanophotometer UV/Vis spectrophotometer (A260/A280 between 1.8 and 2.0) (Implen, GmbH). Reverse transcription was performed using PrimeScript™ RT Reagent Kit with gDNA Eraser according to the manufacturer's instructions (TaKaRa). In brief, a 10 μL reaction mixture containing 1 μL of gDNA Eraser, 2 μL of 5× gDNA Eraser Buffer, and 1 μg of total RNA (diluted to 7 μL using RNase‐free dH2O) was incubated at 42°C for 2 minutes in a GeneAmp PCR 9700 Thermocycler (Applied Biosystems Life Technologies). A 10 μL reaction mixture containing 1 μL of PrimeScript RT Enzyme Mix1, 4 μL of 5× PrimeScript Buffer 2 (for real‐time PCR), 1 μL of RT Primer Mix, and 4 μL of RNase‐free water was added, and the samples were then incubated in a PCR thermocycler for 15 minutes at 37°C and 5 seconds at 85°C.
2.4. Real‐time PCR
SYBR® Premix Ex Taq II (Takara) was used for quantitative real‐time PCR with a Light Cycler 480 II Real‐Time PCR system (Roche Diagnostics). Each 25 μL reaction mixture for amplifying CTA‐941F9.9 contained 12.5 μL of SYBR, 0.5 μL of forward primer, 0.5 μL of reverse primer, 9.5 μL of RNase‐free water, and 2 μL of cDNA, which was synthesized by reverse transcription. The reaction was performed in a LightCycler®480 Multiwell Plates 96 (Roche Diagnostics) using 1 cycle at 95°C for 30 seconds, followed by 45 cycles at 95°C for 5 seconds, and 60°C for 30 seconds. The primers used for quantitative real‐time PCR were as follows: CTA‐941F9.9 primer F, 5′–CTACGGTGGCTCCGTTTCTT–3′, and R, 5′–ACGTTTCCCCACATCGTTCA–3′; GAPDH primer F, 5′–CGGATTTGGTCGTATTGGG–3′, and R, 5′–CTGGAAGATGGTGATGGGATT–3′ (Sangon Biotech). All real‐time PCRs were performed in triplicate.
2.5. Cell culture, plasmid construction, and cell transfection
Five CRC cell lines and one normal colonic epithelial cell line were purchased from American Type Culture Collection. Three lines (HCT116, HT29, and RKO) were cultured in an environment containing 5% CO2 at 37°C with RPMI 1640 medium supplemented with 10% fetal bovine serum. SW620 and SW480 cell lines were cultured under the same conditions without CO2. FHC cells were grown in DMEM:F12 medium instead of RPMI 1640. Full‐length CTA‐941F9.9 was cloned into the pcDNA3.1 expression vector (GenePharma) for overexpression in the cell lines. Three different siRNAs (Ribobio) were designed for CTA‐941F9.9 knockdown. All transfection procedures followed protocols provided by the manufacturer.
2.6. Western blotting analysis
All transfected colorectal cancer cells were collected and lysed using Total Protein Extraction Kit (KeyGen Biotech). Total proteins (30 μg/lane) were separated by 12% SDS‐polyacrylamide gel (SDS‐PAGE) and then transferred onto PVDF membranes (Millipore). The membranes were incubated overnight at 4°C with primary antibodies, including anti‐LC3B (Abcam, ab51520) and anti‐beta actin (Abcam, ab6276). After immunoblotting with peroxidase‐conjugated Affinipure goat anti‐mouse IgG or peroxidase‐conjugated Affinipure goat anti‐rabbit IgG, proteins were detected by GelCapture version software (DNR Bio‐Imaging Systems).
2.7. Cell proliferation assay
Cell Counting Kit‐8 (CCK‐8, Dojindo) was used to measure cell proliferation potential. HCT116 cells (3 × 10³) or RKO cells were seeded in 96‐well plates and cultured with medium containing serum. At 24, 48, 72, and 96 hours, 10 μL reagent was added and incubated for 1 hour at 37°C, and absorbance at 450 nm was measured using a microplate reader (Spectra Max plus384; Molecular Devices).
2.8. Transwell assay
To verify the migration capacity of CRC cells, a sample of 1.0 × 10⁵ CRC cells was seeded into the upper chamber of transwell devices with 200 μL RPMI‐1640 medium. A total of 700 μL of RPMI‐1640 medium including 10% FBS was added to the lower chamber. After incubating at 37°C for 48 hours, the cells in the upper chamber were gently removed. After fixing with pure methanol for 1 minute, the insert was stained with hematoxylin for 3 minutes and then eosin for 30 seconds. The average number of migratory cells was counted in ten randomly chosen visual fields under an inverted microscope (Leica DMI300B).
2.9. Flow cytometry
Single‐cell suspensions were generated following trypsinization and resuspension. Before cell cycle experiments, CRC cells were fixed in 70% ice‐cold ethanol for at least 2 hours and then stained with propidium iodide according to the manufacturer's protocol. For apoptosis analysis, cells were stained with Annexin V‐APC and propidium iodide using Annexin V‐APC Apoptosis Detection Kit (KeyGEN). All samples and statistics were analyzed using a FACS caliber flow cytometer (BD Biosciences), BD Cell Quest software, and LSRFortessa (BD Biosciences).
2.10. Statistical analysis
All statistical analyses were performed using SPSS software version 21.0 (IBM) and GraphPad Prism 5 (GraphPad Software). We used the 2−ΔΔ C t method to calculate expression of lncRNA in cancer tissues compared with NATs (ΔΔCt = ΔCttumor CTA‐941F9.9 − ΔCtNAT CTA‐941F9.9). ΔCt indicates the difference of the C t value between the target and endogenous reference (GAPDH; ΔC t = C tCTA‐941F9.9 − C tGAPDH).11 Statistical differences in expression of lncRNA CTA‐941F9.9 in CRC tissues compared with NAT controls were measured by Student's t test. The Mann‐Whitney U test (for two groups) and Kruskal‐Wallis test (for at least three groups) were used to detect associations between CTA‐941F9.9 expression levels and clinicopathological features. The Spearman correlation coefficient was employed to evaluate the association between CTA‐941F9.9 expression levels and clinicopathological characteristics (age and tumor size). The Kaplan‐Meier method was utilized to evaluate survival curves and the log‐rank test to determine statistical discrepancy between survival times. Two ROC curves were generated to measure the diagnostic value of lncRNA levels. Differences with a two‐tailed P‐value <.05 were considered statistically significant.
3. RESULTS
3.1. CTA‐941F9.9 is downregulated in CRC tissues
The expression levels of CTA‐941F9.9 were measured by real‐time PCR between CRC tissue samples and NATs, and the results showed that CTA‐941F9.9 was downregulated in 89.2% (66/74) of CRC tissues compared to their NATs (P < .001) (Figure 1A and B). To confirm the expression trend of CTA‐941F9.9, another cohort of 59 CRC tissue samples and paired NATs from patients who underwent surgery in the past 3 years were measured. This cohort also revealed CTA‐941F9.9 downregulation in 93.2% (55/59) of CRC tissues compared with NATs (Figure 1C and D). CTA‐941F9.9 expression levels were similar in both cohorts; thus, CTA‐941F9.9 expression was markedly decreased in CRC tissues compared with NATs. We also tested correlations between CTA‐941F9.9 expression and clinicopathological characteristics and found no significant correlation between CTA‐941F9.9 expression levels and age, sex, tumor location, tumor size, histological grade, pT stage, pN stage, or TNM stage for the first (Table 1) or second (Table 2) cohort.
Figure 1.
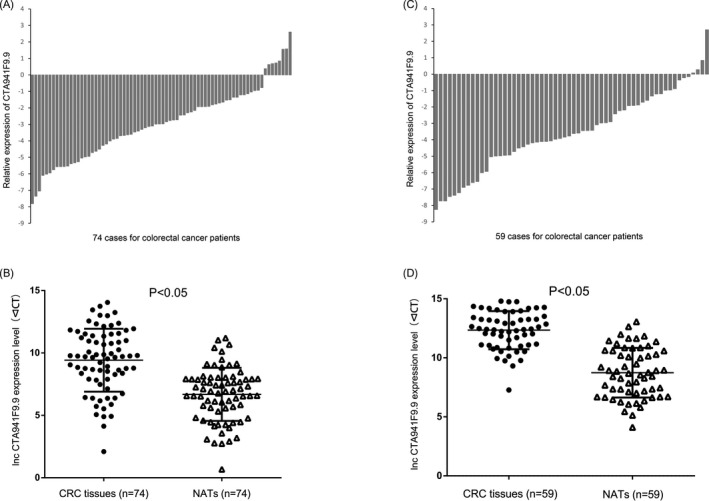
The expression levels of lncRNA CTA‐941F9.9 in colorectal cancer (CRC) A and B. Relative expression of long noncoding RNA (lncRNA) CTA‐941F9.9 in 74 human CRC tumorous tissues and their paired nontumorous adjacent tissues. C and D, Relative expression of lncRNA CTA‐941F9.9 in 59 human CRC tumorous tissues and their paired nontumorous adjacent tissues
Table 1.
Relationship of clinicopathological features with CTA‐941F9.9 expression in cohort 1 tissue samples of colorectal cancer
| Characteristics | Number of patients (%) | CTA‐941F9.9 expression levela | P‐Value |
|---|---|---|---|
| Age | |||
| Maximum‐Minimum (28‐83) | 74 (100.0) | 0.127 (0.040‐0.347) | .158 |
| Gender | |||
| Male | 33 (44.6) | 0.127 (0.066‐0.315) | .476 |
| Female | 41 (55.4) | 0.128 (0.031‐0.371) | |
| Tumor location | |||
| Colon | 26 (35.1) | 0.167 (0.037‐0.512) | .483 |
| Rectum | 48 (64.9) | 0.156 (0.043‐0.304) | |
| Tumor size | |||
| Maximum‐Minimum (2.3‐13.0 cm) | 74 (100.0) | 0.127 (0.040‐0.347) | .285 |
| Histological grade | |||
| Well | 11 (14.9) | 0.127 (0.090‐0.345) | .933 |
| Moderately | 59 (79.7) | 0.128 (0.038‐0.391) | |
| Poorly | 4 (5.4) | 0.092 (0.027‐0.478) | |
| pT stage | |||
| T2 | 10 (13.5) | 0.156 (0.065‐0.347) | .799 |
| T3 | 10 (13.5) | 0.079 (0.043‐0.194) | |
| T4 | 54 (73) | 0.149 (0.032‐0.401) | |
| pN stage | |||
| 0 | 44 (59.5) | 0.151 (0.031‐0.391) | .868 |
| 1 | 24 (32.4) | 0.101 (0.052‐0.304) | |
| 2 | 6 (8.1) | 0.159 (0.065‐0.554) | |
| pTNM stage | |||
| 1 | 7 (9.5) | 0.184 (0.025‐0.345) | .870 |
| 2 | 37 (50.0) | 0.150 (0.031‐0.422) | |
| 3 | 30 (40.5) | 0.111 (0.054‐0.297) | |
Median relative expression (25th‐75th percentile).
Table 2.
Relationship of clinicopathological features with CTA‐941F9.9 expression in cohort 2 tissue samples of colorectal cancer
| Characteristics | Number of patients (%) | CTA‐941F9.9 expression levela | P‐Value |
|---|---|---|---|
| Age | |||
| Maximum‐Minimum (29‐86) | 59 (100.0) | 0.073 (0.032‐0.279) | .704 |
| Gender | |||
| Male | 31 (52.5) | 0.056 (0.031‐0.279) | .242 |
| Female | 28 (47.5) | 0.092 (0.039‐0.394) | |
| Tumor location | |||
| Colon | 26 (44.1) | 0.083 (0.031‐0.280) | 1.000 |
| Rectum | 33 (55.9) | 0.066 (0.031‐0.304) | |
| Tumor size | |||
| Maximum‐Minimum (2.3‐12.0 cm) | 59 (100.0) | 0.073 (0.032‐0.279) | .443 |
| Histological grade | |||
| Well | 11 (18.6) | 0.081 (0.017‐0.178) | .149 |
| Moderately | 42 (71.2) | 0.065 (0.031‐0.280) | |
| Poorly | 6 (10.2) | 0.384 (0.063‐1.097) | |
| pT stage | |||
| T2 | 5 (8.5) | 0.017 (0.011‐0.330) | .351 |
| T3 | 19 (33.2) | 0.187 (0.032‐0.330) | |
| T4 | 35 (59.3) | 0.060 (0.033‐0.264) | |
| pN stage | |||
| 0 | 32 (54.2) | 0.068 (0.020‐0.253) | .420 |
| 1 | 17 (28.8) | 0.134 (0.057‐0.435) | |
| 2 | 10 (16.9) | 0.055 (0.025‐0.643) | |
| pTNM stage | |||
| 1 | 5 (8.4) | 0.017 (0.011‐0.330) | .581 |
| 2 | 27 (45.8) | 0.073 (0.032‐0.266) | |
| 3 | 23 (39.0) | 0.118 (0.047‐0.435) | |
| 4 | 4 (6.8) | 0049 (0.032‐0.808) | |
Median relative expression (25th‐75th percentile).
3.2. Association between CTA‐941F9.9 expression levels and patient survival
Kaplan‐Meier analysis was applied to examine whether CTA‐941F9.9 dysregulation is associated with patient survival time. After excluding 6 patients who were lost during follow‐up, the CRC patients were separated into two sets—high expression (n = 34) and low expression (n = 34)—according to median CTA‐941F9.9 expression levels. However, no significant difference in OS (P = .863) was observed between these two groups (Figure 2).
Figure 2.
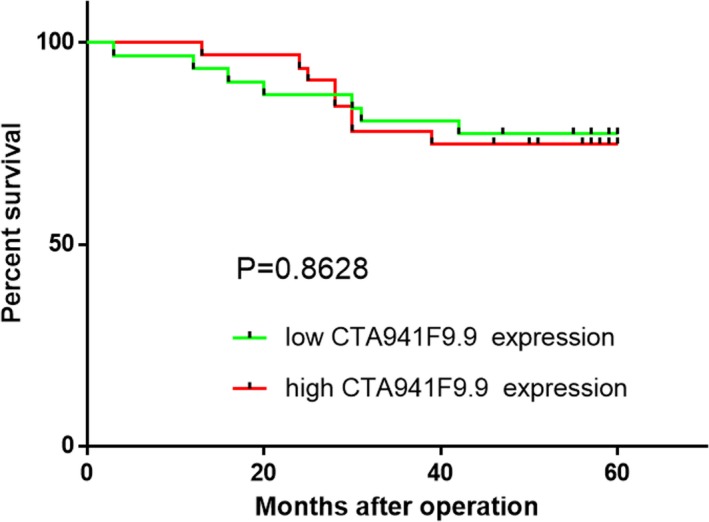
Kaplan‐Meier analysis of the correlation between lncRNA CTA‐941F9.9 expression level and overall survival
3.3. CTA‐941F9.9 is a potential diagnostic biomarker for CRC
We next constructed ROC curves to explore whether CTA‐941F9.9 can be used as a biomarker to distinguish CRC from normal tissues. Our results indicated an AUC of 0.803 (sensitivity, 74.3%; specificity, 83.8%) for cohort 1 and 0.876 (sensitivity, 78.2%; specificity, 85.1%) for cohort 2, suggesting that CTA‐941F9.9 has potential diagnostic value in CRC (Figure 3).
Figure 3.
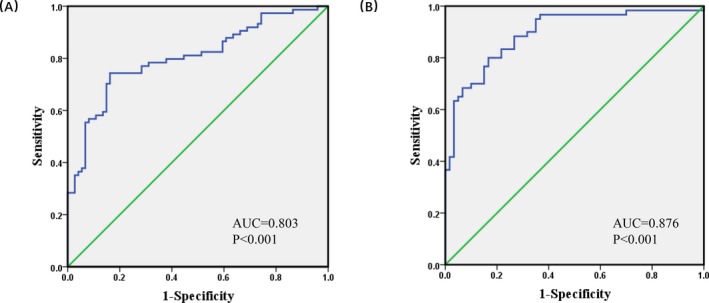
The receiver operating characteristic (ROC) curve of colorectal cancer (CRC) patients based on expression of long noncoding RNA (lncRNA) CTA‐941F9.9. A, The ROC curve of 74 CRC patients. B, The ROC curve of 59 CRC patients
3.4. The effect of CTA‐941F9.9 on cell migration, cell proliferation, the cell cycle, and apoptosis
We next investigated the function of CTA‐941F9.9 in CRC progression by examining relative expression levels of CTA‐941F9.9 in six CRC cell lines. RKO cells exhibited the lowest expression of CTA‐941F9.9 and HCT116 cells the highest relative expression, with the other cell lines showing moderate expression (Figure 4A). Thus, we selected HCT116 cells for CTA‐941F9.9 silencing, termed the si‐CTA‐941F9.9 group, and selected RKO cells for CTA‐941F9.9 overexpression, termed the CTA‐941F9.9 group. The transfection efficiency was measured and recorded at 48 hours after transfection (Figure 4B). To verify the effect of CTA‐941F9.9 on cell proliferation, we performed a CCK‐8 assay and found no significant differences between the CTA‐941F9.9 and negative control (NC) groups or between the si‐CTA‐941F9.9 and si‐NC groups. We next conducted a transwell experiment to assess the effect of CTA‐941F9.9 on CRC cell migration and observed no significant difference after overexpressing or silencing CTA‐941F9.9. As also indicated by the results of cell cycle and cell apoptosis detection, no significant differences were obtained with overexpression or silencing of CTA‐941F9.9 (Figures 5, 6, 7, 8).
Figure 4.
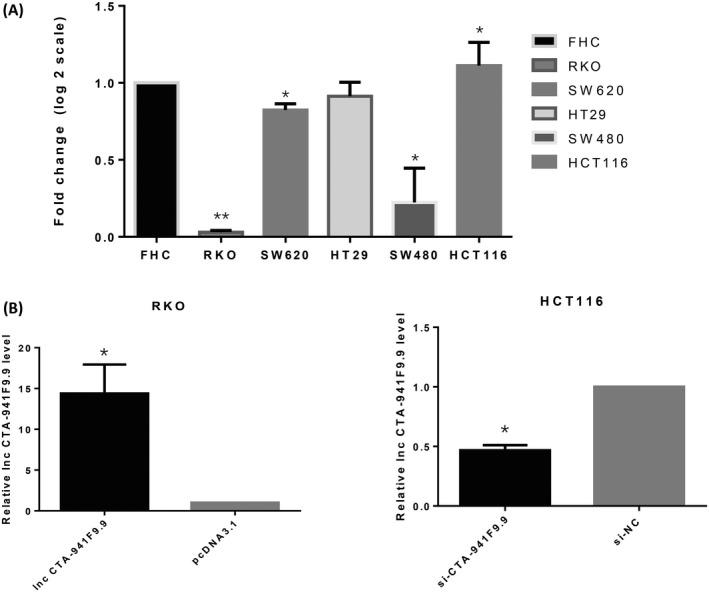
A, Expression of lncRNA CTA‐941F9.9 in CRC cell lines. B, Overexpression and knockdown efficiencies of lncRNA CTA‐941F9.9 in HCT 116 cells and RKO cells
Figure 5.

Daily assessment of overexpressing (lncRNA CTA‐941F9.9 group), silencing (si‐CTA‐941F9.9 group), and control group (pcDNA3.1/si‐NC) CRC cell proliferation for 4 d using a cell counting kit 8 (CCK8) assay
Figure 6.
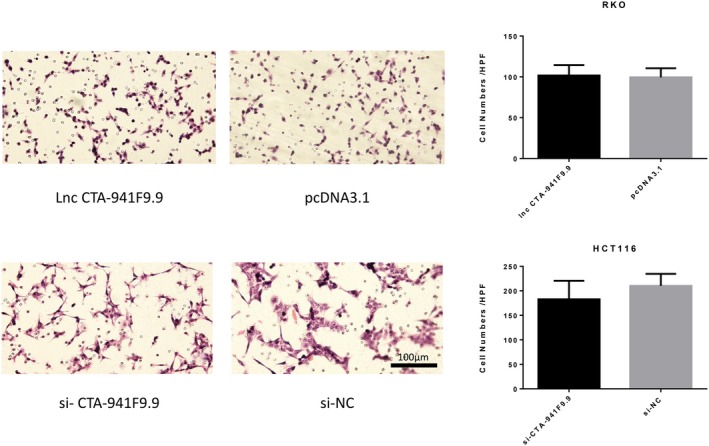
Exploration of lncRNA CTA‐941F9.9’s involvement in CRC cell migration
Figure 7.
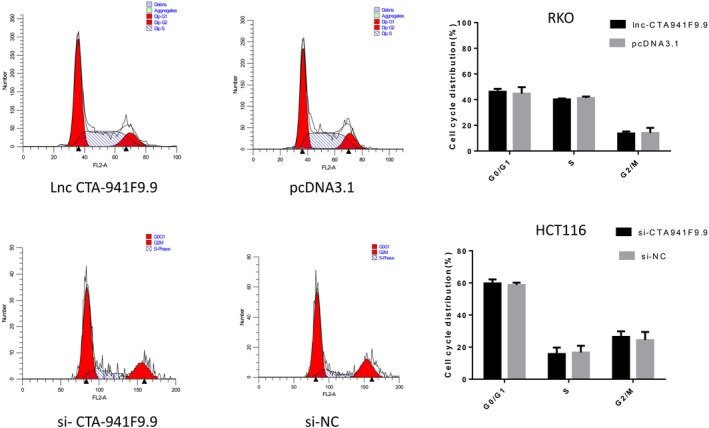
FACS analysis to detect the cell cycle after overexpressing or knocking down lncRNA CTA‐941F9.9
Figure 8.
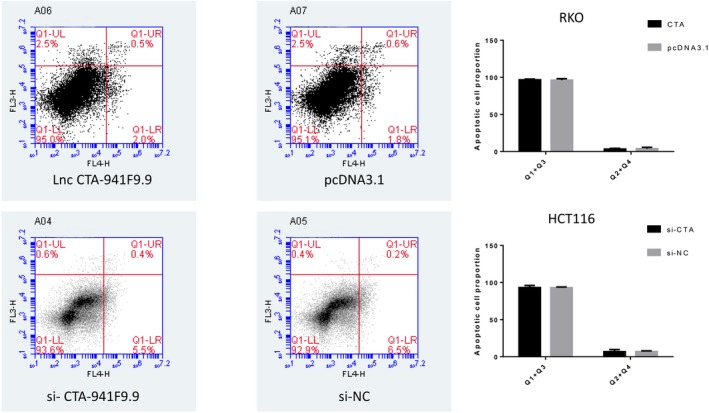
FACS analysis to detect the proportion of apoptotic cells after overexpressing or knocking down lncRNA CTA‐941F9.9
3.5. CTA‐941F9.9 promotes autophagy in CRC cell lines
Real‐time PCR and western blot analyses were performed to detect the impact of CTA 941F9.9 on CRC cell autophagy, showing that the ratio of LC3‐II/LC3‐I was markedly increased in CTA 941F9.9‐overexpressing cells and decreased in si‐CTA 941F9.9 cells. These results indicate that at the protein level, CTA 941F9.9 promotes expression of LC3‐II, a key protein of autophagy, and therefore promotes autophagy. In addition, real‐time PCR experiments indicated that CTA 941F9.9 promotes LC3B gene transcription and autophagy at the mRNA level (Figure 9).
Figure 9.
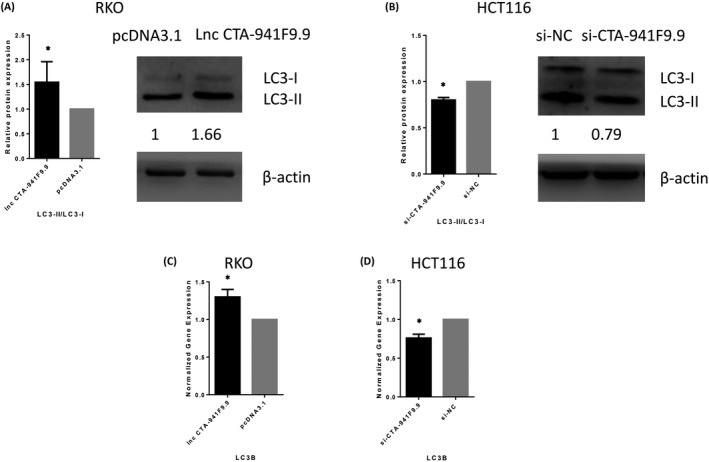
A and B, Protein expression profile of LC3‐II/LC3‐I after overexpressing or knocking down lncRNA CTA‐941F9.9. C and D, Gene expression profile of LC3B after overexpressing or knocking down lncRNA CTA‐941F9.9. qPCR results were normalized to GAPDH. Data are shown as the mean ± SD, n = 3. *Represents P < .05
4. DISCUSSION
Colorectal cancer is a highly heterogeneous disease involving numerous genetic and epigenetic alterations.12 Although medical technologies and treatment strategies have rapidly progressed, more than 60% of colorectal patients are still diagnosed at advanced stages and have poor outcomes.3 Therefore, detecting CRC at early stages is essential. In recent decades, CRC has generally been diagnosed using fecal occult blood testing (FOBT) and colonoscopy.13, 14 In the original trials of the FOBT screening test conducted in the 1980s, adherence to FOBT was only 67%, with low detection accuracy for CRC.13, 15 Similarly, colonoscopy has limitations including high cost and ineffectiveness in large population screening programs. CEA, CA19‐9, and CA72‐4 are the most commonly used serological biomarkers for diagnosing CRC; however, they lack sufficient accuracy. Thus, the identification of biomarkers with high specificity and sensitivity for early CRC screening might significantly improve CRC detection and patient outcomes.
NcRNAs have historically been considered nonfunctional, originally labeled as ‘junk RNAs’. However, research has revealed roles for lncRNAs and indicated that several are aberrantly expressed in many types of cancers.16 For example, CCAT1, a well‐known lncRNA, is upregulated in CRC, gastric cancer (GC), hepatocellular carcinoma, breast cancer, and ovarian cancer.17, 18, 19, 20, 21 Moreover, Sana et al22 reported that lncRNA‐uc.73 and lncRNA‐uc.388 are significantly decreased in CRC tissues and that both lncRNAs are potential diagnostic and prognostic biomarkers in CRC. Wang et al23 used microarray analysis and RT‐qPCR to show that CTA‐941F9.9 was strongly downregulated in gallbladder carcinoma, consistent with our study. Additionally, Liu et al24 found that CRNDE‐h is a potential diagnostic biomarker in CRC (AUC = 0.757). Our results indicate that lncRNA CTA‐941F9.9 is significantly downregulated in CRC tissues compared to NATs. Moreover, ROC curves yielded an AUC of 0.802 and 0.876, indicating that CTA‐941F9.9 is a good potential biomarker for CRC.
It is noteworthy that dysregulated lncRNAs in plasma, urine, gastric juice, and cerebrospinal fluid have the potential to reveal tumors at an early stage. Dong et al25 found that a combination of three circulating lncRNAs (CUDR, LSINCT‐5, and PTENP1) in serum had a significantly higher diagnostic value than did any single‐factor index, including CA19‐9 or CEA, reporting that the combination of three circulating lncRNAs yielded a new complementary marker for GC. Moreover, according to Wang et al,26 MALAT‐1 in urine is a promising biomarker for predicting prostate cancer, and Zheng et al27 demonstrated that UCA1 levels are increased in the gastric juice of GC patients compared with normal individuals. These studies demonstrate that lncRNAs are common in bodily fluids and therefore may be used as diagnostic biomarkers. Because of the low risk and simple collection compared with colonoscopy, these biomarkers may be of practical use in large population screening programs. Overall, the identification of suitable diagnostic biomarkers in the plasma of CRC patients might improve CRC detection and outcomes of patients. Future studies should focus on detecting the expression levels of CTA‐941F9.9 in plasma.
Autophagy works as a evolutionarily conservative degradation pathway in which damaged proteins and cytoplasmic components are removed, digested, and recycled to maintain cellular homeostasis and sustain viability under adverse conditions.28 The processes of autophagy can play both positive and negative role in cancer cells and may be crucial in pathophysiology of CRC.29 LncRNAs, as important regulatory factors, may positively regulate the autophagy process and negatively modulate autophagy. As important autophagy‐related lncRNAs are being discovered, such as HOTAIR, HULC, MALAT1, and GAS5,30, 31, 32, 33 lncRNAs are becoming increasingly important in the field of autophagy research. In general, lncRNAs will be the focus of future autophagy‐related research, and the regulatory role and function of lncRNA in autophagy will become increasingly prominent. The increase in CTA941F9.9 expression observed in CRC cells might enhance the levels of LC3, as demonstrated by our western blotting results, which indicates that CTA941F9.9 might promote autophagy in CRC. Wei et al34 found that FAT4 was downregulated in CRC tissues and promoted autophagy in CRC cells. Processed LC3 participates in the formation of autophagosomes and used to monitor autophagic activity. This protein includes two forms: LC3‐I and LC3‐II. The former is cytosolic and conjugated to phosphatidylethanolamine to form the latter which present both inside and outside autophagosomal membranes.35, 36 Besides, LC3‐II might regulate the formation of autophagosomes and manage their amount during autophagy.37, 38
Increasing evidence indicates that lncRNAs can regulate cancer cell proliferation, invasion, and metastasis.39, 40, 41 Our study aimed to investigate the function of CTA‐941F9.9 in CRC cancer cells, and we found that it has no specific function in regulating the cancer cell cycle, proliferation, migration, or apoptosis. Wang et al42 reported that CTA‐941F9.9 is likely to play important roles in the chondrogenic differentiation process, providing new insight into its regulatory function.43 The potential capacity of CTA‐941F9.9 to promote CRC cell differentiation remains to be investigated. CTA‐941F9.9 may also participate in the process of carcinogenesis.
The molecular mechanisms underlying CRC development are still unknown. As cancer is a complex disease with multiple factors and phases, the decrease in CTA‐941F9.9 expression in CRC may be affected by complex cancer‐related interactions. Future studies will help elucidate these interactions in CRC.
5. CONCLUSION
In conclusion, lncRNA CTA‐941F9.9 is frequently downregulated in CRC compared with NATs and might play an important role in CRC carcinogenesis.
CONFLICT OF INTEREST
All authors have completed the ICMJE uniform disclosure form at www.icmje.org/coi_disclosure.pdf and declare no support from any organization for the submitted work; no financial relationships with any organizations that might have an interest in the submitted work in the previous three years; and no other relationships or activities that could appear to have influenced the submitted work.
ACKNOWLEDGMENTS
None.
Guo Z, Zhou C, Zhong X, et al. The long noncoding RNA CTA‐941F9.9 is frequently downregulated and may serve as a biomarker for carcinogenesis in colorectal cancer. J Clin Lab Anal. 2019;33:e22986 10.1002/jcla.22986
Zhexu Guo and Cen Zhou contributed equally to this work.
Funding information
This work was supported by Natural Science Foundation of Liaoning Province (No. 20180550582), National Nature Science Foundation‐Outstanding Youth Foundation Training Project of China Medical University (YQ20160001), and Project of Science and Technology of Shenyang (18‐014‐4‐07).
Contributor Information
Zhenning Wang, Email: josieon826@sina.cn.
Yongxi Song, Email: songyongxi840309@126.com.
REFERENCES
- 1. Bray F, Ferlay J, Soerjomataram I, Siegel RL, Torre LA, Jemal A. Global Cancer statistics 2018: GLOBOCAN estimates of incidence and mortality worldwide for 36 cancers in 185 countries. CA Cancer J Clin. 2018;68(6):394‐424. [DOI] [PubMed] [Google Scholar]
- 2. Chen W, Zheng R, Baade PD, et al. Cancer statistics in China, 2015. CA Cancer J Clin. 2016;66(2):115‐132. [DOI] [PubMed] [Google Scholar]
- 3. Booth RA. Minimally invasive biomarkers for detection and staging of colorectal Cancer. Cancer Lett. 2007;249(1):87‐96. [DOI] [PubMed] [Google Scholar]
- 4. Ponting CP, Oliver PL, Reik W. Evolution and functions of long noncoding RNAs. Cell. 2009;136(4):629‐641. [DOI] [PubMed] [Google Scholar]
- 5. Mary M. RNA: genome‐wide views of long non‐coding RNAS. Nat Rev Genet. 2011;12(11):742. [DOI] [PubMed] [Google Scholar]
- 6. Distefano JK. The emerging role of long noncoding RNAS in human disease. Methods Mol Biol. 2018;1706:91‐110. [DOI] [PubMed] [Google Scholar]
- 7. Song Y‐X, Sun J‐X, Zhao J‐H, et al. Non‐coding RNAs participate in the regulatory network of CLDN4 via ceRNA mediated miRNA evasion. Nat Commun. 2017;8(1):289. [DOI] [PMC free article] [PubMed] [Google Scholar]
- 8. Huang L, Lin H, Kang L, et al. Aberrant expression of long noncoding RNA SNHG15 correlates with liver metastasis and poor survival in colorectal Cancer. J Cell Physiol. 2019;234(5):7032‐7039. [DOI] [PubMed] [Google Scholar]
- 9. Yin D‐D, Liu Z‐J, Zhang E, Kong R, Zhang Z‐H, Guo R‐H. Decreased expression of long noncoding RNA MEG3 affects cell proliferation and predicts a poor prognosis in patients with colorectal Cancer. Tumor Biol. 2015;36(6):4851‐4859. [DOI] [PubMed] [Google Scholar]
- 10. Qi P, Xu M, Ni S et al. Down‐regulation of ncRNA, a long non‐coding RNA, contributes to colorectal Cancer cell migration and invasion and predicts poor overall survival for colorectal Cancer patients. Mol Carcinog. 2015;54(9):742‐750. [DOI] [PubMed] [Google Scholar]
- 11. Livak KJ, Schmittgen TD. Analysis of relative gene expression data using real‐time quantitative PCR and the 2(‐Delta Delta C(T)) Method. Methods. 2001;25(4):402‐408. [DOI] [PubMed] [Google Scholar]
- 12. Carethers JM, Jung BH. Genetics and genetic biomarkers in sporadic colorectal Cancer. Gastroenterology. 2015;149(5):1177‐1190. [DOI] [PMC free article] [PubMed] [Google Scholar]
- 13. Kronborg O, Fenger C, Olsen J, Jørgensen OD, Søndergaard O. Randomised study of screening for colorectal Cancer with faecal‐occult‐blood test. Lancet (London, England). 1996;348(9040):1467‐1471. [DOI] [PubMed] [Google Scholar]
- 14. Mandel JS, Bond JH, Church TR, et al. Reducing mortality from colorectal Cancer by screening for fecal occult blood. Minnesota colon cancer control study. N Engl J Med. 1993;328(19):1365‐1371. [DOI] [PubMed] [Google Scholar]
- 15. Hardcastle JD, Chamberlain JO, Robinson M, et al. Randomised controlled trial of faecal‐occult‐blood screening for colorectal Cancer. Lancet. 1996;348(9040):1472‐1477. [DOI] [PubMed] [Google Scholar]
- 16. Qiu M‐T, Hu J‐W, Yin R, Xu L. Long noncoding RNA: an emerging paradigm of cancer research. Tumour Biol. 2013;34(2):613‐620. [DOI] [PubMed] [Google Scholar]
- 17. Kam Y, Rubinstein A, Naik S, et al. Detection of a long non‐coding RNA (CCAT1) in living cells and human adenocarcinoma of colon tissues using FIT‐PNA molecular beacons. Cancer Lett. 2014;352(1):90‐96. [DOI] [PubMed] [Google Scholar]
- 18. Yang F, Xue X, Bi J, et al. Long noncoding RNA CCAT1, which could be activated by c‐Myc, promotes the progression of gastric carcinoma. J Cancer Res Clin Oncol. 2013;139(3):437‐445. [DOI] [PubMed] [Google Scholar]
- 19. Zhu H‐Q, Zhou XU, Chang H, et al. Aberrant expression of CCAT1 regulated by c‐Myc predicts the prognosis of hepatocellular carcinoma. Asian Pac J Cancer Prev. 2015;16(13):5181‐5185. [DOI] [PubMed] [Google Scholar]
- 20. Zhang XF, Liu T, Li Y, Li S. Overexpression of long non‐coding RNA CCAT1 is a novel biomarker of poor prognosis in patients with breast Cancer. Int J Clin Exp Pathol. 2015;8(8):9440‐9445. [PMC free article] [PubMed] [Google Scholar]
- 21. Liu SP, Yang JX, Cao DY, Shen K. Identification of differentially expressed long non‐coding RNAs in human ovarian Cancer cells with different metastatic potentials. Cancer Biol Med. 2013;10(3):138‐141. [DOI] [PMC free article] [PubMed] [Google Scholar]
- 22. Sana J, Hankeova S, Svoboda M, Kiss I, Vyzula R, Slaby O. Expression levels of transcribed ultraconserved regions uc.73 and uc.388 are altered in colorectal Cancer. Oncology. 2012;82(2):114‐118. [DOI] [PubMed] [Google Scholar]
- 23. Wang J, Liu H, Shen X, et al. Long non‐coding RNA expression profiles in gallbladder carcinoma identified using microarray analysis. Oncol Lett. 2017;13(5):3508‐3516. [DOI] [PMC free article] [PubMed] [Google Scholar]
- 24. Wang C‐X, Liu T, Zhang X, Yang Y, Du L‐T. Increased expression of the long noncoding RNA CRNDE‐h indicates a poor prognosis in colorectal Cancer, and is positively correlated with IRX5 mRNA expression. Onco Targets Ther. 2016;9:1437‐1448. [DOI] [PMC free article] [PubMed] [Google Scholar]
- 25. Dong L, Qi P, Xu M‐D, et al. Circulating CUDR, LSINCT‐5 and PTENP1 long noncoding RNAs in sera distinguish patients with gastric cancer from healthy controls. Int J Cancer. 2015;137(5):1128‐1135. [DOI] [PubMed] [Google Scholar]
- 26. Wang F, Ren S, Chen R et al. Development and prospective multicenter evaluation of the long noncoding RNA MALAT‐1 as a diagnostic urinary biomarker for prostate cancer. Oncotarget. 2014;5(22):11091‐11102. [DOI] [PMC free article] [PubMed] [Google Scholar]
- 27. Zheng Q, Wu F, Dai W‐Y, et al. Aberrant expression of UCA1 in gastric cancer and its clinical significance. Clin Transl Oncol. 2015;17(8):640‐646. [DOI] [PubMed] [Google Scholar]
- 28. Choi A, Ryter SW, Levine B. Autophagy in human health and disease —NEJM. N Engl J Med. 2013;368:651‐662. [DOI] [PubMed] [Google Scholar]
- 29. Liu G, Pei F, Yang F, et al. Role of autophagy and apoptosis in non‐small‐cell lung cancer. Int J Mol Sci. 2017;18(2):367. [DOI] [PMC free article] [PubMed] [Google Scholar]
- 30. Wu C, Yang L, Qi X, Wang T, Li M, Xu K. Inhibition of long non‐coding RNA HOTAIR enhances radiosensitivity via regulating autophagy in pancreatic cancer. Cancer Manag Res. 2018;2(10):5261‐5271. [DOI] [PMC free article] [PubMed] [Google Scholar]
- 31. Xin X, Wu M, Meng Q, et al. Long noncoding RNA HULC accelerates liver cancer by inhibiting PTEN via autophagy cooperation to miR15a. Mol Cancer. 2018;17(1):94. [DOI] [PMC free article] [PubMed] [Google Scholar]
- 32. Fu Z, Luo W, Wang J, et al. Malat1 activates autophagy and promotes cell proliferation by sponging miR‐101 and upregulating STMN1, RAB5A and ATG4D expression in glioma. Biochem Biophys Res Commun. 2017;492(3):480‐486. [DOI] [PubMed] [Google Scholar]
- 33. Li L, Huang C, He Y, Sang Z, Liu G, Dai H. Knockdown of long non‐coding RNA GAS5 increases miR‐23a by targeting ATG3 involved in autophagy and cell viability. Cell Physiol Biochem. 2018;48(4):1723‐1734. [DOI] [PubMed] [Google Scholar]
- 34. Wei R, Xiao Y, Song YI, Yuan H, Luo J, Xu W. FAT4 regulates the EMT and autophagy in colorectal cancer cells in part via the PI3K‐AKT signaling axis. J Exp Clin Cancer Res. 2019;38:112. [DOI] [PMC free article] [PubMed] [Google Scholar]
- 35. Tanida I, Ueno T, Kominami E. LC3 conjugation system in mammalian autophagy. Int J Biochem Cell Biol. 2004;36:2503‐2518. [DOI] [PMC free article] [PubMed] [Google Scholar]
- 36. Fujita N, Itoh T, Omori H, Fukuda M, Noda T, Yoshimori T. The Atg16L complex specifies the site of LC3 lipidation for membrane biogenesis in autophagy. Mol Biol Cell. 2008;19:2092‐2100. [DOI] [PMC free article] [PubMed] [Google Scholar]
- 37. Ito H, Daido S, Kanzawa T, Kondo S, Kondo Y. Radiation‐induced autophagy is associated with LC3 and its inhibition sensitizes malignant glioma cells. Int J Oncol. 2005;26:1401‐1410. [PubMed] [Google Scholar]
- 38. Jian X, Xiao‐yan Z, Bin H, et al. MiR‐204 regulate cardiomyocyte autophagy induced by hypoxia‐reoxygenation through LC3‐II. Int J Cardiol. 2011;148:110‐112. [DOI] [PubMed] [Google Scholar]
- 39. Li L, Dang Q, Xie H et al. Infiltrating mast cells enhance prostate cancer invasion via altering LncRNA‐HOTAIR/PRC2‐androgen receptor (AR)‐MMP9 signals and increased stem/progenitor cell population. Oncotarget. 2015;6(16):14179‐14190. [DOI] [PMC free article] [PubMed] [Google Scholar]
- 40. Liang WC, Fu WM, Wong CW et al. The lncRNA H19 promotes epithelial to mesenchymal transition by functioning as miRNA sponges in colorectal Cancer. Oncotarget. 2015;6(26):22513‐22525. [DOI] [PMC free article] [PubMed] [Google Scholar]
- 41. Shi S‐J, Wang L‐J, Yu B et al. LncRNA‐ATB promotes trastuzumab resistance and invasion‐metastasis cascade in breast Cancer. Oncotarget. 2015;6(13):11652‐11663. [DOI] [PMC free article] [PubMed] [Google Scholar]
- 42. Wang L, Li Z, Li Z, Yu B, Wang Y. Long noncoding RNAs expression signatures in chondrogenic differentiation of human bone marrow mesenchymal stem cells. Biochem Biophys Res Comm. 2015;456(1):459‐464. [DOI] [PubMed] [Google Scholar]
- 43. Peng S, Cao L, He S, et al. An overview of long noncoding RNAS involved in bone regeneration from mesenchymal stem cells. Stem Cells Int. 2018;2018:8273648. [DOI] [PMC free article] [PubMed] [Google Scholar]


