Abstract
The response to metformin, the most commonly used drug for the treatment of type 2 diabetes (T2D), is highly variable. The common variant rs7903146 C>T within the transcription factor 7-like 2 gene (TCF7L2) is the strongest genetic risk factor associated with T2D to date. In this study, we explored the effects of the TCF7L2 rs7903146 genotype on metformin response in T2D. The study included 86 newly diagnosed patients with T2D, incident users of metformin. Levels of fasting glucose, insulin, HbA1c, total cholesterol, HDL-cholesterol, LDL-cholesterol, triglycerides, and anthropometric parameters were measured prior to metformin therapy, and 6 and 12 months after the treatment. Genotyping of the TCF7L2 rs7903146 was performed by the Sequenom MassARRAY® iPLEX® platform. At baseline, the diabetes risk allele (T) showed an association with lower triglyceride levels (p = 0.037). After 12 months of metformin treatment, the T allele was associated with 25.9% lower fasting insulin levels (95% CI 10.9–38.3%, p = 0.002) and 29.1% lower HOMA-IR index (95% CI 10.1–44.1%, p = 0.005), after adjustment for baseline values. Moreover, the T allele was associated with 6.7% lower fasting glucose levels (95% CI 1.1–12.0%, p = 0.021), adjusted for baseline glucose and baseline HOMA-%B levels, after 6 months of metformin treatment. This effect was more pronounced in the TT carriers who had 16.8% lower fasting glucose levels (95% CI 7.0–25.6%, p = 0.002) compared to the patients with CC genotype. Our results suggest that the TCF7L2 rs7903146 variant affects markers of insulin resistance and glycemic response to metformin in newly diagnosed patients with T2D within the first year of metformin treatment.
Keywords: Metformin, type 2 diabetes, pharmacogenetics, transcription factor 7-like 2 gene, TCF7L2
INTRODUCTION
Metformin is the most commonly used drug in the treatment of type 2 diabetes (T2D). It is recommended as the first-line therapy for T2D based on its efficacy, safety, low cost, and extensive use [1]. However, there is a considerable interindividual variability in the therapeutic response to metformin. It has been shown that common genetic variants affect metformin glycemic response, explaining up to 34% variation in hemoglobin A1c (HbA1c) reduction with this drug [2]. In candidate gene studies, the pharmacokinetic gene variants have not shown a consistent and significant effect on metformin glycemic response in patients with T2D [3]. Furthermore, only two genome-wide signals associated with metformin clinical response have been discovered to date [4,5]. Thus, genetic factors influencing metformin response are yet to be revealed.
In a recent study on the acute response to metformin and glipizide (Study to Understand the Genetics of the Acute Response to Metformin and Glipizide in Humans [SUGAR-MGH]), the rs7903146 C>T variant in the transcription factor 7-like 2 (TCF7L2) gene was associated with a greater decline in fasting glucose levels after metformin administration in individuals without diabetes [6]. This single nucleotide polymorphism (SNP) is the strongest genetic risk factor associated with T2D till date [7], although the underlying mechanism is not clear. TCF7L2 is a part of the canonical (β-catenin-dependent) Wnt signaling pathway, which regulates organogenesis. Without β-catenin, TCF7L2 binds to Wnt-target genes and represses their transcription, whereas the complex formed between β-catenin and TCF7L2 enhances the gene expression. TCF7L2 is expressed in many cells and tissues, including β-cells, adipose tissue, the liver, gut, and brain. Different mechanisms have been proposed for the increased risk of T2D associated with the rs7903146 T allele. Most of the studies suggest that TCF7L2 plays a key role in β-cell function and that progressive loss of insulin secretion might be the main mechanism by which carriers of the risk T allele are predisposed to develop T2D, although the exact molecular mechanisms are still unknown [7].
The pharmacogenetic effect of the TCF7L2 variant on a therapeutic response to hypoglycemic agents has been explored in only a few studies. The T allele was associated with an increased risk of sulfonylurea treatment failure [8,9], whereas it showed no effect on the therapeutic response in metformin-treated patients [8]. However, a recent study suggested that TCF7L2 could be implicated in both, sulfonylurea and metformin response [6].
In this study, we aimed to explore the effects of the TCF7L2 rs7903146 genotype on the metformin response in patients with newly diagnosed T2D.
MATERIALS AND METHODS
Study population
The study population included newly diagnosed patients with T2D from the Clinic for Endocrinology and Diabetes, University Clinical Centre of Sarajevo, who were prescribed metformin as their first anti-hyperglycemic therapy. All research was done in accordance with the ethical principles of the Declaration of Helsinki. The study was approved by the International University of Sarajevo Ethics Committee (ethical approval number 3-29-2013), and written informed consent was obtained from each participant.
Eighty-six patients who were diagnosed with T2D after 35 years of age were enrolled in the study. We excluded individuals with chronic gastrointestinal diseases, including chronic liver disease, gastroduodenal ulcer, chronic pancreatitis, cholelithiasis, and inflammatory bowel disease, as well as individuals with chronic kidney disease, infection, endocrine disorders, and hormonal therapy.
Anthropometric and biochemical parameters were measured prior to metformin initiation. After 6 and 12 months of metformin treatment, measurements were repeated, and any changes in T2D therapy, use of other medications, or presence of side effects were recorded. Patients who discontinued metformin or were prescribed another anti-hyperglycemic agent, within the first 6 months of metformin initiation, were excluded.
Biochemical measurements
The fasting glucose, insulin, HbA1c, total cholesterol, high-density lipoprotein (HDL)-cholesterol, low-density lipoprotein (LDL)-cholesterol, triglycerides, and creatinine levels were measured prior to metformin therapy, and 6 and 12 months after the treatment. All analyses were conducted at the Department for Clinical Chemistry and Biochemistry of the University Clinical Centre of Sarajevo, according to standard International Federation of Clinical Chemistry (IFCC) protocols, with internal and external quality control.
The Cockcroft-Gault formula was used to estimate creatinine clearance. The homeostasis model assessment insulin resistance (HOMA-IR) index was calculated as: fasting insulin (pmol/l) × fasting glucose (mmol/l)/156.26 [10]. The homeostasis model assessment of β-beta cell function (HOMA-%B) was estimated as: (2.88 × fasting insulin (pmol/l))/(fasting glucose (mmol/l) - 3.5) [10].
Genetic analysis
Genomic DNA was isolated from the whole blood using Miller’s protocol [11] and QIAamp DNA Blood Midi Kit (Qiagen, Hilden, Germany). The TCF7L2 rs7903146 C>T variant was genotyped using Sequenom MassARRAY® iPLEX® platform (Agena Bioscience, Inc., San Diego, California, USA) at the Lund University Diabetes Centre, Lund University, Malmö, Sweden. Genotyping included internal positive and negative control samples. The minor T allele frequency was 0.38. The genotype distribution was in accordance with the Hardy-Weinberg equilibrium (p > 0.05).
Statistical analysis
The differences in clinical and biochemical variables before and after metformin treatment were tested using a paired t-test for normally distributed parameters and Wilcoxon signed-rank test for non-normally distributed data. Comparison of quantitative variables before treatment between different genotype groups was performed by ANOVA test for trend for normally distributed variables and by Jonckheere’s trend test for skewed data, whereas the comparison of categorical variables was performed with the Cochran-Armitage trend test. The association of the variant with clinical and biochemical parameters after metformin treatment was tested under an additive genetic model using a linear regression analysis, adjusted for baseline parameter value, average creatinine clearance, treatment duration, average metformin daily dose, and change in body weight during treatment period (except for weight and body mass index [BMI] analysis). For lipid levels, analyses were also adjusted for lipid-lowering treatment (yes or no). Non-normally distributed variables assessed as outcomes in the linear regression models were logarithmically transformed before analysis. Statistical analyses were performed using SAS 9.3 program (SAS Institute Inc., Cary, NC). The threshold for statistical significance was p < 0.05.
RESULTS
From the total of 86 patients included in the study, 4 patients discontinued metformin within the first 6 months of treatment due to severe gastrointestinal side effects. From 82 patients who completed 6 months of metformin treatment, 68 individuals were followed up for additional 6 months (12 months in total).
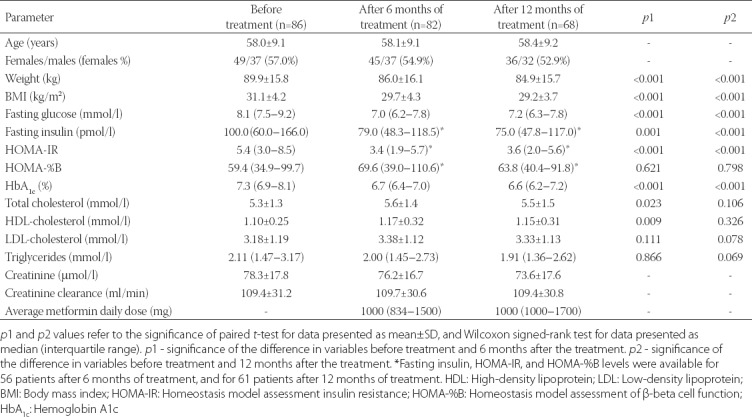
The clinical and biochemical parameters before metformin initiation, and 6 and 12 months after the treatment are shown in Table 1. There was a significant decrease in weight, BMI, fasting glucose, fasting insulin, HOMA-IR, and HbA1c levels after both treatment periods, whereas total cholesterol and HDL-cholesterol concentrations were higher after 6 months of metformin treatment (Table 1).
TABLE 1.
Clinical and biochemical parameters of newly diagnosed T2D patients before and 6 and 12 months after metformin treatment
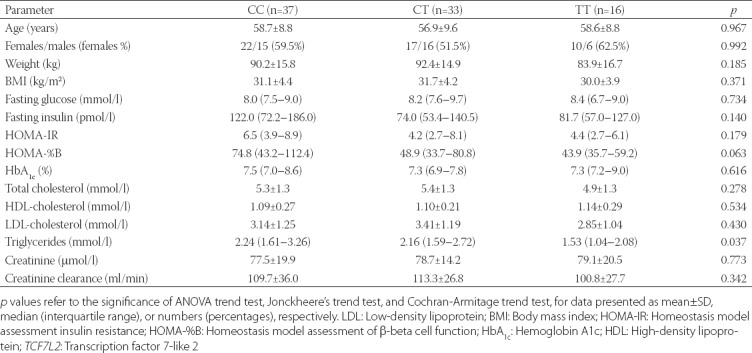
The baseline clinical and biochemical characteristics of patients according to the TCF7L2 rs7903146 genotypes are shown in Table 2. There was a significant difference in triglyceride levels between the genotype groups. The risk T allele was associated with lower concentrations of triglycerides, before metformin initiation (p = 0.037). There was also a trend of T allele association with lower HOMA-%B, although this did not reach statistical significance (p = 0.063).
TABLE 2.
Baseline characteristics of the study participants according to the TCF7L2 rs7903146 genotypes
Next, we explored the association of the rs7903146 T allele with anthropometric and biochemical variables after 6 and 12 months of metformin therapy, using the linear regression analysis (Table 3). There were no significant differences in changes in anthropometric and glycemic parameters, HOMA-%B, or lipid levels. However, the risk T allele showed an association with lower fasting insulin levels (β = -0.130, SE = 0.040, p = 0.002) and lower HOMA-IR index (β = -0.149, SE = 0.051, p = 0.005), after 12 months of metformin treatment (Table 3). Each copy of T allele was associated with 25.9% (95% confidence interval [CI] 10.9–38.3%) lower insulin levels (Figure 1), and 29.1% (95% CI 10.1–44.1%) lower HOMA-IR values (Figure 2).
TABLE 3.
Association of the TCF7L2 rs7903146 T allele with metabolic parameters after 6 and 12 months of metformin treatment, adjusted for the baseline parameter value
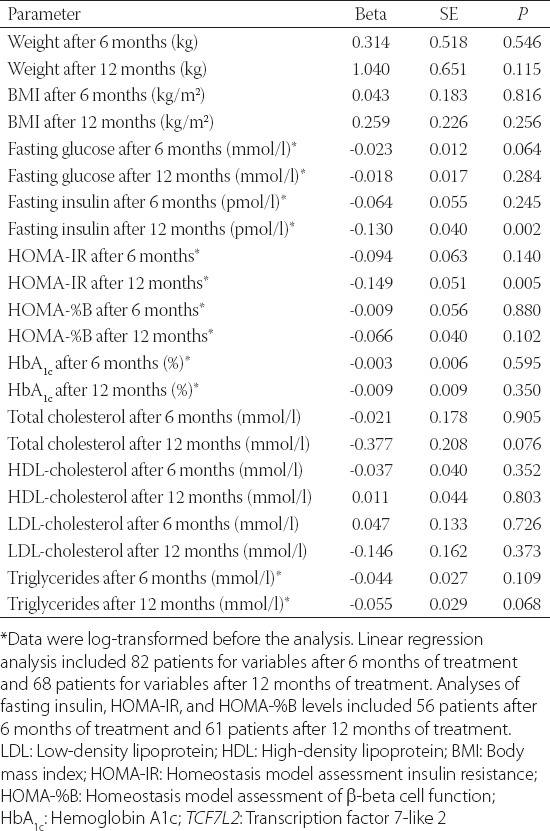
FIGURE 1.
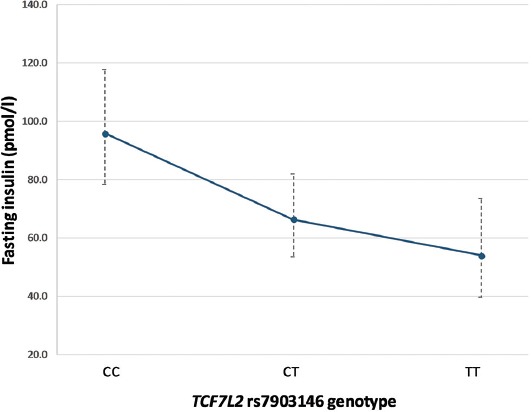
Association between the TCF7L2 rs7903146 variant and fasting insulin levels after 12 months of metformin treatment. Data are presented as model-adjusted means and 95% CIs (back-transformed to original scale). TCF7L2: Transcription factor 7-like 2.
FIGURE 2.
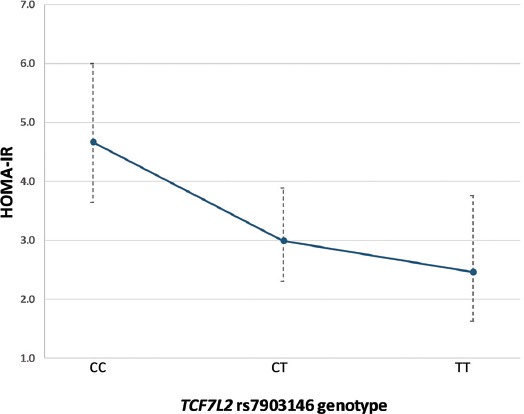
Association between the TCF7L2 rs7903146 variant and HOMA-IR index after 12 months of metformin treatment. Data are presented as model-adjusted means and 95% CIs (back-transformed to original scale). TCF7L2: Transcription factor 7-like 2; HOMA-IR: Homeostasis model assessment insulin resistance.
As differences in metformin response may be more pronounced between the CC and TT homozygous carriers, we further compared these two genotype groups using the same linear regression models. In line with the results of the additive genetic model, the TT carriers had lower fasting insulin levels (β = -0.274, SE = 0.086, p = 0.003) and lower HOMA-IR index (β = -0.314, SE = 0.110, p = 0.008) after 12 months of metformin therapy, compared to patients with the CC genotype. Furthermore, the TT carriers showed 11.5% (95% CI 0.6–21.2%) lower fasting glucose concentrations after 6 months of treatment compared to the CC homozygotes (β = -0.053, SE = 0.025, p = 0.040).
Considering that the rs7903146 T allele showed a trend of association with lower HOMA-%B levels before metformin initiation, we performed additional exploratory analyses of the effect of the T allele on glucose and HbA1c levels after metformin treatment, in regression models adjusted for baseline HOMA-%B. In the additive genetic model, the T allele was associated with 6.7% (95% CI 1.1–12.0%) lower fasting glucose levels after 6 months of metformin treatment [β = -0.030, SE = 0.013, p = 0.021] (Figure 3). This effect was more pronounced in the TT carriers who had 16.8% (95% CI 7.0–25.6%) lower glucose levels compared to the patients with the CC genotype, after 6-month therapy (β = -0.080, SE = 0.024, p = 0.002). Still, the effect of the TCF7L2 variant on HbA1c levels was not significant (data not shown).
FIGURE 3.
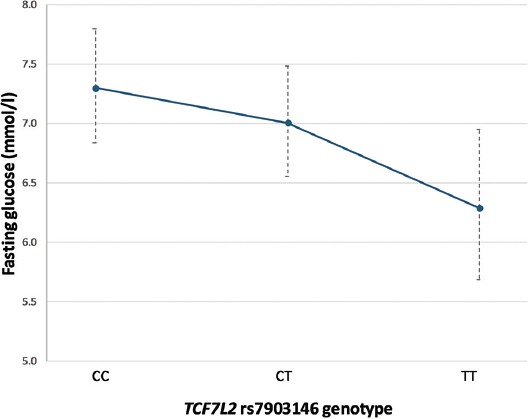
Association between the TCF7L2 rs7903146 variant and fasting glucose levels after 6 months of metformin treatment, adjusted for baseline HOMA-%B values. Data are presented as model-adjusted means and 95% CIs (back-transformed to original scale). TCF7L2: Transcription factor 7-like 2; HOMA-%B: Homeostasis model assessment of β-beta cell function.
DISCUSSION
The common TCF7L2 rs7903146 variant is the strongest genetic risk factor associated with T2D to date. Different underlying mechanisms of this association have been proposed, including the effect on β-cell proliferation, insulin synthesis, processing, and secretion, and impaired incretin response [7]. Most of the studies suggest that the rs7903146 variant affects β-cells and insulin secretion. As metformin acts primarily by improving insulin action, the pharmacogenetic effect of this variant on metformin response in T2D was explored in only one study and with negative results [8]. The results of our study, however, suggest that the TCF7L2 rs7903146 variant influences response to metformin in patients with T2D.
Before metformin initiation, the risk T allele showed a trend of association with a lower HOMA-%B index. This finding is in line with most of the previous studies, which found an association between the T allele and decreased β-cell function [12,13]. The T allele was also associated with lower baseline triglyceride levels in our study, which is again in accordance with the earlier studies [14]. Despite its known association with T2D, the T allele showed a protective effect against elevated fasting triglycerides in a large meta-analysis which included over 50,000 patients with T2D [14]. Although the mechanism for this is unknown, it is possible that TCF7L2 expression has opposite effects on plasma glucose and lipid levels. In animal models, impaired Wnt signaling was associated with decreased TCF7L2 expression and elevated de novo lipogenesis in the liver, resulting in high plasma triglyceride levels [15]. In addition, a number of studies demonstrated an association of the T allele with lower BMI [16]. In our study, the TT carriers had lower body weight and lower BMI; however, this was not statistically significant.
After 12 months of metformin treatment, the T allele was associated with lower fasting insulin and lower HOMA-IR levels. As all the analyses were adjusted for baseline values, the T allele was associated with a greater decline in fasting insulin and HOMA-IR. The beneficial effect of the rs7903146 variant on markers of insulin resistance after metformin treatment has not been reported before. Furthermore, when the two homozygous genotype groups were compared, the TT carriers had lower fasting glucose levels after 6 months of treatment, compared with the CC homozygotes. This indicates that, in addition to lower insulin resistance, the TT carriers also have a better glycemic response to metformin, compared with the patients with CC genotype. These findings are in line with the recent SUGAR-MGH study [6], which showed an association between the T allele and a greater decline in fasting glucose levels after administration of four doses of 500 mg metformin in individuals without diabetes. Although the effect on HbA1c reduction in our study was not significant, the TT carriers had a better glycemic response to metformin after 6 months of treatment. This is in contrast with the large Genetics of Diabetes Audit and Research in Tayside Scotland (GoDARTS) study, where an effect on therapeutic response to metformin was not observed [8]. It has been suggested that the discrepancies between the SUGAR-MGH and GoDARTS studies reflect different study designs and participants: the SUGAR-MGH explored physiological response in individuals without diabetes after acute metformin dosing, while the GoDARTS study investigated therapeutic response in patients with established T2D chronically treated with metformin [17]. However, the results of our study, which also included metformin-treated patients with T2D, indicate that these differences might not be the reason for contradictory results. For example, it has been proposed that metformin is more efficacious in carriers of the risk allele in the early course of T2D, when β-cell mass is still preserved, but that it becomes less efficacious with disease progression [6]. Thus, the T allele could have a different effect depending on the level of β-cell mass and function. Taking into account this hypothesis, as well as the observed trend of association between the T allele and lower HOMA-%B before metformin treatment, we conducted additional exploratory analyses. Changes in the parameters of glycemic response to metformin were analyzed in the model adjusted for baseline HOMA-%B levels. Although the effect on HbA1c levels was still not observed, under the additive genetic model, the T allele was associated with lower fasting glucose levels after 6 months of metformin treatment, and the difference between the TT and CC carriers was more pronounced. Thus, the differences between our and the GoDARTS results could potentially be explained by differences in β-cell function between patients, in line with the proposed hypothesis. Namely, our study included newly diagnosed patients who were in the early stage of the disease, while GoDARTS patients had been diagnosed with T2D over 2 years on average before starting metformin therapy.
The potential mechanism underlying the effect of the TCF7L2 rs7903146 on metformin response is unknown. Considering that molecular mechanisms by which TCF7L2 increases T2D risk and the mechanisms of metformin action are not yet fully understood, the explanation for the observed effects can only be speculated. Metformin inhibits mitochondrial complex I in hepatocytes, resulting in decreased adenosine triphosphate (ATP) and increased adenosine monophosphate (AMP) levels, which leads to the inhibition of gluconeogenesis via multiple proposed mechanisms [18]. Changes in the AMP/ATP ratio also activate 5’ AMP-activated protein kinase (AMPK), leading to reduced lipid synthesis and enhanced insulin sensitivity [18]. Thus, it is possible that different mechanisms are responsible for metformin-induced inhibition of gluconeogenesis and its effect on lipid metabolism and insulin sensitivity. The TCF7L2 rs7903146 variant also has pleiotropic effects [7]. Although the T allele is associated with decreased β-cell function and increased T2D risk, possibly through increased resistance to incretin effect, it is also associated with lower BMI [16] and lower triglyceride levels in patients with T2D [14]. Thus, it is possible that the T allele carriers have a better response to metformin in the early course of the disease, due to a greater decrease in insulin resistance. However, the T allele may have the opposite effect in the later stage as the disease progresses, due to the progressive loss of β-cell function. Larger pharmacogenetic studies are required to explore this hypothesis.
The main limitation of our study is the small sample size. Still, the observed interaction between the TCF7L2 rs7903146 variant and metformin response confirms findings of the recent research in individuals without diabetes and warrants further investigations.
CONCLUSION
This is the first study that demonstrated the effect of the TCF7L2 rs7903146 variant on the response to metformin in patients with T2D. Our results suggest that the diabetes risk T allele is associated with lower insulin resistance and better glycemic response in newly diagnosed patients within the first year of metformin treatment. Further studies are needed to confirm our findings and to elucidate potential mechanisms by which the TCF7L2 variant can modulate therapeutic response to metformin.
ACKNOWLEDGMENTS
The authors acknowledge medical doctors from the Health Centre of Sarajevo Canton and paramedical staff from the Clinic for Endocrinology and Diabetes, University Clinical Centre of Sarajevo, who assisted in the study.
The study was supported by grants received from the Council of Ministers/Ministry of Civil Affairs of Bosnia and Herzegovina and the Federal Ministry for Education and Science of Bosnia and Herzegovina awarded to S.S., by a European Foundation for the Study of Diabetes Albert Renold Travel Fellowship to T.D., and by grants to E.A. from Diabetes Wellness Sweden (25–420 PG) and the Swedish Research Council (Dnr. 2017–02688). T.D. holds a Wellcome Trust Seed Award in Science (209943/Z/17/Z). E.R.P. holds a Wellcome Trust New Investigator Award (102820/Z/13/Z).
DECLARATION OF INTERESTS
The authors declare no conflict of interests.
REFERENCES
- 1.Davies MJ, D'Alessio DA, Fradkin J, Kernan WN, Mathieu C, Mingrone G, et al. Management of hyperglycaemia in Type 2 diabetes 2018 A consensus report by the American diabetes association (ADA) and the European association for the study of diabetes (EASD) Diabetologia. 2018;61(5):2461–98. doi: 10.1007/s00125-018-4729-5. https://doi.org/10.1007/s00125-018-4729-5. [DOI] [PubMed] [Google Scholar]
- 2.Zhou K, Donnelly L, Yang J, Li M, Deshmukh H, Van Zuydam N, et al. Heritability of variation in glycaemic response to metformin:A genome-wide complex trait analysis. Lancet Diabetes Endocrinol. 2014;2(6):481–7. doi: 10.1016/S2213-8587(14)70050-6. https://doi.org/10.1016/S2213-8587(14)70050-6. [DOI] [PMC free article] [PubMed] [Google Scholar]
- 3.Dujic T, Zhou K, Yee SW, van Leeuwen N, de Keyser CE, Javorský M, et al. Variants in pharmacokinetic transporters and glycemic response to metformin:A metgen meta-analysis. Clin Pharmacol Ther. 2017;101(6):763–72. doi: 10.1002/cpt.567. https://doi.org/10.1002/cpt.567. [DOI] [PMC free article] [PubMed] [Google Scholar]
- 4.GoDARTS and UKPDS Diabetes Pharmacogenetics Study Group, Wellcome Trust Case Control Consortium 2. Zhou K, Bellenguez C, Spencer CC, Bennett AJ, et al. Common variants near ATM are associated with glycemic response to metformin in Type 2 diabetes. Nat Genet. 2011;43(2):117–20. doi: 10.1038/ng.735. https://doi.org/10.1038/ng.735. [DOI] [PMC free article] [PubMed] [Google Scholar]
- 5.Zhou K, Yee SW, Seiser EL, van Leeuwen N, Tavendale R, Bennett AJ, et al. Variation in the glucose transporter gene SLC2A2 is associated with glycemic response to metformin. Nat Genet. 2016;48(9):1055–9. doi: 10.1038/ng.3632. https://doi.org/10.1038/ng.3632. [DOI] [PMC free article] [PubMed] [Google Scholar]
- 6.Srinivasan S, Kaur V, Chamarthi B, Littleton KR, Chen L, Manning AK, et al. TCF7L2 genetic variation augments incretin resistance and influences response to a sulfonylurea and metformin:The study to understand the genetics of the acute response to metformin and glipizide in humans (SUGAR-MGH) Diabetes Care. 2018;41(3):554–61. doi: 10.2337/dc17-1386. https://doi.org/10.2337/dc17-1386. [DOI] [PMC free article] [PubMed] [Google Scholar]
- 7.Adams JD, Vella A. What can diabetes-associated genetic variation in TCF7L2 teach us about the pathogenesis of Type 2 diabetes? Metab Syndr Relat Disord. 2018;16:383–9. doi: 10.1089/met.2018.0024. https://doi.org/10.1089/met.2018.0024. [DOI] [PMC free article] [PubMed] [Google Scholar]
- 8.Pearson ER, Donnelly LA, Kimber C, Whitley A, Doney AS, McCarthy MI, et al. Variation in TCF7L2 influences therapeutic response to sulfonylureas:A GoDARTs study. Diabetes. 2007;56:2178–82. doi: 10.2337/db07-0440. https://doi.org/10.2337/db07-0440. [DOI] [PubMed] [Google Scholar]
- 9.Holstein A, Hahn M, Körner A, Stumvoll M, Kovacs P. TCF7L2 and therapeutic response to sulfonylureas in patients with Type 2 diabetes. BMC Med Genet. 2011;12:30. doi: 10.1186/1471-2350-12-30. https://doi.org/10.1186/1471-2350-12-30. [DOI] [PMC free article] [PubMed] [Google Scholar]
- 10.Matthews DR, Hosker JP, Rudenski AS, Naylor BA, Treacher DF, Turner RC, et al. Homeostasis model assessment:Insulin resistance and beta-cell function from fasting plasma glucose and insulin concentrations in man. Diabetologia. 1985;28:412–9. doi: 10.1007/BF00280883. [DOI] [PubMed] [Google Scholar]
- 11.Miller SA, Dykes DD, Polesky HF. A simple salting out procedure for extracting DNA from human nucleated cells. Nucleic Acids Res. 1988;16(3):1215. doi: 10.1093/nar/16.3.1215. https://doi.org/10.1093/nar/16.3.1215. [DOI] [PMC free article] [PubMed] [Google Scholar]
- 12.Loos RJ, Franks PW, Francis RW, Barroso I, Gribble FM, Savage DB, et al. TCF7L2 polymorphisms modulate proinsulin levels and beta-cell function in a British Europid population. Diabetes. 2007;56(7):1943–7. doi: 10.2337/db07-0055. https://doi.org/10.2337/db07-0055. [DOI] [PMC free article] [PubMed] [Google Scholar]
- 13.Bonetti S, Trombetta M, Malerba G, Boselli L, Trabetti E, Muggeo M, et al. Variants and haplotypes of TCF7L2 are associated with β-cell function in patients with newly diagnosed Type 2 diabetes:The Verona Newly Diagnosed Type 2 Diabetes Study (VNDS) 1. J Clin Endocrinol Metab. 2011;96(2):389–93. doi: 10.1210/jc.2010-1677. https://doi.org/10.1210/jc.2010-1677. [DOI] [PubMed] [Google Scholar]
- 14.Wang S, Song K, Srivastava R, Fathzadeh M, Li N, Mani A, et al. The protective effect of transcription factor 7-like 2 risk allele rs7903146 against elevated fastinzg plasma triglyceride in Type 2 diabetes:A meta-analysis. J Diabetes Res 2015. 2015 doi: 10.1155/2015/468627. 468627. https://doi.org/10.1155/2015/468627. [DOI] [PMC free article] [PubMed] [Google Scholar]
- 15.Go GW, Srivastava R, Hernandez-Ono A, Gang G, Smith SB, Booth CJ, et al. The combined hyperlipidemia caused by impaired Wnt-LRP6 signaling is reversed by Wnt3a rescue. Cell Metab. 2014;19(2):209–20. doi: 10.1016/j.cmet.2013.11.023. https://doi.org/10.1016/j.cmet.2013.11.023. [DOI] [PMC free article] [PubMed] [Google Scholar]
- 16.Fernández-Rhodes L, Howard AG, Graff M, Isasi CR, Highland HM, Young KL, et al. Complex patterns of direct and indirect association between the transcription factor-7 like 2 gene, body mass index and Type 2 diabetes diagnosis in adulthood in the Hispanic community health study/Study of Latinos. BMC Obes. 2018;5:26. doi: 10.1186/s40608-018-0200-x. https://doi.org/10.1186/s40608-018-0200-x. [DOI] [PMC free article] [PubMed] [Google Scholar]
- 17.Pearson ER. Pharmacogenetics and target identification in diabetes. Curr Opin Genet Dev. 2018;50:68–73. doi: 10.1016/j.gde.2018.02.005. https://doi.org/10.1016/j.gde.2018.02.005. [DOI] [PubMed] [Google Scholar]
- 18.Rena G, Hardie DG, Pearson ER. The mechanisms of action of metformin. Diabetologia. 2017;60(9):1577–85. doi: 10.1007/s00125-017-4342-z. https://doi.org/10.1007/s00125-017-4342-z. [DOI] [PMC free article] [PubMed] [Google Scholar]


