

Abstract
Direct electricity production from waste biomass in a microbial fuel cell (MFC) offers the advantage of producing renewable electricity at a high Coulombic efficiency. However, low MFC voltage (below 0.5 V) necessitates the simultaneous operation of multiple MFCs controlled by a power management system (PMS) adapted for operating bioelectrochemical systems with complex nonlinear dynamics. This work describes a novel PMS designed for efficient energy harvesting from multiple MFCs. The PMS includes a switched-capacitor-based converter, which ensures operation of each MFC at its maximum power point (MPP) by regulating the output voltage around half of its open-circuit voltage. The open-circuit voltage of each MFC is estimated online regardless of MFC internal parameter knowledge. The switched-capacitor-based converter is followed by an upconverter, which increases the output voltage to a required level. Advantages of the proposed PMS include online MPP tracking for each MFC and high (up to 85%) power conversion efficiency. Also, the PMS prevents voltage reversal by disconnecting an MFC from the circuit whenever its voltage drops below a predefined threshold. The effectiveness of the proposed PMS is verified through simulations and experimental runs.
1. Introduction
Microbial fuel cells (MFCs) generate electrical energy from organic wastes including wastewater and marine sediments by using electroactive microorganisms.1 The MFC usually consists of anode and cathode compartments separated by a proton exchange membrane, although membraneless and air-breathing cathode configurations are also known.2 The electroactive bacteria at the anode oxidize the organic matter and release electrons, which are then transferred to the cathode through an external electrical load.3 The MFC technology offers a promising solution for both waste treatment and sustainable energy production.4
Due to its low power density and low output voltage, the use of a single MFC is limited in practical applications. At its maximum power point (MPP), the specific power density of an MFC is approximately 0.1–2.0 W m–2 with an open-circuit voltage (OCV) at approximately 0.5–0.6 V.5 These low output power and voltage values make it difficult to directly power most electrical loads using an MFC. For example, a typical Li-ion battery cell requires at least 3.3 V for charging,6 and a wireless sensor usually needs a supply voltage above 3 V to transmit data.7
In order to increase the output power and voltage of MFCs, the surface area of the anode was increased from a few square centimeters in laboratory-scale MFCs to several square meters in benthic8 or tubular MFCs.9 However, this approach only increases MFC current, while output voltage remains low. Furthermore, it is not simple to maintain the power density of large-surface area MFCs.10 Another solution to deal with the low output voltage of MFCs is to connect multiple MFCs in series or in parallel to increase the output voltage or power.11 However, this configuration requires the operation point of all MFCs to be identical so as to prevent the voltage-reversal phenomenon, which may reduce the overall voltage of the MFC stack to nearly a zero.12 Since the optimal operating point of each MFC depends on several external factors such as the pH, the concentration of the organic substrate, and the microbial activity,13 it is difficult to keep all MFCs at an identical operating point. To prevent the voltage reversal problem, a method for connecting multiple MFCs in parallel together with capacitors and relay switches was introduced.14 Although the output voltage increased, the approach could be costly and lead to a relatively low power conversion efficiency due to the use of multiple capacitors and switches.
One of the most promising approaches for MFC utilization for practical applications is through a power management system (PMS). Generally, a PMS includes an electronic circuit made of components such as capacitors, charge pumps, step-up converters, diodes, inductors, power switches, and/or potentiometers. To demonstrate the operation of MFC-powered wireless sensors, Shantaram et al.15 and Donovan et al.16 developed PMSs based on a standard step-up converter (MAX1797 from Maxwell Technologies) and charge pumps. These PMSs, which aim to harvest power from a single MFC, have low power conversion efficiency. In addition, the use of offline maximum power point tracking (MPPT) algorithms is another main drawback of these PMSs. Recently, a number of PMSs with several types of step-up voltage converters have been proposed to manage multiple MFCs in order to increase the output voltage.17−20 This electrical circuit is managed by a control algorithm to harvest the MFCs’ energy and increase the output voltage to an acceptable level. Such a PMS not only reaches a higher voltage level but also maximizes the power harvested from each MFC. A PMS based on parallel connected upconverters and a hysteresis control algorithm to manage multiple MFCs was recently developed.21 The results obtained show that this method can significantly increase the output voltage up to a level usable by common electrical loads while maintaining each MFC at its own maximum power point (MPP). An interesting PMS for controlling multiple MFCs was introduced by Carreon-Bautista et al.22 where each MFC connects to the PMS in a sequence based on a time-interleaving concept. Also, Costilla-Reyes et al.23 developed another time-interleaving PMS to sequentially harvest the energy according to each MFC power level. The output voltage of the PMS is elevated by a standard step-up converter, BQ25505 from Texas Instruments. In this work, the working voltage of each MFC in this PMS was kept above half the OCV value. In another work,24 a real-time electrical reconfiguration of MFCs in a stack halved the time required to charge a capacitor (load) and achieved 35% higher current generation compared to a fixed configuration.
Although the PMS-based approach has been already investigated to connect multiple MFCs, it still poses several challenges including (1) implementation of real-time MPPT for each MFC, (2) high cost, and (3) a relatively low power conversion efficiency.17 In this work, we try to overcome these challenges by introducing an effective PMS where each MFC is connected to its corresponding capacitor through a switch. These switches aim to control the MFCs so that they can operate at their own MPP. In addition, the MPPT is performed according to the estimated value of the OCV of each MFC obtained online based on an equivalent electrical model. Since the OCV is determined regardless of a priori knowledge of the MFC internal parameters, the proposed control algorithm can track efficiently the MPP of each MFC. The proposed PMS also uses an upconverter as a back-end converter to supply higher voltage to a load. This upconverter is modulated optimally to reduce power losses. Compared to the conventional power management system for multiple MFCs, the proposed PMS features several advantages: (1) it requires fewer components such as capacitors and switches; (2) the control scheme ensures the online MPPT for all MFCs; (3) it has a high power conversion efficiency; and (4) it is able to monitor MFC voltage and disconnect MFC whenever the voltage drops, which enables MFC recovery. To verify the effectiveness of the proposed power management system, several model-based simulations and laboratory experiments are carried out using three laboratory-scale MFCs.
2. Results and Discussion
2.1. Laboratory Setup
All experiments were carried out in continuously fed air-cathode MFCs. Three MFCs were constructed, each with a series of polycarbonate plates.25 The anodic chamber of each MFC retained 60 mL of a liquid and had a headspace of 40 mL. The MFCs were equipped with lines for an influent, effluent, and gas exit. The liquid-filled (anodic) chamber housed the anode, which was made of a 5 mm-thick graphite felt measuring 10 cm × 5 cm (Speer Canada, Kitchener, ON, Canada). The air-breathing cathode, also measuring 10 cm × 5 cm, contained manganese oxide as the oxygen-reducing catalyst (Electric Fuel Ltd., Bet Shemesh, Israel). Notably, a manganese oxide cathode is less costly and provides improved long-term MFC performance as compared to a Pt-based cathode.26,27 A detailed description of the experimental setup can be found elsewhere.25 Also, the setup diagram is provided in the Supporting Information (Figure S1).
The MFCs were inoculated with 5 mL of homogenized anaerobic sludge (Rougemont, QC, Canada). A stock solution of carbon source (sodium acetate) was fed using an infusion pump (model PHD 2000, Harvard Apparatus, Canada) at a rate of 2.5–5 mL d–1. One milliliter of a trace-metal stock solution was added to 1 L of the dilution water. The dilution water was fed at a rate of 146 mL d–1 using a peristaltic pump (Cole-Parmer, Chicago, IL, U.S.A.) providing a retention time of 10 h. The stock acetate and dilution water streams were combined before entering the anode compartment resulting in an influent acetate concentration of 500–600 mg L–1.
2.2. Equivalent Electrical Circuit Model
A previously proposed simple equivalent electrical circuit model28 shown in Figure 1A was used for simulating PMS performance. The model considers an electromotive force (open-circuit voltage, VOC). The ohmic losses (solution resistance) are modeled using an internal resistor, R1. In series with R1 is a branch composed of a resistor (R2) representing activation losses and a capacitor C1, which represents the system dynamics.
Figure 1.

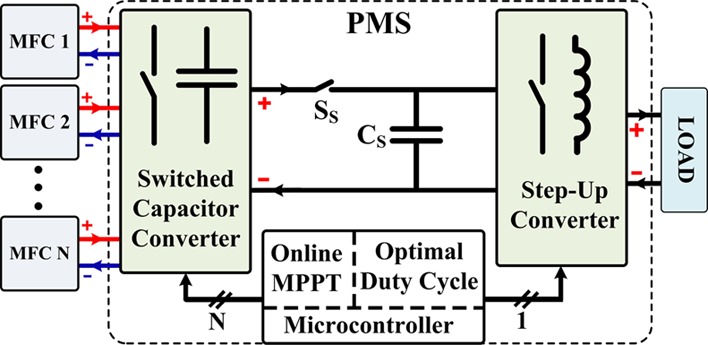
(A) Equivalent circuit model of kth MFC. (B) Proposed power management system for multiple MFCs.
2.3. Power Management System
The PMS developed for simultaneous operation of multiple MFCs is shown in Figure 1B. Each MFC is connected to a capacitor through a single pole single throw (SPST) switch (ADG801, Analog Devices). These capacitors are connected in series so that the voltage of all MFCs can be summed to a higher level. In addition, a step-up converter including an inductor, an SPST switch, and a Schottky diode (DFLS130L, Diodes Incorporated) is used to boost the output voltage of the power converter.
PMS performance simulations were carried out with the SimPowerSystem toolbox from Matlab (Mathworks, Natick, MA, U.S.A.). In these simulations, the sampling time was set to 10 μs and each MFC was modeled by a controllable DC source representing the OCV, a resistor, and a parallel–resistor–capacitor branch as shown in Figure 1A. Internal parameters of this equivalent electrical model are listed in Table 1.
Table 1. Power Management System Parameters.
| devices | parameters and values |
|---|---|
| MFC1 | VOC1 = 450 mV, R11 = 62 Ω, R21 = 51 Ω, C11 = 0.6 F |
| MFC2 | VOC2 = 500 mV, R12 = 75 Ω, R22 = 50 Ω, C12 = 0.7 F |
| MFC3 | VOC3 = 550 mV, R13 = 88 Ω, R23 = 48 Ω, C13 = 0.9 F |
| C1, C2, C3 | C1 = C2 = C3 = 3000 uF, rC1 = rC2 = rC3 = 100 mΩ |
| S1, S2, S3, SS, SB | rS1 = rS2 = rS3 = rSS = rSB = 0.4 Ω |
| CS | CS = 1000 uF, rCS = 300 mΩ |
| L | L = 0.5 mH, rL = 0.6 Ω |
| D | VF = 0.21 V, rD = 0.24 Ω |
| CO | CO = 2000 uF, rc = 150 mΩ |
| load (R) | R = 5 kΩ |
The PMS can track the MPP of MFCs by using two popular approaches. The first one is based on the MFC output power response to a perturbation such as the perturb-and-observe (PO) method29 and extremum-seeking control (ESC) method.30 The second approach consists of maintaining the MFC voltage around a voltage level corresponding to half of the OCV.22,31 Whenever the system includes multiple MFCs, the biggest challenge is in determining online the OCV of each MFC without disconnecting the circuit. In this work, we propose a novel online OCV estimation method to perform MPPT with the second approach. This estimation method will be described in the following section. Also, to evaluate MFC performance, specific power output was calculated using the anode compartment volume (0.06 L) and cathode surface area (0.005 m2).
2.4. Online Maximum Power Point Tracking Algorithm
As shown in Figure 1B, in the PMS, the kth MFC is connected to its corresponding capacitor, CK via a switch Sk. This switch aims to control the capacitor voltage at around half of the kth MFC OCV. When the switch Sk is turned on, the capacitor Ck is charged until its voltage reaches an upper threshold, VUk. The switch Sk is turned off (i.e., Sk(t) = 0) whenever
| 1 |
where
| 2 |
Here, VCk(t) and VOCk(t) are the Ck voltage and the OCV of the kth MFC, respectively, and Δk is the voltage variation level in the capacitor Ck.
Once all capacitors reach their corresponding upper voltage threshold, that is, S1, S2, and SN are all turned off, the switch SS is turned on in order to discharge the capacitors by connecting them to the load by means of regulating the step-up switch SB. The switch Sk is turned on (i.e., Sk(t) = 1) when the voltage of the capacitor Ck reaches the low voltage threshold, VLk, that is, when
| 3 |
where
| 4 |
When the capacitor voltage VCk is within the lower and upper thresholds (i.e., VLk(t) < VCk(t) < VUk(t)), the switch state is maintained at its previous value:
| 5 |
with TS being the sampling time.
In order to discharge the capacitor Ck properly, the switch SS is turned on only when all switches (Sk) are turned off:
| 6 |
Whenever any switch Sk is turned on, the switch SS should be turned off in order to allow the capacitor Ck to be charged:
| 7 |
The output voltage, VO, is elevated by modulating the switch SB with an optimal duty cycle D while the switch SS is turned on:
| 8 |
| 9 |
The summary of the control flow chart for the proposed PMS is shown in Figure 2. The control flow aims to manage a total of N MFCs. At every sampling time t, the switching state of Sk is determined based on the voltage of capacitor Ck. When all switches Sk are off (Sk = 0), we turn on SS and modulate SB to discharge capacitors Ck to the load.
Figure 2.
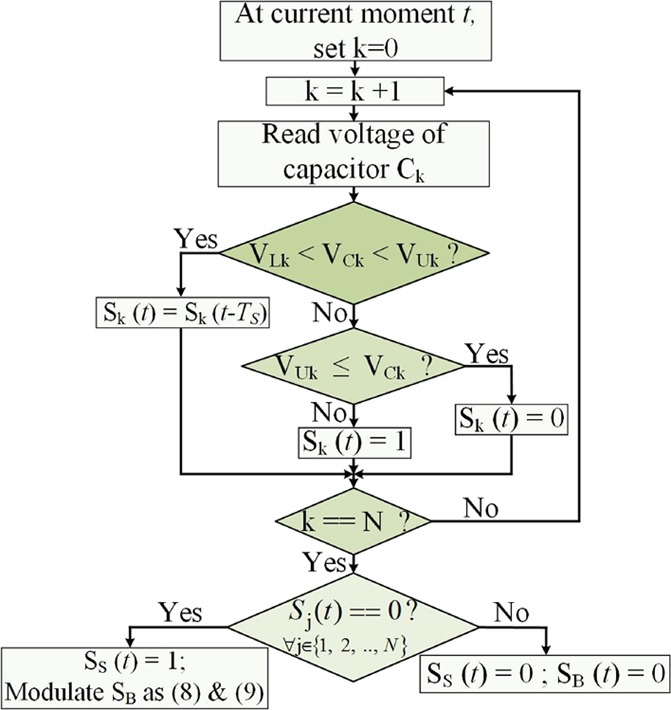
Flow chart of the control logic used at each sampling time in the proposed PMS.
The output voltage of the system depends on the duty cycle of the step-up converter. In Figure 3A, an equivalent circuit of the step-up converter with the parasitic resistances and the diode forward voltage, VF, is shown where rS is the switch on-resistance, rD is the diode forward resistance, rL is the equivalent series resistance (ESR) of the inductor, rC is the ESR of the output capacitor, and R is the load. These components are introduced to represent the power losses affecting the converter efficiency and the voltage boost ratio. These power losses are due to the power dissipation through the parasitic resistances of the switch, PS, the diode, PD, the inductor, PL, and the capacitor, PC. Thus, the total power losses, PT, in the converter is represented by:
| 10 |
where D is the duty cycle of the switch SB and PO is the output power of the converter. From eq 10, the converter efficiency is derived to be
| 11 |
Figure 3.

(A) Equivalent circuit of the step-up converter with parasitic parameters. (B) Efficiency and boost voltage ratio of the converter.
The boost voltage ratio of the converter is defined as follows:
| 12 |
As shown in eqs 11 and 12, both the converter efficiency and the boost voltage ratio depend on the duty cycle D. Figure 3B shows the efficiency curve and the voltage boost ratio with respect to the duty cycle. These curves have been obtained using similar converter parameters as those used in our experimental setup (see Table 1) and VO = 3.0 V. It can be seen that an increase of the duty cycle may lead to an increase of the voltage boost ratio whereas it leads to a decrease of the efficiency. Therefore, a tradeoff must be found between the desired boost ratio and the efficiency while choosing the duty cycle. We aim at maintaining the converter efficiency higher than 90%, and consequently, the duty cycle was set around 80%, leading to a voltage boost ratio between 4 and 5.
2.5. Online Estimation of MFC Open-Circuit Voltage
The most important challenge in maintaining the MFC operation point around half its OCV value is to determine this value despite its variation and without disconnecting the circuit. Based on the equivalent electrical model of the MFC shown in Figure 1A, we introduce the following OCV estimation approach. Considering the kth MFC of the total N MFCs shown in Figure 1B, its external voltage, VMk, is expressed as follows (when switch Sk is turned off):
| 13 |
where τ = R2kC1k and VIk is the voltage across the internal capacitor C1k when switch Sk is turned off. According to eq 13, the OCV can be determined by measuring three values of VMk at three different moments during the discharge of C1k so that
| 14 |
| 15 |
| 16 |
In eqs 14–16, the OCV is assumed to be constant between t1 and t3. This assumption is reasonable if the period is smaller than the time constant τ. To estimate the OCV, the first measurement is conducted at the time when the switch is turned off, considering this moment to be a time reference, t1 = 0. Subsequently, the second and third measurements are performed at t2 = λ and t3 = 2λ. This yields the following equations:
| 17 |
| 18 |
| 19 |
From eqs 17–19, the OCV can be expressed as follows:
| 20 |
Thus, based on eq 20, the OCV can be determined by measuring the MFC voltage at three different moments when the switch is turned off. As a result, the proposed OCV estimation approach provides a practical solution since it is performed in real time and does not require identifying the MFC internal resistance and capacitance.
2.6. Determination of PMS Parameters
The capacitor, Ck, plays a crucial role in the PMS. As shown in Figure 1B, the capacitor stores the MFC power when the switch, Sk, is turned on and discharges it when the switches Sk and SS are turned off and on, respectively. As a result, each capacitor is able to be separately charged by the corresponding MFC and to feed the step-up converter by connecting in series to other capacitors. This concept enables each MFC to operate independently whereas their voltages are summed during discharge to help the step-up converter reach a higher voltage output level. Since the charge and discharge time intervals depend on the value of each capacitance, Ck, the choice of this capacitance is critical.
Considering that (i) the voltage drop across C1k is constant during the charge of Ck (i.e., when Sk is turned on) and (ii) rCk ≪ R1k + R2k + rsk with rCk and rsk being the parasitic resistances in the capacitance Ck and in the switch Sk, respectively, the voltage of Ck is
| 21 |
where tc is the time at which the switch Sk is turned on and Rk is the total resistance including the MFC internal resistors and the switch on-resistor, that is
| 22 |
The capacitor is charged until the moment td when its voltage reaches the upper threshold VUk. According to eq 21, the capacitor voltage at td is
| 23 |
where Δt = td – tc. From eq 23, the capacitance can be calculated using the following equation:
| 24 |
Hence, the capacitor voltage levels at t = tc and t = td are, respectively
| 25 |
and
| 26 |
By substituting eqs 25 and 26 into eq 24, the capacitance Ck can be chosen based on the desired values of Δt and Δk:
| 27 |
Note that, during their discharge, all the capacitors (Ck) are connected in series. Thus, in order to make sure that all capacitors reach their lower voltage thresholds at the same moment, the following relationship should be satisfied:
| 28 |
As a result, if Δ1 is set at a fixed value, the other voltage offsets should be calculated as follows:
| 29 |
According to the OCVs, the voltage variation level Δk will be updated timely based on eq 29. For a given capacitance of capacitor Ck, the power conversion efficiency of the developed PMS is maximized when all MFCs are identical. However, when the MFCs are different, the power conversion efficiency of the PMS will be lower. The reason behind the decreased power conversion efficiency is that the strongest MFCs must wait for the weakest MFC to charge its respective external capacitor. Thus, to show the performance of our developed PMS, the worst scenario (i.e., the MFCs are different) was selected to test the system.
2.7. PMS Performance Simulation
PMS performance simulations were carried out using the MFC equivalent electrical model shown in Figure 1A with internal model parameters described in Table 1. With these parameters, the maximum power of MFCs 1, 2, and 3 was 0.45, 0.50, and 0.55 mW, respectively. Thus, the total maximum power of all MFCs was 1.5 mW.
Figure 4 shows the simulation results obtained by first setting Δ2 = 5%. Using eq 29,Δ1 = 5.56% and Δ3 = 4.55% were calculated. The voltage of MFC1 and capacitor C1 is shown in Figure 4A, whereas the switching pattern of S1 is shown in the Supporting Information (Figure S2A).
Figure 4.

Simulation results of the proposed system. (A) Voltage of MFC1 and capacitor C1. (B) Voltage of electrical load and CS.
It can be seen that the OCV is well estimated using the proposed estimation method. As a result, the voltage of capacitor C1 is perfectly controlled at an operating point around half of the OCV level. While the switch S1 is being turned on, the MFC1 charges the capacitor C1, which makes the MFC1 external voltage (i.e., VM1) coincide with the capacitor C1 voltage as shown in Figure 4A. The charging process is completed once the capacitor C1 voltage reaches the upper threshold, and the switch S1 is turned off. While the switch S1 is being turned off, the MFC1 recovers and its external voltage increases again. The same behavior is observed for MFC2 and MFC3. When switches S1, S2, and S3 are all turned off, the switch SS is turned on in order to discharge the MFCs’ power stored in capacitors C1, C2, and C3 to the electrical load (Supporting Information, Figure S2B). By modulating the switch of the step-up converter at a duty cycle of 80%, the load voltage is elevated to 2.55 V, whereas the input voltage of the step-up converter (i.e., VS) is approximately 0.6 V (Figure 4B). As a result, the output power of the system is maintained at 1.3 mW (0.26 W m–2 or 0.022 W L–1 based on the cathode surface area and the anode compartment volume, respectively). Therefore, the overall system efficiency, which is defined by the ratio of the load power over the system maximum power (i.e., 1.5 mW), is 86.7%. Moreover, the voltage boost ratio of the overall system
| 30 |
is evaluated to be 3.4.
In order to examine the dynamic response
of the proposed system,
in the following simulation, the OCV of each MFC was changed. The
results are shown in Figure 5. For t < 50 s, the OCVs of MFC1, MFC2,
and MFC3 were fixed at 450, 500, and 550 mV, respectively. For 50
s < t < 60 s, the OCVs of MFCs 1, 2, and 3
were increased to 550, 600, and 650 mV, respectively, prior to being
set back (at t = 60 s) to their initial levels. A
higher OCV value implies lower activation losses.32 In the electrical equivalent circuit model, mass transfer
and ohmic and activation losses are described as internal resistances
R1 and R2. Since C1k ≫ Ck, the current going through
C1k is negligible. Based on the first-order
optimality condition ( where PMFC is
the MFC output power) for a given OCV value, it can be shown that
the maximal power is extracted when the output voltage is controlled
at around half of its open-circuit voltage.22,31 The MPP algorithm constantly re-evaluates the OCV and ensures optimal
operation of each MFC. In the simulation shown in Figure 5A, the OCVs’ increase
led to an increase of the total maximum power of MFCs from 1.5 to
1.85 mW (0.37 W m–2). Note that the losses may also
affect the OCV. However, the online procedure for OCV estimation ensured
the online tracking of the maximal power point.
where PMFC is
the MFC output power) for a given OCV value, it can be shown that
the maximal power is extracted when the output voltage is controlled
at around half of its open-circuit voltage.22,31 The MPP algorithm constantly re-evaluates the OCV and ensures optimal
operation of each MFC. In the simulation shown in Figure 5A, the OCVs’ increase
led to an increase of the total maximum power of MFCs from 1.5 to
1.85 mW (0.37 W m–2). Note that the losses may also
affect the OCV. However, the online procedure for OCV estimation ensured
the online tracking of the maximal power point.
Figure 5.
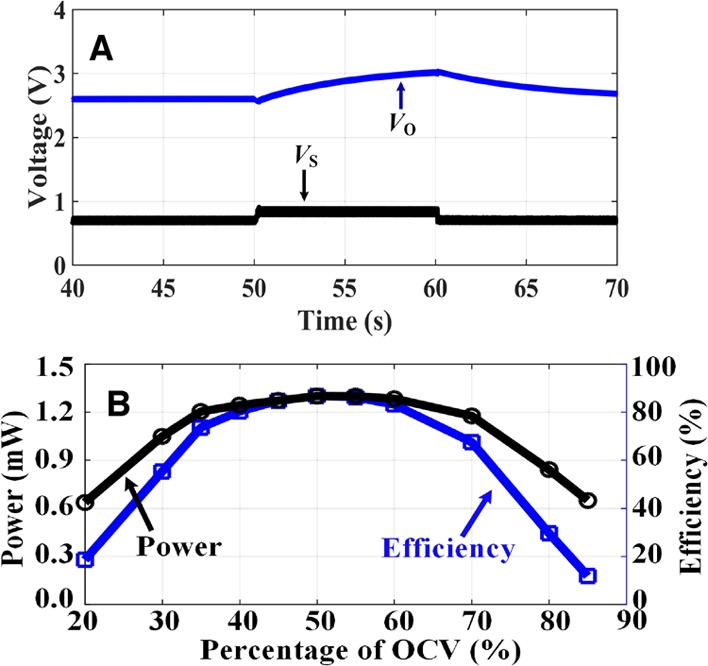
Simulation results showing dynamic performance of (A) the proposed PMS system and (B) power output and overall system efficiency as a function of the voltage setpoint expressed as OCV percentage.
From Figure 5A, it can be seen that when the values of OCVs are changed, the proposed algorithm is able to estimate the new values. Although there is a significant error at the time when the OCV is changed, the error lasts for only three sampling times (30 μs). This approach to OCV estimation results in an appropriate control of each capacitor voltage according to the actual OCV of the MFC to which it is connected. Therefore, the load voltage is increased from 2.55 to 2.95 V when the OCVs are increased and then decreased from 2.95 to 2.55 V when the OCVs are decreased. Dynamics of MFC voltages is shown in the Supporting Information (Figure S3). These output voltage levels result in the high overall system efficiency.
In another simulation, to demonstrate MPPT performance, we controlled the system at several operating points, which varied from 20 to 85% of the OCV level. The overall power output and efficiency of the system as a function of OCV percentage at which the MFC voltage is maintained are plotted in Figure 5B. As expected, the power output is maximized when the MFC external voltage is maintained at 50% its OCV. Here, the overall system efficiency was calculated by dividing the power by the total MFCs’ maximum power (i.e., 1.5 mW).
3. Experimental Section
3.1. Validation of the Proposed Approach
The experimental setup used for validation consisted of three MFCs continuously fed with acetate solution as a source of organic carbon. The PMS is controlled using an ultralow power microcontroller (MSP430F5529, Texas Instruments), and its parameters are set to the same values as the ones used for the simulation (Table 1). A data acquisition board (Labjack, model U3-LV) is used to collect the MFCs and load voltage information. In order to verify the efficiency of the proposed PMS to track the MPP prior to PMS testing, the power curve of each MFC was obtained by connecting each MFC to a potentiometer and changing resistance from 50 Ω to 5 kΩ. The resulting power curves are shown in Figure 6. It can be seen that the MPPs of MFC1, MFC2, and MFC3 are 0.4, 0.5, and 0.6 mW, leading to a maximum power of 1.5 mW for the whole system, whereas the OCVs of MFC1, -2, and -3 are 512, 540, and 430 mV, respectively. The OCVs and MPPs of each MFC are different from each other since each MFC has unique electrical characteristics due to its biological nature. As mentioned previously, these differences were decreasing the overall conversion efficiency of the PMS. At the same time, the test demonstrated the PMS capacity to track the unique MPP of each MFC.
Figure 6.
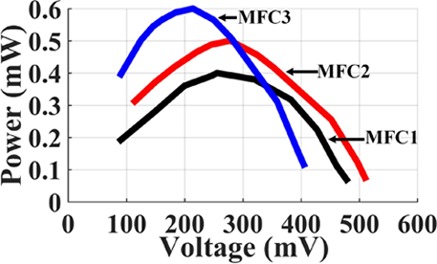
Experimentally measured power curves of the three MFCs used in experiment.
From the experimental results of PMS testing shown in Figure 7, we can see that the voltage of capacitors C1, C2, and C3 is controlled at around half of the corresponding OCVs, as expected. When switches S1, S2, and S3 are turned on, the capacitors C1, C2, and C3 are charged and their voltages are equal to their corresponding MFC voltages as shown in Figure 7A–C. Whenever the voltage of one capacitor reaches the upper threshold, the respective switch is turned off and the capacitor voltage is kept constant until the switch SS is turned on. The capacitors are discharged once the switch SS is turned on, which enables the step-up converter to elevate the load voltage. It can be seen from Figure 7D that the load voltage is maintained at 2.55 V, whereas the input voltage of the step-up converter varies at approximately 0.6 V. With this voltage and a 5 kΩ load, the output power is 1.3 mW, as compared with a maximum total power output of 1.5 mW calculated based on the power curves shown in Figure 6. Therefore, the overall system efficiency is evaluated at 86.6%, almost the same as the one observed during simulations since the model parameters were chosen in agreement with experimentally measured total internal resistance and OCV values of the three laboratory MFCs. It can be hypothesized that the high upconversion efficiency and the near-optimal mode of operation of each MFC might also improve the Coulombic efficiency of carbon source transformation to electricity. Indeed, previous research showed significant improvements in the observed Coulombic efficiency of an MFC operated under optimal conditions.32 Long-term operation of the proposed PMS with multiple MFCs is required to confirm this hypothesis.
Figure 7.
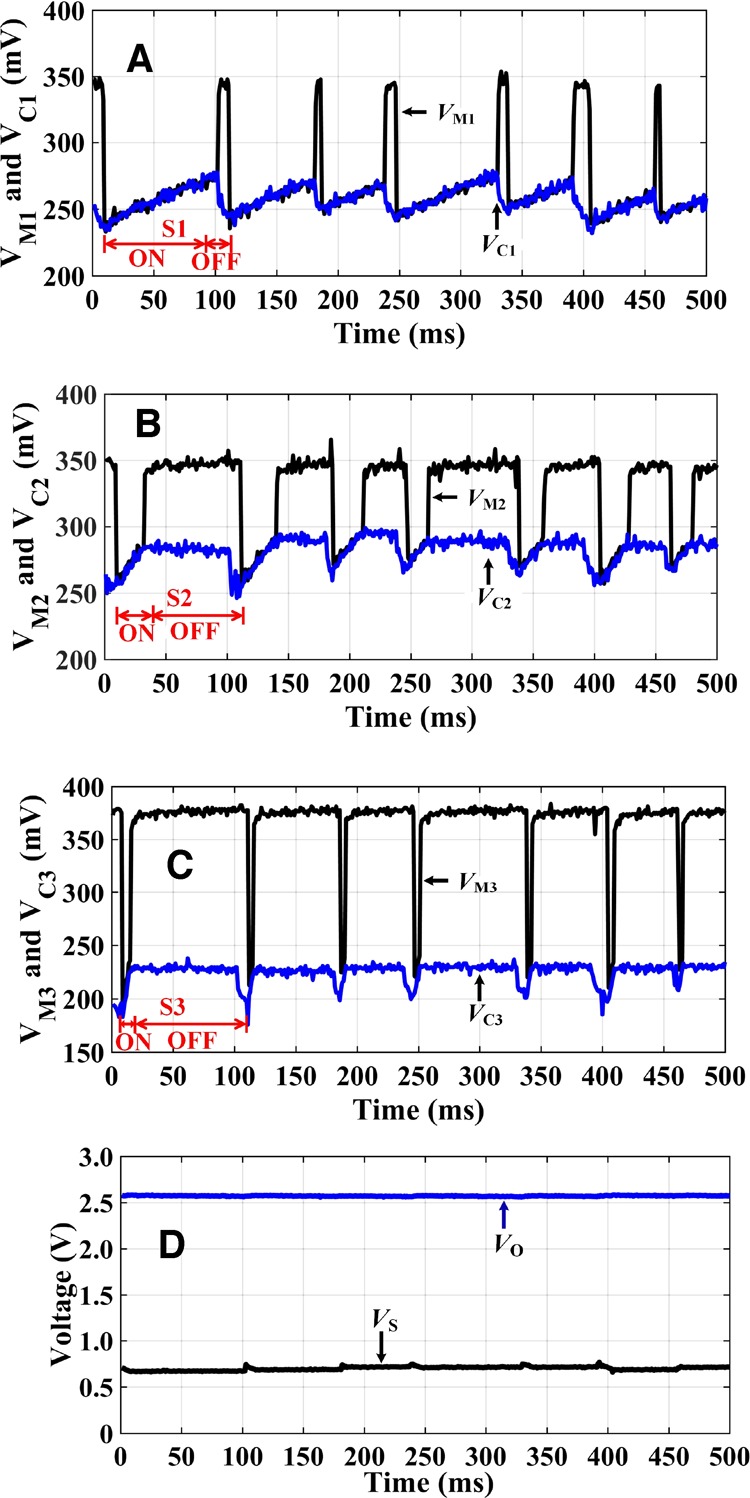
Experimental results showing the (A) voltage response of MFC1 and C1, (B) voltage response of MFC2 and C2, (C) voltage response of MFC3 and C3, and (D) voltage response measured at the load and CS.
3.2. Comparison with Published PMS Designs and Sustainability Analysis
In order to highlight the advanced features of the proposed PMS, a comparison with other published PMSs is provided in Table 2. This comparison is based on systems with N MFCs. In terms of the online optimization capabilities, the proposed PMS along with the PMSs presented in14,21−23 are able to track in real-time the MPP of each MFC. The most important feature of the PMS is the power conversion efficiency. As explained in Section 2.5, the proposed PMS has an efficiency of 86.6%.
Table 2. Comparison of Proposed and Conventional Power Management Systemsa.
| reference | (7) | (11) | (14) | (21) | (22) | (23) | this work |
| online optimization | no | no | yes | no | yes | yes | yes |
| efficiency (%) | 72.0 | 62.5 | 67.0 | 45.2 | 46.0 | 50.7 | 86.6 |
| number of capacitors and supercapacitors required | 2N | N | 2N | N + 1 | 12 | 2 | N + 2 |
| number of inductors required | N | 1 | 0 | N + 1 | 0 | 1 | 1 |
| number of switches required | N + 1 | N + 1 | 4N | 2N + 1 | 2N + 40 | 2N + 2 | N + 2 |
| number of diodes required | 1 | 1 | 0 | N + 1 | 0 | 1 | 1 |
N denotes the number of MFCs.
In a multiMFC system, the PMS should provide a maintenance feature enabling each MFC to disconnect from the overall system for a while without shutting down the overall system. This requirement is reasonable to enable MFC recovery or maintenance. This feature can be provided by simply adding an additional switch in parallel with each MFC capacitor (Ck), which turns on when the MFC needs to be disconnected from the system. Here, the capacitor would be bypassed enabling the overall system to work normally without being affected by the disconnected MFC.
The PMS efficiency can be further improved by optimizing the number of MFCs connected to the upconverter during each cycle. By bypassing one or more slow-charging MFCs in one cycle and reconnecting these MFCs in the next cycle, the cycle duration can be reduced, although the PMS efficiency can be reduced if some MFCs are bypassed. An online optimization algorithm can be developed to find a compromise between the cycle duration and the PMS efficiency.
An important feature for real MFC applications is the self-sustainability of the system in terms of electrical power. In other words, it means that the PMS should be able to manage the MFC system without requiring any additional external power source. In order to meet this requirement, the power consumption of the PMS should be much smaller than the total power generated by MFCs. Owing to its ease of configuration, the digital-based PMS has been usually used to manage MFC power where online MPPT algorithms could be implemented more easily compared with the analog-based ones.33 In order to minimize the power consumed by PMSs, extreme low-power (LP) microcontrollers are preferable. Table S1 in the Supporting Information lists the most popular extreme LP microcontrollers on the market. There are four big manufacturers in the microcontroller chip segment including STMicroelectronics, Texas Instruments, Microchip, and Analog Devices. The power consumption of these extreme LP microcontrollers is of the order of a few milliwatts. For example, MSP430-Mixed Signal from Texas Instruments requires a minimal power of 7.3 mW in its active mode (at a frequency of 14 MHz). In addition, the minimum supply voltage of microcontrollers is usually higher than 1.6 V, which shows the necessity of using a step-up converter to boost the voltage of MFCs to an adequate level for microcontroller use. However, popular step-up converters used in MFC applications (such as BQ25504 and LTC3105) have a conversion efficiency of approximately 60%. Therefore, MFCs must generate 12.2 mW to power a PMS using a MSP430-Mixed Signal microcontroller. For real applications, it is desirable that the power consumption of PMSs be less than 10% of the total power generated by the MFCs. In other words, MFCs should provide at least 122 mW for real applications. Previous studies have demonstrated that the power density of MFCs can reach up to 70 mW L–1.34,35 Consequently, an MFC with an anodic compartment volume of 1.75 L could attain the required power level of 122 mW.
4. Conclusions
This work presents a high-efficiency PMS for operation of multiple MFCs. Each MFC is connected to a capacitor through a switch that controls the operating point of this MFC at its respective MPP. In addition, the MPPT is performed using an online estimation of the OCV based on the MFC equivalent electrical circuit model. Since the OCV is estimated without identifying the MFC internal parameters, the proposed control algorithm can track effectively the MPP of each MFC. In order to elevate the output voltage, the proposed PMS uses a step-up converter to supply a higher voltage to a load. This upconverter is modulated optimally to reduce power loss. Compared to conventional PMSs for multiple MFCs, the proposed PMS shows several advanced features. The control scheme ensures the online MPPT for all MFCs and provides high power conversion efficiency of up to 86.6%. In addition, the proposed PMS could be easily enhanced by including additional switches to enable MFC maintenance. The effectiveness of the proposed power management system was verified through several simulations and experiments using three MFCs. In order to improve the efficiency of the proposed PMS, future work needs to focus on bypassing slow-charging MFCs and developing an online algorithm for optimizing the number of MFCs participating in each cycle.
Acknowledgments
The authors want to thank the National Research Council of Canada for its financial support through the New Beginnings Initiative – Ideation Fund program.
Supporting Information Available
The Supporting Information is available free of charge on the ACS Publications website at DOI: 10.1021/acsomega.9b01854.
Figure S1, laboratory setup; Figure S2, simulation results of the proposed power management system showing the switching state of S1 and switching state of SS; Figure S3, the voltage response of MFC1 and C1, MFC2 and C2, and MFC3 and C3; and Table S1, popular extreme low-power microcontroller series (PDF)
The authors declare no competing financial interest.
Supplementary Material
References
- Allen R. M.; Bennetto H. P. Microbial fuel-cells. Appl. Biochem. Biotechnol. 1993, 39, 27–40. 10.1007/BF02918975. [DOI] [Google Scholar]
- Yoshimura Y.; Nakashima K.; Kato M.; Inoue K.; Okazaki F.; Soyama H.; Kawasaki S. Electricity generation from rice bran by a microbial fuel cell and the influence of hydrodynamic cavitation pretreatment. ACS Omega 2018, 3, 15267–15271. 10.1021/acsomega.8b02077. [DOI] [PMC free article] [PubMed] [Google Scholar]
- Yang Y.; Liu T.; Tao K.; Chang H. Generating electricity on chips: Microfluidic bio-fuel cells in perspective. Ind. Eng. Chem. Res. 2018, 57, 2746–2758. 10.1021/acs.iecr.8b00037. [DOI] [Google Scholar]
- Meehan A.; Gao H.; Lewandowski Z. Energy harvesting with microbial fuel cell and power management system. IEEE Trans. Power Electron. 2011, 26, 176–181. 10.1109/TPEL.2010.2054114. [DOI] [Google Scholar]
- Erbay C.; Carreon-Bautista S.; Sanchez-Sinencio E.; Han A. High performance monolithic power management system with dynamic maximum power point tracking for microbial fuel cells. Environ. Sci. Technol. 2014, 48, 13992–13999. 10.1021/es501426j. [DOI] [PubMed] [Google Scholar]
- Walter X. A.; Stinchcombe A.; Greenman J.; Ieropoulos I. Urine transduction to usable energy: A modular MFC approach for smartphone and remote system charging. Appl. Energy 2017, 192, 575–581. 10.1016/j.apenergy.2016.06.006. [DOI] [Google Scholar]
- Khaled F.; Ondel O.; Allard B. Microbial fuel cells as power supply of a low-power temperature sensor. J. Power Sources 2016, 306, 354–360. 10.1016/j.jpowsour.2015.12.040. [DOI] [Google Scholar]
- Hsu L.; Hsu L.; Chadwick B.; Kagan J.; Thacher R.; Wotawa-Bergen A.; Richter K. Scale up considerations for sediment microbial fuel cells. RSC Adv. 2013, 3, 15947–15954. 10.1039/c3ra43180k. [DOI] [Google Scholar]
- Logan B. E. Scaling up microbial fuel cells and other bioelectrochemical systems. Appl. Microbiol. Biotechnol. 2010, 85, 1665–1671. 10.1007/s00253-009-2378-9. [DOI] [PubMed] [Google Scholar]
- Logan B. E.; Wallack M. J.; Kim K.-Y.; He W.; Feng Y.; Saikaly P. E. Assessment of microbial fuel cell configurations and power densities. Environ. Sci. Technol. Lett. 2015, 2, 206–214. 10.1021/acs.estlett.5b00180. [DOI] [Google Scholar]
- Khaled F.; Ondel O.; Allard B. Optimal energy harvesting from serially connected microbial fuel cells. IEEE Trans. Ind. Electron. 2015, 62, 3508–3515. 10.1109/TIE.2014.2371437. [DOI] [Google Scholar]
- Oh S. E.; Logan B. E. Voltage reversal during microbial fuel cell stack operation. J. Power Sources 2007, 167, 11–17. 10.1016/j.jpowsour.2007.02.016. [DOI] [Google Scholar]
- Khudzari J. M.; Tartakovsky B.; Raghavan G. S. V. Effect of C/N ratio and salinity on power generation in compost microbial fuel cells. Waste Manage. 2016, 48, 135–142. 10.1016/j.wasman.2015.11.022. [DOI] [PubMed] [Google Scholar]
- Kim Y.; Hatzell M. C.; Hutchinson A. J.; Logan B. E. Capturing power at higher voltages from arrays of microbial fuel cells without voltage reversal. Energy Environ. Sci. 2011, 4, 4662–4667. 10.1039/c1ee02451e. [DOI] [Google Scholar]
- Shantaram A.; Beyenal H.; Raajan R.; Veluchamy A.; Lewandowski Z. Wireless sensors powered by microbial fuel cells. Environ. Sci. Technol. 2005, 39, 5037–5042. 10.1021/es0480668. [DOI] [PubMed] [Google Scholar]
- Donovan C.; Dewan A.; Heo D.; Beyenal H. Batteryless, wireless sensor powered by a sediment microbial fuel cell. Environ. Sci. Technol. 2008, 42, 8591–8596. 10.1021/es801763g. [DOI] [PubMed] [Google Scholar]
- Wang H.; Park J. D.; Ren Z. J. Practical energy harvesting for microbial fuel cells: a review. Environ. Sci. Technol. 2015, 49, 3267–3277. 10.1021/es5047765. [DOI] [PubMed] [Google Scholar]
- Alaraj M.; Ren Z. J.; Park J. D. Microbial fuel cell energy harvesting using synchronous flyback converter. J. Power Sources 2014, 247, 636–642. 10.1016/j.jpowsour.2013.09.017. [DOI] [Google Scholar]
- Tang N.; Hong W.; Ewing T.; Beyenal H.; Kim J.; Heo D. A self-sustainable power management system for reliable power scaling up of sediment microbial fuel cells. IEEE Trans. Power Electron. 2015, 30, 4626–4632. 10.1109/TPEL.2015.2397931. [DOI] [Google Scholar]
- Dewan A.; Ay S. U.; Karim M. N.; Beyenal H. Alternative power sources for remote sensors: A review. J. Power Sources 2014, 245, 129–143. 10.1016/j.jpowsour.2013.06.081. [DOI] [Google Scholar]
- Park J. D.; Ren Z. Hysteresis-controller-based energy harvesting scheme for microbial fuel cells with parallel operation capability. IEEE Trans. Energy Convers. 2012, 27, 715–724. 10.1109/TEC.2012.2196044. [DOI] [Google Scholar]
- Carreon-Bautista S.; Erbay C.; Han A.; Sánchez-Sinencio E. An inductorless DC-DC converter for an energy aware power management unit aimed at microbial fuel cell arrays. IEEE J. Emerging Sel. Top. Power Electron. 2015, 3, 1109–1121. 10.1109/JESTPE.2015.2398851. [DOI] [Google Scholar]
- Costilla-Reyes A.; Erbay C.; Carreon-Bautista S.; Han A.; Sánchez-Sinencio E. A time-interleave-based power management system with maximum power extraction and health protection algorithm for multiple microbial fuel cells for internet of things smart nodes. Appl. Sci. 2018, 8, 2404–2420. 10.3390/app8122404. [DOI] [Google Scholar]
- Papaharalabos G.; Greenman J.; Stinchcombe A.; Horsfield I.; Melhuish C.; Ieropoulos I. Dynamic electrical reconfiguration for improved capacitor charging in microbial fuel cell stacks. J. Power Sources 2014, 272, 34–38. 10.1016/j.jpowsour.2014.07.187. [DOI] [Google Scholar]
- Coronado J.; Perrier M.; Tartakovsky B. Pulse-width modulated external resistance increases the microbial fuel cell power output. Bioresour. Technol. 2013, 147, 65–70. 10.1016/j.biortech.2013.08.005. [DOI] [PubMed] [Google Scholar]
- Li X.; Hu B.; Suib S.; Lei Y.; Li B. Manganese dioxide as a new cathode catalyst in microbial fuel cells. J. Power Sources 2010, 195, 2586–2591. 10.1016/j.jpowsour.2009.10.084. [DOI] [Google Scholar]
- Martin E.; Tartakovsky B.; Savadogo O. Cathode materials evaluation in microbial fuel cells: A comparison of carbon, Mn2O3, Fe2O3 and platinum materials. Electrochim. Acta 2011, 58, 58–66. 10.1016/j.electacta.2011.08.078. [DOI] [Google Scholar]
- Coronado J.; Tartakovsky B.; Perrier M. On-line monitoring of microbial fuel cells operated with pulse-width modulated electrical load. J. Process Control 2015, 35, 59–64. 10.1016/j.jprocont.2015.08.004. [DOI] [Google Scholar]
- Song Y. E.; Boghani H. C.; Kim H. S.; Kim B. G.; Lee T.; Jeon B.-H.; Premier G. C.; Kim J. R. Maximum power point tracking to increase the power production and treatment efficiency of a continuously operated flat-plate microbial fuel cell. Energy Technol. 2016, 4, 1427–1434. 10.1002/ente.201600191. [DOI] [Google Scholar]
- Kebir A.; Akhrif O.; Woodward L.. Extremum-seeking control of a microbial fuel cell power using adaptive excitation. In IECON 2016-42nd Annual Conference of the IEEE Industrial Electronics Society; IEEE: 2016, 42, 4127–4132.
- Carreon-Bautista S.; Erbay C.; Han A.; Sánchez-Sinencio E. Power management system with integrated maximum power extraction algorithm for microbial fuel cells. IEEE Trans. Energy Convers. 2015, 30, 262–272. 10.1109/TEC.2014.2352654. [DOI] [Google Scholar]
- Badea S. L.; Enache S.; Tamaian R.; Niculescu V. C.; Varlam M.; Pirvu C. V. Enhanced open-circuit voltage and power for two types of microbial fuel cells in batch experiments using Saccharomyces cerevisiae as biocatalyst. J. Appl. Electrochem. 2019, 49, 17–26. 10.1007/s10800-018-1254-7. [DOI] [Google Scholar]
- Boghani H. C.; Dinsdale R. M.; Guwy A. J.; Premier G. C. Sampled-time control of a microbial fuel cell stack. J. Power Sources 2017, 356, 338–347. 10.1016/j.jpowsour.2017.03.118. [DOI] [Google Scholar]
- Woodward L.; Perrier M.; Srinivasan B.; Pinto R. P.; Tartakovsky B. Comparison of real-time methods for maximizing power output in microbial fuel cells. AIChE J. 2010, 56, 2742–2750. 10.1002/aic.12157. [DOI] [Google Scholar]
- Pinto R. P.; Srinivasan B.; Guiot S. R.; Tartakovsky B. The effect of real-time external resistance optimization on microbial fuel cell performance. Water Res. 2011, 45, 1571–1578. 10.1016/j.watres.2010.11.033. [DOI] [PubMed] [Google Scholar]
Associated Data
This section collects any data citations, data availability statements, or supplementary materials included in this article.