Abstract
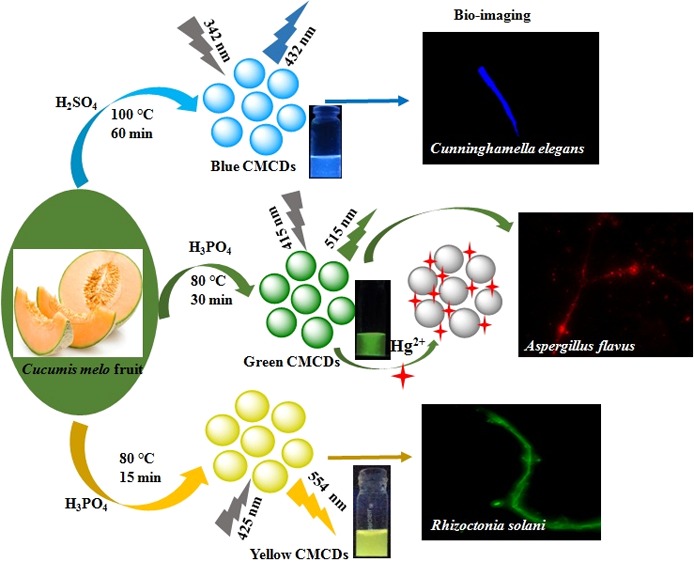
In this study, water-soluble emissive carbon dots (CDs) are effectively fabricated with specific optical properties and colors by acid oxidation of muskmelon (Cucumis melo) fruit, which are termed as C. melo CDs (CMCDs). The fluorescence properties of CMCDs were tuned by controlling the experimental conditions that allow them to emit different colors, that is, blue (B-), green (G-), and yellow (Y-) CMCDs, with different emission wavelengths at 432, 515, and 554 nm when excited at 342, 415, and 425 nm, respectively. The fabricated multicolor-emissive CDs were confirmed by various analytical techniques. The sizes of B-, G-, and Y-CMCDs were found to be ∼3.5, ∼4.3, and ∼5.8 nm, respectively. The as-prepared CMCDs display stable emissions with quantum yields of 7.07, 26.9, and 14.3% for the three CMCDs, which could act as a promising probe for the selective detection of Hg2+ ions. Upon the addition of Hg2+ ions, the fluorescence intensity of G-CMCDs at 515 nm was quenched largely than that of B- and Y-CMCDs. The spectroscopic results display that the G-CMCDs acted as a sensor for the detection of Hg2+ ions with a wide linear range from 1.0 to 25 μM (R2 = 0.9855) with a detection limit of 0.33 μM. This method was successfully applied to detect Hg2+ ions in biological and water samples. The fabricated multicolor-emissive CMCDs possess the cell (Cunninghamella elegans, Aspergillus flavus, and Rhizoctonia solani) imaging property, suggesting the biocompatible nature for multicolor imaging of various cells.
1. Introduction
In order to meet environmental regulations and to reduce toxic chemicals, various kinds of new nanomaterials [semiconductor quantum dots, noble metal nanoclusters, and carbon dots (CDs)] have been integrated with analytical techniques for the recognition of trace-level target analytes.1 Importantly, ultrasize CDs have been recognized as a specific class of biocompatible materials with remarkable applications in multidisciplinary research area because of their unique properties such as high dispersibility in aqueous media, nontoxicity, outstanding photostability, low cost, biocompatibility, easy synthesis, and different emission colors.2−4 Further, this new class of CDs exhibited excellent optical and physicochemical properties (strong and tunable emission, high quantum yield (QY), and multifunctional groups on the surface) as compared to semiconductor quantum dots and metal nanoclusters using them as potential candidates in chemical and biosensing, biomedical, cell imaging, and catalytic applications.5−9
Usually, various molecules and materials (biomolecules, organic, natural sources, and waste materials) have been used as precursors for the preparation of fluorescent CDs with improved QY.10−13 To derive CDs, several carbonization approaches such as microwave synthesis,10 electrochemical oxidation,14 arc discharge,15 hydrothermal approach,4 combustion/thermal approach, pyrolysis,16 and laser ablation17 have been used for the synthesis of a unique class of fluorescent CDs and their uses in optical sensing and bioimaging. Among these, the chemical oxidation of natural sources by using alkali and acid has shown a significant impact in producing CDs with multicolor-emissive CDs without addition of additional reagent.18 To obtain novel ultrasmall carbon nanoparticles, the use of a new green material as a precursor may have an impact on the development of nanoanalytical science.
Furthermore, a great deal of research has been focused on the fabrication of ultrasize fluorescent CDs using various natural resources or cheap materials as precursors such as Solanum lycopersicum,12 pasteurized milk,19 papaya juice,20 potato,21 dried shrimp,22 apple juice,23Punica granatum fruit,24 sugarcane juice,25 watermelon peel,26 jamun,27 and soy milk.28 These approaches have shown significant advantages (eco-friendly and inexpensive precursors and high QY) for generation of CDs and successfully integrated with various analytical techniques for the development of sustainable nanoprobes for environmental applications. Even though significant progress has been made on the development of CDs using various synthetic approaches, unfortunately these methods have shown inability to generate CDs with high QY and multicolor emission, which limits their potential applications in the fields of sensing and cell imaging. Among the heavy metals, mercury has been considered as one of the serious toxic elements and shows high toxic nature to the living system including plants, animals, and humans.29 Noticeably, Hg2+ has shown high ability to adsorb on the biological tissues (skin, gastrointestinal tissues, and respiratory systems), showing adverse effects on DNA, nervous system, brain, kidney functions, and eyesight.30−32 In view of this, the fluorescent-based probes have proven to be a hallmark analytical platform for the analysis of Hg2+ ions because of their notable advantages, that is, rapidity, simplicity, cost-effectiveness, sensitivity, and on-site monitoring applications.33−37 Thus, they have been proven as alternative analytical platforms to several traditional tools including electrochemical method, inductively coupled plasma mass spectrometry, auger electron spectroscopy, and atomic absorption spectroscopy.38−41 However, some of the fluorescent probes require specific chemicals, toxic chemicals, and multistep reactions, which limits their environmental applications. Recently, the research of new carbon-based nanomaterials has been explored tremendously for various applications because of cost-effective precursors and multicolor emissions. Thus, ultrasize CDs were successfully integrated with fluorescence spectrometry for the recognition of inorganic species including Hg2+ ions with excellent sensitivity.10,42,43 For example, Hg2+ ions were effectively and selectively recognized from various environmental samples by using ultrasize CDs prepared from corn bract, honey, urine, uric acid, citric acid and guanidine hydrochloride, spermine, and citric acid as precursors.44−49Cucumis melo fruit belongs to Cucurbitaceae family that contains several bioactive compounds, that is, pro-vitamin A, vitamin C, folic acid, toxic cucurbitacins and flavanoids, and phenolic compounds. Thus, it could be used as a low-cost carbon precursor for the fabrication of fluorescent CDs.
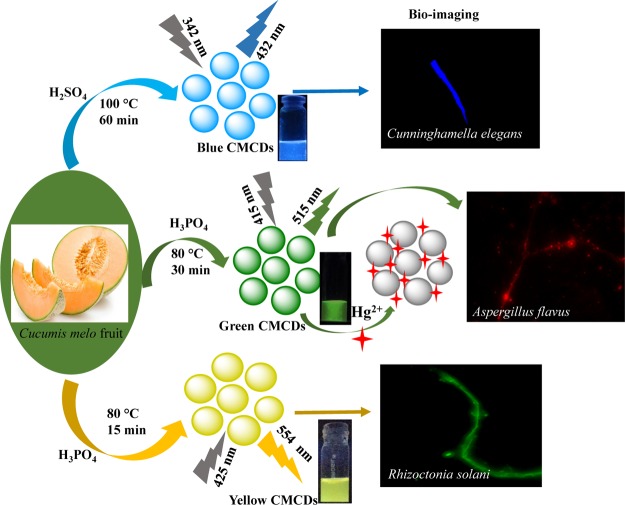
Herein, C. melo fruit for the first time is used as a precursor for the fabrication of multicolor [blue (B), green (G), and yellow (Y)]-emissive CDs via acid (H2SO4 and H3PO4) oxidation and the formed CDs are abbreviated as C. melo CDs (CMCDs; B-, G-, and Y-CMCDs) (Scheme 1). The CMCDs showed excellent affinity toward Hg2+ ions, which results in quenching the fluorescence spectra of CMCDs and yielding a good linear response between I0 – I/I0 and concentration of Hg2+ ions (1–25 μM). The current method exhibits several advantages such as fast detection and low detection limit (LOD) (0.33 μM), exploring them as superior probes to the organic-based fluorescent sensors. Furthermore, the potential use of CMCDs was explored for bioimaging of multiple fungal species including Cunninghamella elegans, Aspergillus flavus, and Rhizoctonia solani sp., signifying their superiority as the potential candidate for cell imaging with better resolution, which may further extend their novel applications in the field of analytical and bioanalytical science.
Scheme 1. Fabrication of Multicolor-Emissive CDs from C. melo Fruit as a Carbon Source via Acid Oxidation.
2. Experimental Section
2.1. Materials
Musk melon was collected from the local supermarket. Concentrated sulfuric acid (H2SO4, 95%) and phosphoric acid (H3PO4) were procured from Finar PVT, LTD, India, and metal salt was purchased from Sigma-Aldrich. Dialysis membrane-70 (12–14 kDa molecular weight cutoff) was purchased from Hi-media Laboratory Pvt., India. Purified water was collected from Millipore-Q water system and used for whole experiments. QY was calculated by using quinine sulfate (54%) as a reference standard for B- and G-CMCDs and rhodamine 6G (95%) for Y-CMCDs.
2.2. Characterization of Multicolor-Emissive CMCDs
To measure the UV–visible spectra of CMCDs, a Maya Pro 2000 spectrophotometer (Ocean Optics, USA) was used. The excitation and emission bands with a 5 nm slit width were recorded by a Carry Eclipse fluorescence spectrometer (Agilent Technologies, USA) using a xenon flash lamp. Fourier transform infrared (FT-IR) measurement was carried out on an ALPHA-II spectrophotometer (Bruker, Germany) to examine the surface functionality of CMCDs. High-resolution transmission electron microscopy (HR-TEM) (JEM-2100, JEOL, Japan) was performed with a 200 keV accelerating voltage to obtain the size and nanostructure information of CMCDs. The hydrodynamic diameter was measured by using dynamic light scattering (DLS) on a Zetasizer Nano ZS90, Malvern, UK, at room temperature.
2.3. Synthesis of Fluorescent CMCDs
Multicolor, B-, G-, and Y-fluorescent CMCDs were synthesized from C. melo (musk melon) fruit with a slight modification in the method described in the literature.12 First, peel was removed from the washed C. melo fruit and then sliced in small pieces. These fruit slices were stored in a deep freezer (−20 °C). To synthesize the blue-colored CMCDs, 10 mL of 34 N H2SO4 was added into a beaker that contains 500 mg/mL of aqueous freeze-dried C. melo fruit. The mixture was sonicated for 5 min, followed by heating at 100 °C for 1 h. Then, the pH of CMCDs residues was neutralized to 7.0 pH by using 2 M NaOH. This neutralized product was dialyzed for 24 h with distilled water to obtain blue-colored CMCDs and then kept at 4 °C for further applications. To synthesize the green fluorescent CMCDs, 500 mg of freeze-dried C. melo fruit was dissolved in 5 mL of water, followed by the addition of 40 N H3PO4 (10 mL). The mixture was heated at 80 °C for 25–30 min, and the pH of products was adapted by using 1 M NaOH. The final product was dialyzed with water for 14 h to generate green CMCDs. Similarly, yellow CMCDs were generated by treating 500 mg of freeze-dried C. melo fruit with 40 N H3PO4 (10 mL). The resulting mixture was heated at 80 °C for 15–20 min. The pH of the product was adjusted to 7.0 by neutralizing with 1 M NaOH and then purified by dialyzing with water for 14 h. The resulting fluorescent CMCDs were stored at 4 °C for further applications.
2.4. Procedures for Hg2+ Detection
The detection experiment was performed in an aqueous solution at room temperature. Various concentrations of Hg2+ solution (1.0–500 μM) were prepared and added into the sample vials containing the aqueous solution of G-CMCDs. Then, the sample vials were vortexed for 30 min at room temperature. The response of Hg2+ onto the emission spectra of G-CMCDs at 415 nm of excitation wavelength was recorded.
For exploring the practical ability of the probe toward Hg2+ ions, human serum and canal water samples were spiked with various concentrations of Hg2+ (2.5, 5.0, and 7.5 μM). The spiked samples were mixed with G-CMCDs and then the emission spectra of the final solutions were recorded. The amount of Hg2+ ions was estimated by using a calibration graph.
2.5. Fluorescence Imaging of Multiple Fungal Species (C. elegans, A. flavus, and R. solani sp.) by Using B-, G-, and Y-CMCDs
Cell imaging of multiple fungal cells (C. elegans, A. flavus, and R. solani sp.) was employed by confocal laser microscopy to evaluate the potential applications of CMCDs. C. elegans, A. flavus, and R. solani sp. cells were spread in Dulbecco’s modified Eagle’s medium (DMEM) with fetal bovine serum (FBS, 10%) in a moistened environment of CO2 (5%) at 37 °C for further tests. The fungal (C. elegans, A. flavus, and R. solani sp.) cells were again subcultured and then incubated with DMEM in 10% FBS for 12 h. The medium was then replaced by DMEM having B-, G-, and Y-CMCDs (1, 5, and 6 μg/mL) for about 24 h, respectively. The fungal (C. elegans, A. flavus, and R. solani sp.) cells with CMCDs were washed three times by using PBS and then the CMCD-conjugated C. elegans, A. flavus, and R. solani sp. cells were placed on the fine slide of images which contain glycerol (50%) and paraformaldehyde (4%) for cell fixation. The fluorescence images were captured by a confocal microscope (Carl Zeiss 510 LSM, Jena, Germany) at different laser excitation wavelengths of 405, 488, and 561 nm.
2.6. Cytotoxicity Studies
Methyl thiazoyl diphenyl tetrazolium bromide (MTT) test was performed to confirm the nonpoisonous features of CMCDs on normal rat kidney epithelial (NRK) cells. The aqueous solutions of B-, G-, and Y-CMCDs with various concentrations (0.25, 0.5, 0.75, and 1.0 mg/mL) were introduced to the wells containing NRK cells and then incubated for 15 h. Then, the wells were carefully rinsed with PBS at pH 7.4. After this, the freshly prepared 50 μL, 5 mg/mL solution of MTT was introduced into the cells, followed by incubation for 4 h. Further, the cell wells were washed three times by using phosphate-buffered saline after removing the MTT from the wells. Finally, the viability of the cell in each well was obtained by measuring the absorbance at 570 nm on a microplate reader. The cell viability was obtained by measuring the absorbance ratio of experimental cells (well-CMCDs) to control cells (well).
3. Results and Discussion
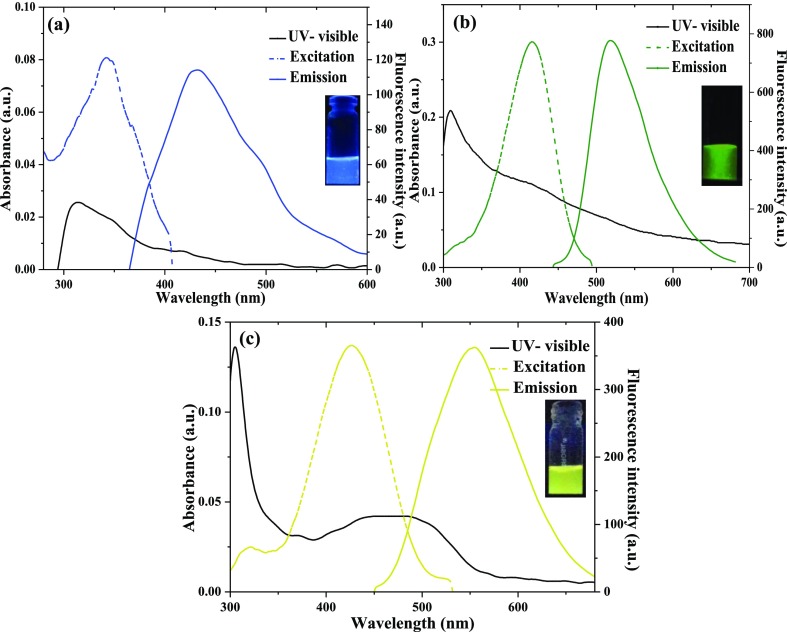
Multicolor fluorescent, B-, G-, and Y-CMCDs were prepared from C. melo fruit as a carbon precursor, which contains several bioactive compounds, that is, pro-vitamin A, vitamin C, folic acid, toxic cucurbitacins and flavanoids, and phenolic compounds. These chemicals play an important role to generate nanosized CMCDs with diverse surface functionality. To fabricate B-, G-, and Y-color florescent CMCDs from C. melo fruit, H2SO4 and H3PO4 were used as oxidizing agents at 80 and 100 °C (Scheme 1). Figure 1a–c represents the UV–visible absorbance spectra of B-, G-, and Y-fluorescent CMCDs in aqueous solution, showing the typical independent absorbance bands at 314, 414, and 467 nm for B-, G-, and Y-CMCDs. These absorption bands show the existence of different π–π* and n−π* electronic transitions, which is due to several surface-state functionalities (amine, hydroxyl, and carboxyl) onto the CMCDs. As-prepared CMCDs emits blue-, green-, and yellow-colored fluorescence under UV light at 365 nm of wavelength (inset in Figure 1), which confirms the formation of multicolor florescent CMCDs. Interestingly, the dispersions of B-, G-, and Y-CMCDs have displayed strong fluorescence emission peaks at 432, 515, and 554 nm when excited at 342, 415, and 425 nm, respectively (Figure 1). Similarly, the changes in the emission wavelengths of the three (blue, green, and yellow)-color CMCDs were examined by measuring their fluorescence emission spectra at excitation wavelengths from 300 to 410, 320 to 460, and 350 to 470 nm for B-, G-, and Y-CMCDs, respectively (Figure S1a–c), which demonstrates the excitation-dependent behavior of CMCDs. Hence, with the increasing excitation wavelength, the emission peaks of the three CMCDs were shifted toward the red region and the maximum emission intensities were originated at 342, 415, and 425 nm of excitation wavelengths, demonstrating the creation of CMCDs with diverse emission trap sites as well as variation in size owing to the presence of multifunctional groups onto the surface of CMCDs.11,12 The QYs of B-, G-, and Y-CMCDs were found to be 7.07, 26.9, and 14.3%, which are greater than the other reported methods.11,12 Further, the stability of these CMCDs was examined by evaluating the emission spectra of CMCDs (Figure S2), indicating that the emission peak intensity of CMCDs was almost unchanged up to 90 days and then the peak intensity decreased slightly. Hence, these three-color CMCDs were stable up to 100 days, making them as potential candidates for biological and sensing applications. Figure S3 shows the average fluorescence lifetimes of B-, G-, and Y-CMCDs. The fluorescence lifetimes of B-, G-, and Y-CMCDs were estimated to be 1.4, 4.9, and 7.1 ns, respectively, which are longer than the autofluorescent cell.50 Thus, these findings suggest that the as-fabricated three CMCDs could be used as ideal fluorescent probes for cell imaging and metal ion detection.
Figure 1.
UV–visible absorption, fluorescence emission, and excitation properties of fluorescent (a) B- (b) G-, and (c) Y-CMCDs obtained from C. melo fruit. The insets show the optical images of CMCDs under a UV lamp at 365 nm.
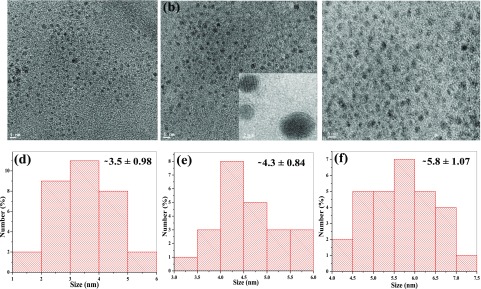
Further, we explore the FT-IR features of the surface functional groups of three-color fluorescent CMCDs derived from the C. melo fruit (Figure S4). It was noticed that the CMCDs showed a quite broad absorption peak at 3550–3150 cm–1, which arises due to the stretching vibrations of O–H and N–H groups of three-color fluorescent CMCDs. The well-defined absorption peaks at 1637/1617, 1639, and 1657 cm–1 correspond to the stretching vibrations of carboxylic and amide groups, while the bands around (1398 and 1400 cm–1) are assigned to the stretching of −C–NH–C groups in B- and G-CMCDs. Similarly, the characteristic peaks at 1110, 1166, and 1150 cm–1 are ascribed to the stretching vibrations of C–S/C–N. The stretching vibrations for P–O and P=O in G- and Y-CMCDs were observed at (521 and 530 cm–1), (932 and 937 cm–1), and (1051 and 1079 cm–1), respectively. Figure 2 shows the HR-TEM studies of the three fluorescent CMCDs. These results revealed that the as-prepared CDs are well dispersed with fine spherical shape and identical size in the range of 2–5, 3.5–6, and 4.5–7 nm for B-, G-, and Y-CMCDs, respectively. The average sizes of B-, G-, and Y-CMCDs are 3.5 ± 0.98, 4.3 ± 0.84, and 5.8 ± 1.07 nm, respectively. The HR-TEM images of CMCDs also demonstrated the crystalline nature of CMCDs, which are quite similar to that of the CDs.11 Further, the DLS of CMCDs (Figure S5) shows that the average hydrodynamic diameters of the three CMCDs are 7.01 ± 1.4, 8.35 ± 3, and 11.2 ± 3.01 nM, respectively, which are well agreed with the HR-TEM results of CMCDs. Thus, distinctive optical and spectral properties of CMCDs make them powerful sensors for assaying the chemical species as well as cell imaging. To further confirm the surface composition of B-, G-, and Y-CMCDs, X-ray photoelectron spectra were studied for B-, G-, and Y-CMCDs. Figure S6 illustrates that the peaks at (136.1, 134.4, and 134.9), (287.4, 285.9, and 286.1), (403.7, 401.4, and 402.0), and (534.2, 532.8, and 533.0) eV are attributed to P 2p, C 1s, N 1s, and O 1s for the three CMCDs, respectively. The peak at 171.2 eV is assigned to the S 2p of blue CMCDs. These results revealed the presence of C, N, O, P, and S elements in the as-prepared three CMCDs. In the high-resolution band of CMCDs of C 1s, the peaks obtained at (286.7, 285.7, and 285.9) and (294.9, 294.3, and 294.1) eV confirmed the existence of C=C and C=O groups on the surface of B-, G-, and Y-CMCDs (Figure S7a). Also, the peaks at (399.78, 397.1, and 399.0), (401.2, 402.0, and 401.1), (533.7, 532.2, and 532.4), and (537.6, 536.7, and 536.7) eV for blue-, green-, and yellow-CMCDs, respectively, demonstrated the existence of multiple functional groups including N–H, C–N–C, C=O, C–O, and S–O on the surface of the three CMCDs (Figure S7b,c). The peak at (134.5 and 134.8) eV corresponds to the P–C groups of G- and Y-CMCDs (Figure S7d), and the peak at 170.9 eV belongs to the S 2p of blue CMCDs (Figure S7e). Thus, the as-synthesized multicolor-emissive CMCDs possess several functional groups on the surfaces, which may be responsible to tune their optical properties.
Figure 2.
HR-TEM images of (a) B- (b) G-, and (c) Y-CMCDs derived from C. melo fruit. Corresponding histograms of (d) B- (e) G-, and (f) Y-CMCDs at 5 nm scale bar.
3.1. Analytical Performance of Green CMCDs for Detection of Hg2+ Ions
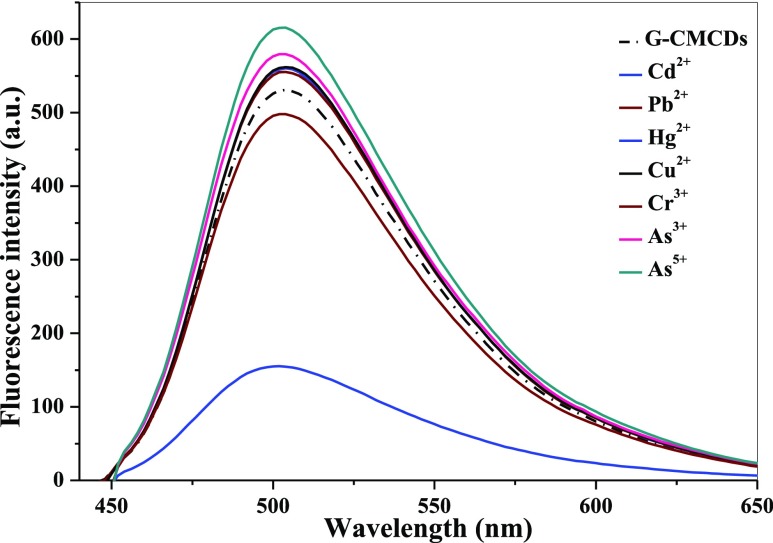
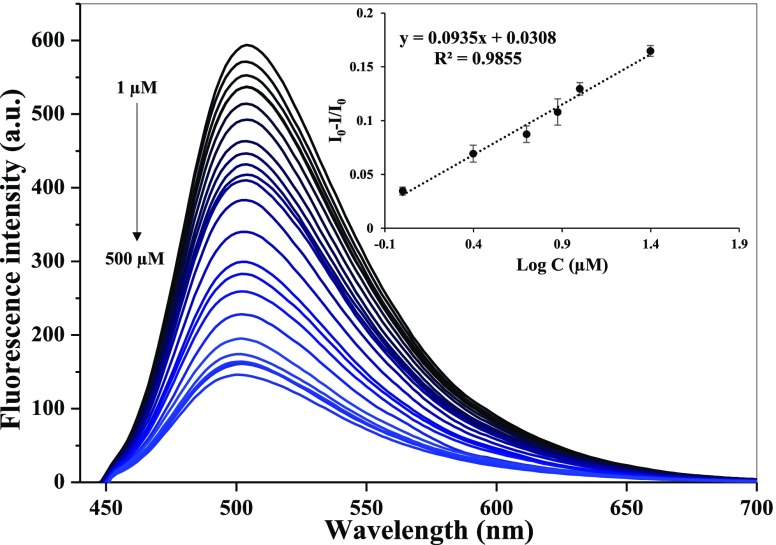
The analytical performance of multicolor CMCDs was evaluated in the presence of different metal ions. As shown in Figures 3 and S8a,b, among B-, G-, and Y-CMCDs, the emission peak of G-CMCDs was specifically quenched only by Hg2+ ions, while other metal ions such as Cd2+, Pb2+, Hg2+, Cu2+, Cr3+, As3+, and As5+ ions did not show any significant effect on the fluorescence emission spectra of B- and Y-CMCDs, indicating the selectivity of G-CMCDs for Hg2+ ion sensing. Therefore, this excellent specific nature of G-CMCDs toward Hg2+ ions was further studied for the fair discerning analysis of Hg2+ ions. As depicted in Figure 4, with a gradual increase of Hg2+ ion concentration from 1 to 500 μM, the emission peak of G-CMCDs was progressively quenched, demonstrating a good linear calibration curve (R2 = 0.9855) between the relative intensity I0 – I/I0 (I0 and I stand for the emission intensity of G-CMCDs at 515 nm before and after the addition of Hg2+ ions) at 515 nm and different concentrations of Hg2+ ions (1–25 μM). The LOD of Hg2+ ions is estimated to be 0.33 μM by using G-CMCDs, which was measured by using 3σ/m (σ refers to the standard deviation of blank and “m” is the slope obtained from calibration curve). This limit of detection is much lower compared to the permissible limits of Hg2+ recommended by the World Health Organisation (WHO) and the United States Environmental Protection Agency (USEPA). The comparison of the newly developed method for recognition of Hg2+ ions with other reported techniques demonstrated that the fluorescence-based G-CMCDs sensor shows quite comparable and higher sensitivity than the reported methods (Table 1).10,37 Notably, the synthesis strategy does not require any expensive chemicals, complicated experimental procedure, and further surface functionalization. Therefore, the as-synthesized green CMCDs are more convenient to use as a probe for the recognition of Hg2+ ions.
Figure 3.
Quenching behavior of different metal ions (Cd2+, Pb2+, Hg2+, Cu2+, Cr3+, As3+, and As3+, 500 μM) on G-fluorescent CMCDs (shown with doted black line).
Figure 4.
Quenching of emission spectra of G-fluorescent CMCDs with increasing concentrations of Hg2+ (1–500 μM). Inset: quenching of emission peak shows the linear response to construct a calibration curve between the I0 – I/I0 values of G-fluorescent CMCDs and Hg2+ ion concentration (1–25 μM).
Table 1. Comparison of Analytical Merits of G-CMCDs with Other Reported Methods.
| carbon nanomaterial-based fluorescence methods | range (μM) | LOD (μM) | reference |
|---|---|---|---|
| Eu3+ hybrid CDs | 5–250 | 2.2 | (10) |
| GSH-Mn2+ ion-ZnS QDs | 50–500 | 1.35 | (37) |
| S-CQDs | 0.5–180 | 0.222 | (42) |
| N-doped CDs | 0.001–5 | 0.65 | (43) |
| pee-dots | 0–100 | 2.7 | (47) |
| cellulose-derived CQDs | 6–80 | 1.6 | (51) |
| N and S codoped CQDs | 0–40 | 2.0 | (52) |
| N-CQDs | 0–18 | 0.085 | (53) |
| Au/N-CQDs | 0–41.8 | 0.118 | (54) |
| G-CMCDs | 1–25 | 0.33 | present study |
3.2. Quenching Mechanism
The outstanding selectivity of G-CMCDs toward Hg2+ ions could be ascribed to the strong binding affinity between the multifunctional groups of G-CMCDs (hydroxyl, amine, and carboxyl groups) with Hg2+, facilitating the specific interaction of G-CMCDs with Hg2+ ions. In order to realize the fluorescence quenching of G-CMCDs by Hg2+ ions, fluorescence decay time measurement was performed. The measured fluorescence decay time of G-CMCDs is 4.9 and 5.0 ns with the addition of Hg2+ ions (Figure S9a). These results indicated that the lifetime of the G-CMCDs does not change in the presence of Hg2+ ions, which confirmed that the fluorescence quenching of G-CMCDs by Hg2+ ions follows the static quenching mechanism. Therefore, the specific selectivity of G-CMCDs is due to its high affinity to form a nonfluorescent ground-state complex, causing the fluorescence quenching.55 Further, to understand the binding nature of G-CMCDs with Hg2+ ions, UV–visible absorption spectra of G-CMCDs and G-CMCDs–Hg2+ were recorded, demonstrating that the characteristic absorption of green CMCDs at 414 nm decreased, which indicates that Hg2+ could change the electronic structure of G-CMCDs via the formation of the ground-state complex (Figure S9b). On the other hand, because of the presence of O–H, N–H and C=O groups on the surface of green CMCDs, Hg2+ ions underwent a complexation reaction with them, favoring to reconstruct the G-CMCDs, which results in quenching the fluorescence intensity of G-CMCDs. Figure S9c shows the HR-TEM image of G-CMCDs in the presence of Hg2+ ions. It can be noticed that the larger aggregates were generated when Hg2+ ions were introduced into the solution of G-CMCDs. As a result, the hydrodynamic diameter of G-CMCDs was also increased upon the addition of Hg2+ ions (shown in Figure S9d). These results suggested that the specific quenching of fluorescence emission of G-CMCDs by Hg2+ ions might be due to the strong interaction between G-CMCDs and Hg2+, which results to form G-CMCDs–Hg2+ aggregates via nonfluorescent ground-state complex formation.
3.3. Selectivity Studies
To further examine the selectivity of the G-CMCDs-based fluorescence sensor for Hg2+, the quenching efficiency of Hg2+ in the presence of other common chemical species such as metal ions (Cu2+, Co2+, Ni2+, As3+, and Cr3+), anions (Cl–, S2–, CH3COO–, PO43–, NO3–, and Cr2O72–), and pesticides (thiram, chlopropham, quinalphos, monocrotophos, and triazophos) were investigated and are shown in Figure S10. The concentration of all interfering agents was 500 μM. First, metal ions, anions, and pesticides are mixed separately and added into the green CMCDs solution (Figure S10). It was observed that there is no such significant change observed in the fluorescence intensity of G-CMCDs with the other chemical species mixtures (metal ions, anions, and pesticides). However, the emission intensity of G-CMCDs was quenched only in the presence of Hg2+ ions, illustrating that the G-CMCD-based fluorescence “turn-off” approach could be successfully employed for Hg2+ detection in real samples.
3.4. Application of G-CMCDs for Real Sample Testing
To explore the practical ability of this developed approach, the G-CMCD-based fluorescence approach was further employed to assay Hg2+ in human serum and canal water samples. The samples (human serum and canal water) were spiked with the stock solution of Hg2+ ions (2.5, 5.0, and 7.5 μM) and then standard recovery experiments were carried out by the aforementioned procedure. Table S1 depicts the percentage recoveries in the range of 96.88–100.89% with relative standard deviation values of 0.13–1.13% for assaying Hg2+ ions in human serum and canal water samples, illustrating that the present method for Hg2+ ion detection has high accuracy and precision, which suggest that this method can be used as a portable analytical approach for analysis of Hg2+ in real samples.
3.5. Imaging of C. elegans, A. flavus, and R. solani sp. Cells and Cytotoxicity
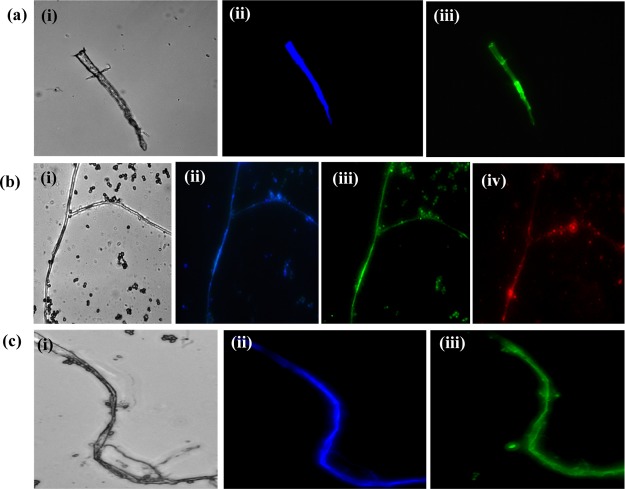
To evaluate the potentiality of multicolor-emissive CMCD applications in cell imaging, C. elegans, A. flavus, and R. solani sp. cells were used to examine their imaging ability by fluorescence microscopy. As shown in Figure 5, the fabricated CMCDs (blue, green, and yellow) displayed blue, green, and red color signals when excited at 405, 488, and 561 nm, respectively. The CMCDs can be easily entered into the cell system and dispersed into C. elegans, A. flavus, and R. solani cells through cell membrane and endocytosis. It can be observed that the cells do not emit any fluorescence signals without CMCDs, suggesting their successful distribution into the cells, which exposed cell images with bright fluorescence signals. The cytotoxicity study of multiple color CDs are examined on NRK cells, which shows their efficiency in cell imaging. Further, the cytotoxicity study of different concentrations of CMCDs (0.25–1.0 mg/mL) (Figure S11) was carried out by MTT assay against NRK cells. These results revealed that the CMCDs exhibited nontoxic and biocompatible nature up to 1.0 mg/mL, which also signifies their efficiency as a fluorescent probe for imaging of C. elegans, A. flavus, and R. solani sp. fungal cells.
Figure 5.
Confocal microscopic images of (a) C. elegans treated with B-CMCDs (i–iii), (b) A. flavus treated with G-CMCDs (i–iv), and (c) R. solani sp. treated with Y-CMCDs (i–iii), at excitation wavelengths of 405, 488, and 561 nm and 2 μm scale bar.
4. Conclusions
A simple and green/clean one-step synthetic approach was explored for the preparation of multicolor-emissive CMCDs from C. melo fruit as a new natural carbon source via acid oxidation treatment. The use of different oxidizing agents and optimum reaction parameters can easily tune the size and optical behavior of CMCDs. The as-prepared B-, G-, and Y-CMCDs exhibit −CO, −COOH, and −OH functional groups with an average size of 3.5, 4.3, and 5.8 nm, showing excellent water solubility and strong excitation-dependent emission properties. The G-CMCD-based sensing technique was applied as a novel fluorescent probe for assaying Hg2+ ions without further modification. Among these three CMCDs, green fluorescent CMCDs possess greater affinity to sense Hg2+ ions, display good linearity ranging from 1 to 25 μM with a lower LOD of 0.33 μM. The G-CMCDs exhibited high selectivity for the analysis of Hg2+ ions and quantified in real samples (serum and canal water) with good percentage recoveries of 96.88–100.89%. The as-synthesized CMCDs showed nontoxic and biocompatible nature toward fungal cells and are used as probes for imaging C. elegans, A. flavus, and R. solani sp. fungal cells. The present approach exhibited a quite promising strategy for the real-time monitoring of Hg2+ ions in human serum and canal water samples, which meets the requirement of USEPA and WHO for Hg2+ analysis in real samples.
Acknowledgments
This work was financially supported by the Board of Research in Nuclear Sciences (ref. no. 37(2)/14/07/2015/BRNS/10401), Department of Atomic Energy, Government of India.
Supporting Information Available
The Supporting Information is available free of charge on the ACS Publications website at DOI: 10.1021/acsomega.9b02730.
Fluorescence spectra, fluorescence lifetime data, FT-IR spectra, and DLS of B-, G-, and Y-CMCDs; X-ray photoelectron spectroscopy spectra of B-, G-, and Y-CMCDs; fluorescence studies of G- and Y-CMCDs with the addition of different metal ions; analytical studies of G-CMCDs with Hg2+ ions using fluorescence lifetime, HR-TEM, and DLS; selectivity study of G-CMCDs toward Hg2+ ions in the presence of other metal ions; cytotoxic evaluation of B-, G-, and Y-CMCDs NRK cells; and practical applications of the method for the detection of Hg2+ ions in real samples (PDF)
The authors declare no competing financial interest.
Supplementary Material
References
- Julien P. A.; Mottillo C.; Friščić T. Metal-organic frameworks meet scalable and sustainable synthesis. Green Chem. 2017, 19, 2729–2747. 10.1039/c7gc01078h. [DOI] [Google Scholar]
- Chen S.; Yu Y.-L.; Wang J.-H. Inner filter effect-based fluorescent sensing systems: A review. Anal. Chim. Acta 2018, 999, 13–26. 10.1016/j.aca.2017.10.026. [DOI] [PubMed] [Google Scholar]
- Zheng Y.; Zhang D.; Shah S. N. A.; Li H.; Lin J.-M. Ultra-weak chemiluminescence enhanced by facilely synthesized nitrogen-rich quantum dots through chemiluminescence resonance energy transfer and electron hole injection. Chem. Commun. 2017, 53, 5657–5660. 10.1039/c7cc02041d. [DOI] [PubMed] [Google Scholar]
- Liu M. L.; Chen B. B.; Li C. M.; Huang C. Z. Carbon dots: synthesis, formation mechanism, fluorescence origin and sensing applications. Green Chem. 2019, 21, 449–471. 10.1039/c8gc02736f. [DOI] [Google Scholar]
- Tuerhong M.; Xu Y.; Yin X.-B. Review on carbon dots and their applications. Chin. J. Anal. Chem. 2017, 45, 139–150. 10.1016/s1872-2040(16)60990-8. [DOI] [Google Scholar]
- Lin L.; Rong M.; Luo F.; Chen D.; Wang Y.; Chen X. Luminescent graphene quantum dots as new fluorescent materials for environmental and biological applications. TrAC Trends Anal. Chem. 2014, 54, 83–102. 10.1016/j.trac.2013.11.001. [DOI] [Google Scholar]
- Pirsaheb M.; Moradi S.; Shahlaei M.; Farhadian N. Application of carbon dots as efficient catalyst for the green oxidation of phenol: Kinetic study of the degradation and optimization using response surface methodology. J. Hazard. Mater. 2018, 353, 444–453. 10.1016/j.jhazmat.2018.04.038. [DOI] [PubMed] [Google Scholar]
- Ju B.; Nie H.; Liu Z.; Xu H.; Li M.; Wu C.; Wang H.; Zhang S. X.-A. Full-colour carbon dots: integration of multiple emission centres into single particles. Nanoscale 2017, 9, 13326–13333. 10.1039/c7nr04576j. [DOI] [PubMed] [Google Scholar]
- Jiang K.; Sun S.; Zhang L.; Lu Y.; Wu A.; Cai C.; Lin H. Red, green, and blue luminescence by carbon dots: full-color emission tuning and multicolor cellular imaging. Angew. Chem., Int. Ed. 2015, 54, 5360–5363. 10.1002/anie.201501193. [DOI] [PubMed] [Google Scholar]
- Desai M. L.; Jha S.; Basu H.; Singhal R. K.; Sharma P. K.; Kailasa S. K. Microwave assisted synthesis of water-soluble Eu3+ hybrid carbon dots with enhanced fluorescence for the sensing of Hg2+ ions and imaging of fungal cells. New J. Chem. 2018, 42, 6125–6133. 10.1039/c7nj04835a. [DOI] [Google Scholar]
- Bhamore J. R.; Jha S.; Park T. J.; Kailasa S. K. Green synthesis of multi-color emissive carbon dots from Manilkara zapota fruits for bioimaging of bacterial and fungal cells. J. Photochem. Photobiol. B. 2019, 191, 150–155. 10.1016/j.jphotobiol.2018.12.023. [DOI] [PubMed] [Google Scholar]
- Kailasa S. K.; Ha S.; Baek S. H.; Phan L. M. T.; Kim S.; Kwak K.; Park T. J. Tuning of carbon dots emission color for sensing of Fe3+ ion and bioimaging applications. Mater. Sci. Eng. C. 2019, 98, 834–842. 10.1016/j.msec.2019.01.002. [DOI] [PubMed] [Google Scholar]
- Ding Z.; Li F.; Wen J.; Wang X.; Sun R. Gram-scale synthesis of single-crystalline graphene quantum dots derived from lignin biomass. Green Chem. 2018, 20, 1383–1390. 10.1039/c7gc03218h. [DOI] [Google Scholar]
- Wang C.-I.; Wu W.-C.; Periasamy A. P.; Chang H.-T. Electrochemical synthesis of photoluminescent carbon nanodots from glycine for highly sensitive detection of hemoglobin. Green Chem. 2014, 16, 2509–2514. 10.1039/c3gc42325e. [DOI] [Google Scholar]
- Xu X.; Ray R.; Gu Y.; Ploehn H. J.; Gearheart L.; Raker K.; Scrivens W. A. Electrophoretic analysis and purification of fluorescent single-walled carbon nanotube fragments. J. Am. Chem. Soc. 2004, 126, 12736–12737. 10.1021/ja040082h. [DOI] [PubMed] [Google Scholar]
- Shi L.; Li X.; Li Y.; Wen X.; Li J.; Choi M. M. F.; Dong C.; Shuang S. Naked oats-derived dual-emission carbon nanodots for ratiometric sensing and cellular imaging. Sens. Actuators B 2015, 210, 533–541. 10.1016/j.snb.2014.12.097. [DOI] [Google Scholar]
- Cao L.; Wang X.; Meziani M. J.; Lu F.; Wang H.; Luo P. G.; Lin Y.; Harruff B. A.; Veca L. M.; Murray D.; Xie S.-Y.; Sun Y.-P. Carbon dots for multiphoton bioimaging. J. Am. Chem. Soc. 2007, 129, 11318–11319. 10.1021/ja073527l. [DOI] [PMC free article] [PubMed] [Google Scholar]
- Choi Y.; Kim S.; Choi M.-H.; Ryoo S.-R.; Park J.; Min D.-H.; Kim B.-S. Highly biocompatible carbon nanodots for simultaneous bioimaging and targeted photodynamic therapy in vitro and in vivo. Adv. Funct. Mater. 2014, 24, 5781–5789. 10.1002/adfm.201400961. [DOI] [Google Scholar]
- Mehta V. N.; Chettiar S. S.; Bhamore J. R.; Kailasa S. K.; Patel R. M. Green synthetic approach for synthesis of fluorescent carbon dots for lisinopril drug delivery system and their confirmations in the cells. J. Fluoresc. 2017, 27, 111–124. 10.1007/s10895-016-1939-4. [DOI] [PubMed] [Google Scholar]
- Kasibabu B. S. B.; D’souza S. L.; Jha S.; Kailasa S. K. Imaging of bacterial and Fungal cells using fluorescent carbon dots prepared from carica papaya juice. J. Fluoresc. 2015, 25, 803–810. 10.1007/s10895-015-1595-0. [DOI] [PubMed] [Google Scholar]
- Mehta V. N.; Jha S.; Singhal R. K.; Kailasa S. K. Preparation of multicolor emitting carbon dots for HeLa cell imaging. New J. Chem. 2014, 38, 6152–6160. 10.1039/c4nj00840e. [DOI] [Google Scholar]
- D’souza S. L.; Deshmukh B.; Bhamore J. R.; Rawat K. A.; Lenka N.; Kailasa S. K. Synthesis of fluorescent nitrogen-doped carbon dots from dried shrimps for cell imaging and boldine drug delivery system. RSC Adv. 2016, 6, 12169–12179. 10.1039/c5ra24621k. [DOI] [Google Scholar]
- Mehta V. N.; Jha S.; Basu H.; Singhal R. K.; Kailasa S. K. One-step hydrothermal approach to fabricate carbon dots from apple juice for imaging of mycobacterium and fungal cells. Sens. Actuators B 2015, 213, 434–443. 10.1016/j.snb.2015.02.104. [DOI] [Google Scholar]
- Kasibabu B. S. B.; D’souza S. L.; Jha S.; Singhal R. K.; Basu H.; Kailasa S. K. One-step synthesis of fluorescent carbon dots for imaging bacterial and fungal cells. Anal. Methods 2015, 7, 2373–2378. 10.1039/c4ay02737j. [DOI] [Google Scholar]
- Mehta V. N.; Jha S.; Kailasa S. K. One-pot green synthesis of carbon dots by using Saccharum officinarum juice for fluorescent imaging of bacteria (Escherichia coli) and yeast (Saccharomyces cerevisiae) cells. Mater. Sci. Eng. C. 2014, 38, 20–27. 10.1016/j.msec.2014.01.038. [DOI] [PubMed] [Google Scholar]
- Zhou J.; Sheng Z.; Han H.; Zou M.; Li C. Facile synthesis of fluorescent carbon dots using watermelon peel as a carbon source. Mater. Lett. 2012, 66, 222–224. 10.1016/j.matlet.2011.08.081. [DOI] [Google Scholar]
- Bhamore J. R.; Jha S.; Singhal R. K.; Park T. J.; Kailasa S. K. Facile green synthesis of carbon dots from Pyrus pyrifolia fruit for assaying of Al3+ ion via chelation enhanced fluorescence mechanism. J. Mol. Liq. 2018, 264, 9–16. 10.1016/j.molliq.2018.05.041. [DOI] [Google Scholar]
- Zhu C.; Zhai J.; Dong S. Bifunctional fluorescent carbon nanodots: green synthesis via soy milk and application as metal-free electrocatalysts for oxygen reduction. Chem. Commun. 2012, 48, 9367–9369. 10.1039/c2cc33844k. [DOI] [PubMed] [Google Scholar]
- Alizadeh K.; Parooi R.; Hashemi P.; Rezaei B.; Ganjali M. R. A new Schiff’s base ligand immobilized agarose membrane optical sensor for selective monitoring of mercury ion. J. Hazard. Mater. 2011, 186, 1794–1800. 10.1016/j.jhazmat.2010.12.067. [DOI] [PubMed] [Google Scholar]
- Tchounwou P. B.; Ayensu W. K.; Ninashvili N.; Sutton D. Environmental exposure to mercury and its toxicopathologic implications for public health. Environ. Toxicol. 2003, 18, 149–175. 10.1002/tox.10116. [DOI] [PubMed] [Google Scholar]
- Zhou Y.; Ma Z. Fluorescent and colorimetric dual detection of mercury (II) by H2O2 oxidation of o-phenylenediamine using Pt nanoparticles as the catalyst. Sens. Actuators B 2017, 249, 53–58. 10.1016/j.snb.2017.04.076. [DOI] [Google Scholar]
- Maity A.; Sil A.; Nad S.; Patra S. K. A highly selective, sensitive and reusable BODIPY based ‘off/on’ fluorescence chemosensor for the detection of Hg2+ ions. Sens. Actuators B. 2018, 255, 299–308. 10.1016/j.snb.2017.08.016. [DOI] [Google Scholar]
- Wang N.; Lin M.; Dai H.; Ma H. Functionalized gold nanoparticles/reduced graphene oxide nanocomposites for ultrasensitive electrochemical sensing of mercury ions based on thymine-mercury-thymine structure. Biosens. Bioelectron. 2016, 79, 320–326. 10.1016/j.bios.2015.12.056. [DOI] [PubMed] [Google Scholar]
- Carter K. P.; Young A. M.; Palmer A. E. Fluorescent sensors for measuring metal ions in living systems. Chem. Rev. 2014, 114, 4564–4601. 10.1021/cr400546e. [DOI] [PMC free article] [PubMed] [Google Scholar]
- Bhamore J. R.; Jha S.; Basu H.; Singhal R. K.; Murthy Z. V. P.; Kailasa S. K. Tuning of gold nanoclusters sensing applications with bovine serum albumin and bromelain detection of Hg2+ ion and lambda-cyhalothrin via fluorescence turn-off and on mechanisms. Anal. Bioanal. Chem. 2018, 410, 2781–2791. 10.1007/s00216-018-0958-1. [DOI] [PubMed] [Google Scholar]
- Bhamore J. R.; Deshmukh B.; Haran V.; Jha S.; Singhal R. K.; Lenka N.; Kailasa S. K.; Murthy Z. V. P. One-step eco-friendly approach for the fabrication of synergistically engineered fluorescent copper nanoclusters: sensing of Hg2+ ion and cellular uptake and bioimaging properties. New J. Chem. 2018, 42, 1510–1520. 10.1039/c7nj04031h. [DOI] [Google Scholar]
- Desai M. L.; Deshmukh B.; Haran V.; Jha S.; Basu H.; Singhal R. K.; Lenka N.; Sharma P. K.; Kailasa S. K. Influence of doping ion, capping agent and pH on the optical properties of ZnS quantum dots: Sensing of Cu2+ and Hg2+ ions and their biocompatibility with cancer and fungal cells. Spectrochim. Acta A Mol. Biomol. Spectrosc. 2019, 210, 212–221. 10.1016/j.saa.2018.11.027. [DOI] [PubMed] [Google Scholar]
- Jovanovski V.; Hrastnik N. I.; Hočevar S. B. Copper film electrode for anodic stripping voltammetric determination of trace mercury and lead. Electrochem. Commun. 2015, 57, 1–4. 10.1016/j.elecom.2015.04.018. [DOI] [Google Scholar]
- Ghaedi M.; Reza Fathi M.; Shokrollahi A.; Shajarat F. Highly selective and sensitive preconcentration of mercury ion and determination by cold vapor atomic absorption spectroscopy. Anal. Lett. 2006, 39, 1171–1185. 10.1080/00032710600622167. [DOI] [Google Scholar]
- Wang H.-T.; Kang B. S.; Chancellor T. F.; Lele T. P.; Tseng Y.; Ren F. Fast electrical detection of Hg(II) ions with AlGaN/GaN high electron mobility transistors. Appl. Phys. Lett. 2007, 91, 042114–042116. 10.1063/1.2764554. [DOI] [Google Scholar]
- Li H.; Zhai J.; Tian J.; Luo Y.; Sun X. Carbon nanoparticle for highly sensitive and selective fluorescent detection of mercury(II) ion in aqueous solution. Biosens. Bioelectron. 2011, 26, 4656–4660. 10.1016/j.bios.2011.03.026. [DOI] [PubMed] [Google Scholar]
- Wang C.; Wang Y.; Shi H.; Yan Y.; Liu E.; Hu X.; Fan J. A strong blue fluorescent nanoprobe for highly sensitive and selective detection of mercury(II) based on sulfur doped carbon quantum dots. Mater. Chem. Phys. 2019, 232, 145–151. 10.1016/j.matchemphys.2019.04.071. [DOI] [Google Scholar]
- Ren G.; Meng Y.; Zhang Q.; Tang M.; Zhu B.; Chai F.; Wang C.; Su Z. Nitrogen-doped carbon dots for the detection of mercury ions in living cells and visualization of latent fingerprints. New J. Chem. 2018, 42, 6824–6830. 10.1039/c7nj05170k. [DOI] [Google Scholar]
- Zhao J.; Huang M.; Zou M.; Chen D.; Huang Y.; Zhao S.; Zhao S. L. Unique approach to develop carbon dot-based nanohybrid near-infrared ratiometric fluorescent sensor for the detection of mercury ions. Anal. Chem. 2017, 89, 8044–8049. 10.1021/acs.analchem.7b01443. [DOI] [PubMed] [Google Scholar]
- Ruan Y.; Wu L.; Jiang X. Self-assembly of nitrogen-doped carbon nanoparticles: a new ratiometric UV-vis optical sensor for the highly sensitive and selective detection of Hg2+ in aqueous solution. Analyst 2016, 141, 3313–3318. 10.1039/c6an00465b. [DOI] [PubMed] [Google Scholar]
- Srinivasan K.; Subramanian K.; Murugan K.; Dinakaran K. Sensitive fluorescence detection of mercury(II) in aqueous solution by the fluorescence quenching effect of MoS2 with DNA functionalized carbon dots. Analyst 2016, 141, 6344–6352. 10.1039/c6an00879h. [DOI] [PubMed] [Google Scholar]
- Essner J. B.; Laber C. H.; Ravula S.; Polo-Parada L.; Baker G. A. Pee-dots: biocompatible fluorescent carbon dots derived from the upcycling of urine. Green Chem. 2016, 18, 243–250. 10.1039/c5gc02032h. [DOI] [Google Scholar]
- Yuan Y. H.; Liu Z. X.; Li R. S.; Zou H. Y.; Lin M.; Liu H.; Huang C. Z. Synthesis of nitrogen-doping carbon dots with different photoluminescence properties by controlling the surface states. Nanoscale 2016, 8, 6770–6776. 10.1039/c6nr00402d. [DOI] [PubMed] [Google Scholar]
- He J. H.; Cheng Y. Y.; Yang T.; Zou H. Y.; Huang C. Z. Functional preserving carbon dots-based fluorescent probe for mercury (II) ions sensing in herbal medicines via coordination and electron transfer. Anal. Chim. Acta 2018, 1035, 203–210. 10.1016/j.aca.2018.06.053. [DOI] [PubMed] [Google Scholar]
- Resch-Genger U.; Grabolle M.; Cavaliere-Jaricot S.; Nitschke R.; Nann T. Quantum dots versus organic dyes as fluorescent labels. Nat. Methods 2008, 5, 763–775. 10.1038/nmeth.1248. [DOI] [PubMed] [Google Scholar]
- Wang C.; Wang C.; Xu P.; Li A.; Chen Y.; Zhuo K. Synthesis of cellulose-derived carbon dots using acidic ionic liquid as a catalyst and its application for detection of Hg2+. J. Mater. Sci. 2016, 51, 861–867. 10.1007/s10853-015-9410-5. [DOI] [Google Scholar]
- Li L.; Yu B.; You T. Nitrogen and sulfur co-doped carbon dots for highly selective and sensitive detection of Hg (II) ions. Biosens. Bioelectron. 2015, 74, 263–269. 10.1016/j.bios.2015.06.050. [DOI] [PubMed] [Google Scholar]
- Huang H.; Weng Y.; Zheng L.; Yao B.; Weng W.; Lin X. Nitrogen-doped carbon quantum dots as fluorescent probe for ″off-on″ detection of mercury ions, l-cysteine and iodide ions. J. Colloid Interface Sci. 2017, 506, 373–378. 10.1016/j.jcis.2017.07.076. [DOI] [PubMed] [Google Scholar]
- Meng A.; Xu Q.; Zhao K.; Li Z.; Liang J.; Li Q. A highly selective and sensitive ″on-off-on″ fluorescent probe for detecting Hg(II) based on Au/N-doped carbon quantum dots. Sens. Actuators. B. 2018, 255, 657–665. 10.1016/j.snb.2017.08.028. [DOI] [Google Scholar]
- Zu F.; Yan F.; Bai Z.; Xu J.; Wang Y.; Huang Y.; Zhou X. The quenching of the fluorescence of carbon dots: A review on mechanisms and applications. Microchim. Acta 2017, 184, 1899–1914. 10.1007/s00604-017-2318-9. [DOI] [Google Scholar]
Associated Data
This section collects any data citations, data availability statements, or supplementary materials included in this article.


