Abstract
NaTaO3 nanoparticles with a high surface area of 46.2 m2/g have been successfully synthesized using a polymeric citrate precursor route. As-prepared nanoparticles were extensively characterized by X-ray diffraction, Fourier transform infrared, transmission emission microscopy, and scanning electron microscopy studies for the analysis of phase purity, crystallinity, and morphology. NaTaO3 nanoparticles show efficient photo-induced removal of the methylene blue dye under sunlight, which were confirmed by using liquid chromatography–mass spectroscopy. 86% dye has been degraded in 200 min at neutral pH, whereas the same amount of dye was decolorized in only 80 min at alkaline pH. Also, the dielectric behavior of the as-prepared nanoparticles at different annealing temperatures was explained by the Maxwell–Wagner polarization mechanism. At 500, 600, and 700 °C annealing temperatures, the dielectric constant and dielectric loss at 500 kHz for the samples were found to be 21.5, 18, and 16 and 0.012, 0.022, and 0.029, respectively. The unsaturated hysteresis loop shows weak ferroelectric behavior of NaTaO3 nanoparticles with remanent and saturation polarizations of 0.0013 and 0.21 μC/cm2, respectively, and S-E hysteresis shows a bipolar strain of 0.10%.
1. Introduction
The presence of residual dyes or organic moieties in untreated or inefficiently treated effluents from the textile industries and other industries is of great concern in the present scenario to the scientific world. Therefore, the degradation of dyes using different techniques like microwave, sonophotocatalysis, and photocatalysis is considered as eco-friendly ways for remediation of the environment.1−4 However, among various environment-friendly techniques, photocatalysis has attracted lot of attention in reducing the threats posed to the environment. The removal of organic pollutants from wastewater is prime application of photocatalytic phenomenon.5 Several organic and inorganic photocatalysts have been employed for removal of organic dyes from wastewater. Among inorganic photocatalysts, tremendous attention has been given to the metal oxide nanoparticles due to their unique and enhanced catalytic activity as compared to their bulk counterparts.6,7 Most of the nanosized metal oxide nanoparticle photocatalysts are widely used in semiconductor industry due to their less toxicity, high stability, and low cost.8,9 The use of metal oxides as photocatalysts has been uncovered by the prelude of TiO2 as a photocatalyst in photocatalytic water splitting.10 Not only metal oxides, few nanosized complex metal oxides such as ZnWO4, CuWO4, CuCrO2, and CoWO4 have shown significant photocatalytic and electrocatalytic performances.11−14 Later, different metal oxide nanoparticles like niobates and tantalates were explored for their photocatalytic activity in water splitting and removal of organic contaminants from water.15,16 NaTaO3, being an important member of tantalate perovskites, has been explored extensively for its photocatalytic water splitting activity due to its stability and structural flexibility. In the NaTaO3 structure, the corner sharing of TaO6 octahedron forms a three-dimensional structure with sodium ions at dodecahedral interspaces, which maintains the stability of the NaTaO3 structure.17 Apart from photocatalytic application, NaTaO3 has also found application as a lead-free piezoelectric ceramic and dielectric material.18
Another lead-free piezoelectric ceramic, sodium niobate recently developed by a citrate precursor route has shown enhanced electrocatalytic and photocatalytic properties.19 Dielectric materials with high permittivity (K) and piezoelectric constant (d33) have shown immense importance due to their applications in dielectrics, electronic devices, piezoelectric sensors, actuators, and energy storage devices.20−23 Great efforts are being made to develop high K, high d33, and low Curie temperature (Tc) materials. Due to high dielectric and piezoelectric constant of ferroelectric ABO3-type ceramics, particularly, PbTiO3-derived materials have attracted tremendous attention from researchers to understand the effect of composition, structure morphology, and surface area on their functional properties.24,25 The functional materials have facilitated the researchers to devote more attention toward eco-friendly ferroelectric, piezoelectric, and dielectric materials like BaTiO3, KNbO3, NaNbO3, and NaTaO3.18,26−29 Due to interesting and characteristic ferroelectric properties, NaTaO3 has been widely used in electroceramic industries.18
However, the low light absorption ability and low charge separation hinder NaTaO3 to act as an efficient photocatalyst. Similarly, the less studied electrical properties of NaTaO3 nanoparticles limit their practical application in different fields. Different factors like the preparation method, higher crystallinity, different morphology, crystallite size, less defects, and high surface area are being considered to improve the photocatalytic activity and dielectric and piezoelectric properties of NaTaO3 nanoparticles. High surface area would lead to improved photocatalytic and electrical properties of NaTaO3 nanoparticles. To synthesize high-surface-area NaTaO3 nanoparticles for different applications, several methods like sol–gel, hydrothermal, reverse micelles have been employed.15,30,31
In this work, we have used a polymeric citrate precursor route to prepare high-surface-area photocatalytically active, high-k NaTaO3 nanoparticles. XRD, FT-IR, TEM, and SEM techniques were employed to characterize as-prepared nanoparticles. Surface area evaluation was done by using the BET theory. The present work intends to study the photocatalytic activity of the synthesized nanoparticles. The detailed investigation for dielectric properties of NaTaO3 nanoparticles was carried out with frequency and temperature. The variation of dielectric properties of as-synthesized nanoparticles at different annealing temperatures was also studied. The piezoelectric properties of as-prepared nanoparticles were also presented.
2. Results and Discussion
2.1. X-ray Diffraction (XRD) Analysis
XRD was used to extract the information regarding crystallinity, phase purity, and phase composition of as-synthesized NaTaO3. The X-ray diffraction pattern is shown in Figure 1, which clearly indicates that all the diffraction peaks match closely with the orthorhombic phase of NaTaO3 as documented in JCPDS card no 73-0878. The position of the peaks in the XRD pattern represents that the pure, monophasic, highly crystalline NaTaO3 has been prepared by a polymeric citrate precursor method. All the reflections in the XRD pattern corresponds to the orthorhombic phase of the NaTaO3 sample with lattice parameters a = 5.5213, b = 7.7952, and c = 5.4842 Å and a space group of Pcmn. The XRD reflections at 2θ (22.796°, 32.447°, 39.985°, 46.609°, 52.483°, 57.896°, 67.969°, 72.71°, and 77.83°) correspond to (020), (121), (220), (040), (141), (240), (242), (060) and (402) crystal planes, respectively, which showed that no phase other than NaTaO3 was formed during the reaction.
Figure 1.
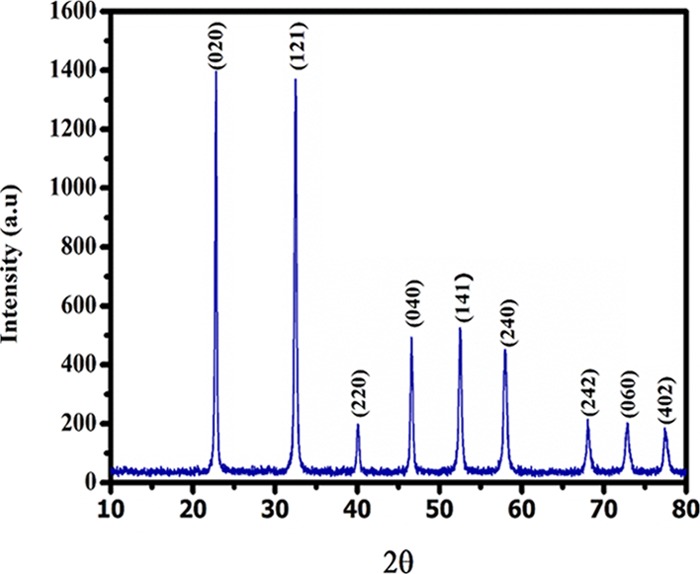
X-ray diffraction pattern of NaTaO3 nanoparticles.
2.2. FTIR Studies
Figure 2 represents the FT-IR spectra of the nanocrystalline NaTaO3 sample. The characteristic peaks corresponding to C–O stretching of citric acid, ethylene glycol, carboxylate band, and metal carboxylate band were present in a region of 1400–1500 cm–1. The IR band at 3128 corresponds to the O–H vibrations of the adsorbed water on the surface. The other peaks at 1100–1600 cm–1 confirm the formation of ester linkage, and the bands at 1507, 1390, and 1226 cm–1 could be attributed to C–C, C=O, and C–O stretching, respectively.32 In IR spectra, the strong band observed at 2360 could be due to the atmospheric CO2.32 Further, the fingerprint peak responsible for M–O vibrations was observed at 627 cm–1. This M–O band in the spectra was observed due to the Ta–O stretching and Ta–O–Ta bridge stretching modes.18 The reason responsible for these bands is the symmetric combination of Ta–O stretching modes in TaO6 octahedra.
Figure 2.
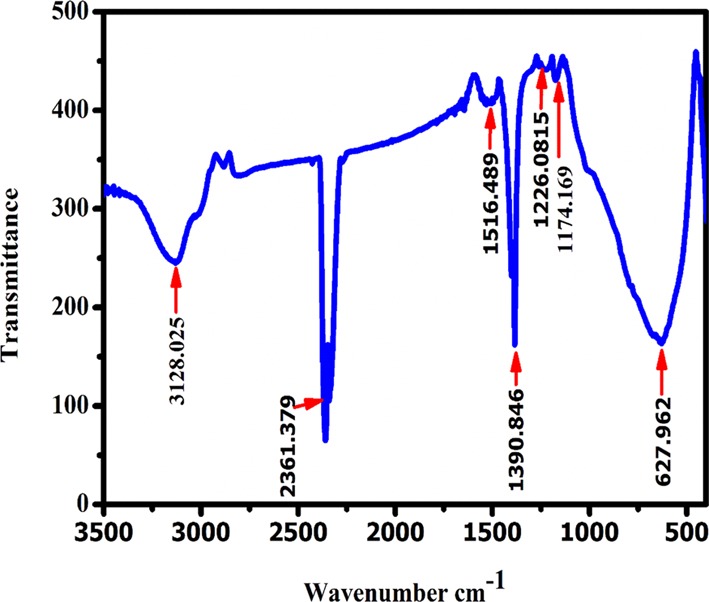
FT-IR spectra of NaTaO3 nanoparticles.
2.3. Electron Microscopic Studies
TEM analysis showed the formation of NaTaO3 nanoparticles as shown in Figure 3a. The appearance of dense agglomerated nanoparticles in the TEM micrograph could be attributed to the high synthesis temperature, which could lead to the grain diffusion and grain growth.33Figure 3b represents the size distribution histogram of NaTaO3 nanoparticles with size ranging from 20 to 140 nm having an average size of 70 nm. The TEM analysis demonstrates that the size of the synthesized NaTaO3 can be successfully controlled in nanodimensions using a polymeric citrate precursor route.
Figure 3.
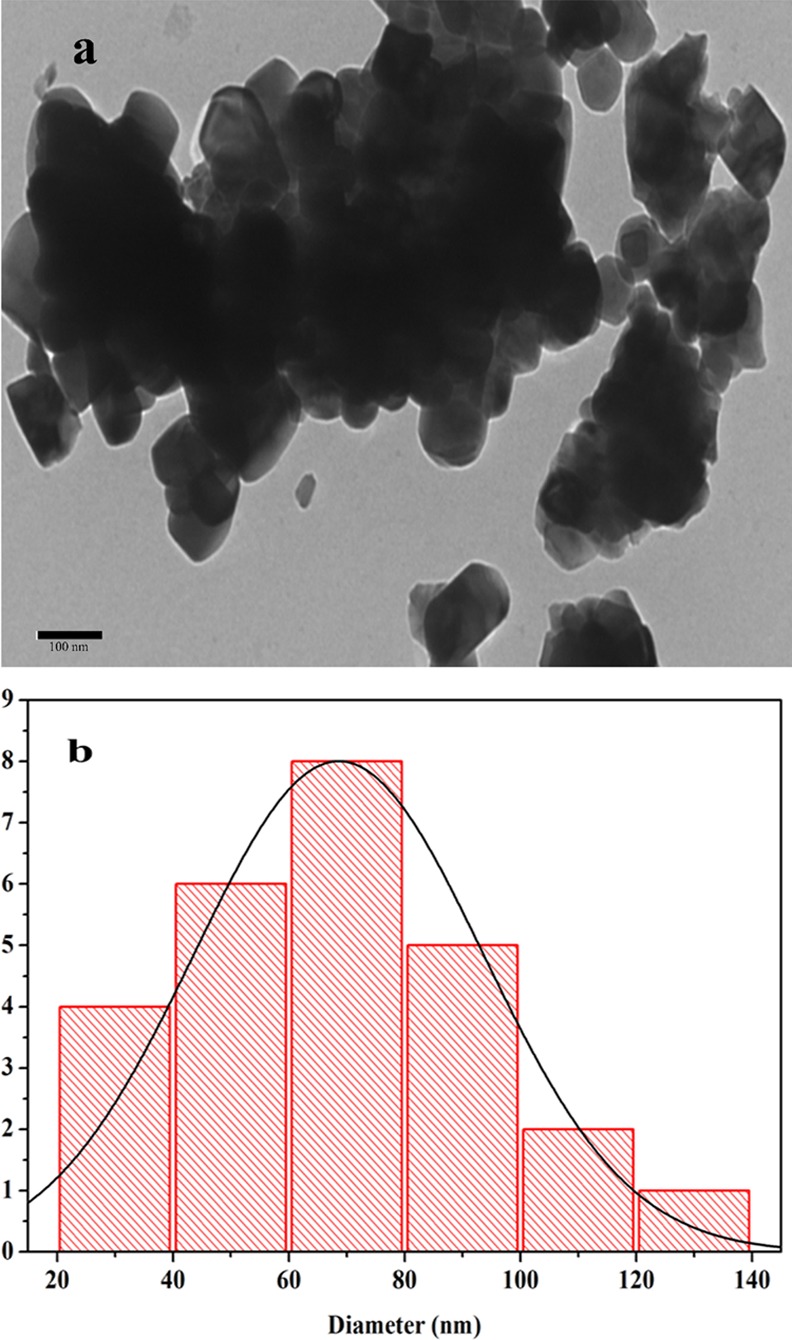
(a) TEM micrograph and (b) size distribution plot of NaTaO3 nanoparticles.
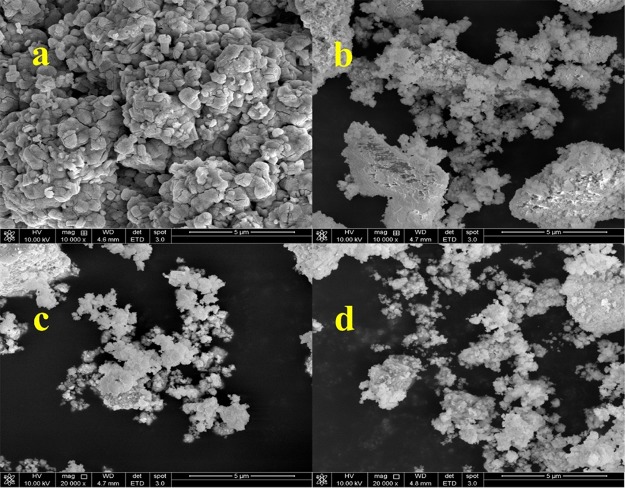
SEM measurements were carried out to elucidate the effect of annealing temperature on the surface morphologies of the as-synthesized sodium tantalate sample. Figure 4a–d represents the SEM micrographs of the as-prepared sample and the samples annealed at 500, 600, and 700 °C, respectively. It could be seen that highly agglomerated and dense nanoparticles with irregular shapes were synthesized using a polymeric citrate precursor route as shown in Figure 4a. It is also evident that the surface morphology of the as-prepared sample changes with an increase in annealing temperature (Figure 4). At low annealing temperature (500 °C), the separate particles with irregular shapes are visible in Figure 4b, while with an increase in annealing temperature, more particle segregation takes place, and the highest segregation of particles could be observed in the sample annealed at 700 °C, which promotes the grain diffusion phenomenon.
Figure 4.
SEM micrographs of (a) as-prepared NaTaO3 nanoparticles and the samples annealed at (b) 500 °C, (c) 600 °C, and (d) 700 °C temperatures.
2.4. BET Surface Area Studies
Surface area plays an important role in different properties like optical, electrical, biological, catalysis, etc. of the material. Therefore, before evaluating different properties of as-synthesized NaTaO3 nanoparticles, it becomes imperative to measure the surface area of the sample. Generally, the materials with large surface area provide more reaction and adsorption sites for catalytic processes and also improve the transport of charge carriers on the surface, which leads to enhanced photocatalytic degradation of organic pollutants.34 Adsorption–desorption measurements were carried out to establish the surface area of as-synthesized NaTaO3 nanoparticles as shown in Figure 5a. From Brunauer–Emmett–Teller (BET) surface area analysis, it was elucidated that synthesized nanoparticles possess a high surface area of 46.2 m2/g compared to the previous reports. Table 1 shows the comparison of surface area of synthesized sodium tantalate nanoparticles with previously reported literature. The use of the polymeric citrate precursor route for the synthesis of NaTaO3 controls the particle size in nanodimensions as observed in TEM analysis. Due to the small size of the synthesized nanoparticles, their surface-to-volume ratio increases, which results in the improved surface area of the final product. Similarly, compared to other methods like solid state, sol–gel, and precipitation, the use of the polymeric citrate precursor route does not require high calcination temperature to obtain the final product, which results in obtaining the nanodimensional materials; therefore, the final product retains the high surface area properties.29 From Figure 5a, it was observed that NaTaO3 nanoparticles show the type III isotherm. Pore radius of the NaTaO3sample was calculated by using the Dubinin and Astakov (DA) plot as shown in Figure 5b, which corresponds to a pore radius of 12.5 Å. Figure 5c is the Barrett–Joyner–Halenda (BJH) plot of synthesized nanoparticles, which shows the average pore size distribution of the sample centered at 22 Å.
Figure 5.
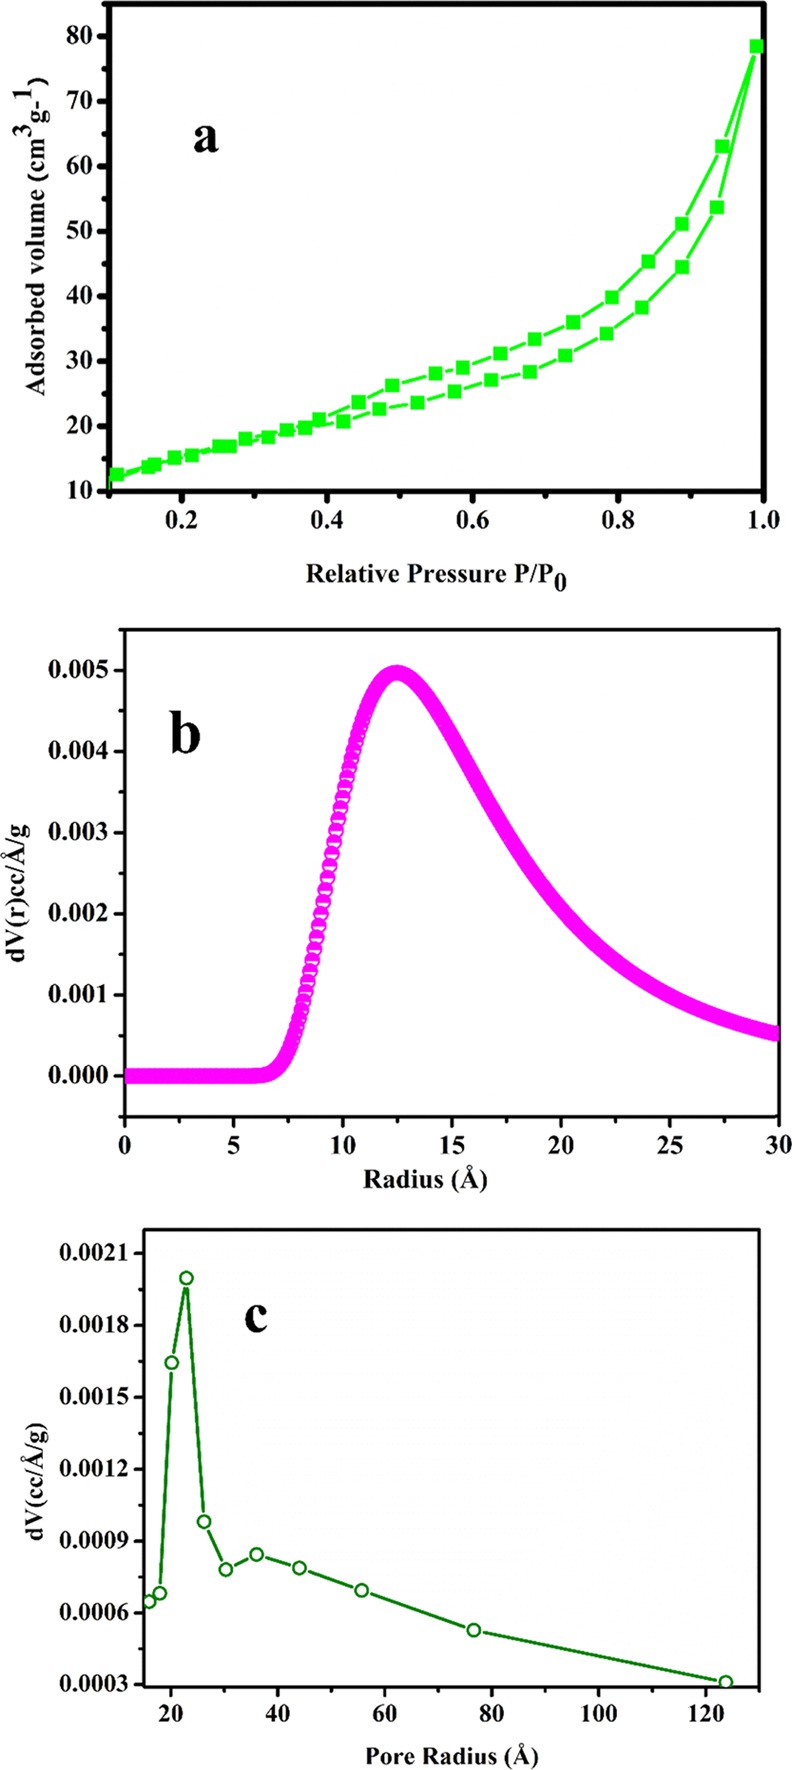
(a) B.E.T, (b) DA, and (c) BJH plots for NaTaO3 nanoparticles.
Table 1. Comparison of BET Surface Area of NaTaO3 Nanoparticles Synthesized through Different Methods.
2.5. Photocatalytic Degradation Studies
Discharge of dyes mostly from textile industries poses great risk to the biotic and abiotic components of the ecosystem.34,35 These dye effluents from textile industries cause a great hurdle for municipal waste water treatments. Under natural anaerobic degradation, these dyes are converted to potentially carcinogenic amines. Therefore, removal of dye-based effluents is recognized as a challenging task by environmentalists. Different technologies including physical and biological have been used for treatment of these dye effluents but do not achieve much organic dye degradation.35 Semiconductors are considered as an important alternative useful technology for successful removal of notorious organic dyes.13,15 Thus, to demonstrate the photocatalytic activity of NaTaO3 nanoparticles, the methylene blue (MB) dye was used as a target pollutant. The UV–visible spectrum of MB along with NaTaO3 nanoparticles as a semiconductor photocatalyst showed a characteristic peak at 663 nm. The change in intensity of the characteristic peak of the MB dye was used to observe the degradation process at different time intervals. Similar experiments were carried out without a catalyst or sunlight, which show negligible degradation, thus confirm that the degradation is truly carried out by a photocatalytic process. The photocatalytic degradation process of the MB dye was studied at neutral and alkaline pH as shown in Figures 6a,b, respectively. The peak intensity at 663 nm shows a decrease from 1.7 to 0.41 in 200 min at neutral pH (Figure 6a), whereas in alkaline pH, it decreases from 1.14 to 0.4 in 80 min as shown in Figure 6b. The characteristic peak of the MB dye shows appreciable reduction in the presence of the NaTaO3 semiconductor photocatalyst. From the MB degradation studies, it was observed that the synthesized NaTaO3 nanoparticles show enhanced photocatalytic activity as compared to the already reported NaTaO3 photocatalyst.36 In previous report, the NaTaO3 photocatalyst shows only 50% removal of the organic dye in 6 h36 while the as-prepared sample removes almost 86% MB dye in only 200 and 80 min at neutral and alkaline pH, respectively. Figure 7a,b depicts the photocatalytic efficiency of NaTaO3 nanoparticles at neutral and alkaline pH, respectively. By comparing the photocatalytic efficiency at different pHs, it was observed that NaTaO3 nanoparticles show efficient activity at alkaline pH with a removal of 86% MB dye in only 80 min; however, the degradation process takes more time (200 min for 86% dye removal) in a neutral medium. The change in photocatalytic activity with respect to pH could be explained on the basis of the isoelectric point of NaTaO3. It has been reported in the literature that the isoelectric point of NaTaO3 was calculated to be 3.5 and, above isoelectric point, NaTaO3 has OH– ions adsorbed on its surface, which increases with an increase in pH of the solution. Hence, MB being the cationic dye shows increased adsorption on the catalyst surface as pH is increased. The increased adsorption of the MB dye on active sites results in the enhanced activity of NaTaO3 nanoparticles at alkaline pH. The increased photocatalytic activity of the NaTaO3 nanoparticles compared to the previous reports could be attributed to the high surface area of as-prepared NaTaO3 nanoparticles using a polymeric citrate precursor route.
Figure 6.
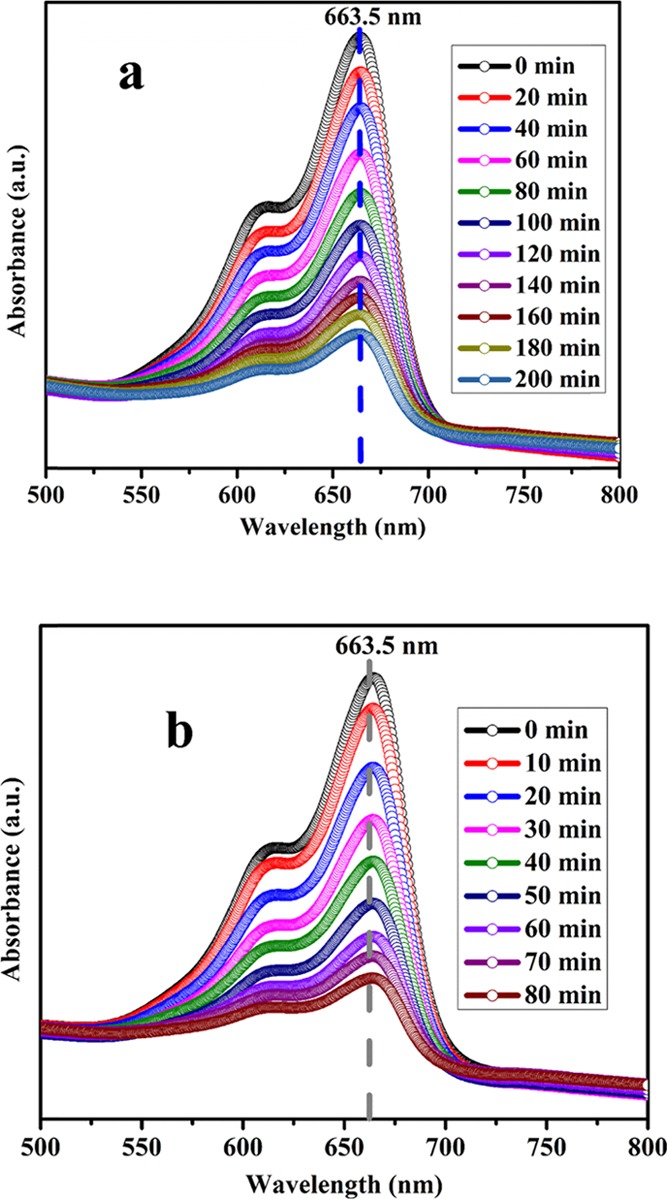
UV–visible spectra of MB dye in presence of photocatalyst in (a) neutral and (b) alkaline media.
Figure 7.
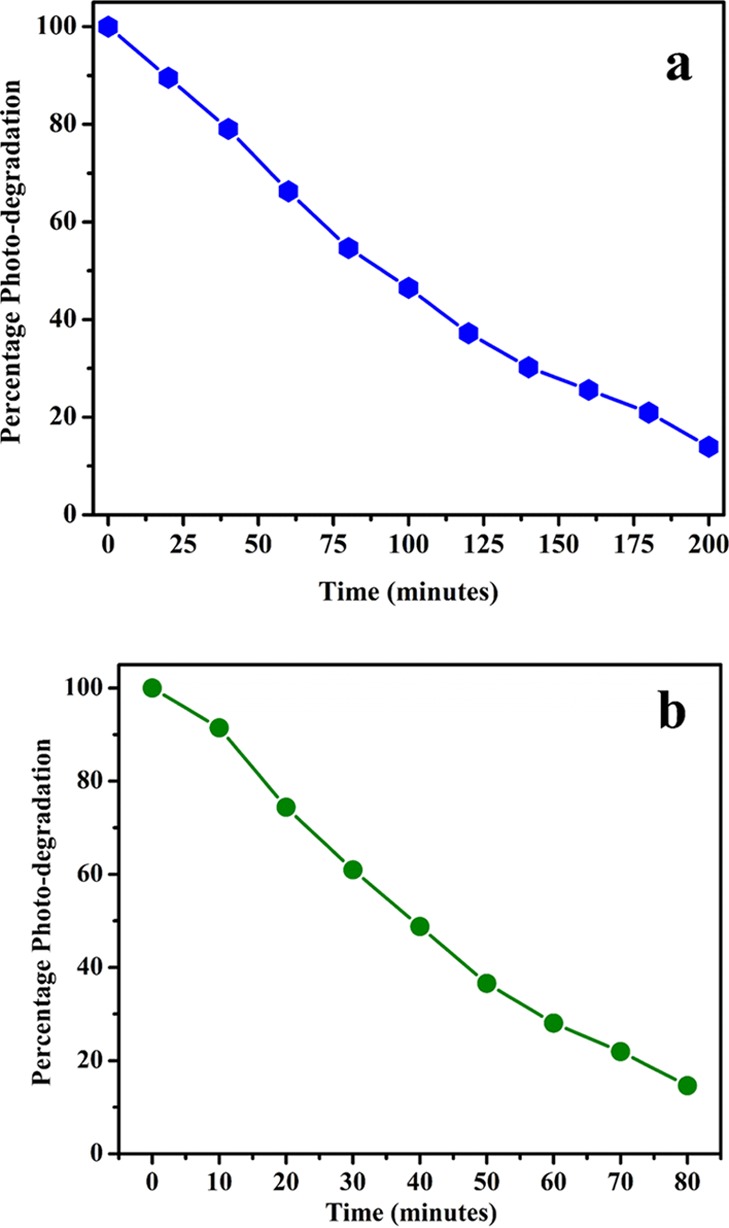
Percentage removal of MB dye using NaTaO3 photocatalyst in (a) neutral and (b) alkaline media.
2.5.1. Kinetics of Degradation
The degradation of organic waste in water mostly follows the Langmuir–Hinshelwood mechanism. The integral kinetic equation for the mechanism is written as follows
where C0 is the concentration (mol L–1) of the reactant at time t = 0, C (mol L–1) is the concentration of the reactant after time t, and R is the apparent rate constant of the pseudo-first-order photocatalytic reaction. To determine the kinetics of the degradation process in neutral and alkaline media, the calculations were fitted to a pseudo-first-order model. It was found that the plot of logarithm of relative concentration of the MB dye versus time for the NaTaO3 photocatalyst produces almost a linear plot confirming that the degradation process follows the pseudo-first-order kinetics. The apparent rate constant of the degradation process calculated from the plot of ln C0/C versus irradiation time as shown in Figure 8 is used to compare the photocatalytic activity of NaTaO3 nanoparticles in neutral and alkaline media. It was observed that NaTaO3 nanoparticles show best photocatalytic activity in the alkaline medium compared to the neutral medium (Figure 8). The rate constant of the MB degradation process using NaTaO3 nanoparticles as the catalyst was calculated to be 0.00895 and 0.2247 min–1 in neutral and alkaline media, respectively.
Figure 8.
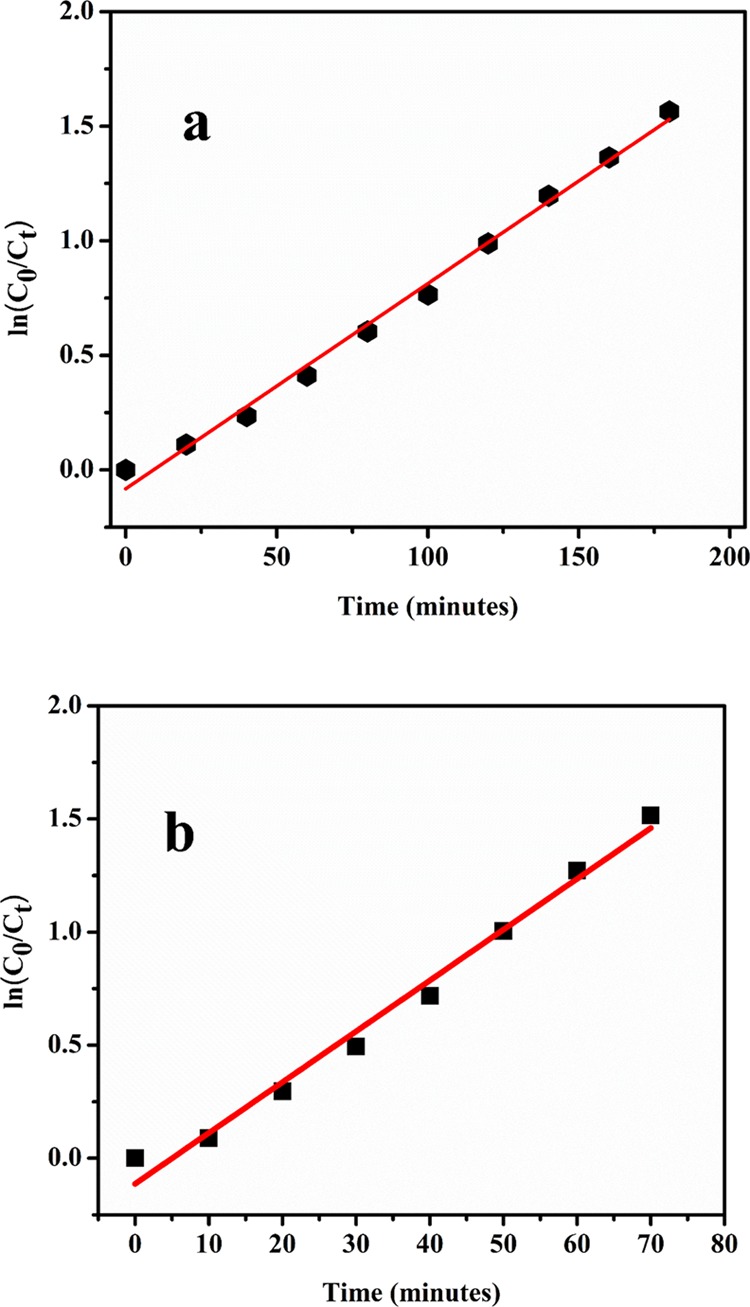
Kinetic plot of dye degradation by NaTaO3 nanoparticles in (a) neutral and (b) alkaline media.
2.5.2. Mechanism of Photocatalysis
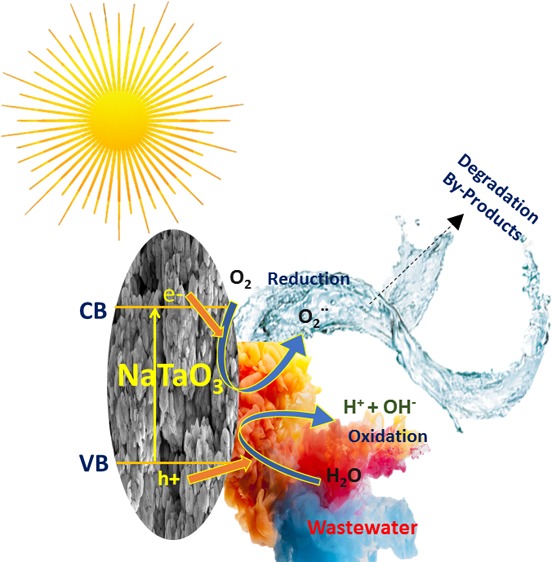
To understand the mechanism of photocatalytic degradation of MB using NaTaO3 nanoparticles as the catalyst, several scavengers were used to identify the active species taking part in the degradation process. Benzoquinone was used as a scavenger to quench the catalytic process carried out by O2·– active species, and other scavengers like AgNO3, ammonium oxalate, and isopropanol were used to quench the catalytic processes carried out by e–, h+, and OH·, respectively. All the quenchers were added to the MB dye solution before addition of the NaTaO3 nanoparticles in both neutral and alkaline media. It was observed that different scavengers reduce the photocatalytic activity to a different extent. From quenching studies, the more the activity of the photocatalyst is reduced by any scavenger, the more important is the oxidizing species in the MB degradation process. Figure 9a,b represents the photodegradation of MB in the presence of the oxidizing species scavenger in neutral and alkaline media. It was observed that photocatalytic activity of NaTaO3 is reduced substantially with addition of AgNO3, isopropanol, and benzoquinone as scavengers at different pHs, while little activity was reduced when ammonium oxalate was used as a scavenger. From the findings in Figure 9a,b, we confirmed that after involving electrons and superoxide radicals, OH· plays an important role in degradation of the MB organic dye. Although at both neutral and alkaline pH, the extent of quenching was different, but the quenching behavior of different quenchers was the same. Based on the above results, we propose the following reaction mechanism for the photocatalytic degradation process in both neutral and alkaline pH
where eCB– is the electron in the conduction band and hVB+ is the hole in the valance band.
Figure 9.
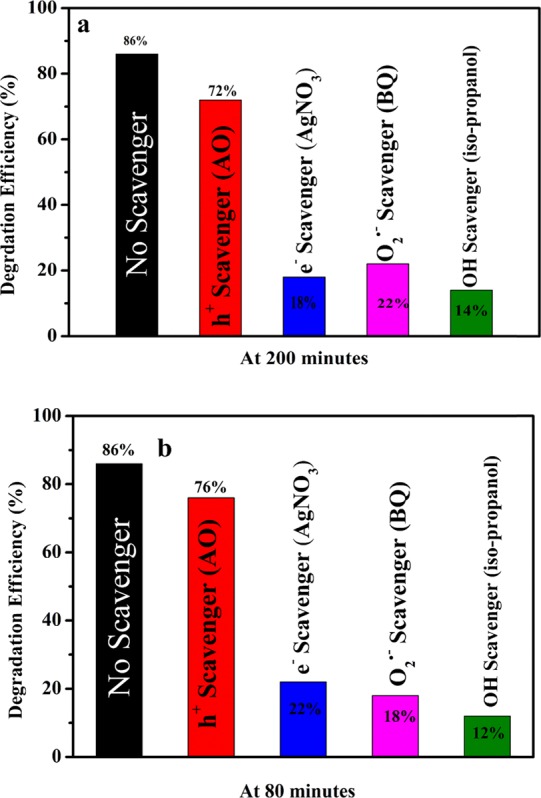
Effect of different scavengers on photocatalytic activity of NaTaO3 nanoparticles in (a) neutral and (b) alkaline media.
2.5.3. Degradation Pathway Studies
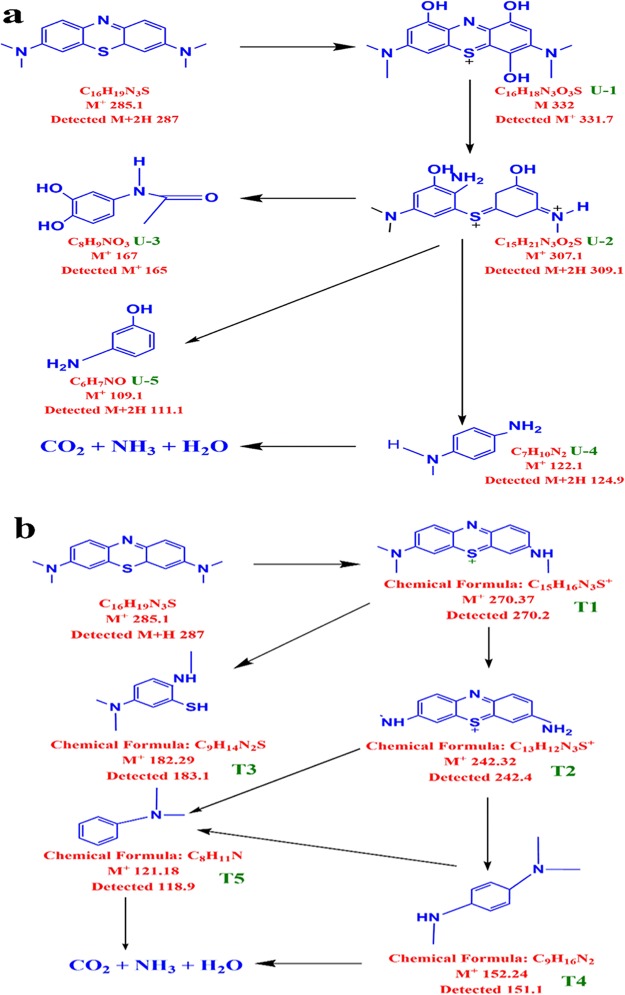
Apart from the UV–visible studies, the degradation of the MB organic dye was further confirmed by LC–MS studies. The dye sample with least intensity in the UV–vis spectrum was taken for LC–MS analysis. Figures S1 and S2 represent the mass spectra of the dye samples after degradation in neutral and alkaline media, respectively. LC–MS of the dye sample revealed different fragments formed during the photocatalytic reaction in neutral (Figure 10a) and alkaline media (Figure 10b). The structure of different fragments corresponding to different m/z values was elucidated with the help of the Chemidraw structural tool. The intermediate degradation product formed in a neutral medium with their corresponding molecular structures and m/z values is presented in Figure 10a while the corresponding molecular structures and m/z values of degradation fragments formed at alkaline pH are shown in Figure 10b. At neutral pH, the intermediates revealed that the degradation process proceeds via attack of ·OH radical on MB followed by cleavage of the —N=C— bond and —S=C— bond, which could be attributed to the easy cleavage of the π-bond. The attack of ·OH on the MB dye at neutral pH produces 3,7-bis(dimethylamino)-1,4,9-trihydroxyphenothiazin-5-ium coded as (U-1, m/z 331.7); after the formation of U-1, the breakdown of —N=C— occurs resulting in the formation of (Z)-(2-amino-5-(dimethylamino)-3-hydroxyphenyl)(E)-3-hydroxy-5-(methylimino)cyclohex-3-en-1-ylidene)sulfonium (U-2, m/z = 307.1). Similarly, different fragments like N-(3,4-dihydroxyphenyl)acetamide (U-3, m/z = 165), N1-methylbenzene-1,4-diamine (U-4m/z 124.9), and 3-aminophenol (U-5m/z 111.1) were obtained from the cleavage of U-2 (Figure 10 a).
Figure 10.
Degradation pathway of MB dye in presence of NaTaO3 photocatalyst at (a) neutral and (b) alkaline pH.
Figure 10 b represents the fragmentation process of MB dye solution in the presence of NaTaO3 nanoparticles under alkaline conditions, which was deduced from LC–MS studies (Figure S2). In an alkaline medium, it was observed that the photodegradation of MB occur through the n-dealkylation reaction of aliphatic amine resulting in the formation of T1 with an m/z value of 270.2. The n-dealkylation reaction of tertiary aliphatic amine is further followed by second and third n-dealkylation of aliphatic amine groups resulting in the formation of T2 with an m/z value of 242.4. The further fragmentation process results in the formation of T3, T4, T5, and T6 with m/z values equal to 183.1, 151.1, 137.1, and 118.9, respectively.
2.6. Electrical Properties
2.6.1. Dielectric Properties
The detailed investigation of variation of dielectric constant (ε) and dielectric loss (D) of NaTaO3 nanoparticles annealed at different temperatures (500, 600, and 700 °C) with frequency and temperature has been carried out as shown in Figures 11–13. The variation of ε and D of NaTaO3 nanoparticles annealed at 500, 600, and 700 °C with frequency ranging from 20 Hz to 1 MHz at 100 °C is shown in Figure 11a–c, respectively. It could be seen that at lower frequency, the sample annealed at 500, 600, and 700 °C shows a nonlinear decrease in dielectric constant with frequency at 100 °C. This frequency dependency of dielectric constant is known as dielectric dispersion.37 Such behavior can be explained by the dipole relaxation phenomenon. At low frequencies, the space charges have an adequate amount of time to follow the frequency of the applied field and undergo the relaxation process, whereas at higher frequencies, these space charges are not able to undergo the relaxation process. This dielectric behavior can be primarily explained by Maxwell–Wagner polarization or space charge polarization relaxation induced by applied bias.32 Similar observations were made in the case of dielectric loss, that is, with an increase in frequency, dielectric loss also shows large dispersion at low frequency and remains constant at higher frequencies. From the results, it is observed that with an increase in frequency, the value of dielectric loss decreases, and this behavior of dielectric loss could be explained by Koop’s phenomenological theory.38
Figure 11.
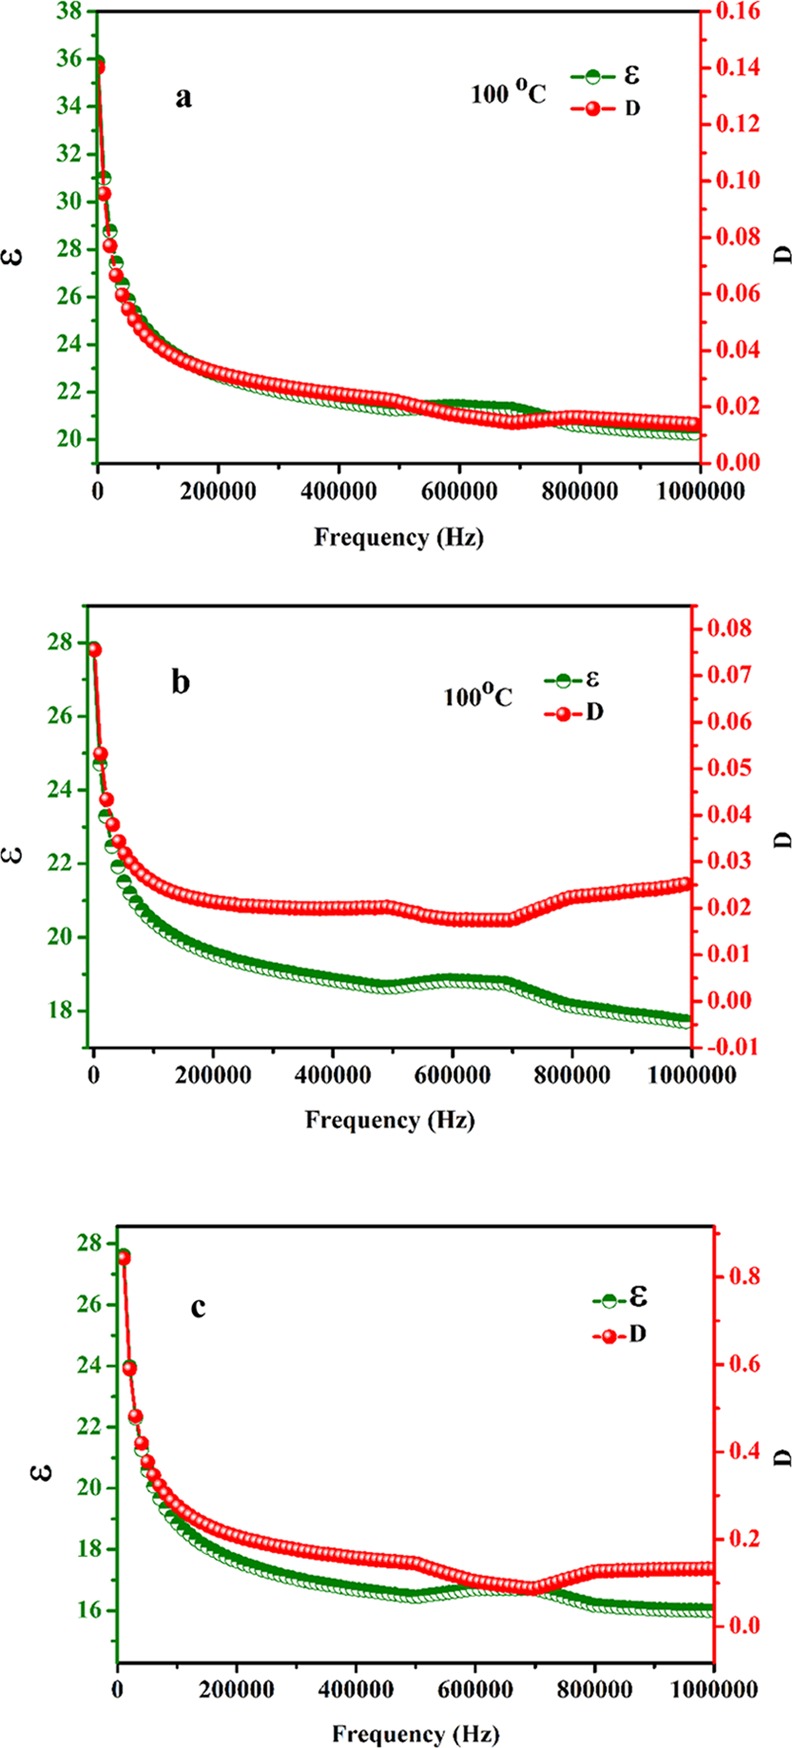
Variation of dielectric constant and dielectric loss with frequency (at 100 °C) of NaTaO3 nanoparticles annealed at (a) 500 °C, (b) 600 °C, and (C) 700 °C.
Figure 13.
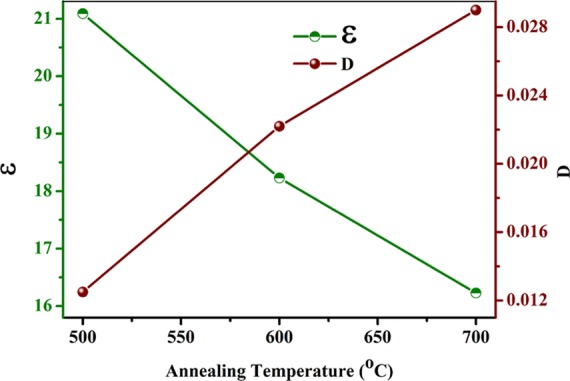
Variation of dielectric constant and dielectric loss of NaTaO3 nanoparticles with annealing temperatures.
Further, the dependence of dielectric properties of the NaTaO3 nanoparticles across a temperature range of 50–500 °C was measured at 500 kHz as shown in Figure 12a–c. It is observed from the temperature dependence of dielectric constant results that with an increase in temperature, the dielectric constant showed high stability up to 250 °C, and with a further increase in temperature, dielectric constant increases up to 400 °C for the samples annealed at 500 and 600 °C; however, beyond this, temperature dielectric constant decreases as shown in Figure 12a,b, respectively. This decrease in dielectric constant above 400 °C may be attributed to the phase transition of NaTaO3 nanoparticles.39 At about 400 °C, the room-temperature orthorhombic structure with a space group Pbnm changes to orthorhombic geometry with a space group Cmcm.(39) The sample annealed at 700 °C shows less stable and low dielectric constant with respect to temperature at 500 kHz. The sample annealed at 700 °C does not show this decrease in dielectric constant above 400 °C. Similarly, dielectric loss of all the samples is also strongly dependent on temperature as shown in Figure 12a–c. The stable dielectric constant up to 250 °C and comparable low dielectric loss of as-prepared NaTaO3 nanoparticles annealed at 500 °C provide the promising solution for high-temperature dielectrics.
Figure 12.
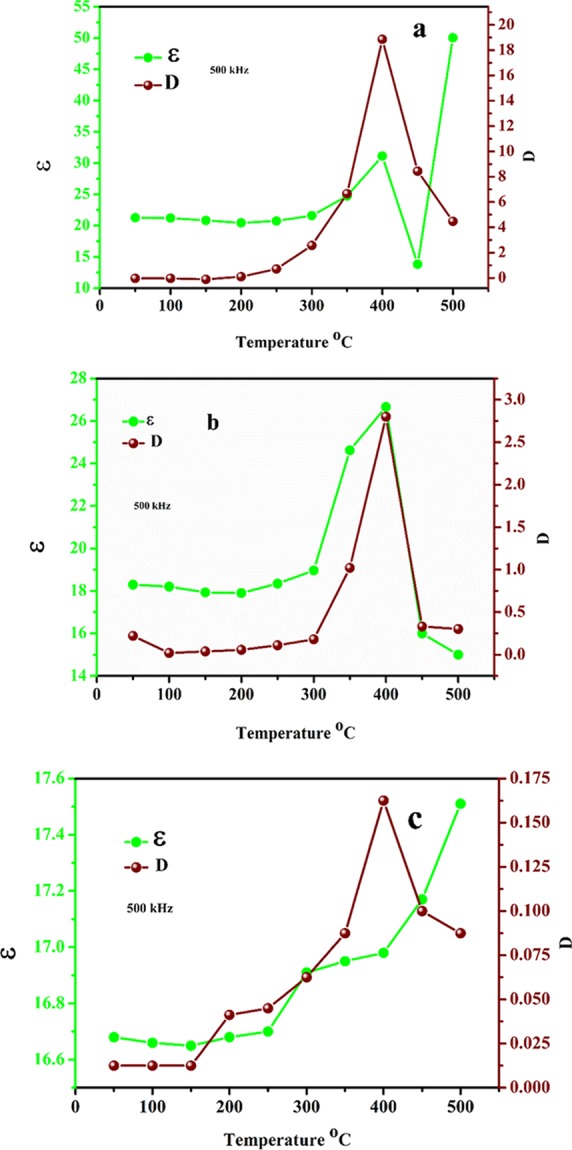
Variation of dielectric constant and dielectric loss with temperature at 500 kHz frequency of NaTaO3 nanoparticles annealed at (a) 500 °C, (b) 600 °C, and (c) 700 °C.
The stable dielectric constant at 500 kHz of NaTaO3 samples annealed at 500, 600, and 700 °C was found to be 21.5, 18, and 16, respectively, as observed in Figure 12. From previous reports, it was observed that annealing temperature strongly affects the dielectric properties of the material.40Figure 13 represents the annealing temperature versus dielectric properties plot measured at 500 kHz at 100 °C. From the plot, it can be observed that dielectric constant decreases with an increase in annealing temperature and dielectric loss increases with an increase in annealing temperature as shown in Figure 13. From the results, it is observed that NaTaO3 nanoparticles annealed at 500 °C show a dielectric constant of 21.5 and dielectric loss of 0.012 at 100 °C and 500 kHz. The decrease in dielectric constant with an increase in annealing temperature can be attributed to a decrease in particle size of the nanoparticles as is observed in SEM results of the samples annealed at different temperatures discussed earlier in the manuscript. The decrease in dielectric constant with an increase in annealing temperature may be due to the decrease in density of the packing grains in the samples annealed at higher temperatures as observed in SEM micrographs.27 Also, as per conductivity model, the conductivity of the material is controlled by the defect sites present in the sample. With an increase in annealing temperature, the number of defects present in the material is decreased, which results in a decrease of conductivity of the materials. Therefore, with an increase in annealing temperature, the conductivity of the material is decreased; hence, dielectric constant also decreases with an increase in the annealing temperature.19
2.6.2. AC Conductivity Studies
Figure 14 represents the variation of electrical conductivity with frequency of the three samples annealed at different temperatures, which was employed to understand the relaxation process taking place in synthesized nanoparticles. It is clear from the figure that with an increase in operating temperature and frequency, the conductivity of all the samples increases. In general, the increase in the ac conductivity in dielectric materials is attributed to the increase in mobility of electrons or other charge carriers.41 At lower temperatures, the conductivity of NaTaO3 nanoparticles is almost independent on frequency, which is due to low thermal energies of the electrons and hence do not take part in the conduction process. However, at high temperature, the thermal energies of the electrons are sufficient enough to cross the grain boundaries, which lead to high mobility of the electrons and hence increase the conductivity of the material.42,43 The mechanism of conductivity was explained by using fitting of power law (σ = Aωη) where the value of “η” determines the mechanism responsible for conductivity. For η > 1, the conductivity follows the Maxwell–Wagner relaxation process while for η < 1, conductivity shows the correlated barrier hopping (CBH) mechanism.42 From the fitting of power law, the values of “η” obtained were greater than 1; therefore, the conduction follows the Maxwell–Wagner relaxation process.
Figure 14.
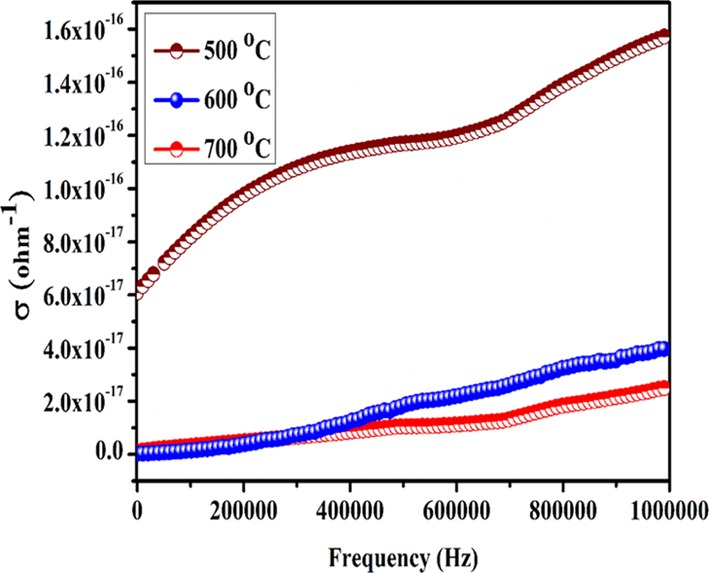
The change of ac conductivity with frequencies (at 100 °C) of NaTaO3 nanoparticles annealed at 500, 600, and 700 °C.
2.6.3. Piezoelectric Properties
The presence of distortion in the lattice structure of perovskites is mainly responsible for many interesting electrical properties, like ferroelectricity and relaxor behavior. Keeping in view of the fact of the distortion in NaTaO3 nanoparticles from a perfect perovskite structure, P-E studies were performed. The P-E measurements at 1 Hz for NaTaO3 nanoparticles annealed at 500 °C showed a narrow and unsaturated hysteresis loop as shown in Figure 15a. The remanent polarization Pr and saturation polarization Ps for the sample were found to be 0.0013 and 0.21μC/cm2, respectively, with a coercive field of −3.245 kV/cm as shown in the inset of Figure 15a. The presence of the P-E loop (though unsaturated) is the conclusive evidence for the sign of ferroelectric properties in as-prepared NaTaO3 nanoparticles. It is also evident that NaTaO3 nanoparticles have incomplete saturation of the hysteresis loop (Figure 15a), showing that domains are still growing in the synthesized nanoparticles.44 Such a type of unsaturated behavior is due to weak ferroelectric properties of the material and therefore needs higher fields to switch the domain polarization. In perovskite ferroelectrics, the atomic displacements during the switching polarization result in the polarity changes in the lattice via a displacement mechanism, which is the main reason for ferroelectric behavior of perovskite materials.45 The P-E measurements of NaTaO3 nanoparticles also show some lossy character as there is a break in the P-E hysteresis loop in the as-prepared nanoparticles (Figure 15a). The lossy character of the sample may be attributed to the band structure of the NaTaO3. It is reported in the literature that the semiconductor ferroelectrics have high chances to undergo the leakage losses compared to the insulator ferroelectrics.46
Figure 15.
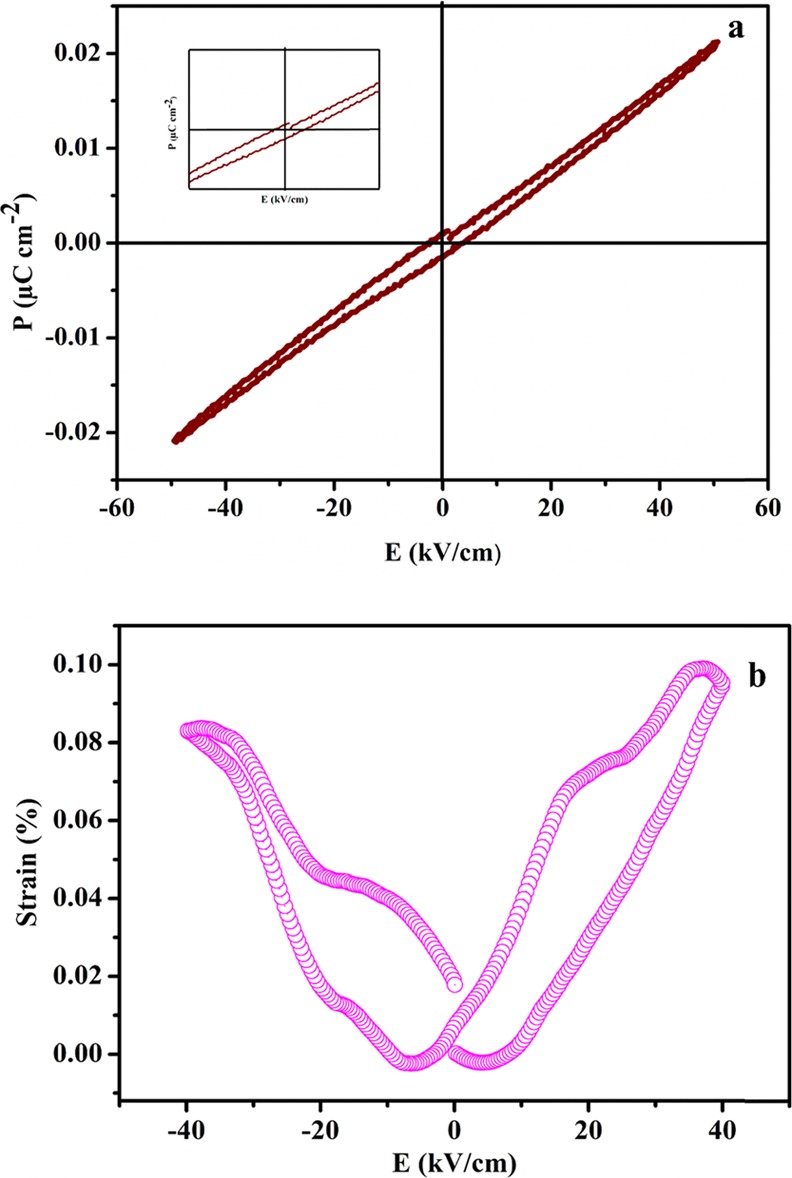
(a) P-E hysteresis and (b) S-E butterfly loops of as-prepared NaTaO3 nanoparticles.
To the best of our knowledge, the piezoelectric property of the pristine NaTaO3 nanopowder was investigated for the first time using a converse piezoelectric technique. The strain-electric field (S-E) loop measurement was carried out at 40 kV/cm as shown in Figure 15b, which exhibits piezoelectric displacement from NaTaO3 nanopowder under the application of bipolar voltage. A typical butterfly loop was observed under bipolar voltage, which is the characteristic feature of ferroelectric materials at ambient temperature. As the applied voltage crosses coercive voltage, the butterfly loop is formed due to the polarization direction reorientation in the ferroelectric materials.47 The maximum strain under bipolar voltage was found to be 0.10% for NaTaO3 nanoparticles. The synthesized nanoparticles exhibited polarization and switching hysteresis, which show the presence of the piezoelectric property. The strain % present in the nanosized NaTaO3 is not too high as compared to the other perovskite materials like lead-based piezoelectric materials but is comparable to many lead-free-based piezoelectric ceramics such as (1 – x)(K0.48Na0.52)(Nb0.95–y–zTazSby)O3–xBi0.5(Na0.82K0.18)0.5ZrO3.48 It has been observed that there are different factors, which are responsible for the outstanding piezoelectric performances of the materials. Among all these factors, the microstructure plays an important role in enhancing the piezoelectric response of the synthesized materials. During the polling process, the nanorange domain wall energy results in the polarization rotation, which in turn results in the enhanced piezoelectric performance. Therefore, the nanodimensional domains of NaTaO3 could be the possible reason for its reasonable piezoelectric strain. As a result, high-surface-area NaTaO3 nanoparticles are an effective photocatalyst with high dielectric constant and low dielectric loss and show comparable piezoelectric strain with respect to many lead-free piezoelectric materials.
3. Conclusions
High-surface-area nanosized NaTaO3 was fabricated by a polymeric citrate precursor route. X-ray diffraction study confirms the monophasic and highly crystalline nature of as-prepared NaTaO3 nanoparticles. The photocatalytic activity of NaTaO3 nanoparticles was investigated by using the methylene blue dye as the model pollutant. The presence of large-surface active sites results in the enhanced photocatalytic activity of the nanoparticles in both neutral and alkaline media. The degradation of 86% methylene blue dye was achieved in 200 min at neutral pH; however, in alkaline pH, it takes only 80 min. The results showed that NaTaO3 nanoparticles with high surface area could act as a better photocatalyst under sunlight irradiation at alkaline pH. Sodium tantalate nanoparticles annealed at 500 °C show enhanced stable dielectric properties with a dielectric constant of 21.5 and dielectric loss of 0.012 at 500 kHz. Also, the material shows great temperature stability of dielectric properties up to 250 °C over a frequency range of 20 Hz to 1 kHz. An increase in the annealing temperature leads to the decrease in dielectric properties due to segregation of nanoparticles. In addition to dielectric properties, ferroelectric and piezoelectric properties of nanoparticles were also studied. It was observed that pristine NaTaO3 nanoparticles show a reasonable piezoelectric response (0.10% bipolar strain) as compared to many lead-free piezoelectric materials. As-prepared NaTaO3 nanoparticles with high surface area could be used in efficient photocatalysis and efficient energy storage capacity devices having a reasonable piezoelectric property for development of the lead-free piezoelectric materials.
4. Experimental Section
4.1. Materials
The chemicals used are citric acid monohydrate (C6H8O7·H2O, Merck, 99%), ethylene glycol (C2H6O2, SRL), sodium hydroxide (NaOH, Merck, 97%) as the Na source, Tantalum oxide (Ta2O5, Alfa Aesar, 99.9985%) as Ta source, silver nitrate (AgNO3, Alfa Aesar, 99.5%), benzoquinone (Merck, 97%), ammonium oxalate (Merck), and isopropanol (RANKEM, 99%). Methylene blue (MB) (C16H18ClN3S.xH2O, Merck) was used as the model pollutant. All the chemicals except citric acid were used as such without any further treatment. Citric acid was dried in an oven before it was used for the reaction.
4.2. Synthesis of Sodium Tantalate Nanoparticles
Nanosized NaTaO3 with high surface area was synthesized by a polymeric citrate precursor route using Ta2O5 and NaOH in a molar ratio of 1:1. Ta2O5 (0.1 mol) was dispersed in water followed by addition of ethylene glycol (EG) and citric acid (CA) in the molar ratio of EG/metal ion/CA as 10:1:40. After 2 h stirring at room temperature, 0.1 mol of NaOH solution was added to the reaction mixture. The reaction content was stirred and heated at 60 °C until a viscous gel is formed. To evaporate the whole solvent, the reaction mixture was heated at 135 °C for 12 h in a muffle furnace. The temperature of the furnace was further increased to 300 °C for 2 h to get the charred black mass precursor. After cooling naturally, the black mass precursor was crushed to fine powder using a mortar pestle. To remove the excess carbonaceous content, the charred precursor powder was heated at 700 °C for 12 h to get the final product. The detailed mechanism of the synthesis procedure is discussed somewhere else.15 Prior to use for further analysis, the obtained powder was again ground using a mortar and pestle. The whole reaction scheme is summarized in Figure S3.
4.3. Characterization
X-ray diffraction (XRD) patterns of synthesized NaTaO3 nanoparticles were obtained using a powder X-ray diffractometer (Rikagu Japan) using Ni-filtered Cu Kα radiations with λ = 1.540 Å in a 2θ range of 10–80°, and the step size for the XRD studies was 0.05 °/s. FT-IR of nanoparticles was recorded on an Affinity-1 Shimadzu FT-IR spectrophotometer by using nanoparticles with KBr pellets. Origin 8.5 software was used to analyze the structural parameters. Transmission electron microscopy (TEM) was employed to take TEM micrographs of the sample to elucidate the particle size and morphology. TEM micrographs were obtained using an FEI Tecnai G20 HRTEM. Sample preparation was done by drop casting of the dispersed sample onto a copper grid coated with carbon and was air-dried before mounting on a microscope. The accelerating voltage used for TEM studies was 200 kV. To probe the effect of annealing temperature on the surface morphologies of the synthesized nanoparticles, scanning electron microscopy (SEM) measurements were performed. SEM measurements were performed with the aid of NOVA FE-SEM at an operating accelerating voltage of 20 kV. Prior to analysis, a small amount of dry sample was mounted on a carbon tape coated with an ultrathin layer of gold to prevent the surface charging effect. The SEM micrographs were observed at magnification of 50,000 to their original size. A Quantachrome surface area analyzer having model no. Nova 2000e was employed to measure the surface area of the as-synthesized sample. Brunauer–Emmett–Teller (BET) surface area studies of the synthesized nanoparticles were studied using multipoint nitrogen adsorption–desorption isotherm measurements. The isotherm conditions were obtained by using liquid nitrogen temperature (≈77 K). In addition to surface area, pore radius and pore size distribution of as-prepared NaTaO3 nanoparticles were also elucidated using BET studies.
Dielectric measurements of the NaTaO3 sample were analyzed in air over a temperature range from 50 to 500 °C with a frequency of 20 Hz to 1 MHz. An HF-LCR meter from Wayne Kerr Electronics (U.K., 6500 P) was used for the analysis of dielectric measurements. Dependence of the polarization hysteresis loop on strain-field S-E and electric field P-E was investigated. The S-E and P-E loop measurements were carried out using aixACCT System GmbH. Disk-shaped pellets with a diameter of 8 mm and thickness of 0.5 mm were used to carry out all the electrical measurements. The pellets were prepared by using 5% poly(vinyl alcohol) (PVA) as a binder and applying a uniaxial pressure of 5 tons by using a KBr press hydraulic machine (Model M-5, Technosearch Instruments). For dielectric measurements, the pellets were annealed at different temperatures ranging from 500 to 700 °C to find the effect of annealing temperature on dielectric properties of NaTaO3. For P-E and S-E loop studies, the pellet was annealed at 500 °C. Silver paste (Ted Pella, Inc.) was used to develop a thin layer over the surface of pellets to form a conducting contact.
4.4. Photocatalytic Studies
Photocatalytic activity of as-synthesized nanoparticles was elucidated by using the methylene blue (MB) dye as a model pollutant. During the study, an aqueous stock solution of MB with a concentration of 1 × 10⁻⁵ M was prepared. In 50 mL of the dye solution, 20 mg of nanoparticles was dispersed and was kept in the dark for 1 h to obtain the adsorption–desorption equilibrium between the NaTaO3 nanocatalyst and the dye. The dye–catalyst suspension was then exposed to the sunlight irradiation to initiate the photocatalytic degradation reaction. After every 10 min, adequate aliquots were taken and centrifuged to remove the suspended catalyst particulates for analysis. Similar experiments were carried out either in the dark or without a catalyst to confirm that the degradation process is solely photocatalytic driven. The efficiency of the catalyst for the photodegradation process was monitored by a change in intensity of the characteristic absorption peak of MB at ≈664 nm using a T-80 UV/vis spectrometer (PG Instruments Ltd.). The percentage removal of the dye was computed by using following equation
where Ci is the initial concentration of the MB dye after the adsorption–desorption equilibrium before irradiation and Cf is the concentration of the dye after time interval t (in minutes). To find out whether the dye has been degraded or not, liquid chromatography–mass spectroscopy (LC–MS) of the dye solution was carried out. Mass spectral studies were carried out by using an API 2000 Applied Biosystem LCMS/MS/MS instrument.
To elucidate the mechanism of photocatalytic degradation of MB using as-synthesized NaTaO3 under sunlight irradiation, trapping experiments were carried out. Controlled experiments were carried out in similar fashion as that of dye degradation except addition of (10 mM) scavenger species to the MB dye solution before addition of the NaTaO3 photocatalyst. To explore the active species responsible for photocatalytic degradation of the MB dye, ammonium oxalate, AgNO3, benzoquinone, and isopropanol were used as scavengers for holes (h+), electrons (e–), superoxide radical anions (O2·–), and hydroxyl radical (OH·), respectively.
Acknowledgments
T.A. thanks the MHRD, Govt. of India for research scheme SPARC/2018-2019/P843/SL for financial support. Authors also thank CIF, Jamia Millia Islamia for the X-ray diffraction and AIIMS, New Delhi for the electron microscopic studies. U.F. thanks UGC for the research fellowship. The authors extend their sincere appreciation to Researchers Supporting Project Number (RSP-2019/29), King Saud University, Riyadh, Saudi Arabia for funding this research.
Supporting Information Available
The Supporting Information is available free of charge on the ACS Publications website at DOI: 10.1021/acsomega.9b02830.
Figure S1: LC–MS spectra at neutral pH; Figure S2: LC/MS spectra at alkaline pH; Figure S3: schematic reaction scheme (PDF)
The authors declare no competing financial interest.
Supplementary Material
References
- Ao Y.; Xu J.; Fu D.; Shen X.; Yuan C. A Novel Magnetically Separable Composite Photocatalyst: Titania-Coated Magnetic Activated Carbon. Sep. Purif. Technol. 2008, 61, 436–441. 10.1016/j.seppur.2007.12.007. [DOI] [Google Scholar]
- Ung T.; Liz-Marzán L. M.; Mulvaney P. Optical properties of thin films of Au@SiO2particles. J. Phys. Chem. B 2001, 105, 3441–3452. 10.1021/jp003500n. [DOI] [Google Scholar]
- Wang C.; Ao Y.; Wang P.; Hou J.; Qian J. A facile method for the preparation of titania-coated magnetic porous silica and its photocatalytic activity under UV or visible light. Colloids Surf., A 2010, 360, 184–189. 10.1016/j.colsurfa.2010.02.030. [DOI] [Google Scholar]
- Hou J.; Cao R.; Jiao S.; Zhu H.; Kumar R. V. PANI/Bi12TiO20 Complex Architectures: Controllable Synthesis and Enhanced Visible-Light Photocatalytic Activities. Applied Catalysis B: Environmental 2011, 104, 399–406. 10.1016/j.apcatb.2011.02.032. [DOI] [Google Scholar]
- Malato S.; Fernández-Ibáñez P.; Maldonado M. I.; Blanco J.; Gernjak W. Decontamination and Disinfection of Water by Solar Photocatalysis: Recent Overview and Trends. Catal. Today 2009, 147, 1–59. 10.1016/j.cattod.2009.06.018. [DOI] [Google Scholar]
- White R. J.; Luque R.; Budarin V. L.; Clark J. H.; MacQuarrie D. J. Supported Metal Nanoparticles on Porous Materials. Methods and Applications. Chem. Soc. Rev. 2009, 38, 481–494. 10.1039/B802654H. [DOI] [PubMed] [Google Scholar]
- Yoshida H.; Kuwauchi Y.; Jinschek J. R.; Sun K.; Tanaka S.; Kohyama M.; Shimada S.; Haruta M.; Takeda S. Visualizing Gas Molecules Interacting with Supported Nanoparticulate Catalysts at Reaction Conditions. Science 2012, 335, 317–319. 10.1126/science.1213194. [DOI] [PubMed] [Google Scholar]
- Scanlon D. O.; Dunnill C. W.; Buckeridge J.; Shevlin S. A.; Logsdail A. J.; Woodley S. M.; Catlow C. R. A.; Powell M. J.; Palgrave R. G.; Parkin I. P.; et al. Band Alignment of Rutile and Anatase TiO2. Nat. Mater. 2013, 12, 798–801. 10.1038/nmat3697. [DOI] [PubMed] [Google Scholar]
- Zuo F.; Bozhilov K.; Dillon R. J.; Wang L.; Smith P.; Zhao X.; Bardeen C.; Feng P. Active Facets on Titanium(III)-Doped TiO2: An Effective Strategy to Improve the Visible-Light Photocatalytic Activity. Angew. Chem., Int. Ed. 2012, 51, 6223–6226. 10.1002/anie.201202191. [DOI] [PubMed] [Google Scholar]
- Fujishima A.; Honda K. Electrochemical Photolysis of Water at a Semiconductor Electrode. Nature 1972, 238, 37–38. 10.1038/238037a0. [DOI] [PubMed] [Google Scholar]
- Alshehri S. M.; Ahmed J.; Ahamad T.; Alhokbany N.; Arunachalam P.; Al-Mayouf A. M.; Ahmad T. Synthesis, Characterization, Multifunctional Electrochemical (OGR/ORR/SCs) and Photodegradable Activities of ZnWO4 Nanobricks. J. Sol-Gel Sci. Technol. 2018, 87, 137–146. 10.1007/s10971-018-4698-7. [DOI] [Google Scholar]
- Ahmed J.; Ahamad T.; Alhokbany N.; Almaswari B. M.; Ahmad T.; Hussain A.; Al-Farraj E. S. S.; Alshehri S. M. Molten Salts Derived Copper Tungstate Nanoparticles as Bifunctional Electro Catalysts for Electrolysis of Water and Supercapacitor Applications. ChemElectroChem 2018, 5, 3938–3945. 10.1002/celc.201801196. [DOI] [Google Scholar]
- Ahmad T.; Phul R.; Alam P.; Lone I. H.; Shahazad M.; Ahmed J.; Ahamad T.; Alshehri S. M. Dielectric, Optical and Enhanced Photocatalytic Properties of CuCrO2 Nanoparticles. RSC Adv. 2017, 7, 27549–27557. 10.1039/C6RA26888A. [DOI] [Google Scholar]
- AlShehri S. M.; Ahmed J.; Ahamad T.; Arunachalam P.; Ahmad T.; Khan A. Bifunctional Electro-catalytic Performances of CoWO4 Nanocubes for Water Redox Reactions (OER/ORR). RSC Adv. 2017, 7, 45615–45623. 10.1039/C7RA07256B. [DOI] [Google Scholar]
- Ahmad T.; Farooq U.; Phul R. Fabrication and Photocatalytic Applications of Perovskite Materials with Special Emphasis on Alkali-Metal-Based Niobates and Tantalates. Ind. Eng. Chem. Res. 2018, 57, 18–41. 10.1021/acs.iecr.7b04641. [DOI] [Google Scholar]
- Shi J.; Liu G.; Wang N.; Li C. Microwave-Assisted Hydrothermal Synthesis of Perovskite NaTaO3 Nanocrystals and Their Photocatalytic Properties. J. Mater. Chem. 2012, 22, 18808–18813. 10.1039/C2JM33470D. [DOI] [Google Scholar]
- Hu C. C.; Tsai C. C.; Teng H. Structure Characterization and Tuning of Perovskite-like NaTaO3for Applications in Photoluminescence and Photocatalysis. J. Am. Ceram. Soc. 2009, 92, 460–466. 10.1111/j.1551-2916.2008.02869.x. [DOI] [Google Scholar]
- Shanker V.; Samal S. L.; Pradhan G. K.; Narayana C.; Ganguli A. K. Nanocrystalline NaNbO3 and NaTaO3: Rietveld Studies, Raman Spectroscopy and Dielectric Properties. Solid State Sciences 2009, 11, 562–569. 10.1016/j.solidstatesciences.2008.08.001. [DOI] [Google Scholar]
- Farooq U.; Phul R.; Alshehri S. M.; Ahmed J.; Ahmad T. Electrocatalytic and Enhanced Photocatalytic Applications of Sodium Niobate Nanoparticles Developed by Citrate Precursor Route. Sci. Rep. 2019, 9, 4488–4505. 10.1038/s41598-019-40745-w. [DOI] [PMC free article] [PubMed] [Google Scholar]
- Ortiz P.; Facchetti A.; Marks T. J. High- k Organic , Inorganic and Hybrid Dielectrics for Low-Voltage Organic Field-Effect Transistors. Chem. Rev. 2009, 110, 205–239. 10.1021/cr9001275. [DOI] [PubMed] [Google Scholar]
- Wang Y.; Xu N.; Zhang Q.; Yang H. Phase Transition and Piezoelectric Properties of Alkali Niobate Ceramics through Composition Tuning. RSC Adv. 2015, 5, 61989–61997. 10.1039/C5RA10331B. [DOI] [Google Scholar]
- Hu D.; Ma H.; Tanaka Y.; Zhao L.; Feng Q. Ferroelectric Mesocrystalline BaTiO3/SrTiO3Nanocomposites with Enhanced Dielectric and Piezoelectric Responses. Chem. Mater. 2015, 27, 4983–4994. 10.1021/acs.chemmater.5b01368. [DOI] [Google Scholar]
- Li Q.; Chen L.; Gadinski M. R.; Zhang S.; Zhang G.; Li H. U.; Iagodkine E.; Haque A.; Chen L.-Q.; Jackson T. N.; Wang Q. Flexible High-Temperature Dielectric Materials from Polymer Nanocomposites. Nature 2015, 523, 576–579. 10.1038/nature14647. [DOI] [PubMed] [Google Scholar]
- Guo R.; Cross L. E.; Park S.-E.; Noheda B.; Cox D. E.; Shirane G. Origin of the High Piezoelectric Response in PbZr1-XTixO3. Phys. Rev. Lett. 2000, 84, 5423–5426. 10.1103/PhysRevLett.84.5423. [DOI] [PubMed] [Google Scholar]
- Ahmad T.; Ganguli A. K. Reverse Micellar Route to Nanocrystalline Titanates (SrTiO3, Sr2TiO4, and PbTiO3): Structural Aspects and Dielectric Properties. J. Am. Ceram. Soc. 2006, 89, 1326–1332. 10.1111/j.1551-2916.2005.00886.x. [DOI] [Google Scholar]
- Khemakhem H.; Simon A.; Von Der Mühll R.; Ravez J. Relaxor or Classical Ferroelectric Behaviour in Ceramics with Composition Ba1- xNaxTi1- xNbxO3. J. Phys.: Condens. Matter 2000, 12, 5951–5959. 10.1088/0953-8984/12/27/313. [DOI] [Google Scholar]
- Ahmad T.; Kavitha G.; Narayana C.; Ganguli A. K. Nanostructured Barium Titanate Prepared through a Modified Reverse Micellar Route: Structural Distortion and Dielectric Properties. J. Mater. Res. 2005, 20, 1415–1421. 10.1557/JMR.2005.0189. [DOI] [Google Scholar]
- Nakamura K.; Tokiwa T.; Kawamura Y. Domain Structures in KNbO3 Crystals and their Piezoelectric Properties. J. Appl. Phys. 2002, 91, 9272–9276. 10.1063/1.1476078. [DOI] [Google Scholar]
- Li X.; Zang J. Facile Hydrothermal Synthesis of Sodium Tantalate (NaTaO3) Nanocubes and High Photocatalytic Properties. J. Phys. Chem. C 2009, 113, 19411–19418. 10.1021/jp907334z. [DOI] [Google Scholar]
- Kang H. W.; Lim S. N.; Park S. B.; Park A. H. A. H2 evolution under Visible Light Irradiation on La and Cr Co-Doped NaTaO3 prepared by Spray Pyrolysis from Polymeric Precursor. Int. J. Hydrogen Energy 2013, 38, 6323–6334. 10.1016/j.ijhydene.2013.03.048. [DOI] [Google Scholar]
- Ahmad T.; Lone I. H. Citrate Precursor Synthesis and Multifunctional Properties of YCrO3 Nanoparticles. New J. Chem. 2016, 40, 3216–3224. 10.1039/C5NJ02763B. [DOI] [Google Scholar]
- Ahmad T.; Lone I. H.; Ansari S. G.; Ahmed J.; Ahamad T.; Alshehri S. M. Multifunctional properties and applications of yttrium ferrite nanoparticles prepared by citrate precursor route. Mater. Des. 2017, 126, 331–338. 10.1016/j.matdes.2017.04.034. [DOI] [Google Scholar]
- Ahmad T.; Lone I. H.; Ubaidullah M. Structural Characterization and Multiferroic Properties of Hexagonal Nano-Sized YMnO3 Developed by a Low Temperature Precursor Route. RSC Adv. 2015, 5, 58065–58071. 10.1039/C5RA09038E. [DOI] [Google Scholar]
- Torres-Martínez L. M.; Cruz-López A.; Juárez-Ramírez I.; Meza de la Rosa M. E. Methylene Blue Degradation by NaTaO3 Sol – Gel Doped with Sm and La. J. Hazard. Mater. 2009, 165, 774–779. 10.1016/j.jhazmat.2008.10.060. [DOI] [PubMed] [Google Scholar]
- Forgacs E.; Cserháti T.; Oros G. Removal of Synthetic Dyes from Wastewaters: A Review. Environ. Int. 2004, 30, 953–971. 10.1016/j.envint.2004.02.001. [DOI] [PubMed] [Google Scholar]
- Pagga U.; Taeger K. Development of a Method for Adsorption of Dyestuffs on Activated-Sludge. Water Res. 1994, 28, 1051–1057. 10.1016/0043-1354(94)90190-2. [DOI] [Google Scholar]
- Gu X.; Lu H.; Kan C.; Yao J. One-Pot Hydrothermal Synthesis of Zeolite/Sodium Tantalate Composite and Its Photodegradation of Methyl Orange. Mater. Res. Bull. 2015, 68, 185–188. 10.1016/j.materresbull.2015.03.046. [DOI] [Google Scholar]
- Stamate M. D. Dielectric Properties of TiO2 Thin Films Deposited by a DC Magnetron Sputtering System. Thin Solid Films 2000, 372, 246–249. 10.1016/S0040-6090(00)01027-0. [DOI] [Google Scholar]
- Koops C. G. On the Dispersion of Resistivity and Dielectric Constant of Some Semiconductors at Audiofrequencies. Phys. Rev. 1951, 83, 121–124. 10.1103/PhysRev.83.121. [DOI] [Google Scholar]
- Kennedy B. J.; Prodjosantoso A. K.; Howard C. J. Powder Neutron Diffraction Study of the High Temperature Phase Transitions in NaTaO3. J. Phys.: Condens. Matter 2006, 11, 6319–6327. 10.1088/0953-8984/11/33/302. [DOI] [Google Scholar]
- Li Z.; Wu J.; Wu W. Composition Dependence of Colossal Permittivity in (Sm0.5Ta0.5)xTi1–xO2 Ceramics. J. Mater. Chem. C 2015, 3, 9206–9216. 10.1039/C5TC01659B. [DOI] [Google Scholar]
- Khatoon S.; Coolahan K.; Lofland S. E.; Ahmad T. Solvothermal Synthesis of In2–xCoxO3 (0.05≤ x≤ 0.15) Dilute Magnetic Semiconductors: Optical, Magnetic, and Dielectric properties. J. Am. Ceram. Soc. 2013, 96, 2544–2550. 10.1111/jace.12361. [DOI] [Google Scholar]
- Seeger A.; Lunkenheimer P.; Hemberger J.; Mukhin A. A.; Ivanov V. Y.; Balbashov A. M.; Loidl A. Charge Carrier Localization in La1–xSrxMnO3 Investigated by Ac Conductivity Measurements. J. Phys.: Condens. Matter 1999, 11, 3273–3290. 10.1088/0953-8984/11/16/009. [DOI] [Google Scholar]
- Varghese J.; Barth S.; Keeney L.; Whatmore R. W.; Holmes J. D. Nanoscale Ferroelectric and Piezoelectric Properties of Sb2S3 Nanowire Arrays. Nano Lett. 2012, 12, 868–872. 10.1021/nl2039106. [DOI] [PubMed] [Google Scholar]
- Haertling G. H. Ferroelectric Ceramics: History and Technology. J. Am. Ceram. Soc. 1999, 82, 797–818. 10.1111/j.1151-2916.1999.tb01840.x. [DOI] [Google Scholar]
- Sayed F. N.; Grover V.; Mandal B. P.; Tyagi A. K. Influence of La3+ Substitution on Electrical and Photocatalytic Behavior of Complex Bi2Sn2O7 Oxides. J. Phys. Chem. C 2013, 117, 10929–10938. 10.1021/jp400248j. [DOI] [Google Scholar]
- Kaushal A.; Olhero S. M.; Singh B.; Zamiri R.; Saravanan V.; Ferreira J. M. F. Successful Aqueous Processing of a Lead Free 0.5Ba(Zr0.2Ti0.8)O3–0.5(Ba0.7Ca0.3)TiO3 Piezoelectric Material Composition. RSC Adv. 2014, 4, 26993–27002. 10.1039/C4RA03172E. [DOI] [Google Scholar]
- Lv X.; Wu J.; Xiao D.; Tao H.; Yuan Y.; Zhu J.; Wang X.; Lou X. (1–x)(K0.48Na0.52)(Nb0.95–y–zTazSby)O3–XBi0.5(Na0.82K0.18)0.5ZrO3Lead-Free Ceramics: Composition Dependence of the Phase Boundaries and Electrical Properties. Dalton Trans. 2015, 44, 4440–4448. 10.1039/C4DT04038D. [DOI] [PubMed] [Google Scholar]
Associated Data
This section collects any data citations, data availability statements, or supplementary materials included in this article.


