Abstract
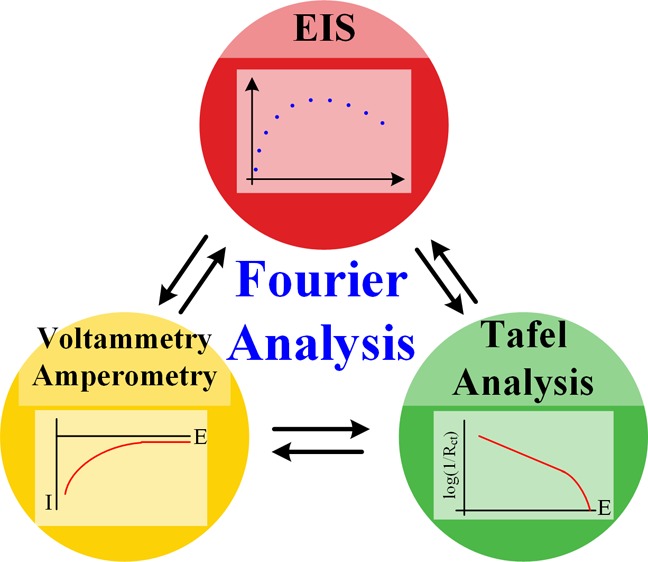
Tafel analysis and electrochemical impedance spectroscopy (EIS) have been widely used to characterize many kinds of electrocatalysts. The former provides the kinetic information of an electrochemical reaction with the exchange current while the latter does with the charge transfer resistance closely related to the exchange current. Both techniques, however, suffer from practical troubles which often decrease their reliabilities. In order to circumvent those troubles, an alternative was suggested that Tafel analysis was combined with EIS, even though its theoretical background was not clearly established. Tafel analysis is based on dc measurement, and EIS is on an ac one, respectively. Here, inspired by the second generation of EIS from chronoamperometry, we try to find how those techniques are correlated by investigating an amperometric response from EIS. The first step is Fourier transform of an arbitrary dc potential signal in the time domain to obtain the amplitudes and phases of the Fourier series which are equivalent to ac signals of each frequency. Second, with the Fourier series being applied onto the impedance data, the responding currents of each frequency are calculated by Ohm’s law. Third, the current in the frequency domain is transferred back to the time domain by inverse Fourier transform to yield chronoamperometric or Tafel plots depending on the type of the applied dc potential. Finally, we can study Tafel plots based on EIS at different conditions and their correlations which are expected to be a better indicator for characterizing electrocatalysts instead of the slope of the classical Tafel analysis.
Introduction
Electrochemical energy conversion has drawn much attention as a renewable energy. The key is the development of efficient and cost-effective electrocatalysts for various redox reactions such as hydrogen evolution, hydrogen oxidation, oxygen evolution reaction, oxygen reduction, and CO2 reduction. Understanding mechanisms and estimating the efficiencies have frequently been sought using the Tafel analysis based on voltammetry. Although the slope of the Tafel plot offers both the exchange current (i0) and the transfer coefficient (α) for an electrocatalyst, it is often complicated by non-faradic currents, iR-drops, and conductivity of the catalyst. Besides, the linear region for the slope on the plot of log(current) versus potential is arbitrarily selected depending on the personal aspect, which makes the analysis unreliable. Even a small difference in the values of the slope caused by different region selection can bring about a big difference in the values of kinetic parameters such as i0 and α, making the comparison unfair. Electrochemical impedance spectroscopy (EIS) has been an alternative method to characterize electrocatalysts.1,2 While voltammetry measures current (i) signals upon dc potential (E) and shows the i–E relationship, EIS measures impedance (Z) of the electrochemical cell using ac potentials, and shows Z dependent on frequency. Here, note that Z describes the relationship between the potential and the current. Typically, the impedance spectra are analyzed by employing a proper equivalent circuit composed of various combinations of resistors and capacitors. Those electric components are equivalent to physical phenomena such as charge transfer, mass transfer, electrical double layer, film resistance, medium conductivity, and so forth. Once experimental data are fitted to the appropriate equivalent circuit, the values of the equivalent electric components describe the parameters of the corresponding phenomena. The long measuring time of the conventional EIS apparatus especially for low frequency, however, prohibited further application of EIS. As an alternative method, EIS based on Fourier transform (FT-EIS) has been introduced by superposition of sine wave with several frequency.3,4 Recently, FT-EIS was applied to the characterization of biosensros,5 and to the development of the electrochemical technique combined with scanning electrochemical microscopy called scanning electrochemical impedance microscopy.6−9 Although EIS is generally useful in studying on electrocatalysts and characterization of films including polymers,10 graphene,11 metal organic framework,12 and biomolecules, comparisons between the results reported in other literatures are not straightforward because impedance measurements are made at different dc bias potentials in the individual reports.
Taking only advantages of voltammetry for Tafel analysis and EIS into account, Vrubel et al. recently developed a modified Tafel plot based on EIS. The charge transfer resistances (Rct) at various potentials are measured by EIS and plotted along the potential, and finally a voltammetric resistance plot is obtained.13 The exchange current (i0) is calculated using the reciprocal relationship between Rct and i0. This approach successfully circumvents the drawback of the classical Tafel analysis with the help of EIS and was applied to the characterization of various electrocatalysts.14−17 Even though the method has been effectively applied to research on electrocatalysts, conversion from electrochemical impedance to the voltammetric curve has not been clearly studied and should be discovered for further utilization and deeper insight for the electrocatalytic reaction.
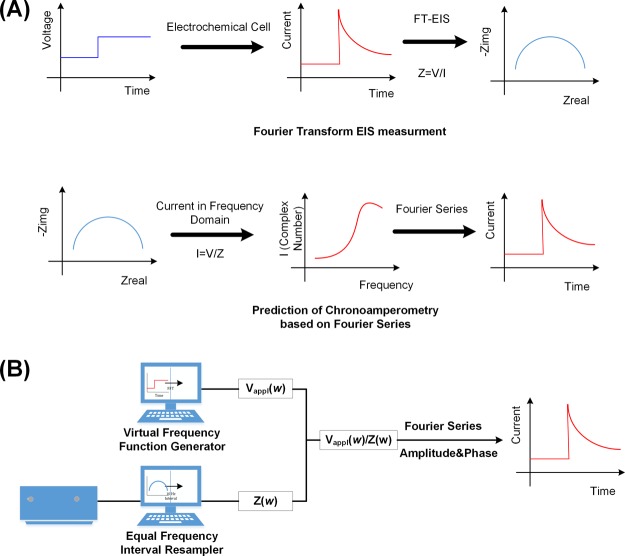
The biggest hurdle for finding the correlation is that those two techniques measure dc and ac currents in two different domains, respectively; Tafel analysis is based on current measurement in the time domain while electrochemical impedance in the frequency domain. Fortunately, those two measurements are known to be related to each other through Fourier transform. In the reports on the second generation Fourier transform EIS (2G FT-EIS), a current response is recorded upon a dc voltage step of 10 mV, namely, chronoamperometry (CA), and converted to the impedance spectrum that would be obtained using ac voltage waves in the conventional impedance technique. A potential step is the integral of the dirac δ function containing ideally all the frequencies with the identical phases. As shown in Scheme 1A, the resulting current is apparently a dc signal, but its derivative is practically responsible for the dirac δ function, and can give us the information of ac currents in the frequency domain after Fourier transform assuming the linear system for the electrochemical processes.1,2
Scheme 1. Schematic Diagrams of (A) the FT-EIS Measurement and the Reverse FT-EIS Measurement, and (B) Prediction of Current for Arbitrary Potential Perturbation from Electrochemical Impedance Data.
In this report, we take a reverse process of the 2G FT-EIS to investigate the correlation between the Tafel plot and EIS, where ac signals of electrochemical impedance data are used to obtain a chronoamperometric curve resulting from a voltage step as shown in Scheme 1B. In addition, as long as the electrochemical system is constant for small perturbations within a limited potential region, the voltage step can be replaced with any arbitrary dc signal to predict an electrochemical current stimulated by a virtual potential. To prove our concept and find the relationship between EIS and voltammetry or the Tafel analysis, we first simulate CA to predict a current signal from electrochemical impedance data by our mathematical model based on Fourier series and their inverse transform. Then, this model is applied to find a virtual current response to a perturbation of potential such as the dirac δ function, which is hard to acquire from practical experiments. Finally, analysis of Tafel plot is compared with our prediction from EIS at various dc bias constructing a typical Tafel plot. Our work demonstrates the successful prediction of an amperometric signal from EIS and better indicator for characterizing electrocatalysts instead of the slope of classical Tafel analysis.
Results and Discussion
Scheme 1B outlines the overall process to predict the amperometric curve from electrochemical impedance. Two independent processes are conducted, and then joined to generate the current. One is the preparation of arbitrary potential stimuli in the frequency domain using home-built software called the virtual frequency function generator. The program creates proper signals of frequencies by Fourier transforming the desired voltage–time signals such as a potential-step. As a result of that, we obtain complex numbers versus frequencies of which both amplitudes and phases comprise the applied voltage in frequency domain, Vappl(ω). The other process is reconstruction of impedance data which has been measured by an EIS analyzer. As the experimentally measured impedance spectra are sampled at nonequal frequency intervals such as 10 points per decade, they need to be re-sampled at the equal intervals in order to provide the signal sets of frequencies sufficient for complete inverse Fourier transform. In the present report, the frequency interval is set at 10 Hz, and re-sampling is carried out using a home-built code called the equal frequency interval resampler composed of sub-routines provided by MATLAB. After those two processes are done and calculation by Vappl(ω)/Z(ω), we obtain the current in the frequency domain, I(ω). Finally, the current in the time domain, I(t), is calculated by inverse Fourier transform from summing the cosine waves of each frequency with considering their magnitudes and phase shifts as written in eq S4. The theory on the prediction of the amperometric curve from electrochemical impedance data is based on the Fourier series and its details are described in the Supporting Information.
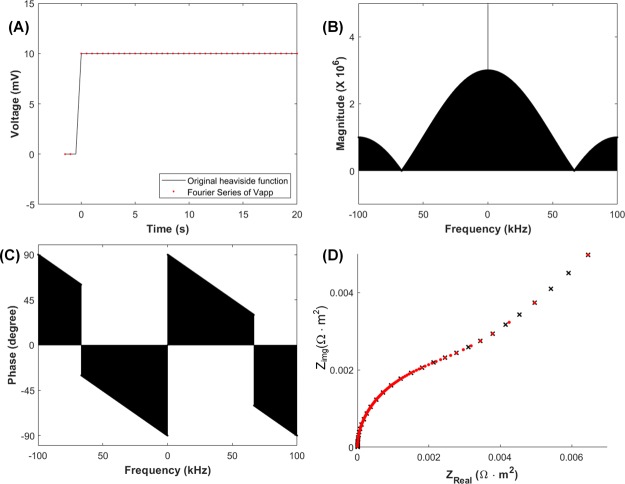
In order to confirm the validity of our approach, we apply the scheme above to a chronoamperometric curve simply responding to a constant potential step. A small potential step of 10 mV described by the Heaviside function is generated by the virtual frequency function generator code shown in a black solid line in Figure 1A. This step signal is Fourier-transformed to yield complex numbers that are Fourier series represented by the amplitude and phase of frequency and shown along the frequency in Figure 1B,C, respectively. Red dots of Figure 1A are made by the inverse Fourier transform of the complex numbers. The successful rebuilding of the potential step clearly proves that the conversion of the signal between time and frequency domains operates accurately for user-defined sampling frequencies. The second step is the acquisition of impedance data as complex numbers with the equal interval in frequency domain. A frequency sweep in COMSOL is ranged from 10 Hz to 100 kHz with 10 points/decade. Figure 1D shows a Nyquist plot for a one-electron transfer redox couple with k0 = 1 × 10⁻⁴ m/s, diffusion coefficient of both oxidant and reductant DOx = DRed = D = 1 × 10⁻¹⁰ m2/s, both concentrations of oxidant and reductant COx = CRed = 1 mol/m3, and T = 298 K. Capacitance of the electrode is 20 μF/cm2. The hemisphere in the high frequency region is attributed to the charge transfer resistance and the capacitance on the working electrode, and the linear line in the low frequency region is dominated by Warburg impedance of diffusion, which is in good accordance with the ideal result of an electrochemical system. In order to provide the signal sets of frequencies sufficient for complete inverse Fourier transform, the impedance data need to be re-sampled with a constant, sufficiently short interval. We use 10 Hz for the data from 10 Hz to 100 kHz using equal frequency interval resampler coded in MATLAB.
Figure 1.
(A) Potential step vs time signals for CA described by the Heaviside function (solid line), and rebuilt from its Fourier series (red dot). Amplitude (B) and phase (C) vs frequency of the potential step after the process of the virtual frequency function generator. (D) A Nyquist plot for the one-electron transfer redox couple Ox/Red with k0 = 1 × 10⁻⁴ m/s simulated using COMSOL. Crosshairs and red dots are the results obtained before and after re-sampling with a 10 Hz interval, respectively.
I(ω), the responding current in the frequency domain is obtained as a Fourier series by calculation of Vappl(ω) (in Figure 1B,C) divided by Z(ω) (Figure 1D). Then, the Fourier series of the current signal are processed to inverse Fourier transform by the eq S4 in Supporting Information. Figure 2 shows curves of the current response versus time for a potential step of 10 mV obtained from the above Fourier series (red line) and a theoretical calculation using known equations8 (solid line) at different k0. The theoretically predicted current decreases rapidly because of the effect of the charging current decay. Then, it seems to gradually decrease until it reaches the steady state. This is in good accordance with the previous CA,2 indicating the validity of our method. The black dotted line in Figure 2 is the theoretically predicted current from eq S9 with a 10 mV potential step. In the very early region up to 0.01 s, our method predicts the current to be higher. Nevertheless, both currents converge into the same magnitude indicating the validity of our approach with a time restriction. We speculate that the limited frequency range of EIS prohibits the exact prediction in the transient time. For example, 100 kHz ac signal cannot catch up with fast electrode processes including both charging and Faradaic current. However, this restriction is practically of no effect for CA experiments because that time region is a mixture of Faradaic and non-Faradaic currents, so that it is seldom used for electrochemical analysis, especially for electrocatalytic processes.
Figure 2.
Curves of current vs time responding to a potential step of 10 mV with different standard rate constants. (A) k0 = 1 × 10⁻⁴ m/s, (B) k0 = 1 × 10⁻⁵ m/s, and (C) k0 = 1 × 10⁻⁶ m/s.
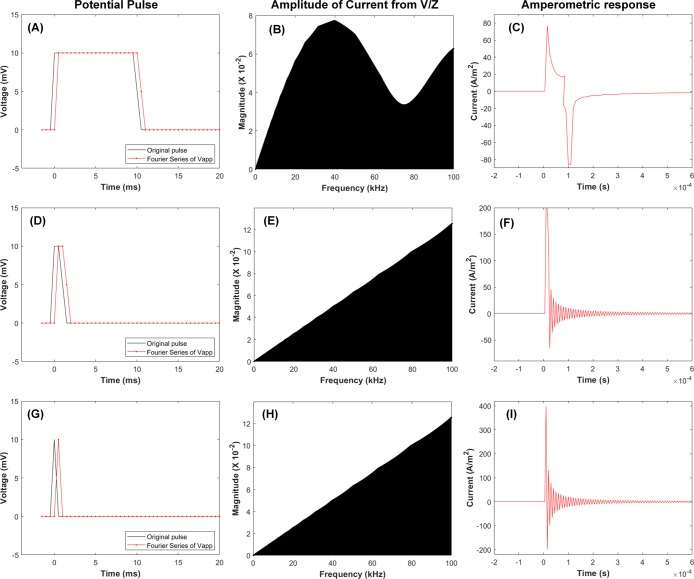
Our approach can predict electrochemical currents responding to various potential waves, not limited to a potential step. A potential signal most close to the dirac delta function is applied by extending the potential step signal to a potential pulse with controlled width because a current response on the dirac delta function is hard to measure in experiments. First, a relatively longer potential pulse of 10 ms was applied as shown Figure 3A. A complex number for the current at a specific frequency is calculated by the complex number of voltage divided by the complex number of impedance at the same frequency, whose amplitude is shown in Figure 3B. Then, the Fourier series of the current are processed to predict the amperometric current as shown in Figure 3C. The result is very similar to that of double-step CA, which confirms the validity of our approach. When the width of the potential pulse decreases to 4 ms (Figure 4D,E), the responding current rises very high up to 200 A/m2. Finally, when the width of the pulse is extremely decreased down to 2 ms, frequency analysis of the pulse shows a signal very similar to the ideal dirac delta function; here, 2 ms is the sampling time of our home-built code. Figure 3I shows an extremely high current, which was predicted in a previous report.1 These results explain that an electrochemical experiment with a short potential pulse may give us information of the electrochemical impedance, but practically the high current will cause several issues such as range saturation of the analogue-digital converter, limited resolution in current, and probable electric damage to the circuit. The oscillation of current after the short potential pulse may be artifact originated from the symmetry of our calculation because circuits based on EIS can generate both anodic and cathodic currents. It is also worth mentioning that the current response keeps changing even after the short potential pulse owing to the low frequency components originating from slower electrochemical processes. Thus, in a sufficient time scale the current should be recorded to characterize electrochemical behaviors after a short pulse.
Figure 3.
Potential pulses with different widths of (A) 10, (D), 4, and (G) 2 ms, and the amplitudes of the Fourier series for the predicted currents in (B, E, and H), respectively. The phases are also obtained but not shown here. Current responses to the potential pulses above are calculated with the amplitudes and phases and shown in (C, F, and I). k0 = 1 × 10⁻⁶ m/s, D = 1 × 10⁻¹⁰ m2/s, COx = CRed = 1 mol/m3.
Figure 4.
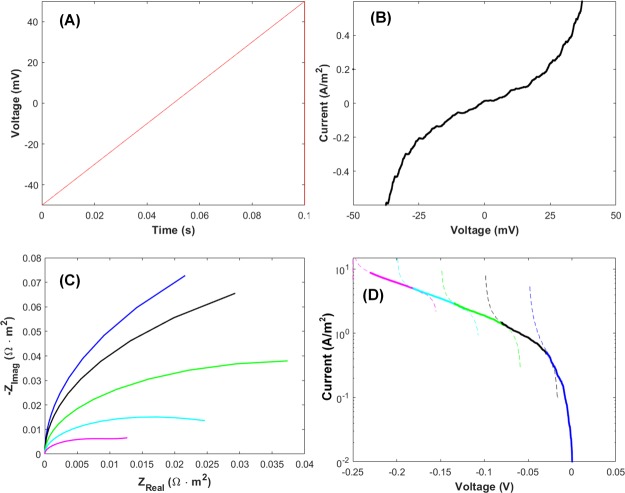
(A) Liner sweep potential applied and (B) its voltammogram obtained by our approach. (C) Nyquist plots of electrochemical impedance with dc biases (overpotential) of 0 mV (blue), −50 mV (black), −100 mV (green), −150 mV (cyan), and −200 mV (magenta). k0 = 1 × 10⁻⁶ m/s, D = 1 × 10⁻¹⁰ m2/s, COx = CRed = 1 mol/m3. (D) Tafel plots converted from the voltammograms obtained using the impedance data in (C). Colors of the plots are matched to those of the curves in (C) by the dc biases.
Both the Tafel plot and EIS have been widely used to evaluate the catalytic activity of an electrocatalyst but their correlation has not been studied rigorously. To reveal their relationship, linear sweep voltammograms (LSVs) are derived from the electrochemical impedance by the same approach used for the CA above. Figure 4A is the potential sweep of 1 V/s and Figure 4B represents the corresponding LSV predicted through our method. The high currents above 20 mV and below −20 mV may have originated from the distortion of EIS data itself because EIS data are only valid with potential perturbations of small amplitude. In other words, the impedance data outside of the linearity conditions is not reliable, and we should not consider the result. The current near the standard reduction potential seems to be linear because of the very small overpotential. This is very reasonable because the current from the Butler–Volmer theory for a small overpotential can be approximated to a linear equation with the following slope18
| 1 |
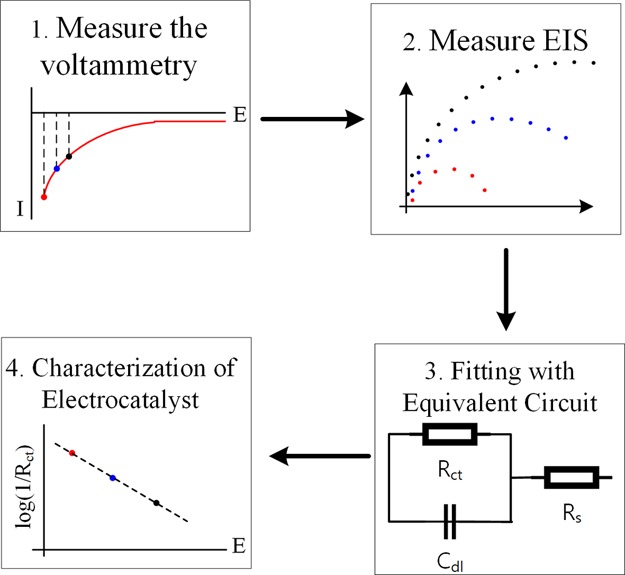
where i0 is the exchange current and RCT is the charge transfer resistance. The slope of Figure 4B is the same as the value calculated by eq 1. In order to accomplish a Tafel plot, the currents are supposed to be collected at the large overpotential region where one of the redox terms of Butler–Volmer equation is neglected. Here, we encounter a contradiction that the electrochemical impedance data are reliable for small perturbations of potential while the Tafel plot is composed of currents at large overpotentials. To go around the trouble, we find voltammograms using small perturbations overlaid on large overpotentials. Figure 4C shows the Nyquist plots calculated at various dc bias (equivalent to overpotential). The larger the overpotential is, the smaller Rct is. The same procedure done for the LSV in (B) is applied to each set of frequency the electrochemical impedance in (C), and then the results are plotted in (D). The solid lines and dashed lines are in and out of the linearity conditions for impedance, respectively. For a clear display of the plots, we add appropriate constants on the voltammetric curves to make the stitched voltammograms look continuously. The constructed Tafel plot represents characteristic of the ideal Tafel plot which is composed of the linear part at the large overpotential region and the abruptly decreasing part at the small overpotential region. The slope of the Tafel plot is found to be around 10.6 which slightly deviate from the theoretical value, 8.47. The discrepancy probably comes from the interference by the capacitance current or added arbitrary constant. Such interference is not rarely faced in electrochemical measurements. To make the signal of interest free from interference, Vrubel and co-workers fitted impedance data to an equivalent circuit and extracted the values of components purely related to the catalytic processes. Instead of direct conversion of EIS to Tafel analysis, we suggest a modified Tafel analysis to characterize electrocatalyst based on the following procedure shown in Scheme 2. (1) Run the voltammetry and find the catalytic current in the range of sub mA/m2 to ensure the sufficient forward chemical reaction. (2) Measure the EIS at a few selected bias point (more than three) for EIS. (3) Find Rct from the suitable equivalent circuit in order to remove the side parameters in voltammetry. (4) Plot bias potential versus log(1/Rct) to find the slope. Compared with the Tafel analysis, the suggested model does not require background subtraction of non-Faradaic current or the iR compensation because the fitting process with an equivalent circuit eliminates those background signals. In addition, the electroactive surface area can be inferred from the capacitance, which may make the judgement for the electrocatalyst fair. Although the process of fitting may induce some errors in values of components, this modified Tafel analysis enables the determination of both i0 and α without side effects of non-Faradaic current, iR drop, and arbitrary selection for the linear range within Tafel analysis.
Scheme 2. Suggested Characterization of the Electrocatalyst from the Modified Tafel Analysis Combined with EIS.
Conclusions
In conclusion, inspired by the second generation of FT-EIS, we investigated the reverse process of the FT-EIS to predict amperometric responses from electrochemical impedance data upon potential applications such as a step, a pulse, the dirac delta function, and a linear sweeping potentials. First, the potential signals for amperometry are generated and analyzed based on Fourier transform using a home-made code called Virtual Function Generator. Second, virtual impedance data with an equal frequency interval are obtained from the experimentally measured impedance data using another home-built code called the equal frequency interval resampler. Then, the current at each frequency is calculated by applying the potential signals onto the re-sampled impedance data, followed by the inverse Fourier transform to predict the current response. The current obtained from a potential step demonstrates the validity of our approach showing the good accordance with theoretical values. This approach is also applied to carry out a virtual experiment of CA for impulse potential whose implementation in the real world is impractical because of the limited resolution in current and time. Finally, a virtual Tafel plot calculated from electrochemical impedance spectra demonstrates the correlation between the Tafel plot and the EIS implying that our new Tafel analysis is the better indicator for characterizing electrocatalysts.
Experimental Section
EIS data were obtained using COMSOL Multiphysics 5.3 with an electrochemistry module to simulate the ac response. The diffusion equation in the simple 1D system was solved with harmonic perturbation. 2 species of Ox and Red was considered. Because the standard reduction potential for Ox/Red was assumed 0, dc bias was also 0. For numerical calculation of CA, MATLAB R2019a with in-house code was employed. Details on simulation were described in Supporting Information.
Acknowledgments
S.H. acknowledges the support from Basic Science Research Program through the National Research Foundation of Korea (NRF) grant funded by the Korea Government (MSIP) (no. NRF-2017R1A2B4012056, NRF-2019R1A2C1089951) and by the Basic Science Research Program through the National Research Foundation of Korea (NRF) funded by the Ministry of Education (no. NRF-2014R1A6A1030732).
Supporting Information Available
The Supporting Information is available free of charge on the ACS Publications website at DOI: 10.1021/acsomega.9b02672.
Theory on current signal for arbitrary perturbation from EIS based on Fourier series and theoretical amperometric response for CA (PDF)
The authors declare no competing financial interest.
Supplementary Material
References
- Yoo J.-S.; Park S.-M. An electrochemical impedance measurement technique employing Fourier transform. Anal. Chem. 2000, 72, 2035–2041. 10.1021/ac9907540. [DOI] [PubMed] [Google Scholar]
- Jurczakowski R.; Lasia A. Limitations of the potential step technique to impedance measurements using discrete time Fourier transform. Anal. Chem. 2004, 76, 5033–5038. 10.1021/ac0493929. [DOI] [PubMed] [Google Scholar]
- Popkirov G. S.; Schindler R. N. A new impedance spectrometer for the investigation of electrochemical systems. Rev. Sci. Instrum. 1992, 63, 5366–5372. 10.1063/1.1143404. [DOI] [Google Scholar]
- Popkirov G. S.; Schindler R. N. Validation of Experimental Data in Electrochemical Impedance Spectroscopy. Electrochim. Acta 1993, 38, 861–867. 10.1016/0013-4686(93)87002-u. [DOI] [Google Scholar]
- Valiu̅nienė A.; Rekertaitė A. I.; Ramanavičienė A.; Mikoliu̅naitė L.; Ramanavičius A. Fast Fourier transformation electrochemical impedance spectroscopy for the investigation of inactivation of glucose biosensor based on graphite electrode modified by Prussian blue, polypyrrole and glucose oxidase. Colloids Surf., A 2017, 532, 165–171. 10.1016/j.colsurfa.2017.05.048. [DOI] [Google Scholar]
- Morkvenaite-Vilkonciene I.; Genys P.; Ramanaviciene A.; Ramanavicius A. Scanning electrochemical impedance microscopy for investigation of glucose oxidase catalyzed reaction. Colloids Surf., B 2015, 126, 598–602. 10.1016/j.colsurfb.2015.01.007. [DOI] [PubMed] [Google Scholar]
- Valiu̅nienė A.; Petroniene J.; Morkvenaite-Vilkonciene I.; Popkirov G.; Ramanaviciene A.; Ramanavicius A. Redox-probe-free scanning electrochemical microscopy combined with fast Fourier transform electrochemical impedance spectroscopy. Phys. Chem. Chem. Phys. 2019, 21, 9831–9836. 10.1039/c9cp00187e. [DOI] [PubMed] [Google Scholar]
- Morkvenaite-Vilkonciene I.; Valiu̅nienė A.; Petroniene J.; Ramanavicius A. Hybrid system based on fast Fourier transform electrochemical impedance spectroscopy combined with scanning electrochemical microscopy. Electrochem. Commun. 2017, 83, 110–112. 10.1016/j.elecom.2017.08.020. [DOI] [PubMed] [Google Scholar]
- Morkvenaite-Vilkonciene I.; Ramanaviciene A.; Kisieliute A.; Bucinskas V.; Ramanavicius A. Scanning electrochemical microscopy in the development of enzymatic sensors and immunosensors. Biosens. Bioelectron. 2019, 141, 111411. 10.1016/j.bios.2019.111411. [DOI] [PubMed] [Google Scholar]
- Kim Y. H.; Kwon Y. S.; Shon M. Y.; Moon M. J. Corrosion Protection Performance of PVDF/PMMA-Blended Coatings by Electrochemical Impedance Methods. J. Electrochem. Sci. Technol. 2018, 9, 1–8. 10.33961/jecst.2018.9.1.1. [DOI] [Google Scholar]
- Yu J.; Kim T. H. A Facile Electrochemical Fabrication of Reduced Graphene Oxide-Modified Glassy Carbon Electrode for Simultaneous Detection of Dopamine, Ascorbic Acid, and Uric Acid. J. Electrochem. Sci. Technol. 2017, 8, 274–281. 10.33961/jecst.2017.8.4.274. [DOI] [Google Scholar]
- Naseri M.; Fotouhi L.; Ehsani A. Nanostructured Metal Organic Framework Modified Glassy Carbon Electrode as a High Efficient Non-Enzymatic Amperometric Sensor for Electrochemical Detection of H2O2. J. Electrochem. Sci. Technol. 2018, 9, 28–36. 10.33961/jecst.2018.9.1.28. [DOI] [Google Scholar]
- Vrubel H.; Moehl T.; Grätzel M.; Hu X. Revealing and accelerating slow electron transport in amorphous molybdenum sulphide particles for hydrogen evolution reaction. Chem. Commun. 2013, 49, 8985–8987. 10.1039/c3cc45416a. [DOI] [PubMed] [Google Scholar]
- Wang X.; Kolen’ko Y. V.; Bao X.-Q.; Kovnir K.; Liu L. One-Step Synthesis of Self-Supported Nickel Phosphide Nanosheet Array Cathodes for Efficient Electrocatalytic Hydrogen Generation. Angew. Chem., Int. Ed. 2015, 54, 8188–8192. 10.1002/anie.201502577. [DOI] [PubMed] [Google Scholar]
- Morales-Guio C. G.; Liardet L.; Hu X. Oxidatively Electrodeposited Thin-Film Transition Metal (Oxy)hydroxides as Oxygen Evolution Catalysts. J. Am. Chem. Soc. 2016, 138, 8946–8957. 10.1021/jacs.6b05196. [DOI] [PubMed] [Google Scholar]
- Shi Y.; Zhang B. Recent advances in transition metal phosphide nanomaterials: synthesis and applications in hydrogen evolution reaction. Chem. Soc. Rev. 2016, 45, 1529–1541. 10.1039/c5cs00434a. [DOI] [PubMed] [Google Scholar]
- Meiron O. E.; Kuraganti V.; Hod I.; Bar-Ziv R.; Bar-Sadan M. Improved catalytic activity of Mo1-xWxSe2 alloy nanoflowers promotes efficient hydrogen evolution reaction in both acidic and alkaline aqueous solutions. Nanoscale 2017, 9, 13998–14005. 10.1039/c7nr04922f. [DOI] [PubMed] [Google Scholar]
- Bard A. J.; Faulkner L. R.. Electrochemical Methods Fundamentals and Applications; Wiley: New York, 2001 [Google Scholar]
Associated Data
This section collects any data citations, data availability statements, or supplementary materials included in this article.


