Abstract
Antibiotic resistance by bacteria has continued to prompt research for new agents that can inhibit bacterial growth. Therefore, in this study, we described the synthesis, physicochemical characterization, and the antibacterial activity of pure metal oxide nanoparticles of ZrO2 and ZnO and the antibacterial activity of their mixed metal oxide of ZrO2–ZnO nanoparticles against three Gram-positive of Bacillus subtilis, Streptococcus mutans, Staphylococcus aureus, and 3 Gram-negative of Escherichia coli, Pseudomonas aeruginosa, and Klebsiella oxytoca. The nanoparticles were successfully prepared by sol–gel method and were subsequently characterized using dynamic light scattering analysis, X-ray diffraction (XRD), and scanning electron microscopy (SEM). The results obtained from the characterization techniques confirm the formation of ZrO2, ZnO, and ZrO2–ZnO nanoparticles with diameter sizes of 76, 22, and 26–34 nm, respectively. SEM reveals spherically shaped nanoparticles. The XRD shows the formation of monoclinic zirconia and hexagonal zinc oxide, formation of amorphous compound in Z-Z0.25 and Z-Z0.5 while Z-Z1.0 and Z-Z2.0 have peaks that corresponds to the diffractogram pattern present in ZrO2 and ZnO. From the preliminary screening, ZrO2 and the amorphous particles of Z-Z0.25 and Z-Z0.5 did not record any inhibition against any of the test bacteria while ZnO, Z-Z1.0, and Z-Z2.0 recorded inhibition against all the tested bacteria.
1. Introduction
Nanoparticles are particles with a mean diameter size less than or equal to 100 nm and having a large surface area-to-volume ratio.1 In recent years, nanoparticles have attracted a lot of attention as a result of their unique properties in terms of their optical characteristics, catalytic activity, and antibacterial properties. All these unique characteristics have enhanced their potential application in different fields such as biomedical, communications, and electronics.2 With these properties, nanoparticles have been able to exhibit unique applications3−7 that are being used across fields.
Sol–gel is the formation of an oxohydroxide compound through hydrolysis from the metal–organic precursor and the initial reaction is accompanied by condensation and polymerization to form metal hydroxide and a porous gel with further treatment to give nanoparticles.8,9
Zirconia has high strength, high fracture toughness, high chemical stability, and hardness. These listed characteristics have resulted in the high use of zirconia.10 Zirconia display different phases based on its temperature. The monoclinic phase is exhibited at room temperature but at a temperature above 1170 °C it changes to the tetragonal phase and it exists as the cubic phase at a temperature above 2370 °C. Zirconia nanoparticles had been produced using different synthetic methods.11−16 Although, most of the synthesized nanoparticles are confronted with different forms of shortcomings17,18 like agglomeration which is a part of the defect in the synthesis of single metal oxide nanoparticles17,18 and in trying to fix these defects and other shortcomings to improve their quality in their application in various fields, mixed metal oxide nanoparticles have become the solution.19,20
ZnO shows excellent characteristics like high photostability, high electrochemical coupling coefficient, and high chemical stability,21 and as a result of its low toxicity, biocompatibility, and biodegradability, it finds so many uses in biomedicine. Part of its characteristics has made it suitable for use in sensors, energy generators, and as photocatalysts for hydrogen production.2 ZnO also possess antibacterial properties, which makes it applicable for use in the inhibition of bacterial growth.22 The noteworthy mechanism of zinc oxide nanoparticles as an antibacterial agent has been reported to be attributed to the photocatalytic generation of hydrogen peroxide.20 ZnO nanoparticles had been synthesized using various synthetic routes.23−28
In this work, we present the synthesis of pure zirconium oxide, zinc oxide, and their mixed metal oxide of zirconia and zinc oxide nanoparticles using the sol–gel method. The antibacterial activity of ZrO2–ZnO nanoparticles was evaluated on three Gram-positive (Bacillus subtilis, Streptococcus mutans, Staphylococcus aureus) and three Gram-negative (Escherichia coli, Pseudomonas aeruginosa, Klebsiella oxytoca) bacteria. From our result, it can be reported that the synthesized zirconia–zinc oxide nanoparticles can find application in the development of medicine.
2. Experimental Methods
2.1. Materials
All reactants used were of analytical grade and they were used as received. Acetic acid and deionized water were the solvent used. Zinc nitrate [Zn(NO3)2], citric acid, NaOH, and zirconium butoxide [Zr(C4H9O)4] were purchased from Aldrich. Mueller–Hinton agar plates were used for the antibacterial test. B. subtilis (ATCC 19163), S. aureus (ATCC 25923), S. mutans (ATCC 25175), E. coli (ATCC 25922), K. oxytoca (13182), P. aeruginosa (ATCC 27853) were obtained from American Type Culture Collection.
2.2. Synthesis of ZrO2 Nanoparticles
Synthesis of ZrO2 nanoparticles was done by sol–gel method as described by previous literature29 with some modifications. Zirconium butoxide [Zr(OC4H9)4] (3.658 mL) was added to 10 mL of acetic acid followed by 20 mL of water dropwise. A transparent sol was obtained within 15 min followed with continuous stirring for 5 h. The sol was kept in an oven at 80 °C for gelation and the gel obtained was then dried at 100 °C to get a powder. The as-prepared sample powders were grounded and subjected to calcination at 500 °C for 4 h to obtain the ZrO2 nanoparticles.
2.3. Synthesis of ZnO Nanoparticles
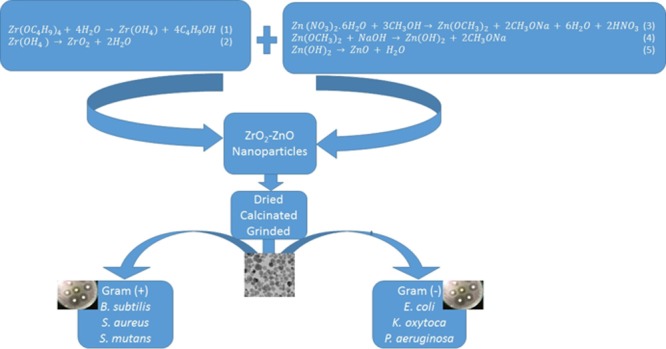
ZnO nanoparticles were synthesized by sol–gel method in accordance with past literature30 but with some modifications. Zinc oxide nanoparticles were prepared by sol–gel method using citric acid in deionized water. Initially, 6 mL of zinc nitrate hexahydrate (1 M) solution (sol) was mixed with 15 mL of water. Citric acid (15 mL) was added to the solution under dark conditions with constant stirring at 300 rpm. The reactions involved in the process are as shown in eqs 1–3
| 1 |
| 2 |
| 3 |
For gelation to occur, 10 M NaOH (4.03 g in 10 mL H2O) was added dropwise, a milky white gel was observed, and the solution was stirred for 4 h. Then, the gel was dried in an oven at 120 °C to constant weight and calcinated at 400 °C for 4 h to obtain the ZnO nanoparticles.
2.4. Synthesis of ZrO2–ZnO Nanoparticles
Synthesis of ZrO2–ZnO nanoparticles was prepared by the sol–gel method as described by the literature31 with some modifications. Zirconium butoxide [Zr(OC4H9)4] (3.658 mL) was dissolved in 10 mL of acetic acid followed by the addition of 20 mL of water dropwise. A transparent sol was obtained within 15 min. Addition of an aqueous solution of 10 mL of Zn(NO3)2 at different concentrations as shown in Table 1 to the above sol followed with continuous stirring. The sol was kept in an oven at 80 °C for gelation and the gel obtained was then dried at 100 °C to get a powder. The as-prepared sample powders were grounded and subjected to calcination at 500 °C for 4 h to obtain the ZrO2–ZnO mixed metal oxide nanoparticles.
Table 1. Concentration (mol/dm3) of Reagents Used during the Synthesis of ZrO2–ZnO Nanoparticles.
|
N |
||
|---|---|---|
| Zr(OC4H9)4 (mol/dm3) | Zn(NO3)2 (mol/dm3) | |
| Z-Z0.25 | 1 | 0.25 |
| Z-Z0.50 | 1 | 0.5 |
| Z-Z1.0 | 1 | 1 |
| Z-Z2.0 | 1 | 2 |
2.5. Methods of Characterization
The crystalline structures of ZrO2, ZnO, and Z–Z films were determined by X-ray diffraction (XRD) and the measurements were taken on a RAD-C, Rigaku; with Cu KR at 40 kV and 30 mA. The scanning range was from 10° to 80°. The surface morphology of the films was assessed by scanning electron microscopy (SEM; Hitachi S-3000) with an energy-dispersive X-ray (EDX) spectrometer. The mean particle size and zeta potential of the nanoparticles were measured using a HORIBA Scientific, SZ 100 instrument.
2.6. Antibacterial Activity Determination
Materials used for the antimicrobial activity study of zirconia, zinc oxide, and Z–Z nanoparticles were soy broth, Mueller–Hinton agar, Petriplates, cotton swabs, synthesized nanoparticles samples (zirconia, zinc oxide, Z–Z), B. subtilis, S. aureus, S. mutans, E. coli, K. oxytoca, and P. aeruginosa. The disc diffusion method was used for the antimicrobial activity of zinc oxide nanoparticles.
Preparation of Inoculum
Soy broth (15 g in 500 mL deionise H2O) was prepared in conical flasks and sterilized. In different test tubes, clinically isolated strains of each of the different bacteria were inoculated. The bacteria were cultured in the soy broth for 20 h at 37 °C before the test.
Inoculation of Test Plate
Mueller–Hinton agar was prepared (19 g Mueller–Hinton agar in 500 mL deionized water) and sterilized. The agar suspension within 15 min was used to inoculate plates by dipping a sterile cotton-wool swab into the suspension. Then, we spread the inoculum evenly over the entire surface of the plate by swabbing in different directions. Allow the plate to dry before applying nanoparticles to the disc.
Disc Diffusion Method for Antimicrobial Activity
Each (0.0005 g) of the synthesized nanoparticles (ZrO2, ZnO, Z-Z0.25, Z-Z0.5, Z-Z1.0, and Z-Z2.0) was weighed before they were used for the antimicrobial activity study. The agar plate was divided into six sections to accommodate each of the synthesized nanoparticles. Antibacterial tests were carried out by the disc diffusion method using the suspension of bacteria spread on a Mueller–Hinton agar plate. The swab was dipped into the broth culture of each of the bacteria. Use the swab to a streak agar plate for a lawn of growth. The inoculated plates were incubated at the appropriate temperature for 24 h. Each weighed samples of each of the nanoparticles was placed on the surface of the agar. The antimicrobial activity was evaluated by measuring the zone of inhibition against the test organisms with a caliper.32 The antimicrobial test for all the bacteria was done in triplicate.
Determination of the Growth Curve
The procedure for the evaluation of the antimicrobial effect of the different samples was based on Gram-positive and Gram-negative bacterial culture. An apparatus Multiskan EX (Thermo Fisher Scientific) via Ascent Software for Multiskan was used with subsequent analysis. The bacterial culture grown overnight was diluted with the soy medium to an absorbance of 0.1 measured using a PerkinElmer Lambda spectrophotometer 35 at a wavelength of 540 nm. The diluted culture was pipetted into a microplate (total volume of 100 μL) alone as a control variant, and after with the various samples. Measurements were carried out at time 0, then each half-hour for 24 h at 37 °C, at a wavelength of 540 nm. The measured absorbance was analyzed in a graphic form as growth curves for each sample group individually.33
3. Results and Discussion
At the end of the sol–gel process, zirconia and the various samples of Z–Z nanoparticles were produced. The sol–gel reaction involves the hydrolysis and condensation of zirconium butoxide and zinc nitrate as the precursors for zirconia and ZnO nanoparticles. Deionized water was added to zirconium butoxide followed by aqueous solution of zinc nitrate. During the sol–gel process, zirconium butoxide was hydrolyzed as shown in eq 4. Then, the condensation reaction led to the formation of Zr–O–Zr bonds as shown in eq 5. The overall reactions employed by the sol–gel method are shown below
| 4 |
| 5 |
Aqueous solution of Zn(NO3)2 measured at different concentrations added to the fixed concentration of zirconium butoxide had an effect on the rate of hydrolysis and condensation.34 The different nanoparticles size of Z–Z at different concentrations of Zn(NO3)2 against the fixed concentration of ZrO2 were examined by the average particle size distribution. By varying the Zn(NO3)2 concentration, the Z–Z nanoparticles were produced with different sizes. The obtained samples were characterized by XRD, SEM, dynamic light scattering (DLS), and zeta potential and the results of the characterization were reported. The data and results obtained for the mixed metal oxide nanoparticles of Z–Z were compared with those of their single metal oxide nanoparticles.
3.1. X-ray Diffraction
XRD of the five synthesized samples were measured. The samples in the form of films were deposited on amorphous glass substrates to determine the crystal nature. Figure 1 illustrates the crystalline phases of ZrO2, ZnO, and Z–Z nanoparticles. The XRD patterns of the nanoparticles display the major 2θ peak values at 24.6°, 28.6°, 31.9°, 50.6°, 55.8°, and 60.3° corresponding to the monoclinic phase of zirconia; the peak values correlated with the international standard file (JCPDS file no. 37-1484)35,36 with the definite line broadening of the XRD peaks indicating that the prepared nanoparticles consist of particles within the nanoscale range. The diffraction peaks located at 31.84°, 34.64°, 36.39°, 47.72°, 56.80°, 63.12°, and 68.16° have been indexed as the hexagonal phase of ZnO.
Figure 1.
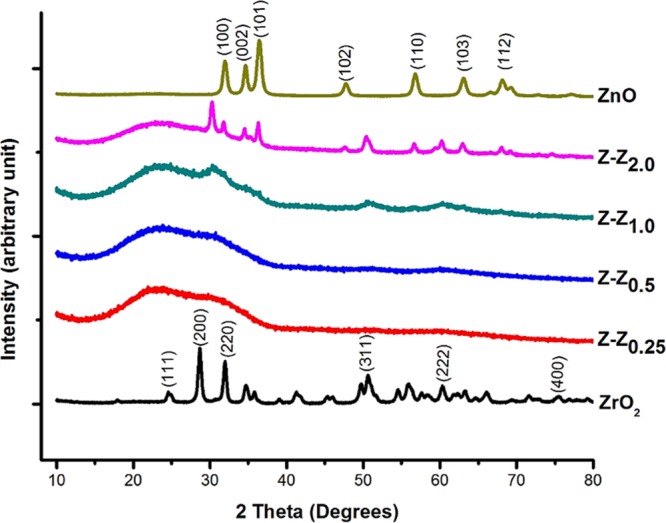
XRD patterns of ZrO2, ZnO and Z–Z nanoparticles.
In the XRD for Z–Z samples, it was found that only Z-Z(1.0) and Z-Z(2.0) showed peaks in the XRD while the corresponding Z–Z nanoparticles synthesized at low concentrations of ZnO against ZrO2 as seen in samples Z-Z0.25 and Z-Z0.50 were found to be amorphous with no identifiable peaks. At a higher concentration of ZnO against ZrO2 in samples Z-Z1.0 and Z-Z2.0 it was possible to identify peaks corresponding to ZrO2 and ZnO, respectively. The appearance of significantly intensified diffraction peaks in samples Z-Z1.0 and Z-Z2.0 reveals the preferential orientation of the crystallographic plane and the higher crystallinity of ZnO. Besides these peaks, there are other distinct features of the diffractogram, with the clearest ones being a large diffuse signal between 20° and 30° because of the amorphous glass substrate used for the analysis.
3.2. SEM Result
The synthesized ZrO2, ZnO, Z-Z0.5, and Z-Z2.0 nanoparticles were characterized for their morphology by scanning transmission electron microscopy and for their elemental content by EDX spectroscopy. Figure 2a shows the SEM image of zirconia nanoparticles as spherically shaped, heavily aggregated and without any form of dispersity. An EDX spectrum of ZrO2 nanoparticles is shown in Figure 2b. The spectrum shows the elemental composition indicating the presence of zirconium and oxygen. In Figure 2c, the SEM image of zinc oxide nanoparticles reveals spherically shaped nanoparticles with an irregular surface morphology with some amount of aggregation. An EDX spectrum of ZnO nanoparticles is shown in Figure 2d. The spectrum shows the elemental composition indicating the presence of zinc and oxygen. The SEM image of Z-Z0.5 is shown in Figure 2e, which reveals the morphology of the prepared material as a cluster of amorphous particles, and as shown in Figure 2f, the elemental composition of the sample indicated the presence of zirconium, zinc, and oxygen. Figure 2g shows the irregular growth of Z-Z2.0. The EDX spectrum in Figure 2h shows the presence of zirconium, zinc, and oxygen.37 The result obtained from the EDX analysis validates the purity of the element that made up the components of each samples with the presence of carbon and aluminium because of the carbon tape used and the base support, respectively.
Figure 2.
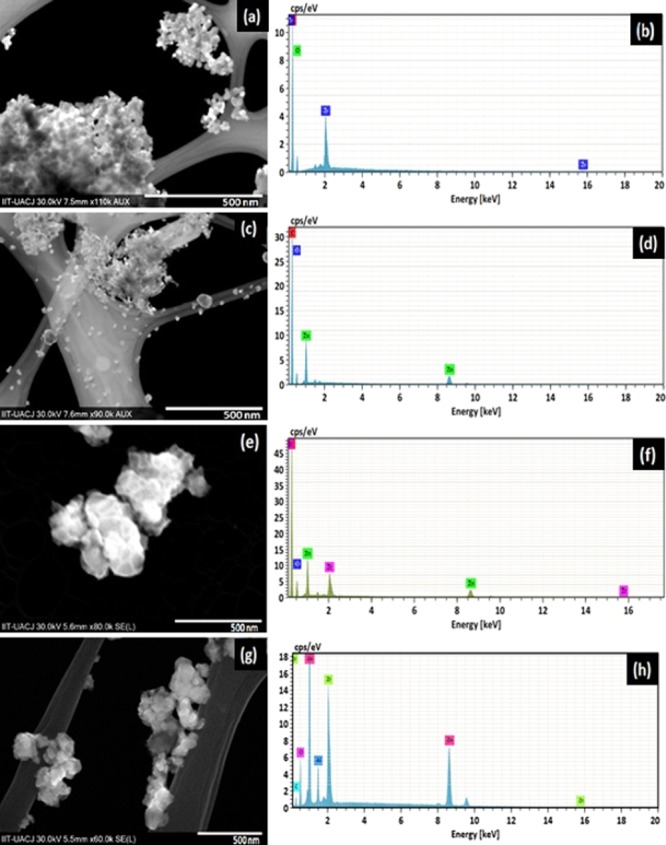
SEM and EDX micrographs, respectively, of (a,b) ZrO2, (c,d) ZnO, (e,f) Z-Z0.5, and (g,h) Z-Z2.0 nanoparticles.
3.3. DLS Analysis
Particle size analysis was performed to determine the size distribution of the synthesized samples of ZrO2, ZnO, and Z–Z nanoparticles in deionized water. The particle size of the suspended nanoparticles as obtained from the DLS analysis shows ZrO2 to be (76 nm), ZnO (22 nm), Z-Z0.25 (amorphous), Z-Z0.50 (amorphous), Z-Z1.0 (34 nm), and Z-Z2.0 (26 nm). From the result, ZnO nanoparticles recorded the smallest nanoparticle size of mean diameter 22 nm, while ZrO2 nanoparticles have the biggest nanoparticle size of 76 nm. The result of the DLS analysis agrees with the morphological appearance as shown by the SEM micrographs which shows that the sample with the most agglomeration has the highest nanoparticle size and the one with the least agglomeration has the smallest nanoparticles size.
3.4. FTIR Spectra
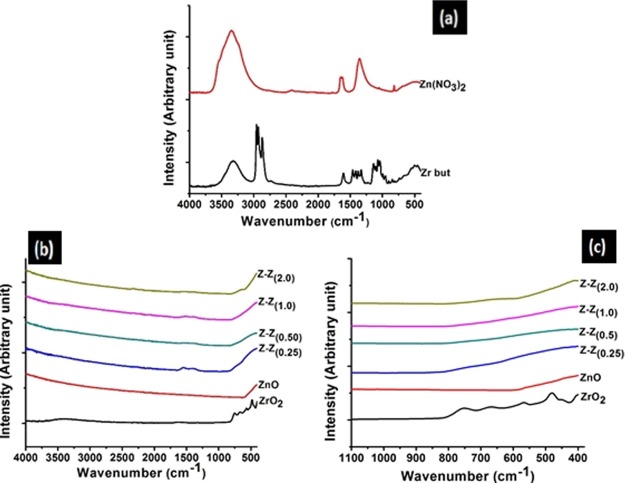
A fourier transform infrared (FTIR) spectrophotometer was used to analyze and compare the functional group of the reactants Zr(OC4H9)4, Zn(NO3)2 and that of the products ZrO2, ZnO, and Z–Z nanoparticles. A wavelength of 4000–400 cm–1 was used for the analyses of the functional groups of the samples, and the results can be seen in Figure 3. Figure 3a,b shows the comparison between the IR spectra of zirconium butoxide and zinc nitrate that were used as the precursor (Figure 3a) to the IR spectra of the products formed (Figure 3b). In Figure 3b, it was found that some peaks have been lost as a result of calcination of the reactants and there was formation of a new peak to show that a new product was formed. All the distinct absorption peaks of zirconium butoxide were illustrated in Table 2 and every absorption peak was assigned to the corresponding vibrations. Figure 3b shows the IR spectrum of ZrO2, ZnO, and Z–Z samples in the range 4000–400 cm–1. A wavenumber of 482 cm–1 was assigned to Zr–O bond which is in accordance with previous work.38 A wavenumber of 556 cm–1 was assigned to the Zn–O bond similar to another report.39 By adding ZrO2 to ZnO, the shift in wavenumber at the frequency of 800–400 cm–1 can be observed. A wavenumber of 784, 732,632, and 550 cm–1 were found in Z-Z0.25, Z-Z0.5, Z-Z1.0, and Z-Z2.0, respectively. Typically, bands placed at higher frequencies are assigned to Z-Z0.25 and Z-Z0.5. These high frequencies of Z-Z0.25 and Z-Z0.50 confirm the results of the XRD, suggesting the formation of amorphous materials.40 The shift of the wavenumber indicated that the addition of ZnO to ZrO2 changed the structure of ZrO2. Figure 3c shows that the M–O band of the products gave clear evidence that the absorption bands were found within the fingerprint region.
Figure 3.
FTIR spectra of (a) zirconium butoxide and Zn(NO3)2; (b) ZrO2, ZnO, and Z–Z samples; and (c) fingerprint region of ZrO2, ZnO, and Z–Z samples.
Table 2. FTIR Bands of Zirconium Butoxide41.
| n | functional group |
|---|---|
| 2975 | vas CH3 |
| 2946 | vas CH3 |
| 2934 | vas CH3 |
| 2907 | vas CH3 |
| 2875 | vs CH2 |
| 2861 | vas CH3 |
| 1564 | vas CO |
| 1365 | CH3 |
| 1193 | tert-butyl stretching |
| 786 | sym skeletal vibration of tert-butyl group |
3.5. Zeta Potential Measurement of ZrO2–ZnO Nanoparticles
Zeta potential is the net surface charge of nanoparticles and it is the potential difference between the dispersion medium and the static layer of the fluid on the dispersed particle. The repulsion and the attraction interaction between the nanoparticles are determined by the surface charges present between the nanoparticles. Therefore, the zeta potential values enable us to know whether a nanoparticle will agglomerate or disperse.
From Table 3, Z-Z2.0 with an average nanoparticles size of 26 nm recorded the highest zeta potential value of −38.50 mV, and it is moderately stable while ZnO nanoparticles with an average nanoparticles size of 22 nm has a zeta potential of 13.78 mV and can be said to be incipiently unstable. Table 3 shows the zeta potential values and the stability behavior for each of the synthesized nanoparticles. It was observed that as the concentration of zinc nitrate increases against a fixed concentration of zirconium butoxide, the stability between the nanoparticles increases.
Table 3. Showing the Mean Size, Zeta Potential Values, and the Stability Behavior of the Nanoparticles.
| samples | mean (nm) | mean Z-potential (mV) | stability behaviour of the nanoparticle |
|---|---|---|---|
| ZrO2 | 76 | –17.27 | incipient instability |
| ZnO | 22 | 13.78 | incipient instability |
| Z-Z0.25 | amorphous | –22.00 | incipient instability |
| Z-Z0.50 | amorphous | –34.31 | moderate stability |
| Z-Z1.0 | 34 | –37.45 | moderate stability |
| Z-Z2.0 | 26 | –38.50 | moderate stability |
3.6. Results of the Antibacterial Activity of ZnO and Z–Z Nanoparticles
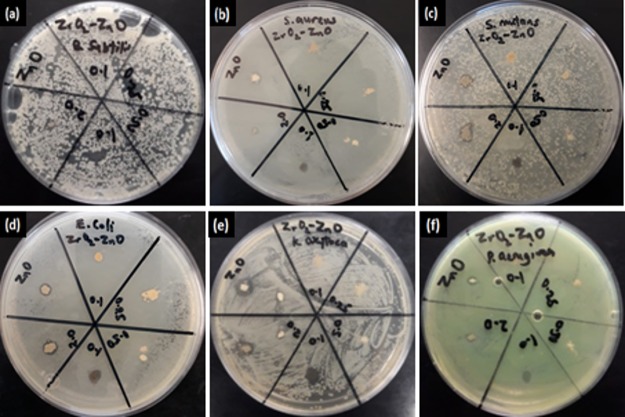
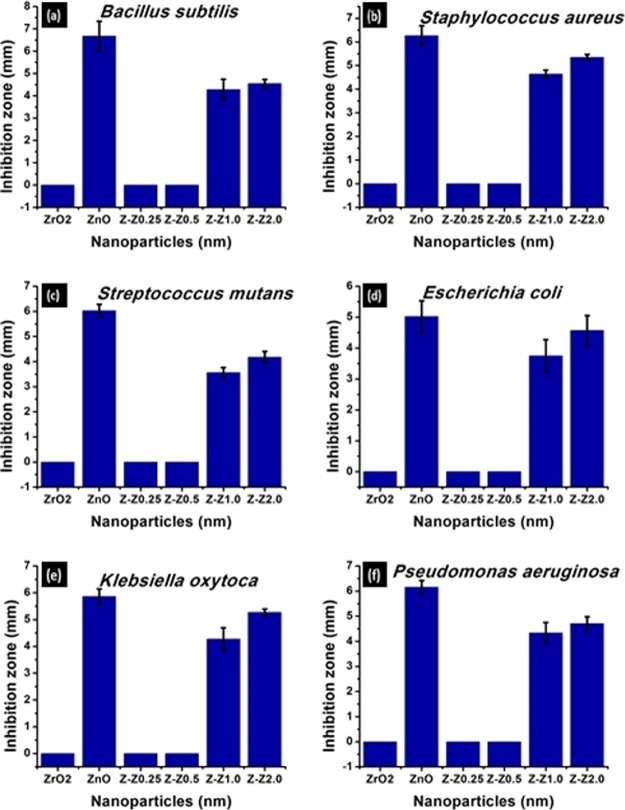
A disk diffusion assay was performed to analyze the inhibition zone of ZnO and Z–Z samples against Gram (+) and Gram (−) bacteria. The antibacterial activity exhibited by all the synthesized nanoparticles which prevents the growth of the bacteria can be seen in the form of the clear zone in the disks as seen in Figure 4. Here, ZnO, Z-Z1.0, and Z-Z2.0 showed activity against all the tested bacteria at different levels while Z-Z0.25 and Z-Z0.5 did not record any antibacterial activity against any of the test bacteria. The data show that the inhibition zone diameter for synthesized ZnO nanoparticles is maximum as compared to other synthesized nanoparticles. The antibacterial activity test of the pure metal oxide nanoparticles and the mixed metal oxide nanoparticles were tested against six bacteria species which include three Gram-positive bacteria: B. subtilis, S. aureus, S. mutans and three Gram-negative bacteria: E. coli, P. aeruginosa, and K. oxytoca.
Figure 4.
Inhibition zone (mm) formed by the different nanoparticles in the disc diffusion test on (a) B. subtilis, (b) S. aureus, (c) S. mutans, (d) E. coli, (e) K. oxytoca, and (f) P. aeruginosa.
The results of the antibacterial activity studies are presented in Table 4 while Figure 5a–f show the graphical representation of the antibacterial study. The antibacterial activity of the pure metal and the synthesized mixed metal oxides nanoparticles were determined by the method described by Maneerung et al.32
Table 4. Antibacterial Activity of ZnO Nanoparticles and ZrO2–ZnO Nanoparticles.
| samples | B. subtilis (mm) | S. mutans (mm) | S. aureus (mm) | E. coli (mm) | P. aeruginosa (mm) | K. oxytoca (mm) |
|---|---|---|---|---|---|---|
| ZrO2 | 0 | 0 | 0 | 0 | 0 | 0 |
| ZnO | 6.67 | 6.02 | 6.27 | 5.02 | 6.16 | 5.27 |
| Z-Z0.25 | 0 | 0 | 0 | 0 | 0 | 0 |
| Z-Z0.50 | 0 | 0 | 0 | 0 | 0 | 0 |
| Z-Z1.0 | 4.24 | 3.56 | 4.64 | 3.75 | 4.33 | 4.27 |
| Z-Z2.0 | 4.55 | 4.18 | 5.35 | 4.57 | 4.70 | 4.86 |
Figure 5.
Inhibition zone (mm) formed on (a) B. subtilis, (b) S. aureus, (c) S. mutans, (d) E. coli, (e) K. oxytoca, and (f) P. aeruginosa by ZnO and Z–Z nanoparticles.
The antibacterial activities gradually increased with increasing ZnO content against the fixed ZrO2. The reduction in antibacterial activity of ZnO in the presence of ZrO2 is ascribed to the decrease in the oxidation power of ZnO nanoparticles. In addition, ZnO nanoparticles lead to an increase in the formation of reactive oxygen species (ROSs) that leads to the destruction of the bacterial cells. These elevated ROS have many effects on the bacteria such as lipid peroxidation. This lipid peroxidation affects the bacterial membrane integrity.42 As a result, there is a high level of membrane leakage. On addition of ZrO2 to ZnO, this ability was reduced. The destruction of the cell wall of the bacteria leads to bacterial death with increasing concentration of zinc oxide nanoparticles. It is worth mentioning that the binding of ZnO and Z–Z nanoparticles to bacteria depends on the surface area available for interaction. The mechanism by which nanoparticles penetrate bacteria cannot be explained completely, but studies have suggested that when bacteria are treated with nanoparticles, changes take place in its cell membrane morphology. In general, studies have shown that nanoparticles could penetrate the bacteria as a result of their unique morphology. The diffusion of nanoparticles across the membrane of the bacteria is directly proportional to the size of the nanoparticles. The smaller the nanoparticles, the higher the chances of permeating and damaging the bacteria membrane. The presence of ion channels and transporter protein has aided the movement of nanoparticles across the plasma membrane. The sequence of the ionization of ZnO to liberate Zn2+ ions can be seen as shown in eqs 6 and 7
| 6 |
| 7 |
Among various other means, Zn2+ solute from nanoparticles pass across the cell as described by the literature.43 The sequence of the inhibition mechanism of nanoparticles after penetrating the membrane is initiated by the direct interaction with oxidative organelles. This in turn enables Zn2+ produced by nanoparticles (eq 7) to generate ROS through different chemical reactions. The induced ROS halts gene expression and results in DNA damage. In addition to halting gene expression, Zn2+ ions can cause protein denaturation through the disruption of the metal ions in metalloproteins. The released ions from the nanoparticles through the aforementioned actions disrupt the metal cation stability of the cell which eventually leads to death. ZnO nanoparticles may be used to treat or prevent infections. Using the methods of mixing zirconia to ZnO nanoparticles on medical devices can help to fight bacterial infection to a large extent.
3.7. Growth Characteristics
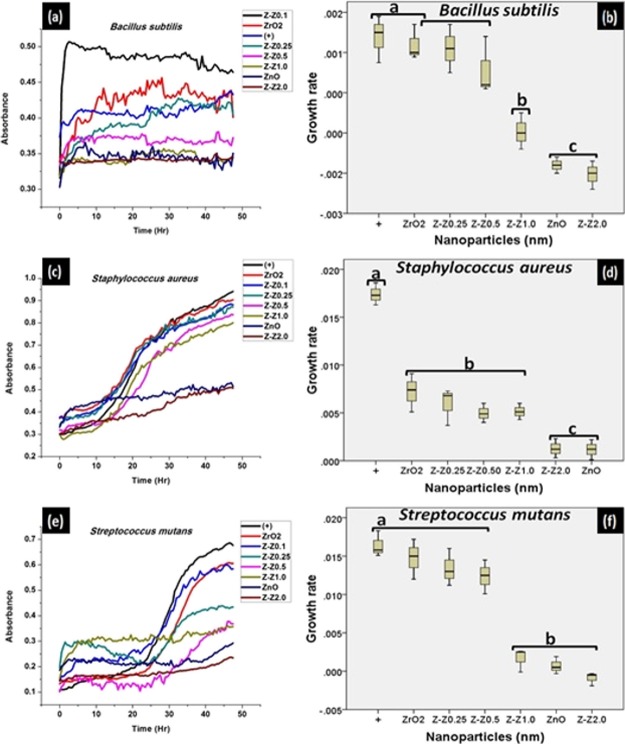
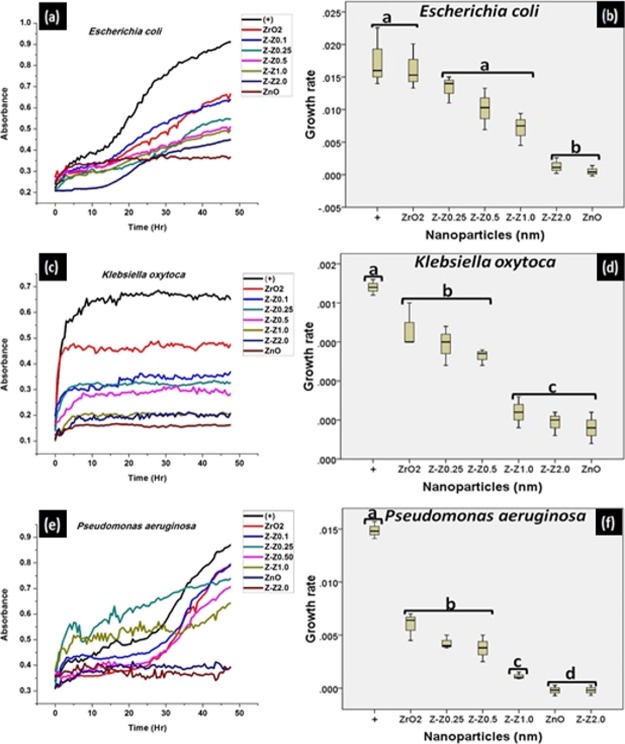
The different bacterial growth was assessed at a wavelength of 540 nm over time and was plotted using Origin 8.5 software. Each well was read for 96 counts for 24 h. The growth kinetics of the Gram (+) and Gram (−) bacteria was analyzed in the presence and absence of the chemically synthesized ZnO and the mixed samples of Z–Z nanoparticles. Growth curves of the treated bacterial culture experience a decline in comparison to that of the untreated one with time. This suggests that the ZnO and Z–Z nanoparticles have activity against the bacterial growth [Figures 6 and 7a,c,e]. The growth curves in Figures 6 and 7 shows that treatment of chemically synthesized ZnO and Z-Z2.0 inhibits the growth of the test bacteria more than the other mixed samples. As the concentration of the ZnO increases against the ZrO2, the decline in the growth kinetics becomes more pronounced.
Figure 6.
Growth characteristics and the statistical evaluation of the growth characteristics, respectively, formed by the nanoparticles on (a,b) B. subtilis, (c,d) S. aureus, and (e,f) S. mutans.
Figure 7.
Growth characteristics and the statistical evaluation of the growth characteristics, respectively, formed by the nanoparticles on (a,b) E. coli, (c,d) K. oxytoca, and (e,f) P. aeruginosa.
Figures 6 and 7b,d,f show the statistical analyses of data obtained from the growth characteristics study of ZrO2–ZnO nanoparticles as computed using SPSS 16.0 software. All computations were executed in triplicate and the results were expressed as mean ± SD. The antimicrobial assay was computed with suitable dilutions for each sample. One-way analysis of variance was used for analysis of data obtained from the different samples. The P values <0.05 were taken as indicative of statistical significance.
4. Conclusions
ZrO2, ZnO, and Z–Z nanoparticles have been successfully prepared by sol–gel method. The XRD analysis shows the formation of monoclinic ZrO2, cubic hexagonal ZnO with amorphous formation at lower concentrations of ZnO against zirconia and the appearance of peaks that corresponds to both ZrO2 and ZnO at higher concentrations of ZnO against ZrO2. From the SEM analysis, spherically formed nanoparticles were obtained. DLS analysis shows that ZnO has the smallest size of 22 nm while ZrO2 nanoparticles have the biggest size of 76 nm. From the antibacterial activity study, despite the better stability of Z-Z2.0 when compared to ZnO, ZnO still recorded the highest inhibition against all the test bacteria because of its higher ROS generation.
Acknowledgments
Thanks to PRODEP, Universidad Autónoma de Ciudad Juárez and CONACYT.
The authors declare no competing financial interest.
References
- Mohanraj V. J.; Chen Y. Nanoparticles – A Review. Trop. J. Pharm. Res. 2006, 5, 561–573. 10.4314/tjpr.v5i1.14634. [DOI] [Google Scholar]
- Vaseem M.; Umar A.; Hahn Y.. ZnO Nanoparticles: Growth, Properties, and Applications; American Scientific Publishers, 1988; Vol. 5. [Google Scholar]
- Bonnetot B.; Rakic V.; Yuzhakova T.; Guimon C.; Auroux A. Preparation and Characterization of Me2O3-CeO2 (Me2 = B, Al, Ga, In) Mixed Oxide Catalysts. 2. Preparation by Sol-Gel Method. Chem. Mater. 2008, 20, 1585–1596. 10.1021/cm071809e. [DOI] [Google Scholar]
- Kelly K. L.; Coronado E.; Zhao L. L.; Schatz G. C. The optical properties of metal nanoparticles: The influence of size, shape and dielectric environment. J. Phys. Chem. B 2003, 107, 668–677. 10.1021/jp026731y. [DOI] [Google Scholar]
- Bayal N.; Jeevanandam P. Synthesis of TiO2-MgO mixed metal oxide nanoparticles via sol-gel method and studies on their optical properties. Ceram. Int. 2014, 40, 15463–15477. 10.1016/j.ceramint.2014.06.122. [DOI] [Google Scholar]
- Ahmad T.; Shahazad M.; Phul R. Hydrothermal Synthesis, Characterization and Dielectric Properties of Zirconia Nanoparticles. Mater. Sci. Eng. Int. J. 2017, 1, 100–104. 10.15406/mseij.2017.01.00017. [DOI] [Google Scholar]
- Sarathi P.; Thilagavathi G. Synthesis and Characterization of Titanium Dioxide Nanoparticles and their Applications to Textile for Microbe Resistance. J. Text. Appar. Technol. Manag. 2009, 6, 1–8. [Google Scholar]
- Lisa C. K. A review of Sol–Gel Science—The Physics and Chemistry of Sol–Gel Processing. Mater. Manuf. Processes 1990, 9, 1007–1008. 10.1080/10426919408934968. [DOI] [Google Scholar]
- Angel J. D.; Aguilera A. F.; Galindo I. R.; Martínez M.; Viveros T. Synthesis and Characterization of Alumina-Zirconia Powders Obtained by Sol-Gel Method: Effect of Solvent and Water and Addition Rate. Mater. Sci. Appl. 2012, 3, 650–657. 10.4236/msa.2012.39095. [DOI] [Google Scholar]
- Hirvonen A.; Nowak R.; Yamamoto Y.; Sekino T.; Niihara K. Fabrication, structure, mechanical and thermal properties of zirconia-based ceramic nanocomposites. J. Eur. Ceram. Soc. 2006, 26, 1497–1505. 10.1016/j.jeurceramsoc.2005.03.232. [DOI] [Google Scholar]
- Arantes T. M.; Mambrini G. P.; Stroppa D. G.; Leite E. R.; Longo E.; Ramirez A. J.; Camargo E. R. Stable Colloidal Suspensions of Nanostructured Zirconium Oxide synthesized By Hydrothermal Process. J. Nanopart. Res. 2010, 12, 3105–3110. 10.1007/s11051-010-9906-5. [DOI] [Google Scholar]
- Nimare P.; Koser A. A. Biological Synthesis of ZrO2 Nanoparticle using Azadirachta Indica Leaf Extract. Int. J. Eng. Technol. 2016, 3, 1910–1912. [Google Scholar]
- Geethalakshmi K.; Prabhakaran T.; Hemalatha J. Dielectric Studies on Nano Zirconium Dioxide Synthesized through Co-precipitation Process. Int. J. Mater. Metall. Eng. 2012, 6, 256–259. [Google Scholar]
- Liu X.; Lu G.; Yan Z. Preliminary synthesis and characterization of mesoporous nanocrystalline zirconia. J. Nat. Gas Chem. 2003, 12, 161–166. [Google Scholar]
- Singh A. K.; Nakate U. T. TiO2 Microwave Synthesis, Electrophoretic Deposition of Thin Film, and Photocatalytic Properties for Methylene Blue and Methyl Red Dyes. ISRN Nanotechnol. 2014, 2014, 326747. 10.1155/2014/326747. [DOI] [Google Scholar]
- Madhusudhana R.; Sangamesha M. A.; Gopal Krishne Urs R.; Krishnamurthy L.; Shekar G. L. Synthesis and Characterization of Zirconia by Simple Sol-Gel Route. Int. J. Adv. Res. 2014, 2, 433–436. [Google Scholar]
- Hu C.; Zhang Z.; Liu H.; Gao P.; Wang Z. L. Direct Synthesis and Structure Characterization of Ultrafine CeO2 Nanoparticles. Nanotechnology 2006, 17, 5983–5987. 10.1088/0957-4484/17/24/013. [DOI] [Google Scholar]
- Meruvu H.; Vangalapati M.; Chippada S. C.; Bammidi S. R. Synthesis and Characterization of Zinc Oxide Nanoparticles and its Antimicrobial Activity against Bacillus subtilis and Escherichia coli. Rasayan J. Chem. 2011, 4, 217–222. [Google Scholar]
- Bahari A.; Ghanbari M. Low Temperature Synthesis of ZrO2 and CrO2 by Sol-Gel Process. Int. J. ChemTech Res. 2011, 3, 1686–1691. [Google Scholar]
- Mahwish B.; Robina A.; Muhammad I.; Saira R.; Shahzad N.. Synthesis and Characterization of ZrO2–ZnO Nanoparticles. In Proceedings of 2013 World Congress on Advances in Nano, Biomechanics, Robotics and Energy Research (ANBRE); COEX seoul: Korea, 2013.
- Kołodziejczak-Radzimska A.; Jesionowski T. Zinc Oxide—From Synthesis to Application: A Review. Materials 2014, 7, 2833–2881. 10.3390/ma7042833. [DOI] [PMC free article] [PubMed] [Google Scholar]
- Gordon T.; Perlstein B.; Houbara O.; Felner I.; Banin E.; Margel S. Synthesis and characterization of zinc/iron oxide composite nanoparticles and their antibacterial properties. Colloids Surf., A 2011, 374, 1–8. 10.1016/j.colsurfa.2010.10.015. [DOI] [Google Scholar]
- Lanje A. S.; Sharma S. J.; Ningthoujam R. S.; Ahn J.-S.; Pode R. B. Low temperature dielectric studies of zinc oxide (ZnO) nanoparticles prepared by precipitation method. Adv. Powder Technol. 2013, 24, 331–335. 10.1016/j.apt.2012.08.005. [DOI] [Google Scholar]
- Yue S.; Yan Z.; Shi Y.; Ran G. Synthesis of zinc oxide nanotubes within ultrathin anodic aluminium oxide membrane by sol–gel method. Mater. Lett. 2013, 98, 246–249. 10.1016/j.matlet.2013.02.037. [DOI] [Google Scholar]
- Alswat A. A.; Ahmad M. B.; Saleh T. A. Preparation and Characterization of Zeolite/Zinc Oxide-Copper Oxide Nanocomposites: Antibacterial Activities. Colloid Interface Sci. Commun. 2017, 16, 19–24. 10.1016/j.colcom.2016.12.003. [DOI] [Google Scholar]
- Alswat A. A.; Ahmad M. B.; Saleh T. A.; Hussein M. Z. B.; Ibrahim N. A. Effect of Zinc oxide amounts on the properties and antibacterial activities of zinc oxide/zeolite nanocomposite. Mater. Sci. Eng., C 2016, 68, 505–511. 10.1016/j.msec.2016.06.028. [DOI] [PubMed] [Google Scholar]
- Kołodziejczak-Radzimska A.; Markiewicz E.; Jesionowski T. Structural Characterisation of ZnO Particles Obtained by the Emulsion Precipitation Method. J. Nanomater. 2012, 2012, 1–9. 10.1155/2012/656353. [DOI] [Google Scholar]
- Ozcelik B. K.; Ergun C. Synthesis of ZnO nanoparticles by an aerosol process. Ceram. Int. 2014, 40, 7107–7116. 10.1016/j.ceramint.2013.12.044. [DOI] [Google Scholar]
- Rossignol S.; Madier Y.; Duprez D. Preparation of zirconia-ceria materials by soft chemistry. Catal. Today 1999, 50, 261–270. 10.1016/s0920-5861(98)00508-2. [DOI] [Google Scholar]
- Sharma S.; Naik D.; Agarwala V. Synthesis, Characterization and Antibacterial Activity of ZnO Nanoparticles of Different Morphology. Adv. Mater. Res. 2012, 585, 154–158. 10.4028/www.scientific.net/amr.585.154. [DOI] [Google Scholar]
- Bayal N.; Jeevanandam P. Synthesis of TiO2-MgO mixed metal oxide nanoparticles via sol-gel method and studies on their optical properties. Ceram. Int. 2014, 40, 15463–15477. 10.1016/j.ceramint.2014.06.122. [DOI] [Google Scholar]
- Maneerung T.; Tokura S.; Rujiravanit R. Impregnation of silver nanoparticles into bacterial cellulose for antimicrobial wound dressing. Carbohydr. Polym. 2008, 72, 43–51. 10.1016/j.carbpol.2007.07.025. [DOI] [Google Scholar]
- Chudobova D.; Nejdl L.; Gumulec J.; Krystofova O.; Rodrigo M.; Kynicky J.; Ruttkay-Nedecky B.; Kopel P.; Babula P.; Adam V.; Kizek R. Complexes of Silver (I) Ions and Silver Phosphate Nanoparticles with Hyaluronic Acid and/or Chitosan as Promising Antimicrobial Agents for Vascular Grafts. Int. J. Mol. Sci. 2013, 14, 13592–13614. 10.3390/ijms140713592. [DOI] [PMC free article] [PubMed] [Google Scholar]
- Rolison D. R.; Dunn B. Electrically Conductive Oxide Aerogels: New Materials in Electrochemistry. J. Mater. Chem. 2001, 11, 963–980. 10.1039/b007591o. [DOI] [Google Scholar]
- Alswat A. A.; Ahmad M. B.; Hussein M. Z.; Ibrahim N. A.; Saleh T. A. Copper oxide nanoparticles-loaded zeolite and its characteristics and antibacterial activities. J. Mater. Sci. Technol. 2017, 33, 889–896. 10.1016/j.jmst.2017.03.015. [DOI] [Google Scholar]
- JCPDS , Powder Diffraction File, Alphabetical Index, Inorganic Compounds; International Centre for Diffraction Data: Newtown Square, Pa, USA, 1977. [Google Scholar]
- Saleh T. A. Mercury sorption by silica/carbon nanotubes and silica/activated carbon: a comparison study. J. Water Supply: Res. Technol.--AQUA 2015, 8, 892–903. 10.2166/aqua.2015.050. [DOI] [Google Scholar]
- Fathima J. B.; Pugazhendhi A.; Venis R. Synthesis and characterization of ZrO2 nanoparticles antimicrobial activity and their prospective role in dental care. Microb. Pathog. 2017, 110, 245–251. 10.1016/j.micpath.2017.06.039. [DOI] [PubMed] [Google Scholar]
- Chitra K.; Annandurai G. Antimicrobial activity of wet chemically engineered spherical shaped nanoparticles on the foodborne pathogen. Int. Food Res. J. 2013, 20, 59–64. [Google Scholar]
- Santos M. A. F. e.; Lôbo I. P.; Cruz R. S. da Synthesis and Characterization of Novel ZrO2 -SiO2 Mixed Oxides. Mater. Res. 2014, 3, 700–707. 10.1590/s1516-14392014005000046. [DOI] [Google Scholar]
- Cameron M. A.; George S. M. ZrO 2 film growth by chemical vapor deposition using zirconium tetra- tert- butoxide. Thin Solid Films 1999, 348, 90–98. 10.1016/s0040-6090(99)00022-x. [DOI] [Google Scholar]
- Tiwari V.; Mishra N.; Gadani K.; Solanki P. S.; Shah N. A.; Tiwari M. Mechanism of Anti-bacterial Activity of Zinc Oxide Nanoparticle against Carbapenem-Resistant Acinetobacter baumannii. Front. Microbiol. 2018, 9, 1218. 10.3389/fmicb.2018.01218. [DOI] [PMC free article] [PubMed] [Google Scholar]
- Ho C. L.; Teo S. S.; Rahim R. A.; Phang S.-M. Transcripts of Gracilaria changii that improve copper tolerance of Escherichia coli. Asia Pac. J. Mol. Biol. Biotechnol. 2010, 18, 315–319. [Google Scholar]


