

Abstract
Recent evidence suggests the spontaneous BOLD signal synchronization of corresponding interhemispheric, homotopic regions as a stable trait of human brain physiology, with emerging differences in such organization being also related to some pathological conditions. To understand whether such brain functional symmetries play a role into higher‐order cognitive functioning, here we correlated the functional homotopy profiles of 119 healthy subjects with their intelligence level. Counterintuitively, reduced homotopic connectivity in above average‐IQ versus average‐IQ subjects was observed, with significant reductions in visual and somatosensory cortices, supplementary motor area, rolandic operculum, and middle temporal gyrus, possibly suggesting that a downgrading of interhemispheric talk at rest could be associated with higher cognitive functioning. These regions also showed an increased spontaneous synchrony with medial structures located in ipsi‐ and contralateral hemispheres, with such pattern being mostly detectable for regions placed in the left hemisphere. The interactions with age and gender have been also tested, with different patterns for subjects above and below 25 years old and less homotopic connectivity in the prefrontal cortex and posterior midline regions in female participants with higher IQ scores. These findings support prior evidence suggesting a functional role for homotopic connectivity in human cognitive expression, promoting the reduction of synchrony between primary sensory regions as a predictor of higher intelligence levels. Hum Brain Mapp 36:3586–3602, 2015. © 2015 Wiley Periodicals, Inc.
Keywords: intelligence, brain asymmetry, resting state, connectivity, homotopy, individual differences
INTRODUCTION
Understanding the neurobiological underpinnings of higher order cognitive abilities is an intriguing topic of contemporary neuroscience, with increasing evidence for a multifactorial structure encompassing genetic, molecular, and environmental agents [Colom et al., 2010; Deary et al., 2010]. In this framework, one of the most influential contributor to functional optimization is regional specialization, a neocortical brain property slowly developed through human evolution [Geschwind, 1979]. Regional specializations thought to contribute, through the development of structural and functional asymmetries between the two hemispheres, to the genesis and development of human language [Geschwind, 1972], memory [Rossi et al., 2001; Rossi et al., 2004], and abstract reasoning abilities [Allen et al., 2007]. In this context, the degree of asymmetry has been considered a marker of physiologically adequate development, and thus it has been associated with enhanced cognition [Rogers et al., 2004], while an abnormal lateralization has been described in psychiatric disorders such as autism [Escalante‐Mead et al., 2003; Kleinhans et al. 2008], depression [Herrington et al., 2010], and schizophrenia [Altamura et al., 2012; Ribolsi et al., 2009]. Interestingly, this regional specialization somehow contrasts with another, long‐standing, brain property: functional homotopy (FH). As a matter of fact, corresponding neocortical regions are not only anatomically connected through a high proportion of callosal fibers [Innocenti, 1986], but also display coherent functional activity. Resting‐state electroencephalografic evidence [Duffy et al., 1996] has been extended to a finer spatial resolution by functional magnetic resonance imaging (fMRI) studies that documented a high degree of functional connectivity (FC), expressed by coherence in spontaneous activity between corresponding, homotopic regions [Salvador et al., 2008; Stark et al., 2008]. However, remarkable regional variation exists, with sensorimotor cortex exhibiting stronger homotopic connectivity, while a weaker connection seems to be present between prefrontal and temporo‐parietal homotopic association areas [Stark et al., 2008]. Moreover, FH appears to be age‐dependent across the life span, with different patterns identified during development [Fair et al., 2007, 2008; Fransson et al., 2007; Supekar et al., 2009], adulthood [Biswal et al., 2010; Zuo et al., 2010], and aging [Andrews‐Hanna et al., 2007]. Accordingly, such measures of homotopic connectivity have been implicitly interpreted as indices of physiological well‐being, possibly explaining the deficit that accompanies pathological conditions associated with reduced regionally‐specific homotopy, such as multiple sclerosis [Zhou et al., 2013]. The regional and interindividual variability in homotopic connectivity suggests that different FH patterns may modulate diverse cognitive expressions, possibly extending to intelligence quotient (IQ) profiles. While several studies have shown, for instance, associations between intelligence and brain total and regional volumes [Jung and Haier, 2007; Rushton and Ankney, 2009], structural connectivity [Chiang et al., 2008], networks interplay [Song et al., 2008], and efficiency of information processing [da Rocha et al., 2011; Neubauer and Fink, 2009; Santarnecchi et al., 2014a,2014bb; van den Heuvel et al., 2009], investigations of the relation between homotopic connectivity and intelligence do not exist to date. Here, we analyzed resting‐state fMRI data of 119 healthy adult individuals, correlating their FH maps with intelligence levels as assessed by validated instruments. The main goal was threefold: (i) identify differences in homotopic connectivity between low and high IQ subjects, and (ii) characterize these differences in terms of their left or right‐hemispheric localizations as well as (iii) unveil age and gender‐related differences.
MATERIALS AND METHODS
Participants
Behavioral and neuroimaging data are included in the NKI‐Rockland database (http://www.fcon_1000.projects.nitrc.org). The institutional review boards of New York University Langone Medical Center and New Jersey Medical School approved the receipt and dissemination of the data [Song et al., 2012]. The original database includes 207 right/left‐handed healthy volunteers with an age range 8–86 years. To rule out the effect of the “gender‐intelligence” [Biswal et al., 2010; Haier et al., 2005] and “gender‐brain structural/functional asymmetry” [Gong et al., 2011; Tomasi and Volkow, 2012] interactions, a selection was performed to obtain a subsample of solely right‐handed subjects with (i) an equal number of males and females per decade (decades = 18–25 years, 26–35 years, 36–45 years, 46–55 years, 56–65 years) and (ii) an equal number of subjects belonging to each decade (∼20). The selection resulted in a final sample of 119 subjects (59 males), with mean age of 33 years (range 18–62, SD = 13). The study protocol has been approved by the University of Siena Ethical committee.
Intelligence Evaluation
IQ was estimated using the Wechsler abbreviated scale of intelligence (WASI) [Wechsler, 1999], a short version of both the Wechsler adult scale of intelligence (WAIS‐III) [Wechsler, 1997], and the Wechsler intelligence scale for children (WISC‐IV) [Wechsler, 2003]. The WASI consists of four subscales: Vocabulary, Similarities, Block Design, and Matrix Reasoning. Three different scores are obtained with WASI administration, (i) a standardized, full‐scale intelligence quotient (FSIQ), (ii) a verbal IQ score (VIQ) which indexes word knowledge, verbal reasoning, and concept formation and a (iii) performance IQ score (PIQ) representing abstract reasoning skills, visual information processing, visual‐motor coordination, simultaneous processing, and learning abilities. WASI demonstrated high concurrent validity (i.e., correlation with the WAIS‐III FSIQ, r =0.92; n = 248), as well as good reliability coefficients (0.92–0.98 for VIQ, 0.94–0.97 for PIQ, 0.96–0.98 for the full FSIQ) [Ryan et al., 2003]. Sample characteristics in terms of IQs, subtests scores and WASI correlational structures are reported in Table 1. A median split approach was applied to obtain two groups reflecting high and low intelligence levels (i.e., IQ scores) within our sample, leading to an “Above Average” IQ group composed by participants with an overtly above average IQ score (n = 62; mean age = 33 ± 11; males = 33; mean FSIQ = 122 ± 3; mean VIQ = 116 ± 4; mean PIQ = 116 ± 5; referred to as AA‐IQ hereafter), and a “Average” (A‐IQ hereafter) one (n = 57; mean age = 32 ± 11; males = 26; mean FSIQ = 92 ± 7; mean VIQ = 91 ± 4; mean PIQ = 89 ± 4). Groups did not differ for age (t = 0.184, P = 0.882) or gender distribution (χ 2 = 0.405, P = 0.5498).
Table 1.
Sample characteristics. IQs and subtests scores for the entire sample are reported, as well their correlational structure, computed through age and gender corrected partial correlation coefficients
| (A) | ||||||||
|---|---|---|---|---|---|---|---|---|
| M 119 | SD119 | VIQ | PIQ | BD | VOC | SIM | MAT | |
| FSIQ | 110 | 11 | 0.689** | 0.845** | 0.897** | 0.412** | 0.523** | 0.902** |
| VIQ | 108 | 13 | 0.821** | 0.512** | 0.917** | 0.824** | 0.456** | |
| PIQ | 109 | 11 | 0.834** | 0.743** | 0.745** | 0.813** | ||
| BD | 55 | 8 | 0.423** | 0.536** | 0.764** | |||
| VOC | 54 | 7 | 0.577** | 0.357** | ||||
| SIM | 55 | 8 | 0.472** | |||||
| MAT | 55 | 9 |
| (B) | Above average (n = 62) | Average (n = 57) | (C) | ANCOVA | |||
|---|---|---|---|---|---|---|---|
| M 119 | SD119 | M 119 | SD119 | F | Sig. | ||
| 122 | 3 | 92 | 7 | 161.1 | <0.001 | ||
| 116 | 4 | 91 | 4 | 52.1 | <0.001 | ||
| 117 | 5 | 89 | 4 | 84.2 | <0.001 | ||
| 63 | 4 | 40 | 6 | 123.5 | <0.001 | ||
| 59 | 7 | 49 | 10 | 9.8 | <0.013 | ||
| 60 | 6 | 48 | 6 | 14.7 | <0.008 | ||
| 63 | 4 | 44 | 9 | 63.2 | <0.001 | ||
**Correlation is significant at the 0.01 level (two‐tailed).
Resting State fMRI: Theory, Data Acquisition, and Processing
Our brain is a complex system of interconnected regions spontaneously organized into distinct networks [Hagmann et al., 2008; Sporns, 2014]. The integration of information between and within these specialized, spatially distributed but functionally linked brain regions is a continuous process that can be observed even when the brain is in a quiescent state, that is, not engaged in any particular task [Greicius et al., 2003; Raichle et al., 2001; Stam, 2004]. Such intrinsic organization of spontaneous brain activity is captured within the framework of brain connectivity analysis, a novel approach based on resting‐state fMRI analysis [Achard et al., 2006]. Differently from the canonical task‐fMRI paradigm, where the signal is derived by contrasting subject's activity during an active and a passive states, this novel approach relies on the endogenous brain oscillations recorded during spontaneous rest, with the activity of each brain regions being correlated with each others, giving rise to a complex pattern of temporally and spatially independent resting state networks [Biswal et al., 2010]. Such methodology has been proven to hold enough information not only to allow the identification of pathological conditions (like multiple sclerosis [Bonavita et al., 2011], schizophrenia [Bassett et al., 2008], and Alzheimer [Agosta et al., 2012]) but also to identify the correlates of several cognitive [Santarnecchi et al., 2014a; Yuan et al., 2012] and psychological individual traits [Adelstein et al., 2011] in healthy subjects.
The analysis of homotopic connectivity, therefore, requires the acquisition of resting‐state fMRI data, and the computation of the temporal dependency between symmetrical brain regions located in the two hemispheres. Neuroimaging data were acquired on a 3.0 T Siemens MAGNETOM TrioTim (Siemens Medical Solutions, Erlangen, Germany). A three‐dimensional T1‐weighted MPRAGE image was acquired in the axial plane (TR/TE 2500/3.5 ms; 192 slices; slice thickness 1 mm; flip angle 8°; voxel size 1.0 × 1.0 × 1.0 mm). Resting‐state fMRI data were acquired using T2‐weighted BOLD images (TR/TE 2500/30 ms; 38 interleaved slices; slice thickness 3 mm; 260 volumes; flip angle 80°; voxel size 3.0 × 3.0 × 3.0 mm). Data were preprocessed and analyzed at the Department of Medicine, Surgery and Neuroscience at University of Siena. Functional image preprocessing was performed using SPM8 (Wellcome Department of Cognitive Neurology, Institute of Neurology, University College London; http://www.fil.ion.ucl.ac.uk/spm/) within the MATLAB scientific computing environment (http://www.mathworks.com, MathWorks, MA). The first five volumes of functional images were discarded for each subject to allow for steady‐state magnetization. EPI images were then corrected for inhomogeneity using fieldmap regression; stripped of skull and other noncerebral tissues; slice‐timed using interleaved descending acquisition; manually realigned and subsequently resliced. Importantly, two recent studies suggested that head motion during MRI scanning may produce significant changes in FC estimates [Power et al., 2012; Van Dijk et al., 2012]. Controlling for such a confounding factor is particularly important in the context of homotopic connectivity, as head motion correction procedure might apply similar transformations to couples of correspondent voxels in the two hemispheres. To address this issue, we proceeded with an interpolation procedure based on the displacement indexes proposed by Power et al. [2012], that is, frame‐wise displacement (FD) and the RMS variance of the temporal derivative (DVARS). Time points showing FD > 0.5 mm and DVARS > 0.5 have been interpolated using a cubic spline function [Power et al., 2012]. Structural images were coregistered to the mean volume of functional images and subsequently segmented using the NewSegment routine in SPM8. A Hidden Markov Random Field model was applied to remove isolated voxels. Moreover, to obtain a more accurate spatial normalization, we applied the SPM8 DARTEL (Diffeomorphic Anatomical Registration Through Exponential Lie algebra) module, creating a customized gray matter template from all subjects’ segmented images [Ashburner, 2007]. A nonlinear normalization procedure with subsequent affine‐only normalization to the Montreal neurological institute (MNI) template brain, and voxel resampling to an isotropic 3 × 3 × 3 mm voxel size, were then applied to functional images. Linear trends were removed to reduce the possible influence of the rising temperature of the MRI scanner and all functional volumes were band‐pass filtered at 0.01 Hz < f < 0.08 Hz to reduce low‐frequency drifts. Finally, the potential contribution of nuisance sources of variability to gray matter BOLD time courses were controlled by regressing out the head motion parameters as well as the signal derived from four regions‐of‐interest (ROIs) placed in the white matter and cerebro‐spinal fluid, an approach that has been shown to significantly enhance within‐subject and test‐retest reliability [Liang et al., 2012; Schwarz and McGonigle, 2011].
Homotopic Connectivity
>Homotopic Resting‐State functional connectivity was computed as the Pearson correlation (Fisher's Z‐transformed) between every pair of symmetric interhemispheric voxels’ time‐series. The resultant correlation maps define voxel‐mirrored homotopic connectivity (VMHC) as described by Zuo et al. [2010]. To account for interhemispheric anatomical variability, individual structural images were normalized to MNI space using a group‐specific symmetrical template. This was created by first averaging individual images, and then averaging the mean image across hemispheres. Each subject's image was nonlinearly registered to this symmetrical template and the resulting transformation matrices were applied to their respective preprocessed functional datasets. This led to complete correspondence between left and right hemispheres’ voxels, allowing for the computation of meaningful voxel‐wise interhemispheric correlations. Considering that template creation procedures may lead to blurring and artifactual increases of VMHC values for mesial regions, voxels within 3 mm from the midline were not included in the analysis [Kelly et al., 2011]. Moreover, to address potential confounds associated with interhemispheric structural asymmetry, we calculated both unsmoothed and 6‐mm smoothed images and compared VHMC values before entering the between‐group analyses. H‐IQ and A‐IQ group VHMC maps were compared through a voxel‐wise F‐test controlling for age, total brain volume (TBV) and gender. Moreover, given that homotopic connectivity plausibly relies on the integrity and efficiency of corpus callosum (CC) connections linking mirrored regions in the two hemispheres [Innocenti, 1986], we use segmented T1‐weighted images to derive the volume of the CC for each participant and include such values as additional covariate in each ANCOVA analysis. Corrections for multiple comparisons were performed using Gaussian Random Field theory (two‐tailed, min Z > 2.239, voxel level P < 0.01, cluster level P < 0.05, corrected).
Hierarchical Functional Classification
VHMC has been shown to follow a hierarchical subdivision of brain regions [Stark et al., 2008] which mainly reflect the functional classification as a primary sensory‐motor, unimodal association, or heteromodal association areas, as described by Mesulam [Mesulam, 2000]. This leads to different degrees of homotopic connectivity between voxels belonging to each of these classes, in agreement with anatomical, electrophysiological, lesion, and functional imaging studies in humans and nonhuman primates [Hopkins et al., 2007; Stark et al., 2008; Zhang et al., 2010]. Consequently, to test the hypothesis that VHMC levels within this hierarchy might show differences related to intelligence, we parcellated functional data using the Harvard–Oxford Structural Atlas, a probabilistic atlas comprised of 112 regions (56 per hemisphere) [Kennedy et al., 1998; Makris et al., 1999]. Briefly, hierarchical subdivisions define (i) primary sensory‐motor cortices as the postcentralgyrus (somatosensory), intracalcarine cortex and occipital pole (visual), Heschl'sgyrus (auditory), and precentralgyrus (motor), (ii) unimodal association areas, adjacent to primary sensory cortices, and (iii) heteromodal association areas, located primarily in prefrontal and temporoparietal cortices, responsible for integration of information across multiple sensory domains and sensory‐motor integration. Additionally, we also parcellated subcortical structures into three main categories, (i) limbic, (ii) paralimbic, and (iii) subcortical regions [Mesulam, 2000] (see Supporting Information Table S1 for a complete listing of each region's functional classification). Mean values for each of six categories were compared between H‐IQ and A‐IQ groups using a t‐test (P < 0.05, Bonferroni corrected).
Seed‐Based Functional Connectivity Analysis
Apart from the reference to “symmetry,” differences in VHMC are basically expressions of differences in voxels’ connectivity profile. For instance, a VHMC map which shows voxels belonging to motor cortex having different homotopic connectivity values between two groups of individuals (i.e., high vs average IQ or male vs female) practically means that one of these voxels, or both, are differently “connected” to the rest of the brain and consequently also to their mirrored counterpart. Critically, the speculative nature of VHMC maps does not allow us to identify which voxel (right and left) mostly contributes to this observed between‐group difference. To determine if bilateral or side‐specific voxels’ connectivity profile variation contributes to differences into intelligence levels, we computed a seed‐based FC analysis using regions showing different VHMC values. We created spherical ROIs (diameter = 5 mm) over each significant clusters’ local maxima, obtaining corresponding right (MNI coordinate x = +) and left (MNI coordinate x = −) ROIs which were used to compute whole‐brain FC maps. Consequently, a statistical comparison has been performed by entering high and low IQ subjects’ FC maps into a group‐level voxel‐wise ANCOVA, controlling for age, TBV, gender, and CC volume. Multiple comparisons corrections were performed using Gaussian Random Field theory (two‐tailed, min Z > 2.239, voxel level P < 0.01, cluster level P < 0.05, corrected).
Age and gender‐Related Differences in Homotopic Connectivity
All previous analyses were corrected by age and represent a net evaluation of the interplay between homotopic connectivity and intelligence. To understand how the interaction between VHMC and intelligence may change over time, we additionally split the overall sample into five decades (18–25 years; 26–35 years; 36–45 years; 46–55 years; 56–65 years) and thus compared VHMC maps of AA‐IQ and A‐IQ individuals belonging to each decade (voxel‐wise F‐test controlling for age, TBV, gender, and CC volume). To ease results interpretation, resulting maps, representing the average cortical VHMC values distribution in each different decade, have been parcellated using both (i) hierarchical and (ii) lobar schemes. Moreover, given the existence of potentially interesting gender‐related differences in the interaction between IQ and mirrored connectivity, we split our sample in male and female participants and computed the correlation between their VHMC maps and their FSIQ, VIQ, and PIQ scores. A comparison of the average VHMC values in male/female and High/Average participants have been also tested, running a two way between‐subjects ANOVA including factor Gender and Intelligence. All analyses have been corrected for TBV and Age values. Corrections for multiple comparisons were performed using Gaussian Random Field theory (two‐tailed, min Z > 2.239, voxel level P < 0.01, cluster level P < 0.05, corrected).
RESULTS
Intelligence Related Differences in Mirrored Connectivity
Both A‐IQ and H‐IQ participants showed the already documented trend for stronger VHMC between primary cortical regions including visual, motor, and somatosensory cortices as well cingulate cortex, whereas prefrontal and temporoparietal, associationcortices showed relatively weaker VHMC (Fig. 1A,B). Group comparisons revealed a set of regions where A‐IQ subjects exhibited stronger VMHC than H‐IQ ones, as expressed in the connectivity matrix (Fig. 1C). These regions correspond to primary somatosensory cortex (Brodmann area 3, MNI x = ±24, y = −30, z = 62), premotor cortex and supplementary motor area (Brodmann area 6, MNI x = ±23, y = −3, z = 60), visual cortex (Brodmann areas 23 and 31, MNI x = ±15, y = −69, z = 12), rolandic operculum (Brodmann area 43, MNI x = ±56, y = −8, z = 20), middle temporal gyrus (Brodmann area 21, MNI x = ±59, y = −30, z = −2). Clusters’ cytoarchitectonic mapping is reported in Supporting Information Figure S1. None of the regions exhibited stronger VMHC in H‐IQ subjects respect to A‐IQ ones. Connectivity matrices derived from ROIs‐to‐ROIs (right and left) Pearson correlations (Fig. 1C) showed increased connectivity between ROIs pairs in A‐IQ group. Total VHMC values did not differ between groups (F (118) = 1.732, P = 0.191) or as a function of the smoothing kernel applied (F (118) = 0.178, P = 0.652; Fig. 2A,C).
Figure 1.
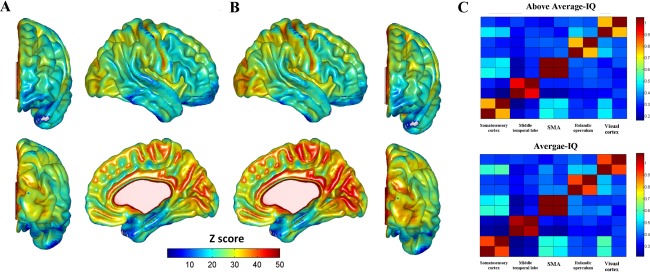
VHMC maps, seed‐based FC and hierarchical homotopic connectivity. Whole‐brain voxelwise mirrored homotopic connectivity patterns in AA‐IQ (A) and A‐IQ subjects (B). VHMC is reported using four surfaces representing the right hemisphere. Subjects with lower IQs show an increased synchronization between structures located in visual and somatosensory cortices, temporal lobe, rolandic operculum, and supplementary motor area. (C) Time series have been extracted from spherical ROIS (5 mm diameter) placed in correspondence to the local maxima of clusters obtained through the voxel‐wise comparisons of AA‐IQ versus A‐IQ subjects VHMC maps. Seed regions correspond to both left and right‐sided representations of aforementioned brain regions. Decreased homotopic interhemispheric connectivity is evident in high IQ subjects’ connectivity matrices (upper panel).
Figure 2.
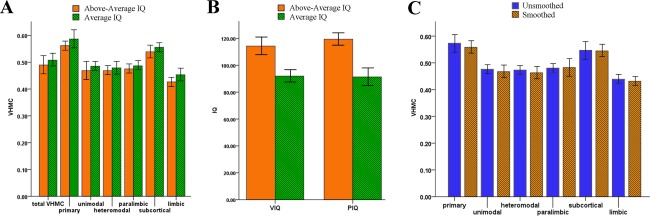
Confounding factors. Hierarchical analysis showed an overall pattern for reduced VHMC in AA‐IQ group (A), encopassing primary, unimodal, heteromodal, and subcortical brain regions. Several possible confounding factors have been taken into account to explain the IQ‐related effect on VHMC values. In this context, such differences do not depend to unbalanced verbal and performance IQ levels (B) or to the impact of smoothing on VHMC maps (C) (0 mm vs 6 mm kernel). Note: VIQ, verbal intelligence quotient; PIQ, performance intelligence quotient. [Color figure can be viewed in the online issue, which is available at http://wileyonlinelibrary.com.]
Hierarchical Classes Comparison
The overall pattern of VMHC globally reflected previous evidence using this technique [Gee et al., 2011; Stark et al., 2008; Zuo et al., 2010], showing a trend for higher FH in primary sensory regions, that is, visual, motor, somatosensory, with heteromodal brain area (involved into multisensorial integration) showing lower interhemispheric synchronization. ANCOVA analysis revealed no between‐groups significant differences in VHMC values for any of the functional classes (primary F (118) = 2.308, P = 0.131; unimodal F 118 = 1.196, P = 0.276; heteromodal F 118 = 0.645, P = 0.424; limbic F (118) = 1.887, P = 0.172; paralimbic F (118) = 0.746 P = 0.389; subcortical F (118) = 1.139, P = 0.288). However, an overall trend of lower VHMC in A‐IQ subjects can be observed (Fig. 2A).
Age and Gender Related Differences
Regards the comparison between different decades, results referring to the mean VHMC difference between H‐IQ and A‐IQ individuals at voxel, hierarchical, and lobar level have been plotted across time (decades) in Figure 3A–C, respectively. Despite the overall differences in homotopic connectivity depicted in Figure 1, subsamples analysis supports an interesting opposite pattern between AA‐IQ and A‐IQ subjects in the 18–25 years decade, where an increase in homotopic connectivity is observable for primary and unimodal brain regions in H‐IQ subjects. However, given the relatively small sample size of each subsample, further evaluations are needed to confirm and possibly deepen such potentially interesting longitudinal fluctuations.
Figure 3.
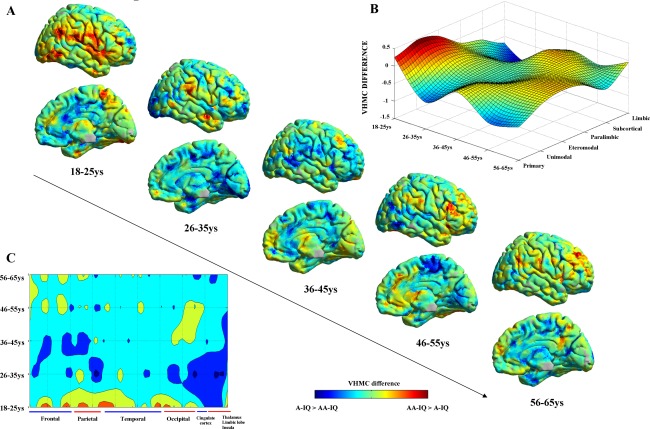
Age‐related changes into homotopic connectivity versus intelligence level. Panel A, B, and C, respectively, report the results of AA‐IQ and A‐IQ subjects VHMC comparisons at voxel, hierarchical, and lobar levels for five different decades. Panel A shows the voxel‐wise distribution of differences in VHMC over the entire brain (right‐hemisphere is shown only for visualization purposes, as VHMC analysis produces specular results for both hemispheres). Panels B and C highlight a suggestive interaction between IQ, homotopic connectivity, and age where an increased homotopic connectivity in primary and unimodal brain regions is visible for H‐IQ subjects for subjects in the first decade (18–25 years), with a switch to an opposite patter for the remaining decades (26–65 years). [Color figure can be viewed in the online issue, which is available at http://wileyonlinelibrary.com.]
The ANCOVA model for gender‐related differences did show a trending to significance interaction between Gender and Intelligence (F (117) = 2.356, P = 0.083), which did not reach statistical significance possibly due to the small sample size of each subgroup. As shown in Figure 4, the correlation maps between mirrored connectivity and FSIQ, PIQ, and VIQ scores highlighted a different pattern for male and female located in the prefrontal cortex (mostly in the fronto‐polar cortex—BA10) and precuneus/cuneus regions, where an increased correlation with intelligence level in female participants is visible.
Figure 4.
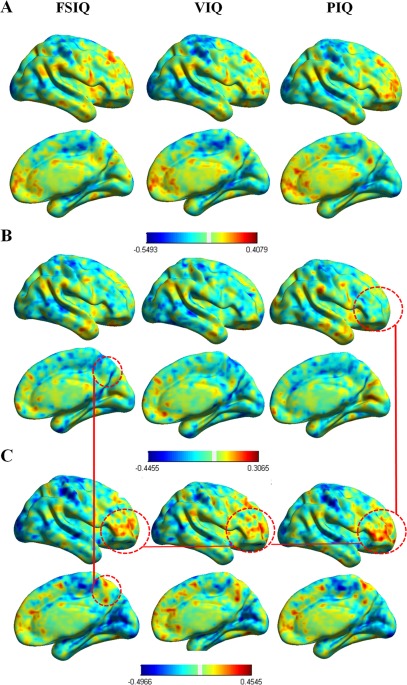
Gender related differences. Panel A, B, and C, respectively, report the correlation between Intelligence level (FSIQ, VIQ, PIQ) and brain FH in the overall sample, male (n = 59) and female participants (n = 60).As highlighted in the red circle, voxel‐wise results show gender‐related differences in the prefrontal lobe—mostly in the pars triangularis and opercularis of the inferior prefrontal lobe (Broca's area, BA44‐45) and the frontopolar cortex (BA10)—, the precuneous (BA7) and posterior cingulate cortex (BA31). Note: BA, Brodmann area. [Color figure can be viewed in the online issue, which is available at http://wileyonlinelibrary.com.]
Seed‐Based Connectivity and the Left Hemisphere
Seed‐based connectivity analysis were performed using BOLD signal time series extracted from 5 mm spheres centered on seed regions obtained from VHMC group comparison, namely 10 regions corresponding to left and right: (i) somatosensory and (ii) premotor/supplementary motor cortices, (iii) middle temporal gyrus, (iv) rolandic operculum, and (v) visual cortex (Fig. 5). ANCOVA results showed an overall pattern of increased connectivity exclusively for A‐IQ subjects. Comparison of left and right seed regions connectivity profiles supports the existence of a left‐lateralized tendency for connectivity increase, with 4 out of 5 ROIs showing significant connectivity alterations limited to seeds placed in the left hemisphere, while only the somatosensory cortex showed a bilateral FC increase, which is, however, wider for the left counterpart (Fig. 5, for cluster anatomical mappings see Table 2). Such leftward increase in the connectivity level of LA‐IQ subjects may be possibly induced by an inhomogeneous balancing of verbal and PIQs in the two groups. On the contrary, between‐groups comparisons of VIQ and PIQ did not show significant differences (F (118) = 0.245, P = 0.458; Fig. 2A).
Figure 5.
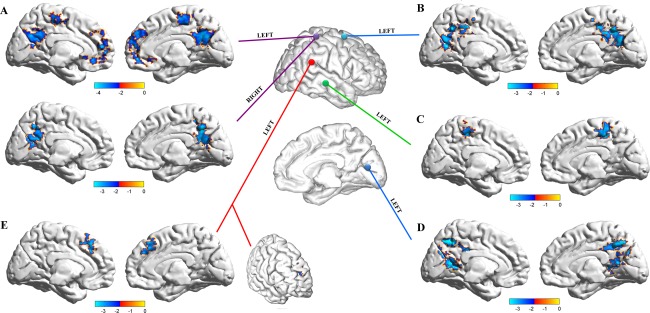
Lateralization of VHMC differences between High and Average IQ subjects. The specular nature of VHMC maps does not allow for the identification of which voxel (right and left) mostly contributes to the differences observed between AA‐IQ and A‐IQ subjects. To overcome this limitation, we computed a seed‐based FC analysis using regions showing different VHMC values. Seed‐based FC maps have been calculated for spherical ROIs placed in left and right somatosensory (A), SMA (B), middle temporal gyrus (C), visual cortex (D), and rolandic operculum (E). FC maps have been compared using a voxel‐wise ANCOVA, controlling for age, TBV, and gender. Multiple comparisons corrections were performed using Gaussian Random Field theory (two‐tailed, min Z > 2.239, voxel level P < 0.01, cluster level P < 0.05, corrected). Results show an overall pattern of increased connectivity for subjects in the A‐IQ group. Comparison of left and right seed regions supports the existence of a left‐lateralized tendency for increased connectivity, with 4 out of 5 ROIs showing significant connectivity alterations limited to the seed placed in the left hemisphere, while 1 (somatosensory cortex) showed a bilateral FC increase, which is, however, wider for left somatosensory cortex. [Color figure can be viewed in the online issue, which is available at http://wileyonlinelibrary.com.]
Table 2.
Seed‐based connectivity analysis results
| Seed regions | Clusters dimension (voxels) | MNI coordinates | Peak t‐value | p | ||
|---|---|---|---|---|---|---|
| x | y | z | ||||
| Left somatosensory cortex | ||||||
| Cluster 1 | 696 | |||||
| Right superior medial gyrus | 12 | 57 | 36 | 4.34 | 0.024 | |
| Right anterior cingulate cortex | 3 | 51 | 12 | 4.28 | 0.027 | |
| Right mid orbital gyrus | 9 | 51 | ‐6 | 4.15 | 0.029 | |
| Right superior medial gyrus | 6 | 54 | 36 | 4.12 | 0.029 | |
| Left superior medial gyrus | −3 | 57 | 3 | 3.95 | 0.032 | |
| Left superior frontal gyrus | −15 | 54 | 30 | 3.66 | 0.033 | |
| Right precuneus | 3 | −60 | 33 | 4.24 | 0.035 | |
| Cluster 2 | 542 | |||||
| Left precuneus | −9 | −54 | 24 | 4.09 | 0.022 | |
| Left posterior cingulate cortex | −6 | −48 | 21 | 3.8 | 0.029 | |
| Right middle cingulate cortex | 3 | −42 | 33 | 3.51 | 0.034 | |
| Left calcarine gyrus | 0 | −60 | 15 | 3.4 | 0.034 | |
| Right cuneus | 15 | −72 | 30 | 2.87 | 0.036 | |
| Left cuneus | −12 | −66 | 27 | 2.84 | 0.039 | |
| Cluster 3 | 397 | |||||
| Left paracentral lobule | −6 | −27 | 54 | 4.42 | 0.022 | |
| Right paracentral lobule | 9 | −30 | 54 | 4.07 | 0.025 | |
| Right SMA | 6 | −21 | 60 | 4.03 | 0.025 | |
| Left postcentral gyrus | −33 | −27 | 69 | 3.48 | 0.028 | |
| Right postcentral gyrus | 12 | −36 | 72 | 3.47 | 0.033 | |
| Left Precuneus | −12 | −39 | 66 | 3.41 | 0.034 | |
| Left SMA | −3 | −9 | 54 | 3.31 | 0.038 | |
| Right superior frontal gyrus | 21 | −12 | 66 | 3.26 | 0.039 | |
| Right somatosensory cortex | ||||||
| Cluster 1 | 624 | |||||
| Left posterior cingulate cortex | −6 | −48 | 21 | 3.68 | 0.021 | |
| Right supramarginal gyrus | 60 | −24 | 39 | 3.67 | 0.024 | |
| Right precuneus | 3 | −57 | 42 | 3.64 | 0.024 | |
| Left Precuneus | −9 | −48 | 45 | 3.52 | 0.026 | |
| Right posterior cingulate cortex | 3 | −54 | 30 | 3.3 | 0.029 | |
| Left rolandic operculum | ||||||
| Cluster 1 | 275 | |||||
| Right SMA | 12 | 21 | 45 | 3.66 | 0.021 | |
| Right superior medial gyrus | 15 | 51 | 30 | 3.61 | 0.027 | |
| Right middle frontal gyrus | 21 | 57 | 27 | 3.53 | 0.028 | |
| Left superior medial gyrus | 3 | 42 | 33 | 3.29 | 0.029 | |
| Right superior medial gyrus | 12 | 42 | 42 | 3.19 | 0.032 | |
| Left SMA | −3 | 24 | 48 | 3.18 | 0.034 | |
| Left SMA‐premotoc cortex | ||||||
| Cluster 1 | 853 | |||||
| Right SMA | 9 | −24 | 51 | 4.42 | 0.019 | |
| Right posterior cingulate cortex | 9 | −42 | 27 | 4.3 | 0.022 | |
| Right precuneus | 3 | −48 | 45 | 3.99 | 0.024 | |
| Left calcarine gyrus | 0 | −60 | 15 | 3.91 | 0.026 | |
| Left precuneus | −12 | −51 | 39 | 3.8 | 0.027 | |
| Right Middle Cingulate Cortex | 6 | −36 | 36 | 3.61 | 0.029 | |
| Left precentral gyrus | −33 | −6 | 63 | 3.52 | 0.030 | |
| Left middle temporal gyrus | ||||||
| Cluster 1 | 391 | |||||
| Left paracentral lobule | −9 | −30 | 54 | 4.38 | 0.023 | |
| Right middle cingulate cortex | 3 | −33 | 51 | 4.05 | 0.024 | |
| Right paracentral lobule | 6 | −36 | 63 | 3.62 | 0.026 | |
| Right postcentral gyrus | 15 | −36 | 60 | 3.62 | 0.028 | |
| Left precuneus | −15 | −42 | 66 | 3.52 | 0.029 | |
| Left postcentral gyrus | −30 | −30 | 72 | 3.42 | 0.029 | |
| Left postcentral gyrus | −30 | −36 | 63 | 3.42 | 0.029 | |
| Left paracentral lobule | −15 | −21 | 78 | 3.39 | 0.030 | |
| Left Paracentral Lobule | 0 | −27 | 57 | 3.27 | 0.032 | |
| Right SMA | 9 | −24 | 51 | 3.26 | 0.033 | |
| Left paracentral lobule | −6 | −30 | 72 | 3.25 | 0.033 | |
| Left posterior cingulate cortex | ||||||
| Cluster 1 | 720 | |||||
| Left precuneus | −3 | −66 | 48 | 4.36 | 0.009 | |
| Left cuneus | −9 | −66 | 27 | 4 | 0.013 | |
| Right precuneus | 9 | −60 | 45 | 3.99 | 0.019 | |
| Left calcarine gyrus | −3 | −60 | 9 | 3.92 | 0.022 | |
| Left posterior cingulate cortex | −9 | −42 | 24 | 3.59 | 0.026 | |
| Cluster 2 | 474 | |||||
| Left precentral gyrus | −51 | 12 | 36 | 4.33 | 0.019 | |
| Left middle frontal gyrus | −39 | 12 | 39 | 3.93 | 0.020 | |
| Left inferior frontal gyrus (p. Triangularis) | −39 | 21 | 27 | 3.83 | 0.021 | |
| Left superior frontal gyrus | −21 | 30 | 48 | 3.41 | 0.024 | |
| Cluster 3 | 379 | |||||
| Left inferior parietal lobule | −42 | −51 | 45 | 4.16 | 0.020 | |
| Left supramarginal gyrus | −54 | −48 | 30 | 3.41 | 0.023 | |
| Left angular gyrus | −51 | −57 | 33 | 3.32 | 0.024 | |
Four regions in the left hemisphere and one bilateral region have been identified as having a different connectivity profile between H‐IQ and LA‐IQ subjects. Table reports cluster dimensions, MNI coordinates and t‐statistics of the brain areas showing a stronger connectivity with seed regions in LA‐IQ subjects with respect to H‐IQ ones
Interestingly, it should be noted that all seed regions report an increase of their FC toward regions belonging to anterior and posterior cingulated cortex, midprefrontal, and parietal regions, which are nodes of the default mode network (DMN) [Fox et al., 2005].
DISCUSSION
The first evidence of robust interhemispheric connectivity during spontaneous rest has been provided within the motor system [Biswal et al., 1995]. This finding opened a new era in brain imaging, expanding the idea of brain spontaneous activity as a highly informative tool for the exploration of both sensorimotor and cognitive functions [Fox et al., 2005], providing new insights regarding both the architecture of the healthy brain [van den Heuvel et al., 2009] and the signature of diverse pathological conditions [Agosta et al., 2013; Madhavan et al., 2013; Santarnecchi et al., 2013]. Specifically, further studies have confirmed such generalized tendency for interhemispheric synchronization, that is homotopic connectivity, mainly for every pair of homologous brain regions [Hagmann et al., 2008; Salvador et al., 2005; Stark et al., 2008]. With the aim at understanding whether and how interhemispheric connectivity could be related to individual cognitive functioning, in the current investigation we analyzed resting‐state fMRI data of 119 healthy adults by correlating their individual VHMC maps with global intelligence levels (IQ). We detected a trend for reduced VHMC in subjects with higher intelligence levels versus those with an average IQ, with significant decreases in visual and somatosensory cortices, SMA, rolandic operculum, and middle temporal gyrus. Moreover, an additional seed‐based FC analysis revealed these regions as having an increased spontaneous synchronization with medial structures located in ipsi‐ and contralateral hemispheres, with this pattern being mostly detectable for left hemisphere regions. Finally, an increase in the symmetry of the FC pattern have been identified in the prefrontal cortex of female participants, with a minor effect also detectable in the posterior midline regions. These results indirectly confirm recent evidences about the importance of basic sensory processes into explaining individual differences in IQ, also corroborating a relevant role for left hemisphere connectivity profiles in determining intelligence levels, at least in right‐handed subjects.
Theories about the importance of hemispheric lateralization rely on two different schools of thought. Integrative models suggest that interhemispheric interaction aids information processing by coordinating parallel processing between the hemispheres [Banich and Brown, 2000], while other models conceptualize the lateralization of brain function as a mechanism allowing the isolation of competing processes [Kosslyn et al., 1995; Liederman and Meehan, 1986]. Consistent with models promoting FC as a reflection of coordinated, that is integrated, processing within functional systems [Fair et al., 2007; Fox et al., 2005], the ubiquitous finding of homotopic connectivity would validate the notion of a physiological interhemispheric processing [Banich and Brown, 2000]. Additionally, recent evidence of a reduction in VHMC found in patients with multiple sclerosis [Zhou et al., 2013], cocaine addiction [Kelly et al., 2011], schizophrenia [Hoptman et al., 2012], and first major depressive episode [Guo et al., 2013] concur to indirectly support the association between interhemispheric synchronization at rest and brain optimal functioning.
In this context, the explanation of interhemispheric communication dynamics has been reasonably associated with the CC [Geschwind, 1972], with several models postulating different roles for the information flow through the callosal fibers [Nowicka and Tacikowski, 2011]. Excitatory models of callosal function postulate that the CC mediates the sharing of information between the two hemispheres [Berlucchi et al., 1995; Gazzaniga et al., 1962], allowing each hemisphere to access information that might have initially been lateralized. Moreover, as even simple tasks do not exclusively involve one hemisphere, cerebral functions often rely on dynamic cooperation between the two hemispheres, which obviously requires considerable interhemispheric transmissions of information [Houzel and Milleret, 1999]. Interestingly, this hypothesis has been functionally supported by the decrease of interhemispheric coherence observed in patients with agenesis of CC [Koeda et al., 1995] and in those who underwent callosotomy [Johnston et al., 2008].
Conversely, several studies have put forward the idea that interhemispheric communication may not necessarily be conceptualized as an exclusively cooperative process [Denenberg, 1983], with CC playing an important role in maintaining independent processing in the two hemispheres through inhibitory actions [Cook, 1984]. Generally, it has been postulated that the activation in a region within a hemisphere may induce an inhibition of homologous regions in the contralateral hemisphere, with experimental confirmation observed during speech processing using positron emission tomography (PET) in humans [Karbe et al., 1998], and by looking at the interaction between somatosensory cortices in rats [Marcano‐Reik and Blumberg, 2008].
Indeed, brain imaging and transcranial magnetic stimulation studies in patients with neglect have supported this hemispheric rivalry model too, by showing how transcallosal inhibition operates between brain homotopic regions, with patients showing an increased excitability of the intact hemisphere especially in regions homotopic to the lesion [Fink et al., 2000; Koch et al., 2008]. All these observations highlight the challenge in interpreting the possible relationship, and its direction, between (i) spontaneous homotopic connectivity, (ii) the optimization of brain functioning, and (iii) its cognitive correlates.
First of all, the pattern of VMHC demonstrated by our analysis is consistent with all other previous evidence [Gee et al., 2011; Stark et al., 2008; Zuo et al., 2010], showing an overall trend for higher VHMC with regard to primary sensory regions, that is, visual, motor, and somatosensory, while heteromodal brain areas involved in multisensorial integration show reduced interhemispheric synchronization (see Fig. 1). This spontaneous functional brain architecture possibly suggests that higher levels of interhemispheric synchrony may be required for low‐level processing of sensory inputs, while the tendency of associative and higher order regions to be less coordinated may reflect their greater flexibility [Gee et al., 2011]. Interestingly, this medial‐to‐distal decrease of interhemispheric synchrony also reflects the temporal development of such connections in the developing brain, as shown by studies on preterm infants where networks composed of medial regions appear earlier with respect to those involving homotopic regions placed at greater anatomical distance [Smyser et al., 2010].
In light of the aforementioned models, our finding about the overall trend for VHMC decreases in subjects with higher intellectual functioning level seems to support the idea of hemispheric segregation as a marker of better cognitive functioning. Accordingly, in their recent work about patterns of intrahemispheric and interhemispheric connectivity at rest, Gee et al. [2011] supported the idea of increased intrahemispheric connectivity in healthy humans as evidence of hemispheric segregation, which finds a grounding in the enhanced performance in tasks involving the two hemispheres performing independently observed in both split‐brain patients [Holtzman and Gazzaniga, 1985] and healthy subjects (Banich and Belger, 1990). From an evolutionary point of view, Rilling and Insel [1999] have intriguingly concluded that the CC may have contributed to the spread of interhemispheric synchrony, but beyond a given brain size, the transmission of information between hemispheres might have become problematic, leading to the development of strong, intrahemispheric circuits and the genesis of a more efficient solution (i.e., brain lateralization and hemispheric independence [Rilling and Insel, 1999]. Therefore, the enhancement of cognitive functioning, expressed as a higher IQ, might be representative of different developmental trajectories involving both hemispheres, in the context of a global downgrading of interhemispheric talk.
Such interpretation may find some confirmation in the analysis of the specific brain regions showing a VHMC reduction, as well as the tendency to be more widely connected with areas located in the left hemisphere. Seed‐based FC analyses showed that VHMC differences may be related to a difference in the FC profiles of regions placed in the left hemisphere, mainly involving heteromodal (MTG, ROL) and unimodal (visual and somatosensory cortex, SMA) regions. Interestingly, it must be noticed that 2 out of 5 regions are highly involved in language processing (MTG, ROL), while another is part of the visual network. Consistently, Liu et al. [2009] have described four factors that accounted for a vast part of interindividual variance in healthy brain functional asymmetry, with two of them highly loading on visual and language systems [Liu et al., 2009]. Moreover, Haier et al. [2003] have shown a specific significant correlation between brain metabolism in the visual cortex and fluid intelligence level using PET during resting‐state, corroborating the idea about the important role played by primary sensory regions—and not high‐order, prefrontal ones—into explaining variability in individual intelligence level.
Overall, our data suggest how a better cognitive profile may be an expression of less interhemispheric coordination at rest, with major differences involving left hemisphere connectivity. As a first level interpretation, this supports the idea that a correct pathway for interhemispheric dynamics maturation naturally leads to their segregation, a thesis which has been already supported [Rogers et al., 2004]. More specifically, the persistence of a diffuse left hemisphere connectivity in right‐handed subjects with lower IQ suggests dominant hemisphere segregation as a final step into cognitive development, which could be the result of a physiological “pruning” process.
Furthermore, it must be noticed that these regions showing increased connectivity in A‐IQ subjects are connected with midline regions mostly covering the well‐known DMN [Fox et al., 2005]. Evidences support the idea of a physiological between‐networks anticorrelation as a marker of brain healthy functioning [Kelly et al., 2008], and an altered anticorrelation between the DMN and other resting‐state networks have been associated with pathological conditions like Alzheimer's disease [Balthazar et al., 2013], autism [Lynch et al., 2013], schizophrenia [Moran et al., 2013], and antisocial disorder [Tang et al., 2013]. More interestingly, studies on infant brain have shown how, with respect to other resting‐state networks encompassing visual, motor, and somatosensory systems, the DMN shows an unorganized structure till early school age (7–9 years old), with an interesting later increase of its intrinsic connectivity mostly involving regions placed in the left hemisphere [Fair et al., 2008]. Given such later development, these regions may also plausibly develop a different connectivity profile toward other networks, suggesting this time‐window as a possible context for an initial interaction between connectivity, left–right hemispheres coupling and cognitive development.
Our results should be also discussed in light of other prominent theories about the neurophysiological underpinnings of human intelligence, like the Parieto‐frontal integration theory (P‐FIT) [Jung and Haier, 2007]. In the last few years, the P‐FIT has received large experimental support using different imaging techniques, such as structural [Narr et al., 2007], diffusion weighted [Chiang et al., 2009], and functional MRI [Choi et al., 2008; Yuan et al., 2012], circumscribing the individual variability in intelligence level to the functional coupling between prefrontal, parietal, and temporal lobes regions. First of all, looking at interhemispheric coupling as a correlate of intelligence clearly does not allow to find easy overlap between our findings and those ones promoted in the context of the P‐FIT. It must be noticed though that, while the P‐FIT is mostly based on structural and evoked activity data, our findings are the first based on the exploration of resting‐state brain homotopic organization and its correlation with intelligence at the voxel level, that is without any a priori selection of regions of interest and/or networks. While the P‐FIT mostly supports the interhemispheric coupling between associative regions (e.g., fronto‐parietal interaction) as a substrate for higher cognitive functioning, our approach completely disregards these connections, putting more emphasis on homotopic connectivity. This could partly explain why we observed significant correlations in unimodal—sensory—regions, a finding which is gaining consensus in the literature about behavioral correlates of intelligence. Indeed, a recent work by Melnick et al. supports a robust correlation between intelligence level and sensory discrimination in the visuo‐motor domain [Melnick et al., 2013], suggesting the optimization of low‐level processes as the first marker of a more globally efficient system, with a cascade of effects on more complex functions and, ultimately, IQ. It may be that variability in the low level—intermodality—components of intelligence may be captured by homotopic interactions, even at rest, while more complex behaviors may be better addressed by the investigation of inter‐intra hemispheric connectivity between different regions/systems. Further studies should address the role of both P‐FIT‐like and FH dynamics into explaining the variance of simple and complex cognitive tasks rather than comprehensive scores like IQs.
Furthermore, the apparently inverse role of interhemispheric connectivity—as proposed here in relation to intelligence level—partially differs from what have been already observed in pathological conditions [Kelly et al., 2011; Zhou et al., 2013] and thus must be considered as a different phenomenon. While a decrease in VHMC in neurological and psychiatric patients should be interpret as a deviation from a normal baseline, intended as the result of a presumably optimal development prior the pathology onset, the same analysis in healthy subjects must consider the degree of symmetry as the optimum achieved by each subject within the boundaries of a nonpathological functioning. More specifically, any possible deviation induced by a pathological condition plausibly does imply a worsening of the overall system performance (i.e., cognition), whatever the goodness of the premorbid “brain symmetry‐cognition” interplay. In this framework, as patients’ higher‐order cognitive profile has not been related to function symmetry changes in previous studies about pathology, further investigations testing this hypothesis are needed.
Gender and Age Related Differences
Gender related differences in the correlation between intelligence and FH are not surprising, given the literature about cognitive as well as structural and functional differences between men and women [Bell et al., 2006; Goh et al., 2011; Gur et al., 1999; Narr et al., 2007; Witelson et al., 2006]. More specifically, our finding is in line with the work by Luders et al. [2008], which found a gender‐related difference in the correlation between cortical folding and intelligence, with female participants showing significantly higher correlation with prefrontal regions convolution respect to males, which actually showed a trend for a negative correlation like the one observed in our data. Changes in cortical folding may be expression of a different development trajectory for male and female, which in turn could interact with cognitive functioning and possibly be also reflected in resting‐state connectivity. Moreover, these results are also in line with structural studies by Haier et al. [2005] showing a significant interaction between gender, intelligence, and brain volumes, with the most pronounced differences being located in the prefrontal lobe and closely resembling the cluster of increased correlation in female we have identified [Haier et al., 2005].
As anticipated for gender‐related effects, our finding related to differences in the correlation between intelligence and FH as a function of age is not entirely surprising. A vast literature about the structural changes observable during the lifespan is available, with specific patterns of correlation between cortical thickness/volume and intelligence level being demonstrated in childhood and adolescence [Shaw et al., 2006] as well as adulthood and ageing [Staff et al., 2006; Witelson et al., 2006]. Our results suggest a different pattern of interaction during and right after late adolescence, with the main difference being linked to the FH of primary and unimodal brain regions, whose increased interplay could somehow provide some advantage during this specific time frame, where education‐related learning processes are more actively engaged. Considering how the decrease in FH in these regions seems to constitute a persisting pattern for the rest of adult life (till 65 years old), the pattern observed for 18–25 years old participants could possibly reflects a distinctive connectivity profile as well, which could be maybe applied—at the theoretical level—to early adolescence and late infancy years which we did not monitor in our study. However, no causal relationship can be drawn from our data and further investigation with bigger samples encompassing infancy and early adulthood are needed.
Future Directions
Given the exclusive inclusion of right‐handed subjects, future investigations should deepen the interaction between cognition and FH by taking into account brain‐lateralization and thus including left‐handed subjects. Moreover, considering the IQ as a phenotype resulting from both genetic predisposition and a shaping process operated during early development, the interplay between intelligence and FH should be also disentangled through the creation of a unified model including individual genetic characterization. Finally, given recent evidence about the interaction between brain weak functional connections and intelligence [Santarnecchi et al., 2014a], an analysis based on the strength of functional homotopic connections and its relationship with IQ might interestingly expand the present results.
In conclusion, our findings promote the reduction of synchrony between primary sensory regions at rest, as well as the connectivity of left primary sensory areas and the rest of the brain, as two important factors supporting higher intelligence levels in humans, also contributing to the debate about the evolutionary benefits of brain asymmetry.
Supporting information
Supporting Information Table
Conflict of Interest: All authors report no conflict of interest.
REFERENCES
- Achard S, Salvador R, Whitcher B, Suckling J, Bullmore E, (2006): A resilient, low‐frequency, small‐world human brain functional network with highly connected association cortical hubs. J Neurosci 26:63–72. [DOI] [PMC free article] [PubMed] [Google Scholar]
- Adelstein JS, Shehzad Z, Mennes M, Deyoung CG, Zuo XN, Kelly C, Margulies DS, Bloomfield A, Gray JR, Castellanos FX, Milham MP (2011): Personality is reflected in the brain's intrinsic functional architecture. PLoS One 6:e27633. [DOI] [PMC free article] [PubMed] [Google Scholar]
- Agosta F, Pievani M, Geroldi C, Copetti M, Frisoni GB, Filippi M (2012): Resting state fMRI in Alzheimer's disease: Beyond the default mode network. Neurobiol Aging 33:1564–1578. [DOI] [PubMed] [Google Scholar]
- Agosta F, Sala S, Valsasina P, Meani A, Canu E, Magnani G, Cappa SF, Scola E, Quatto P, Horsfield MA, Falini A, Comi G, Filippi M (2013): Brain network connectivity assessed using graph theory in frontotemporal dementia. Neurology 81:134–143. [DOI] [PubMed] [Google Scholar]
- Allen DN, Strauss GP, Kemtes KA, Goldstein G (2007): Hemispheric contributions to nonverbal abstract reasoning and problem solving. Neuropsychology 21:713–720. [DOI] [PubMed] [Google Scholar]
- Altamura M, Fazio L, De SM, Petito A, Blasi G, Taurisano P, Romano R, Gelao B, Bellomo A, Bertolino A (2012): Abnormal functional motor lateralization in healthy siblings of patients with schizophrenia. Psychiatry Res 203:54–60. [DOI] [PubMed] [Google Scholar]
- Andrews‐Hanna JR, Snyder AZ, Vincent JL, Lustig C, Head D, Raichle ME, Buckner RL (2007): Disruption of large‐scale brain systems in advanced aging. Neuron 56:924–935. [DOI] [PMC free article] [PubMed] [Google Scholar]
- Ashburner J (2007): A fast diffeomorphic image registration algorithm. Neuroimage 38:95–113. [DOI] [PubMed] [Google Scholar]
- Balthazar ML, de Campos BM, Franco AR, Damasceno BP, Cendes F (2013): Whole cortical and default mode network mean functional connectivity as potential biomarkers for mild Alzheimer's disease. Psychiatry Res 221:37–42. [DOI] [PubMed] [Google Scholar]
- Banich MT, Belger A (1990). Interhemispheric interaction: How do the hemispheres divide and conquer a task? Cortex, 26:77–94. [DOI] [PubMed] [Google Scholar]
- Banich MT, Brown WS (2000): A life‐span perspective on interaction between the cerebral hemispheres. Dev Neuropsychol 18:1–10. [DOI] [PubMed] [Google Scholar]
- Bassett DS, Bullmore E, Verchinski BA, Mattay VS, Weinberger DR, Meyer‐Lindenberg A (2008): Hierarchical organization of human cortical networks in health and schizophrenia. J Neurosci 28:9239–9248. [DOI] [PMC free article] [PubMed] [Google Scholar]
- Bell EC, Willson MC, Wilman AH, Dave S, Silverstone PH (2006): Males and females differ in brain activation during cognitive tasks. Neuroimage 30:529–538. [DOI] [PubMed] [Google Scholar]
- Berlucchi G, Aglioti S, Marzi CA, Tassinari G (1995): Corpus callosum and simple visuomotor integration. Neuropsychologia 33:923–936. [DOI] [PubMed] [Google Scholar]
- Biswal B, Yetkin FZ, Haughton VM, Hyde JS (1995): Functional connectivity in the motor cortex of resting human brain using echo‐planar MRI. Magn Reson Med 34:537–541. [DOI] [PubMed] [Google Scholar]
- Biswal BB, Mennes M, Zuo XN, Gohel S, Kelly C, Smith SM, Beckmann CF, Adelstein JS, Buckner RL, Colcombe S, Dogonowski AM, Ernst M, Fair D, Hampson M, Hoptman MJ, Hyde JS, Kiviniemi VJ, Kotter R, Li SJ, Lin CP, Lowe MJ, Mackay C, Madden DJ, Madsen KH, Margulies DS, Mayberg HS, McMahon K, Monk CS, Mostofsky SH, Nagel BJ, Pekar JJ, Peltier SJ, Petersen SE, Riedl V, Rombouts SA, Rypma B, Schlaggar BL, Schmidt S, Seidler RD, Siegle GJ, Sorg C, Teng GJ, Veijola J, Villringer A, Walter M, Wang L, Weng XC, Whitfield‐Gabrieli S, Williamson P, Windischberger C, Zang YF, Zhang HY, Castellanos FX, Milham MP (2010): Toward discovery science of human brain function. Proc Natl Acad Sci USA 107:4734–4739. [DOI] [PMC free article] [PubMed] [Google Scholar]
- Bonavita S, Gallo A, Sacco R, Corte MD, Bisecco A, Docimo R, Lavorgna L, Corbo D, Costanzo AD, Tortora F, Cirillo M, Esposito F, Tedeschi G (2011): Distributed changes in default‐mode resting‐state connectivity in multiple sclerosis. Mult Scler 17:411–422. [DOI] [PubMed] [Google Scholar]
- Chiang MC, Barysheva M, Lee AD, Madsen S, Klunder AD, Toga AW, McMahon KL, de Zubicaray GI, Meredith M, Wright MJ, Srivastava A, Balov N, Thompson PM (2008): Brain fiber architecture, genetics, and intelligence: A high angular resolution diffusion imaging (HARDI) study. Med Image Comput Comput Assist Interv 11:1060–1067. [DOI] [PMC free article] [PubMed] [Google Scholar]
- Chiang MC, Barysheva M, Shattuck DW, Lee AD, Madsen SK, Avedissian C, Klunder AD, Toga AW, McMahon KL, de Zubicaray GI, Wright MJ, Srivastava A, Balov N, Thompson PM (2009): Genetics of brain fiber architecture and intellectual performance. J Neurosci 29:2212–2224. [DOI] [PMC free article] [PubMed] [Google Scholar]
- Colom R, Karama S, Jung RE, Haier RJ (2010): Human intelligence and brain networks. Dialogues Clin Neurosci 12:489–501. [DOI] [PMC free article] [PubMed] [Google Scholar]
- Cook ND (1984): Callosal inhibition: The key to the brain code. Behav Sci 29:98–110. [DOI] [PubMed] [Google Scholar]
- Choi YY, Shamosh NA, Cho SH, Deyoung CG, Lee MJ, Lee JM, Kim SI, Cho ZH, Kim K, Gray JR, Lee KH (2008): Multiple bases of human intelligence revealed by cortical thickness and neural activation. J Neurosci 28:10323–10329. [DOI] [PMC free article] [PubMed] [Google Scholar]
- da Rocha AF, Rocha FT, Massad E (2011): The brain as a distributed intelligent processing system: An EEG study. PLoS One 6:e17355. [DOI] [PMC free article] [PubMed] [Google Scholar]
- Deary IJ, Penke L, Johnson W (2010): The neuroscience of human intelligence differences. Nat Rev Neurosci 11:201–211. [DOI] [PubMed] [Google Scholar]
- Denenberg VH (1983): Lateralization of function in rats. Am J Physiol 245:R505–R509. [DOI] [PubMed] [Google Scholar]
- Duffy FH, Mcanulty GB, Albert MS (1996): Effects of age upon interhemispheric EEG coherence in normal adults. Neurobiol Aging 17:587–599. [DOI] [PubMed] [Google Scholar]
- Escalante‐Mead PR, Minshew NJ, Sweeney JA (2003): Abnormal brain lateralization in high‐functioning autism. J Autism Dev Disord 33:539–543. [DOI] [PubMed] [Google Scholar]
- Fair DA, Dosenbach NU, Church JA, Cohen AL, Brahmbhatt S, Miezin FM, Barch DM, Raichle ME, Petersen SE, Schlaggar BL (2007): Development of distinct control networks through segregation and integration. Proc Natl Acad Sci USA 104:13507–13512. 17679691 [Google Scholar]
- Fair DA, Cohen AL, Dosenbach NU, Church JA, Miezin FM, Barch DM, Raichle ME, Petersen SE, Schlaggar BL (2008): The maturing architecture of the brain's default network. Proc Natl Acad Sci USA 105:4028–4032. [DOI] [PMC free article] [PubMed] [Google Scholar]
- Fink GR, Marshall JC, Shah NJ, Weiss PH, Halligan PW, Grosse‐Ruyken M, Ziemons K, Zilles K, Freund HJ (2000): Line bisection judgments implicate right parietal cortex and cerebellum as assessed by fMRI. Neurology 54:1324–1331. [DOI] [PubMed] [Google Scholar]
- Fox MD, Snyder AZ, Vincent JL, Corbetta M, Van Essen DC, Raichle ME (2005): The human brain is intrinsically organized into dynamic, anticorrelated functional networks. Proc Natl Acad Sci USA 102:9673–9678. [DOI] [PMC free article] [PubMed] [Google Scholar]
- Fransson P, Skiold B, Horsch S, Nordell A, Blennow M, Lagercrantz H, Aden U (2007): Resting‐state networks in the infant brain. Proc Natl Acad Sci USA 104:15531–15536. [DOI] [PMC free article] [PubMed] [Google Scholar]
- Gazzaniga MS, Bogen JE, Sperry RW (1962): Some functional effects of sectioning the cerebral commissures in man. Proc Natl Acad Sci USA 48:1765–1769. [DOI] [PMC free article] [PubMed] [Google Scholar]
- Gee DG, Biswal BB, Kelly C, Stark DE, Margulies DS, Shehzad Z, Uddin LQ, Klein DF, Banich MT, Castellanos FX, Milham MP (2011): Low frequency fluctuations reveal integrated and segregated processing among the cerebral hemispheres. Neuroimage 54:517–527. [DOI] [PMC free article] [PubMed] [Google Scholar]
- Geschwind N (1972): Language and the brain. Sci Am 226:76–83. [DOI] [PubMed] [Google Scholar]
- Geschwind N (1979): Specializations of the human brain. Sci Am 241:180–199. [DOI] [PubMed] [Google Scholar]
- Goh S, Bansal R, Xu D, Hao X, Liu J, Peterson BS (2011): Neuroanatomical correlates of intellectual ability across the life span. Dev Cogn Neurosci 1:305–312. [DOI] [PMC free article] [PubMed] [Google Scholar]
- Gong G, He Y, Evans AC (2011): Brain connectivity: Gender makes a difference. Neuroscientist 17:575–591. [DOI] [PubMed] [Google Scholar]
- Greicius MD, Krasnow B, Reiss AL, Menon V (2003): Functional connectivity in the resting brain: A network analysis of the default mode hypothesis. Proc Natl Acad Sci USA 100:253–258. [DOI] [PMC free article] [PubMed] [Google Scholar]
- Guo W, Liu F, Dai Y, Jiang M, Zhang J, Yu L, Long L, Chen H, Gao Q, Xiao C (2013): Decreased interhemispheric resting‐state functional connectivity in first‐episode, drug‐naive major depressive disorder. Prog Neuropsychopharmacol Biol Psychiatry 41:24–29. [DOI] [PubMed] [Google Scholar]
- Gur RC, Turetsky BI, Matsui M, Yan M, Bilker W, Hughett P, Gur RE (1999): Sex differences in brain gray and white matter in healthy young adults: Correlations with cognitive performance. J Neurosci 19:4065–4072. [DOI] [PMC free article] [PubMed] [Google Scholar]
- Hagmann P, Cammoun L, Gigandet X, Meuli R, Honey CJ, Wedeen VJ, Sporns O (2008): Mapping the structural core of human cerebral cortex. PLoS Biol 6:e159. [DOI] [PMC free article] [PubMed] [Google Scholar]
- Haier RJ, White NA, Alkire MT (2003): Individual differences in general intelligence correlate with brain function during nonreasoning tasks. Intelligence 31:429–441. [Google Scholar]
- Haier RJ, Jung RE, Yeo RA, Head K, Alkire MT (2005): The neuroanatomy of general intelligence: Sex matters. Neuroimage 25:320–327. [DOI] [PubMed] [Google Scholar]
- Herrington JD, Heller W, Mohanty A, Engels AS, Banich MT, Webb AG, Miller GA (2010): Localization of asymmetric brain function in emotion and depression. Psychophysiology 47:442–454. [DOI] [PMC free article] [PubMed] [Google Scholar]
- Holtzman JD, Gazzaniga MS (1985): Enhanced dual task performance following corpus commissurotomy in humans. Neuropsychologia 23:315–321. [DOI] [PubMed] [Google Scholar]
- Hopkins WD, Dunham L, Cantalupo C, Taglialatela J (2007): The Association between handedness, brain asymmetries, and corpus callosum size in chimpanzees (Pan troglodytes). Cereb Cortex 17:1757–1765. [DOI] [PMC free article] [PubMed] [Google Scholar]
- Hoptman MJ, Zuo XN, D'Angelo D, Mauro CJ, Butler PD, Milham MP, Javitt DC (2012): Decreased interhemispheric coordination in schizophrenia: A resting state fMRI study. Schizophr Res 141:1–7. [DOI] [PMC free article] [PubMed] [Google Scholar]
- Houzel JC, Milleret C (1999): Visual inter‐hemispheric processing: Constraints and potentialities set by axonal morphology. J Physiol Paris 93:271–284. [DOI] [PubMed] [Google Scholar]
- Innocenti GM (1986): Postnatal development of corticocortical connections. Ital J Neurol Sci Suppl 5:25–28. [PubMed] [Google Scholar]
- Johnston JM, Vaishnavi SN, Smyth MD, Zhang D, He BJ, Zempel JM, Shimony JS, Snyder AZ, Raichle ME (2008): Loss of resting interhemispheric functional connectivity after complete section of the corpus callosum. J Neurosci 28:6453–6458. [DOI] [PMC free article] [PubMed] [Google Scholar]
- Jung RE, Haier RJ (2007): The Parieto‐frontal integration theory (P‐FIT) of intelligence: Converging neuroimaging evidence. Behav Brain Sci 30:135–154. [DOI] [PubMed] [Google Scholar]
- Karbe H, Herholz K, Halber M, Heiss WD (1998): Collateral inhibition of transcallosal activity facilitates functional brain asymmetry. J Cereb Blood Flow Metab 18:1157–1161. [DOI] [PubMed] [Google Scholar]
- Kelly AM, Uddin LQ, Biswal BB, Castellanos FX, Milham MP (2008): Competition between functional brain networks mediates behavioral variability. Neuroimage 39:527–537. [DOI] [PubMed] [Google Scholar]
- Kelly C, Zuo XN, Gotimer K, Cox CL, Lynch L, Brock D, Imperati D, Garavan H, Rotrosen J, Castellanos FX, Milham MP (2011): Reduced interhemispheric resting state functional connectivity in cocaine addiction. Biol Psychiatry 69:684–692. [DOI] [PMC free article] [PubMed] [Google Scholar]
- Kennedy DN, Lange N, Makris N, Bates J, Meyer J, Caviness VS Jr (1998): Gyri of the human neocortex: An MRI‐based analysis of volume and variance. Cereb Cortex 8:372–384. [DOI] [PubMed] [Google Scholar]
- Kleinhans NM, Muller RA, Cohen DN, Courchesne E (2008): Atypical functional lateralization of language in autism spectrum disorders. Brain Res 1221:115–125. [DOI] [PMC free article] [PubMed] [Google Scholar]
- Koch G, Oliveri M, Cheeran B, Ruge D, Lo GE, Salerno S, Torriero S, Marconi B, Mori F, Driver J, Rothwell JC, Caltagirone C (2008): Hyperexcitability of parietal‐motor functional connections in the intact left‐hemisphere of patients with neglect. Brain 131:3147–3155. [DOI] [PMC free article] [PubMed] [Google Scholar]
- Koeda T, Knyazeva M, Njiokiktjien C, Jonkman EJ, de SL, Vildavsky V (1995): The EEG in acallosal children. Coherence values in the resting state: Left hemisphere compensatory mechanism? Electroencephalogr Clin Neurophysiol 95:397–407. [DOI] [PubMed] [Google Scholar]
- Kosslyn SM, Maljkovic V, Hamilton SE, Horwitz G, Thompson WL (1995): Two types of image generation: Evidence for left and right hemisphere processes. Neuropsychologia 33:1485–1510. [DOI] [PubMed] [Google Scholar]
- Liang X, Wang J, Yan C, Shu N, Xu K, Gong G, He Y (2012): Effects of different correlation metrics and preprocessing factors on small‐world brain functional networks: A resting‐state functional MRI study. PLoS One 7:e32766. [DOI] [PMC free article] [PubMed] [Google Scholar]
- Liederman J, Meehan P (1986): When is between‐hemisphere division of labor advantageous? Neuropsychologia 24:863–874. [DOI] [PubMed] [Google Scholar]
- Liu H, Stufflebeam SM, Sepulcre J, Hedden T, Buckner RL (2009): Evidence from intrinsic activity that asymmetry of the human brain is controlled by multiple factors. Proc Natl Acad Sci USA 106:20499–20503. [DOI] [PMC free article] [PubMed] [Google Scholar]
- Luders E, Narr KL, Bilder RM, Szeszko PR, Gurbani MN, Hamilton L, Toga AW, Gaser C (2008): Mapping the relationship between cortical convolution and intelligence: Effects of gender. Cereb Cortex 18:2019–2026. [DOI] [PMC free article] [PubMed] [Google Scholar]
- Lynch CJ, Uddin LQ, Supekar K, Khouzam A, Phillips J, Menon V (2013): Default mode network in childhood autism: Posteromedial cortex heterogeneity and relationship with social deficits. Biol Psychiatry 74:212–219. [DOI] [PMC free article] [PubMed] [Google Scholar]
- Madhavan D, Heinrichs‐Graham E, Wilson TW (2013): Whole‐brain functional connectivity increases with extended duration of focal epileptiform activity. Neurosci Lett 542:26–29. [DOI] [PubMed] [Google Scholar]
- Makris N, Meyer JW, Bates JF, Yeterian EH, Kennedy DN, Caviness VS (1999): MRI‐Based topographic parcellation of human cerebral white matter and nuclei II. Rationale and applications with systematics of cerebral connectivity. Neuroimage 9:18–45. [DOI] [PubMed] [Google Scholar]
- Marcano‐Reik AJ, Blumberg MS (2008): The corpus callosum modulates spindle‐burst activity within homotopic regions of somatosensory cortex in newborn rats. Eur J Neurosci 28:1457–1466. [DOI] [PMC free article] [PubMed] [Google Scholar]
- Melnick MD, Harrison BR, Park S, Bennetto L, Tadin D (2013): A strong interactive link between sensory discriminations and intelligence. Curr Biol 23:1013–1017. [DOI] [PMC free article] [PubMed] [Google Scholar]
- Mesulam M (2000): Brain, mind, and the evolution of connectivity. Brain Cogn 42:4–6. [DOI] [PubMed] [Google Scholar]
- Moran LV, Tagamets MA, Sampath H, O'Donnell A, Stein EA, Kochunov P, Hong LE (2013): Disruption of anterior insula modulation of large‐scale brain networks in schizophrenia. Biol Psychiatry 74:467–474. [DOI] [PMC free article] [PubMed] [Google Scholar]
- Narr KL, Woods RP, Thompson PM, Szeszko P, Robinson D, Dimtcheva T, Gurbani M, Toga AW, Bilder RM (2007): Relationships between IQ and regional cortical gray matter thickness in healthy adults. Cereb Cortex 17:2163–2171. [DOI] [PubMed] [Google Scholar]
- Neubauer AC, Fink A (2009): Intelligence and neural efficiency. Neurosci Biobehav Rev 33:1004–1023. [DOI] [PubMed] [Google Scholar]
- Nowicka A, Tacikowski P (2011): Transcallosal transfer of information and functional asymmetry of the human brain. Laterality 16:35–74. [DOI] [PubMed] [Google Scholar]
- Power JD, Barnes KA, Snyder AZ, Schlaggar BL, Petersen SE (2012): Spurious but systematic correlations in functional connectivity MRI networks arise from subject motion. Neuroimage 59:2142–2154. [DOI] [PMC free article] [PubMed] [Google Scholar]
- Raichle ME, MacLeod AM, Snyder AZ, Powers WJ, Gusnard DA, Shulman GL (2001): A default mode of brain function. Proc Natl Acad Sci USA 98:676–682. [DOI] [PMC free article] [PubMed] [Google Scholar]
- Ribolsi M, Koch G, Magni V, Di LG, Rubino IA, Siracusano A, Centonze D (2009): Abnormal brain lateralization and connectivity in schizophrenia. Rev Neurosci 20:61–70. [DOI] [PubMed] [Google Scholar]
- Rilling JK, Insel TR (1999): Differential expansion of neural projection systems in primate brain evolution. Neuroreport 10:1453–1459. [DOI] [PubMed] [Google Scholar]
- Rogers LJ, Zucca P, Vallortigara G (2004): Advantages of having a lateralized brain. Proc Biol Sci 271:S420–S422. [DOI] [PMC free article] [PubMed] [Google Scholar]
- Rossi S, Cappa SF, Babiloni C, Pasqualetti P, Miniussi C, Carducci F, Babiloni F, Rossini PM (2001): Prefrontal [correction of Prefontal] cortex in long‐term memory: An "interference" approach using magnetic stimulation. Nat Neurosci 4:948–952. [DOI] [PubMed] [Google Scholar]
- Rossi S, Miniussi C, Pasqualetti P, Babiloni C, Rossini PM, Cappa SF (2004): Age‐related functional changes of prefrontal cortex in long‐term memory: A repetitive transcranial magnetic stimulation study. J Neurosci 24:7939–7944. [DOI] [PMC free article] [PubMed] [Google Scholar]
- Rushton JP, Ankney CD (2009): Whole brain size and general mental ability: A review. Int J Neurosci 119:691–731. [DOI] [PMC free article] [PubMed] [Google Scholar]
- Ryan JJ, Carruthers CA, Miller LJ, Souheaver GT, Gontkovsky ST, Zehr MD (2003): Exploratory factor analysis of the Wechsler Abbreviated Scale of Intelligence (WASI) in adult standardization and clinical samples. Appl Neuropsychol 10:252–256. [DOI] [PubMed] [Google Scholar]
- Salvador R, Suckling J, Coleman MR, Pickard JD, Menon D, Bullmore E (2005): Neurophysiological architecture of functional magnetic resonance images of human brain. Cereb Cortex 15:1332–1342. [DOI] [PubMed] [Google Scholar]
- Salvador R, Martinez A, Pomarol‐Clotet E, Gomar J, Vila F, Sarro S, Capdevila A, Bullmore E (2008): A simple view of the brain through a frequency‐specific functional connectivity measure. Neuroimage 39:279–289. [DOI] [PubMed] [Google Scholar]
- Santarnecchi E, Galli G, Polizzotto NR, Rossi A, Rossi S (2014a): Efficiency of weak brain connections support general cognitive functioning. Hum Brain Mapp 35:4566–4582. [DOI] [PMC free article] [PubMed] [Google Scholar]
- Santarnecchi E, Rossi S, Rossi A (2014b): The smarter, the stronger: Intelligence level correlates with brain resilience to systematic insults. Cortex 64C:293–309. [DOI] [PubMed] [Google Scholar]
- Santarnecchi et al. (2013): J Sleep Research 22:337–347. [DOI] [PubMed] [Google Scholar]
- Schwarz AJ, McGonigle J (2011): Negative edges and soft thresholding in complex network analysis of resting state functional connectivity data. Neuroimage 55:1132–1146. [DOI] [PubMed] [Google Scholar]
- Shaw P, Greenstein D, Lerch J, Clasen L, Lenroot R, Gogtay N, Evans A, Rapoport J, Giedd J (2006): Intellectual ability and cortical development in children and adolescents. Nature 440:676–679. [DOI] [PubMed] [Google Scholar]
- Smyser CD, Inder TE, Shimony JS, Hill JE, Degnan AJ, Snyder AZ, Neil JJ (2010): Longitudinal analysis of neural network development in preterm infants. Cereb Cortex 20:2852–2862. [DOI] [PMC free article] [PubMed] [Google Scholar]
- Song M, Zhou Y, Li J, Liu Y, Tian L, Yu C, Jiang T (2008): Brain spontaneous functional connectivity and intelligence. Neuroimage 41:1168–1176. [DOI] [PubMed] [Google Scholar]
- Song J, Desphande AS, Meier TB, Tudorascu DL, Vergun S, Nair VA, Biswal BB, Meyerand ME, Birn RM, Bellec P, Prabhakaran V (2012): Age‐related differences in test‐retest reliability in resting‐state brain functional connectivity. PLoS One 7:e49847. [DOI] [PMC free article] [PubMed] [Google Scholar]
- Sporns O (2014): Contributions and challenges for network models in cognitive neuroscience. Nat Neurosci 17:652–660. [DOI] [PubMed] [Google Scholar]
- Staff RT, Murray AD, Deary IJ, Whalley LJ (2006): Generality and specificity in cognitive aging: A volumetric brain analysis. Neuroimage 30:1433–1440. [DOI] [PubMed] [Google Scholar]
- Stam CJ (2004): Functional connectivity patterns of human magnetoencephalographic recordings: A 'small‐world' network? Neurosci Lett 355:25–28. [DOI] [PubMed] [Google Scholar]
- Stark DE, Margulies DS, Shehzad ZE, Reiss P, Kelly AM, Uddin LQ, Gee DG, Roy AK, Banich MT, Castellanos FX, Milham MP (2008): Regional variation in interhemispheric coordination of intrinsic hemodynamic fluctuations. J Neurosci 28:13754–13764. [DOI] [PMC free article] [PubMed] [Google Scholar]
- Supekar K, Musen M, Menon V (2009): Development of large‐scale functional brain networks in children. PLoS Biol 7:e1000157. [DOI] [PMC free article] [PubMed] [Google Scholar]
- Tang Y, Jiang W, Liao J, Wang W, Luo A (2013): Identifying individuals with antisocial personality disorder using resting‐state FMRI. PLoS One 8:e60652. [DOI] [PMC free article] [PubMed] [Google Scholar]
- Tomasi D, Volkow ND (2012): Laterality patterns of brain functional connectivity: Gender effects. Cereb Cortex 22:1455–1462. [DOI] [PMC free article] [PubMed] [Google Scholar]
- van den Heuvel MP, Stam CJ, Kahn RS, Hulshoff Pol HE (2009): Efficiency of functional brain networks and intellectual performance. J Neurosci 29:7619–7624. [DOI] [PMC free article] [PubMed] [Google Scholar]
- Van Dijk KR, Sabuncu MR, Buckner RL (2012): The influence of head motion on intrinsic functional connectivity MRI. Neuroimage 59:431–438. [DOI] [PMC free article] [PubMed] [Google Scholar]
- Wechsler D (1997): Wechsler Adult Intelligence Scale (WAIS‐3VR), 3rd ed. San Antonio, TX: Harcourt Assessment. [Google Scholar]
- Wechsler D (1999): Wechsler Abbreviated Scale of Intelligence (WASI). San Antonio, TX: Harcourt Assessment. [Google Scholar]
- Wechsler D (2003). Wechsler Intelligence Scale for Children (WISC‐IVVR), 4th ed. San Antonio, TX: Harcourt Assessment. [Google Scholar]
- Witelson SF, Beresh H, Kigar DL (2006): Intelligence and brain size in 100 postmortem brains: Sex, lateralization and age factors. Brain 129:386–398. [DOI] [PubMed] [Google Scholar]
- Yuan Z, Qin W, Wang D, Jiang T, Zhang Y, Yu C (2012): The salience network contributes to an individual's fluid reasoning capacity. Behav Brain Res 229:384–390. [DOI] [PubMed] [Google Scholar]
- Zhang J, Chen H, Fang F, Liao W (2010): Quantitative analysis of asymmetrical cortical activity based on power spectrum changes. Brain Topogr 23:257–268. [DOI] [PubMed] [Google Scholar]
- Zhou Y, Milham M, Zuo XN, Kelly C, Jaggi H, Herbert J, Grossman RI, Ge Y (2013): Functional homotopic changes in multiple sclerosis with resting‐state functional MR imaging. AJNR Am J Neuroradiol 34:1180–1187. [DOI] [PMC free article] [PubMed] [Google Scholar]
- Zuo XN, Kelly C, Di MA, Mennes M, Margulies DS, Bangaru S, Grzadzinski R, Evans AC, Zang YF, Castellanos FX, Milham MP (2010): Growing together and growing apart: Regional and sex differences in the lifespan developmental trajectories of functional homotopy. J Neurosci 30:15034–15043. [DOI] [PMC free article] [PubMed] [Google Scholar]
Associated Data
This section collects any data citations, data availability statements, or supplementary materials included in this article.
Supplementary Materials
Supporting Information Table