

Abstract
Cognitive abilities are related to (changes in) brain structure during adolescence and adulthood. Previous studies suggest that associations between cortical thickness and intelligence may be different at different ages. As both intelligence and cortical thickness are heritable traits, the question arises whether the association between cortical thickness development and intelligence is due to genes influencing both traits. We study this association in a longitudinal sample of young twins. Intelligence was assessed by standard IQ tests at age 9 in 224 twins, 190 of whom also underwent structural magnetic resonance imaging (MRI). Three years later at age 12, 177/125 twins returned for a follow‐up measurement of intelligence/MRI scanning, respectively. We investigated whether cortical thickness was associated with intelligence and if so, whether this association was driven by genes. At age 9, there were no associations between cortical thickness and intelligence. At age 12, a negative relationship emerged. This association was mainly driven by verbal intelligence, and manifested itself most prominently in the left hemisphere. Cortical thickness and intelligence were explained by the same genes. As a post hoc analysis, we tested whether a specific allele (rs6265; Val66Met in the BDNF gene) contributed to this association. Met carriers showed lower intelligence and a thicker cortex, but only the association between the BDNF genotype and cortical thickness in the left superior parietal gyrus reached significance. In conclusion, it seems that brain areas contributing to (verbal) intellectual performance are specializing under the influence of genes around the onset of puberty. Hum Brain Mapp 35:3760–3773, 2014. © 2013 Wiley Periodicals, Inc.
Keywords: cerebral cortex, intelligence, twins, adolescence, genetic associations
INTRODUCTION
Not only has brain size been associated with intelligence [e.g., McDaniel, 2005] but also thickness of the cerebral cortex has been associated with general cognitive functioning in children [Karama et al., 2011; Shaw et al., 2006; Tamnes et al., 2011] and in adults [Brans et al., 2010; Narr et al., 2007]. In adults, higher intelligence is associated with a thicker cortex [Brans et al., 2010; Narr et al., 2007]. These associations have also been shown in a cross‐sectional sample of children between young childhood and late adolescence [age 6–18; Karama et al., 2011]. A pioneering study has shown that intelligence is related to the trajectory of cortical development during childhood and adolescence, rather than cortical thickness itself. A developmental shift was found from a predominantly negative correlation between intelligence and cortical thickness in young childhood to a positive correlation in late childhood and adolescence [Shaw et al., 2006]. Negative associations between intelligence and a generalized measure of cortical thickness were seen in children aged 8–14 years, but became less strong in adolescents (age 14–20) and completely disappeared in young adulthood [age 20–30; Tamnes et al., 2011]. Taken together, these findings suggest that the direction and strength of the associations between cortical thickness and intelligence may change throughout life.
Cortical thickness [Brans et al., 2010; Kremen et al., 2010; Lenroot et al., 2009; van Soelen et al., 2012; Yoon et al., 2010] and intelligence [Hoekstra et al., 2007; Posthuma et al., 2001; van Soelen et al., 2011] are heritable traits. Given the (possibly changing) associations between brain structure and intelligence, we ask the question to what extent the same genes influence these two traits and study the association between intelligence and cortical thickness at two well‐defined ages around the start of puberty (ages 9 and 12; characterized by a small SD within age, <0.3 years) in a longitudinal twin sample. We intend to investigate whether shared genes, or shared environment underlie the association between intelligence and cortical thickness. The period around puberty is interesting in this aspect because puberty and adolescence are dynamic periods, when cognitive maturation [e.g., Casey et al., 2005] takes place. It is the time during which the influence of shared environment on intelligence starts to decrease [Bartels et al., 2002; Haworth et al., 2010]. The substantial change in the extent to which variation in intelligence can be explained by genetic factors may also influence the associations with cortical thickness. Since the contribution of shared environmental factors to intelligence in childhood acts mainly on verbal intelligence [Hoekstra et al., 2007; van Soelen et al., 2011], we also investigate whether the associations between intelligence and cortical thickness are mainly driven by verbal or nonverbal intelligence. Cognitive maturation is accompanied by structural brain changes: The gray matter volume of the brain increases during childhood and starts to decrease around puberty [Giedd et al., 1999]; the latter usually is attributed to the start of cortical thinning. Indeed, cortical thickness has been shown to develop in a nonlinear and region specific manner [Shaw et al., 2008; Sowell et al., 2004; Tamnes et al., 2010]. Recently, the notion of puberty as the start of cortical thinning has been challenged by several studies indicating that cortical thickness and gray matter volume decrease from an early age on [Brain development cooperative group, 2012; Brown et al., 2012] and continue to do so during puberty.
Finally, jumping ahead to our finding that indeed genes play a role in explaining the associations between cortical thickness and intelligence, in a post hoc analysis we investigated the role of the brain‐derived neurotrophic factor (BDNF) Val66Met polymorphism. This candidate gene has been extensively studied in connection to the brain because of its role in neuronal differentiation and synaptic plasticity [Gray et al., 2013]. Met‐carriers of the allele have smaller cortical gray matter volumes [Pezawas et al., 2004] or decreased cortical thickness [Met/Met carriers; Yang et al., 2012]. BDNF has been implicated in cognitive functioning, specifically in memory processes [Egan et al., 2003; Hariri, 2003] and the BDNF genotype has been shown to moderate the association between intelligence and the brain, albeit in white matter [Chiang et al., 2011]. The latter study showed that higher scores on the object‐assembly subscale of intelligence, were associated with higher white matter fractional anisotropy, but the strength of this association depended on BDNF genotype.
MATERIALS AND METHODS
Setting
Intelligence was assessed in a large sample of twins at ages 9 and 12 years. At both ages, children underwent structural MRI scanning and cortical thickness was determined. Previous publications on these data at baseline showed that brain volumes were positively associated with intelligence at the age of 9 [van Leeuwen et al., 2009] and that measures of intelligence in these twins and their siblings at both baseline and follow‐up were heritable [van Soelen et al., 2011]. In this sample of children of average intelligence, widespread cortical thinning was already present between ages 9 and 12 years, and variation in cortical thickness and variation in thinning were influenced by genes [van Soelen et al., 2012].
Subjects
All twins were recruited from the Netherlands Twin Register [NTR; Boomsma et al., 2006; van Beijsterveldt et al., 2013] and underwent medical resonance imaging (MRI) at the University Medical Center Utrecht (UMCU). In total, 112 twin pairs were included at baseline with a mean (sd) age of 9.1 (0.1) years. Exclusion criteria consisted of chronic use of medication, any known major medical or psychiatric history, or participation in special education. At follow‐up, 89 twin pairs came back at a mean age of 12.1 (0.3) years. Zygosity of same‐sex twins was initially determined based on a small set of DNA polymorphisms, and confirmed by genome‐wide single nucleotide polymorphism (SNP) data. Assessment of puberty was done by a trained researcher using the Tanner stages [Marshall and Tanner, 1969, 1970] which range from 1 (no pubertal development) to 5 (adult stage) (Supporting Information Table SI). Socioeconomic status (SES) was available for 108 families from a questionnaire send out at age 10 of the twins. SES was based on education level of the jobs of the parents on a 1–5 scale. SES was on average 3.40 (1.04; range [2–5]) at baseline and 3.49 (1.04; range [2–5]) in the group that returned at follow‐up (P = 0.07).
Intelligence was assessed in 224 twins at baseline and 177 at follow‐up, of which 212/138 twins had magnetic resonance imaging (MRI) scans available at baseline and follow‐up, respectively. At baseline 22 scans (of 212; 10.4%) and at follow‐up 13 scans (of 138; 9.4%) dropped out. Dropout for the MRI scans usually resulted from movement or (prior to scanning) having dental braces (mainly at age 12). The total number of children included, separated by sex and zygosity is displayed in Figure 1. Average time between intelligence testing and MRI scan was 50 days at baseline, ranging from 4 up to 128 days. At follow‐up, the intelligence test and the MRI scan were conducted at the same day. Written informed consents were obtained from all subjects and their parents and the study was approved by the Dutch Central Committee on Research involving Human Subjects (CCMO). Parents were financially compensated for travel expenses and the children received a gift voucher each.
Figure 1.
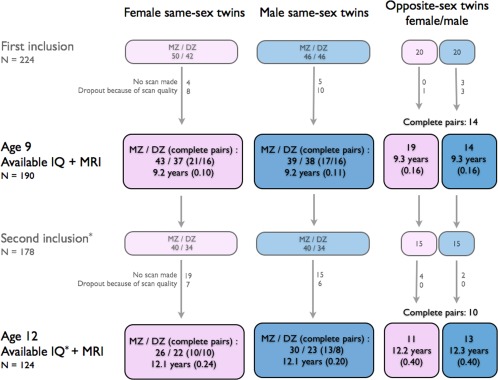
Flow chart of participants in this study, separated for sex and zygosity. Mean age (sd) is given. Most children (70% girls, 86% boys) did not show any secondary sexual characteristics based on the Tanner stages at age 9. At age 12, most children had entered puberty (11% of the girls, 10% of the boys did not show any secondary sexual characteristics at all). See Supporting Information Table SI for more elaborate information on Tanner stages. MZ = monozygotic; DZ = dizygotic; IQ = intelligence quotient; MRI = magnetic resonance imaging. *For one participant (boy, part of an opposite‐sex twin pair) IQ at age 12 was missing. [Color figure can be viewed in the online issue, which is available at http://wileyonlinelibrary.com.]
Intelligence Measures
At baseline, the full version of the Wechsler Intelligence Scale for children–Third version [WISC‐III; Wechsler et al., 2002] was used (six verbal subtests: information, similarities, arithmetic, vocabulary, comprehension, and digit span—six nonverbal subtests (picture completion, coding, picture concepts, block design, picture assembly, and symbol search) was administered. At follow‐up, four verbal subtests (similarities, arithmetic, vocabulary and digit span) and two nonverbal subtests (picture completion and block design) were included [van Soelen et al., 2011]. The main reason to use the shortened version at the second assessment was increasing the response rate: the shortened program allowed us to finish the complete protocol in 1 day. This was especially important because children of age 12 are in the last year of primary school and/or just start at a new school in the Netherlands. Parents were expected to be more willing to allow their children to participate in this shorter protocol.
Intelligence scores were standardized according to the age of the child, based on a population sample of same‐aged subjects in the Netherlands, resulting in full scale, verbal and nonverbal intelligence quotients (IQ). At the second measurement, we put equal weight on the verbal and nonverbal scores (after creating the norm scores).
Image Acquisition
Scanning and the subsequent image processing took place at the University Medical Center Utrecht, the Netherlands. To limit possible effects of scanner instability over time, the same scanner parameters as well as image processing procedures were applied at both ages [Peper et al., 2009; van Soelen et al., 2013]. All structural MRI scanning was performed on a 1.5‐T Philips Achieva scanner. At both measurements image sequences of the whole head were acquired, including a short scout scan for immediate verification of optimal head positioning, and a clinical scan that was used for neurodiagnostic evaluation. Three‐dimensional T1‐weighted coronal spoiled‐gradient echo scan of the whole head (256 × 256 matrix, TE = 4.6 ms, TR = 30 ms, flip angle = 30°, 160–180 contiguous slices; 1 × 1 × 1.2 mm3 voxels, field‐of‐view = 256 mm/70%) was acquired for volumetric analysis and assessment of cortical thickness. All children underwent a practice session in a dummy scanner in advance to the actual scanning to become familiar with the scanning procedure [Durston et al., 2009].
Image Processing
Scans were put into Talairach frame (no scaling), and corrected for inhomogeneities in the magnetic field [Sled et al., 1998]. Quantitative assessment of intracranial volume (IC) was performed as previously described for baseline [Peper et al., 2008], and follow‐up [van Soelen et al., 2013]. Cerebral spinal fluid, gray and white matters were segmented using a partial volume segmentation method incorporating a nonuniform partial volume distribution [Brouwer et al., 2010]. At baseline 22 scans (of 212; 10.4%) and at follow‐up 13 scans (of 138; 9.4%) dropped out. These scans dropped out because of bad quality (visual inspection) or during the cerebrospinal fluid/gray matter/white matter separation. Thus, quality control was done prior to determination of the cortical thickness. The gray and white matter segments thus obtained were fed into to the CLASP algorithm designed at the McConnell Brain Imaging Centre, Montreal [Kim et al., 2005; Lerch et al., 2008] for determination of cortical thickness. A surface consisting of 81,920 polygons and 40,962 vertices was fitted to the white matter/gray matter interface of each subject's left and right hemisphere, which was then expanded out to fit the gray matter/cerebrospinal fluid interface, thereby creating the outer cortical surface. The surfaces of the subjects were registered to an average surface [International Consortium for Brain Mapping; Lyttelton et al., 2007], allowing comparison of cortical thickness locally between subjects. The automated anatomical labeling (AAL) atlas [Tzourio‐Mazoyer et al., 2002], defined on this surface, was used to compute mean cortical thickness per region of interest (ROI; 39 ROIs per hemisphere).
Statistical Analyses
All data analyses were carried out with structural equation modeling (SEM) in the software package Mx [Neale et al., 2006]. All available data were analyzed, i.e., regardless whether subjects participated once or twice in the study, or when data were incomplete within a twin pair. All imaging data were corrected for sex, age and handedness. First, phenotypic correlations were estimated between verbal, nonverbal and full scale IQ and cortical thickness in each ROI at both ages 9 and 12 separately, while correcting for familial dependencies. For the phenotypic correlations between IQ and the thicknesses in different ROIs, a correction for multiple comparisons was done according to the false discovery rate (FDR) at a level of 0.05 [Genovese et al., 2002]. Second, to determine to what extent the correlations between IQ and cortical thickness were due to genetic or environmental influences, a bivariate genetic model was fitted to the data. Post hoc multivariate testing was used to explore the relation between the rs6265 genotype and the cortical thickness in areas with significant genetic associations with IQ.
Bivariate Genetic Modeling
Twin studies are widely used to quantify to what extent genetic and environmental factors influence individual differences found in the population, by comparing the similarities within monozygotic (MZ; share (nearly) 100% of their genetic material) and dizygotic (DZ; share on average 50% of their segregating genes) twin pairs. Additive genetic influences (A) represent the influences on the phenotype of multiple alleles at different loci on the genome that act additively. Common environmental influences (C) include all environmental effects that make members of the same family resemble each other. Unique environmental influences (E) are not shared with other family members [Boomsma et al., 2002; Plomin et al., 2013]. A higher correlation between members of MZ pairs compared with DZ pairs indicates genetic influences on a trait. A bivariate genetic model between two traits analyzes the information from the crosstwin/crosstrait correlations, i.e., to what extent the IQ of one twin correlates with its co‐twin's cortical thickness. Larger MZ crosscorrelations than DZ crosscorrelations indicate that there is an overlap between the genetic factors for IQ and cortical thickness. If MZ crosscorrelations are not larger than DZ crosscorrelations there is no such overlap in genetic factors between the two traits.
Earlier in this sample, we found no influences of common environment on variability of cortical thickness [van Soelen et al., 2012]. Therefore, no common environmental influences were modeled for cortical thickness. Figure 2 represents the bivariate genetic model, where cortical thickness as in each ROI can be inserted as the second measured variable. Based on this model, total variance of IQ equals (a 11)2 + (c 11)2 + (e 11)2, and the total variance of cortical thickness in each ROI, as illustrated in Figure 2, equals (a 21)2 + (a 22)2 + (e 21)2 + (e 22)2. The covariance between IQ and cortical thickness in the ROI is derived from multiplying the path coefficients that define the association between the two phenotypes. The total covariance is a summation of these covariances, namely (a 11 × a 21) + (e 11 × e 21). The extent to which genetic influences on IQ and cortical thickness in the ROI overlap can be calculated as the genetic correlation r g = (a 11 × a 21)/√(a 11 2 × (a 21 2 + a 22 2)). In a similar way the unique environmental correlation can be obtained. All correlations were tested to establish if they significantly contributed to the association between IQ and cortical thickness in the ROI by constraining a 21 or e 21 at zero. The goodness of fit of different models was evaluated by comparing differences in log‐likelihood. The difference between the −2 × log likelihoods of both models is chi‐squared distributed with degrees of freedom (df) equal to the difference in the number of parameters estimated in two models.
Figure 2.
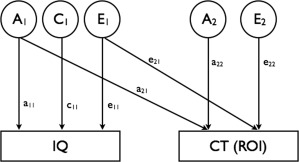
The bivariate genetic model for one individual. A1 and A2 represent the additive genetic factors acting on the intelligence measure (full scale, verbal or nonverbal IQ) and on cortical thickness (CT) in a certain region of interest (ROI). C1 represents the common environmental factor acting on intelligence only. Likewise, E1 and E2 represent the unique environmental factors acting on intelligence and cortical thickness, respectively. The variance of IQ is modeled as (a 11)2 + (c 11)2 + (e 11)2. The variance of cortical thickness in the ROI is computed as (a 21)2 + (a 22)2 + (e 21)2 + (e 22)2. The covariance between IQ and CT (ROI) can be described as (a 11 × a 21) + (e 11 × e 21). The data for twins from a pair are correlated as a function of zygosity: for monozygotic twins, the factors A1 for twins 1 and 2 are fully correlated (r = 1.0); and likewise for A2. For dizygotic twins, the correlations between factors A1 (and A2) for twins 1 and 2 are equal to 0.5. The correlations between factors E1 (and E2) for twins 1 and 2 are by definition equal to 0 for all zygosities. In both MZ and DZ twin pairs, the common environmental factors (C) are correlated unity.
BDNF Genotyping
Buccal swabs were collected on two separate days and genomic DNA isolated using a high salt potassium acetate precipitation followed by a chloroform/isoamyl alcohol (24:1) extraction. Details for buccal DNA extraction have been described previously [Beekman et al., 2001; Meulenbelt et al., 1995]. The 5′ nuclease genotyping assay (TaqMan; Life Technologies, Foster City, CA) was utilized to generate rs6265 genotypes from the purified genomic DNA. BDNF locus specific primers and differentially labeled probes to distinguish between the rs6265 alleles were designed and manufactured at Life Technologies (Assay ID: C_11592758_10). A 5 µl reaction consisting of 1 µl genomic DNA (10 ng/µl), 2.5 µl TaqMan Genotyping Master Mix (2×), 0.125 µl TaqMan Assay mix (40×), and 1.375 µl AccuGene water (Lonza; Basel, Switzerland) was prepared in a 384‐well optical plate. Thermal cycling was performed on an ABI 7900HT Fast real‐time PCR system, with cycling conditions consisting of an initial denaturation at 95°C for 10 min followed by 40 cycles of 95°C for 15 s and 60°C for 1 min. Sequence detection systems (SDS) software version 2.3 was used to generate the genotype calls. Quality control consisted of confirming positive and negative controls as well as genotyping some samples in duplicate. Genotypes were unavailable for three participants and failed for five participants. In the total sample of twins with successful rs6265 genotyping, 136 subjects had the Val/Val genotype (63.0%), 70 had the Val/Met genotype (32.4%), and 10 had the Met/Met genotype (4.6%). The genotype distribution of the rs6265 SNP was in Hardy‐Weinberg equilibrium (χ2 = 2.16, 1 df). Because of the low Met/Met genotype frequency Val/Met and Met/Met carriers were grouped together in all analyses. The rs6265 polymorphism was added as a post hoc analysis, as a preparation for more elaborate genetic analyses. No other SNPs were investigated.
RESULTS
Mean (sd) full scale IQ was 99.9 (13.5) at age 9, and 100.3 (14.1) at 12. Mean level of verbal and nonverbal IQ was 99.6 (14.8) and 100.1 (12.3) at age 9. At age 12, children had an average verbal and nonverbal IQ of 102.3 (12.5), and 98.36 (17.6), respectively. IQ scores were correlated between ages 9 and 12 for full scale (r = 0.71 [0.62, 0.78]; P < 0.0001), verbal (r = 0.71 [0.61, 0.78]; P < 0.0001), and nonverbal IQ (r = 0.54 [0.42, 0.64]; P < 0.0001). Verbal and nonverbal IQ were correlated at ages 9 (r = 0.53 [0.42, 0.63]; P < 0.0001) and 12 (r = 0.41 [0.26, 0.54]; P < 0.0001). Mean cortical thickness was 3.36 (0.09) mm at age 9 and 3.30 (0.09) mm at age 12. Sex differences on cortical thickness were small, and did not reach significance (Supporting Information Fig. 1).
Correlations Between IQ and Cortical Thickness
Regions in which cortical thickness was correlated with IQ (P < 0.05) are given in Table 1 for age 9 and age 12. Overall, negative correlations were observed between cortical thickness and full scale IQ, which were much more pronounced at age 12, compared with age 9 (Fig. 3). At age 12, negative phenotypic correlations between cortical thickness and IQ reached up to −0.32. After FDR correction for multiple comparisons, there were no significant correlations between full scale IQ and cortical thickness at age 9. A considerable number of correlations between full scale IQ and cortical thickness survived FDR correction at age 12 (see Table 1).
Table 1.
Phenotypic correlations (r p), 95% confidence intervals and their associated χ2 values between full scale IQ and cortical thickness (per ROI) at age 9 and 12 (P < 0.05)
| 9 years | 12 years | ||||
|---|---|---|---|---|---|
| Cortical area | r p | χ 2 | r p | χ 2 | |
| L | Precentral gyrus | 0.02 [−0.14, 0.18] | 0.07 | −0.22 [−0.39, −0.03] | 4.92 |
| Superior frontal gyrus | −0.19 [−0.34, −0.03] | 5.73 | −0.17 [−0.35, 0.03] | 2.92 | |
| Middle frontal gyrus | −0.09 [−0.24, 0.06] | 1.37 | −0.30 a [−0.47, −0.11] | 9.34 | |
| Inferior frontal gyrus, opercular | −0.03 [−0.19, 0.13] | 0.13 | −0.24 [−0.41, −0.05] | 5.94 | |
| Inferior frontal gyrus, triangular | −0.12 [−0.28, 0.05] | 2.04 | −0.20 [−0.38, −0.00] | 4.16 | |
| Supplementary motor area | −0.02 [−0.18, 0.14] | 0.05 | −0.25 [−0.42, −0.05] | 6.19 | |
| Superior frontal gyrus, medial | −0.08 [−0.24, 0.08] | 0.98 | −0.28 a [−0.45, −0.09] | 8.19 | |
| Superior frontal gyrus, medial orbital | −0.13 [−0.29, 0.04] | 2.63 | −0.32 a [−0.48, −0.15] | 12.22 | |
| Insula | −0.07 [−0.22, 0.08] | 0.89 | −0.23 [−0.41, −0.04] | 5.69 | |
| Cingulate gyrus, median | −0.10 [−0.25, 0.06] | 1.55 | −0.23 [−0.40, −0.03] | 5.04 | |
| Cuneus | −0.05 [−0.20, 0.10] | 0.39 | −0.27 a [−0.43, −0.09] | 8.09 | |
| Middle occipital gyrus | 0.01 [−0.14, 0.17] | 0.02 | −0.29 a [−0.46, −0.11] | 9.07 | |
| Postcentral gyrus | −0.01 [−0.18, 0.16] | 0.02 | −0.27 a [−0.44, −0.08] | 7.48 | |
| Superior parietal gyrus | −0.13 [−0.28, 0.03] | 2.44 | −0.23 [−0.40, −0.04] | 5.46 | |
| Paracentral lobule | −0.14 [−0.32, 0.03] | 2.58 | −0.29 a [−0.46, −0.08] | 7.70 | |
| Temporal pole, superior temporal | −0.09 [−0.24, 0.06] | 1.50 | −0.29 a [−0.45, −0.11] | 9.55 | |
| R | Precentral gyrus | −0.08 [−0.24, 0.07] | 1.09 | −0.26 [−0.42, −0.07] | 7.26 |
| Middle frontal gyrus, orbital | −0.15 [−0.30, −0.00] | 3.91 | −0.06 [−0.25, 0.13] | 0.45 | |
| Inferior frontal gyrus, triangular | −0.20 [−0.33, −0.05] | 6.69 | −0.02 [−0.20, 0.16] | 0.06 | |
| Supplementary motor area | −0.13 [−0.30, 0.03] | 2.27 | −0.22 [−0.39, −0.03] | 4.92 | |
| Cingulate gyrus, median | −0.11 [−0.27, 0.04] | 2.03 | −0.28 a [−0.45, −0.10] | 8.85 | |
| Cingulate gyrus, posterior | 0.00 [−0.17, 0.17] | 0.00 | −0.20 [−0.36, −0.01] | 4.47 | |
| Calcarine fissure | −0.15 [−0.29, −0.00] | 3.96 | −0.15 [−0.32, 0.04] | 2.51 | |
| Cuneus | −0.05 [−0.21, 0.11] | 0.38 | −0.19 [−0.37, −0.00] | 4.07 | |
| Fusiform gyrus | −0.07 [−0.22, 0.08] | 0.81 | −0.26 a [−0.43, −0.09] | 8.15 | |
| Postcentral gyrus | −0.08 [−0.25, 0.08] | 1.00 | −0.23 [−0.41, −0.04] | 5.59 | |
| Paracentral lobule | −0.13 [−0.28, 0.03] | 2.42 | −0.30 a [−0.46, −0.12] | 10.14 | |
| Heschl gyrus | −0.25 [−0.39, 0.10] | 10.12 | −0.21 [−0.38, −0.03] | 5.15 | |
| Superior temporal gyrus | −0.03 [−0.19, 0.14] | 0.10 | −0.19 [−0.36, −0.02] | 4.51 | |
| Middle temporal gyrus | −0.12 [−0.27, 0.03] | 2.42 | −0.25 a [−0.40, −0.08] | 8.23 | |
All analyses are corrected for sex, age at scanning, and handedness effects on cortical thickness. In Table 1, only regions that showed a correlation with full scale IQ at either age 9 or age 12 (or both) are displayed. Full scale IQ was not significantly correlated with mean cortical thickness at age 9 (r p = −0.10; [−0.26, 0.06]) but was significantly correlated with mean cortical thickness at age 12 (r p = −0.26; [−0.43, −0.08]). L = Left; R = Right; IQ = intelligence quotient. Significant correlations (P < 0.05) are displayed in bold.
Significant correlations after FDR correction for multiple comparisons, only present at age 12 (critical χ 2 = 7.48/8.15 for left/right hemisphere respectively).
Figure 3.
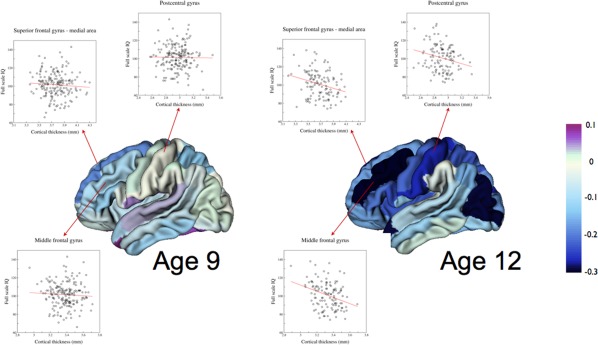
Phenotypic correlations illustrating the emergence of the association between cortical thickness and full scale IQ between ages 9 and 12 in left superior frontal medial, postcentral, and middle frontal cortical areas. Cortical thickness was corrected for age at scanning, sex, and handedness.
Comparing verbal IQ to nonverbal IQ, phenotypic correlations between intelligence and cortical thickness seem to be driven by the verbal component of IQ, rather than the nonverbal component (see Supporting Information Tables SII and SIII). Significant negative correlations between verbal IQ and cortical thickness were found at age 12, but were absent at age 9. These correlations were more widespread in the left hemisphere (mostly in frontal areas), compared with the right hemisphere. Similar to verbal IQ, a larger number and stronger negative correlations were found at age 12 compared with age 9 for nonverbal IQ, but only one correlation at age 12 survived FDR correction (occipital middle area).
As there were small differences in the data collection between baseline and follow‐up, it is of importance to exclude these possible confounders on the observed and nonexistent correlations between IQ and cortical thickness. Therefore, the effects of children who did not return at the follow‐up (dropout), the difference in the amount of subtests between the two moments of testing, and the amount of time between IQ assessment and MRI scanning were explored in more detail. It is possible that at age 9, the children who did not return at follow‐up, obscured the correlation emerging at age 12. One reason for this may be differences in SES between baseline and follow‐up, which has been shown to influence heritability of intelligence [e.g., Hanscombe et al., 2011; Turkheimer et al., 2003]. In regions that showed such a correlation at age 12, we repeated the analysis at age 9, including only children that also returned at follow‐up. Still, no significant correlations at age 9 were observed (all P's > 0.05). This result also shows that the small difference in SES between the group that returned and the group that did not participate at follow‐up did not influence our results. Similarly, using only the IQ subtests that were included at age 12 and repeating the analyses at age 9 showed no significant correlations between intelligence and cortical thickness. Finally, the differences in the time period between the cognitive assessment and moment of scanning at baseline could not explain the absence of a correlation at age 9 compared with age 12, where IQ tests and MRI acquisition was done at the same day.
Genetic Modeling
Heritability of full scale IQ was 42% at age 9 and 56% at age 12. Heritability for verbal IQ and nonverbal IQ was 39 and 55% at age 9, and 19 and 72% at age 12, respectively. For full scale and verbal IQ, common environmental influences explained 33 and 41% of the variance at age 9, and 25 and 56% at age 12. Genetic correlations between the IQ measures at age 9 and 12 were high (>0.64; significant for full scale and nonverbal IQ), see Supporting Information Table SIV. Genetic correlations between cortical thickness at age 9 and 12 were also high (Fig. 4), indicating that the same genes influence these traits at both ages.
Figure 4.

Heritability estimates per ROI at age 9 and 12 (with confidence intervals) and genetic correlations over age (with confidence intervals) for the right and left hemisphere.
Results from the bivariate genetic model fitted on the data for the ROIs in which cortical thickness showed a correlation with full scale IQ, verbal or nonverbal IQ (FDR corrected; only present at age 12) are given in Table 2. In most ROIs in both left and right hemispheres, genetic correlations (r g) were between −0.54 and −1.00, indicating that the same genetic factors to a large extent act on (verbal) IQ and the cortical thickness of a specific ROI.
Table 2.
Results of the bivariate genetic model for full scale, verbal and nonverbal IQ and thickness per cortical area at age 12 (areas in which the phenotypic correlation r p was significant after FDR correction)
| Cortical area | r p | r g | χ 2 | r e | χ 2 | h 2 | ||
|---|---|---|---|---|---|---|---|---|
| Full scale IQ | L | Middle frontal gyrus | −0.30 | −0.44 [−1.00, −0.14] | 7.74 | 0.10 [−0.28, 0.43] | 0.30 | 0.62 [0.26, 0.80] |
| Superior frontal gyrus, medial | −0.28 | −0.58 [−1.00, −0.18] | 8.30 | 0.17 [−0.21, 0.50] | 0.81 | 0.53 [0.18, 0.75] | ||
| Superior frontal gyrus, medial orbital | −0.32 | −1.00 [−1.00, −0.50] | 11.35 | 0.11 [−0.23, 0.40] | 0.38 | 0.20 [0.04, 0.50] | ||
| Cuneus | −0.27 | −0.63 [−1.00, −0.19] | 8.27 | 0.23 [−0.17, 0.56] | 1.28 | 0.49 [0.09, 0.75] | ||
| Middle occipital gyrus | −0.29 | −0.57 [−1.00, −0.17] | 7.76 | 0.11 [−0.26, 0.45] | 0.38 | 0.54 [0.21, 0.74] | ||
| Postcentral gyrus | −0.27 | −0.40 [−0.91, 0.02] | 3.59 | −0.16 [−0.48, 0.19] | 0.82 | 0.49 [0.15, 0.71] | ||
| Paracentral lobule | −0.29 | −0.32 [−0.64, −0.04] | 4.83 | −0.24 [−0.54, 0.12] | 1.71 | 0.77 [0.58, 0.87] | ||
| Temporal pole, superior temporal | −0.29 | −0.57 [−1.00, 1.00] | 3.36 | −0.21 [−0.51, 0.14] | 1.41 | 0.21 [0.00, 0.52] | ||
| R | Cingulate gyrus, median | −0.28 | −0.56 [−1.00, 1.00] | 3.59 | −0.15 [−0.49, 0.23] | 0.59 | 0.24 [0.00, 0.57] | |
| Fusiform gyrus | −0.26 | −0.55 [−1.00, −0.00] | 3.89 | −0.07 [−0.42, 0.29] | 0.15 | 0.25 [0.00, 0.55] | ||
| Paracentral lobule | −0.31 | −0.60 [−1.00, −0.12] | 5.69 | −0.13 [−0.43, 0.20] | 10.58 | 0.33 [0.03, 0.57] | ||
| Middle temporal gyrus | −0.25 | −0.37 [−1.00, 0.18] | 2.09 | −0.20 [−0.51, 0.16] | 1.22 | 0.30 [0.00, 0.59] | ||
| Verbal IQ | L | Precentral gyrus | −0.23 | −0.72 [−1.00, 1.00] | 2.43 | −0.04 [−0.37, 0.28] | 0.05 | 0.33 [0.03, 0.59] |
| Middle frontal gyrus | −0.28 | −1.00 [−1.00, −0.23] | 5.77 | 0.15 [−0.19, 0.45] | 0.81 | 0.59 [0.27, 0.78] | ||
| Inferior frontal gyrus, opercular | −0.27 | −0.95 [−1.00, 1.00] | 3.03 | −0.14 [−0.43, 0.15] | 0.87 | 0.20 [0.00, 0.48] | ||
| Inferior frontal gyrus, triangular | −0.26 | −0.60 [−1.00, 1.00] | 2.81 | −0.10 [−0.42, 0.25] | 0.27 | 0.51 [0.20, 0.71] | ||
| Inferior frontal gyrus, orbital | −0.28 | −1.00 [−1.00, −0.23] | 3.96 | −0.06 [−0.35, 0.22] | 0.19 | 0.18 [0.00, 0.47] | ||
| Supplementary motor area | −0.27 | −0.61 [−1.00, 0.07] | 3.21 | −0.16 [−0.46, 0.18] | 0.85 | 0.54 [0.27, 0.72] | ||
| Superior frontal gyrus, medial | −0.29 | −1.00 [−1.00, −0.39] | 7.91 | 0.15 [−0.18, 0.43] | 0.79 | 0.51 [0.19, 0.74] | ||
| Superior frontal gyrus, medial orbital | −0.27 | −1.00 [−1.00, −0.26] | 4.58 | 0.06 [−0.25, 0.35] | 0.17 | 0.21 [0.00, 0.50] | ||
| Insula | −0.30 | −0.74 [−1.00, 0.00] | 3.83 | −0.05 [−0.38, 0.26] | 0.08 | 0.35 [0.05, 0.61] | ||
| Cuneus | −0.28 | −1.00 [−1.00, −0.57] | 11.61 | 0.39 [0.09, 0.62] | 6.37 | 0.48 [0.19, 0.71] | ||
| Postcentral gyrus | −0.30 | −0.56 [−1.00, 1.00] | 2.60 | −0.23 [−0.53, 0.13] | 1.54 | 0.48 [0.14, 0.70] | ||
| Superior parietal gyrus | −0.27 | −1.00 [−1.00, −0.34] | 8.92 | 0.15 [−0.20, 0.44] | 0.93 | 0.38 [0.07, 0.65] | ||
| Precuneus | −0.26 | −1.00 [−1.00, −0.37] | 7.63 | 0.30 [−0.03, 0.55] | 3.20 | 0.51 [0.22, 0.73] | ||
| Paracentral lobule | −0.29 | −0.54 [−1.00, −0.06] | 4.85 | −0.15 [−0.48, 0.23] | 0.56 | 0.76 [0.55, 0.87] | ||
| Temporal pole, superior temporal | −0.27 | −0.69 [−1.00, 1.00] | 1.15 | −0.21 [−0.50, 0.11] | 1.58 | 0.19 [0.00, 0.51] | ||
| R | Precentral gyrus | −0.35 | −0.77 [−1.00, 1.00] | 2.27 | −0.24 [−0.53, 0.07] | 2.22 | 0.24 [0.00, 0.52] | |
| Supplementary motor area | −0.40 | −0.59 [−1.00, −0.02] | 4.02 | −0.31 [−0.61, 0.05] | 2.81 | 0.45 [0.12, 0.68] | ||
| Cingulate gyrus, median | −0.39 | −1.00 [−1.00, −0.55] | 6.56 | −0.08 [−0.39, 0.25] | 0.20 | 0.27 [0.02, 0.56] | ||
| Paracentral lobule | −0.36 | −0.84 [−1.00, −0.05] | 4.30 | −0.19 [−0.49, 0.12] | 1.32 | 0.26 [0.01, 0.53] | ||
| Middle temporal gyrus | −0.29 | −1.00 [−1.00, −0.45] | 8.38 | 0.07 [−0.24, 0.35] | 0.19 | 0.34 [0.06, 0.59] | ||
| Nonverbal IQ | L | Middle occipital gyrus | −0.33 | −0.57 [−0.93, −0.26] | 10.91 | 0.19 [−0.20, 0.51] | 0.94 | 0.59 [0.29, 0.77] |
Genetic correlations (r g), environmental correlations (r e) and their associated −2 values, and heritability estimates (h 2) of cortical thickness are given, including their 95% confidence intervals. L = Left; R = Right; IQ = intelligence quotient. Significant correlations and heritabilities (P < 0.05) are displayed in bold.
Several studies have reported an age‐dependency of the signal contrast [Salat et al., 2009; Westlye et al., 2009, 2010] and as most segmentation methods are calibrated on adult samples, it is easier to segment brains that are more adult‐like. Hence, the absence of a correlation between cortical thickness and intelligence at age 9 and its presence at age 12 may be in part explained by changes in the signal contrast. The genetic modeling results may give some insight whether this might be the case: If the (genetic) associations between intelligence and cortical thickness would not change over time but are obscured at the first measurement by a bigger measurement error (i.e. unique environmental variance) one would expect (i) the genetic covariance between intelligence and cortical thickness to stay the same while (ii) estimates of environmental variance of cortical thickness decrease over time. We found both a decrease in environmental variance over time in more than half (51) of the areas and an increase in (absolute) genetic covariance in most (63) areas; the two effects strengthening each other. On the basis of our findings, we cannot rule out that a greater environmental variance in the younger group may have obscured an existing correlation between intelligence and cortical thickness at age 9 to some extent. However, the finding that genetic covariance increases over time does suggest that genetic factors also play an important role in the emergence of this correlation and that differences in signal intensity is not the only explanation.
Associations Between BDNF Genotype, IQ, and Cortical Thickness
In cortical regions in which we showed a genetic association between IQ and cortical thickness, we investigated the effect of the BDNF‐genotype. The group having at least one Met allele scored lower than the group homozygote for the Val allele on all IQ measures, but none of these differences were statistically significant. In almost in all regions, the group having at least one Met allele had a thicker cortex, which reached statistical significance in the left parietal superior area (see Table 3).
Table 3.
Effects of the BDNF‐genotype on intelligence measures and cortical thickness (age 12)
| BDNF genotype | |||
|---|---|---|---|
| Intelligence measure | Val/Val homozygotes | Met carriers | |
| Full scale IQ (age 9) | 101.5 (13.7)(N = 137) | 98.0 (13.2)(N = 81) | |
| Verbal IQ (age 9) | 101.2 (15.2)(N = 137) | 98.1 (14.3)(N = 81) | |
| Performance IQ (age 9) | 101.5 (12.4)(N = 137) | 98.0 (11.6)(N = 81) | |
| Full scale IQ (age 12) | 102.0 (14.6)(N = 75) | 99.0 (13.6)(N = 49) | |
| Verbal IQ (age 12) | 102.8 (13.9)(N = 75) | 101.0 (11.1)(N = 49) | |
| Performance IQ (age 12) | 100.2 (17.5)(N = 103) | 96.1 (17.6)(N = 75) | |
| Cortical area | Cortical thickness (N = 76) Mean (sd) in mm | Cortical thickness (N = 49) Mean (sd) in mm | |
| L | Middle frontal gyrus | 3.32 (0.14) | 3.35 (0.12) |
| Inferior frontal gyrus, orbital part | 3.65 (0.21) | 3.66 (0.18) | |
| Superior frontal gyrus, medial | 3.68 (0.17) | 3.70 (0.19) | |
| Cuneus | 3.36 (0.28) | 3.40 (0.25) | |
| Superior parietal gyrusa | 3.03 (0.13) | 3.08 (0.14) | |
| Precuneus | 3.36 (0.13) | 3.40 (0.14) | |
| Paracentral lobule | 3.25 (0.26) | 3.26 (0.18) | |
| R | Supplementary motor area | 3.76 (0.17) | 3.78 (0.18) |
| Cingulate gyrus, median | 3.73 (0.15) | 3.75 (0.15) | |
| Fusiform gyrus | 3.40 (0.14) | 3.40 (0.11) | |
| Paracentral lobule | 2.94 (0.24) | 2.97 (0.22) | |
| Middle temporal gyrus | 3.53 (0.14) | 3.50 (0.13) | |
Mean (sd) IQ measures and mean cortical thickness (sd) in mm are given for the Val/Val homozygotes. Only areas in which genetic factors caused the association between intelligence and cortical thickness are shown (see Supporting Information Table 2). BDNF = brain‐derived neurotrophic factor; IQ = intelligence quotient.
Significant difference between Val/Val homozygotes and Met‐carriers (P = 0.04; corrected for familial dependencies).
DISCUSSION
Cortical thinning occurring at the brink of puberty is accompanied by an increasing association between cortical thickness and intelligence and this growing association is driven by genetic influences. At 9 years of age, cortical thickness and intelligence are not significantly correlated at the phenotypic level. At age 12, an association between cortical thickness and intelligence emerges: children with a higher intelligence score have a thinner cortex, specifically in the left frontal cortex. When separating verbal and nonverbal IQ, it becomes apparent that this association is mainly driven by the verbal component of intelligence. In contrast, nonverbal intelligence and cortical thickness are not correlated, neither at age 9 nor at age 12. To a large extent, genetic factors acting on (verbal) IQ and cortical thickness at age 12 are the same. It seems that at the onset of puberty, genes that explain variation in both intelligence and in cortical thickness increase their influence, which manifests itself in the emergence of an association between cortical thickness and intelligence.
The rapid changes with age in the associations between cortical thickness and intelligence makes it hard to make comparisons between studies. Tamnes and colleagues reported a negative association between the two in late childhood/young adolescence in a group of participants whose age range (8–14) overlaps with the ages (9 and 12 years) in the current study. After age 14, the association disappeared [Tamnes et al., 2011]. The emergence of the association the ages of 9 and 12 is consistent with the observation that more intelligent children show a steeper decline in cortical thinning [Shaw et al., 2006]. However, the latter study showed this thinning only after age 14, at the age at which switch from negative to positive correlations already had occurred. A positive correlation was also observed in a cross‐sectional sample with ages ranging from 6 to 18 [Karama et al., 2011]. The group of children in the current study is representative of the intelligence level in the general population, with and average IQ score of 100 and half of the sample showing a score below 100. This last group often is not well represented in other studies. It seems that timing of (cortical) development and intelligence scores are much intertwined and it is therefore hard to extrapolate our findings outside the ages studied here.
Results concerning the association of brain structure and verbal abilities have been mixed thus far. Negative correlations between cortical thickness and a verbal fluency task, after controlling for verbal intelligence have been found, in left temporal and parietal areas [Porter et al., 2011]. Improvement on a verbal task has been linked to decreases in cortical gray matter [Sowell et al., 2004]. In contrast, increases in verbal intelligence were recently linked to increases in gray matter density in a motor‐speech region [Ramsden et al., 2011]. Similar to general intelligence, the correlates of verbal abilities in brain structure seem to be age and region specific.
The differences we find between the ages of 9 and 12 may be linked to a time‐window in which language development occurs most easily. It has been suggested that first language acquisition occurs most optimally before the age of 12 [Sakai, 2005]. Maybe not coincidentally, the influence of the environment on verbal intelligence, which is substantial in childhood, has almost disappeared at age 12 [Hoekstra et al., 2007]. We may hypothesize that after a period in which language acquisition is optimal and most sensitive to environmental influences, the relative influence of genetic factors become more important. This process may manifest itself in the emergence of genetically driven associations between cortical thickness and verbal intelligence. Supporting this train of thought is the fact that in this sample, a high genetic correlation was found for cortical thinning in both Broca's and Wernicke's area [van Soelen et al., 2012]. It must be noted that our present study does not allow for drawing conclusions about (genetic) influences on cortical thinning.
The associations between verbal intelligence and cortical thickness were strongest in the left frontal lobe. Development of the frontal lobe has been linked to the development of cognitive functions, specifically the development of temporal integration of information [Fuster, 2002] and might therefore not only be linked to language but also to other forms of higher executive functioning. Our results may be seen in the light of the parieto‐frontal integration theory of intelligence [P‐FIT; Jung and Haier, 2007] which links a network of areas (including the dorsolateral prefrontal cortex, the parietal lobe, the anterior cingulate cortex and regions within the occipital and temporal lobes) to cognitive abilities. This theory also stresses the importance of the left hemisphere as the most important for cognitive task performance.
As a post hoc analysis, we investigated the effects of the BDNF Val66Met genotype on intelligence and cortical thickness. The genotype has been shown to modulate the association between intelligence and white matter properties [Chiang et al., 2011]. On a functional level, the BDNF variant has been mostly associated with memory performance: Met‐carriers perform worse on memory tasks and show less hippocampal activation [Egan et al., 2003; Hariri, 2003]. In adolescents, this finding could not be replicated [Hansell et al., 2007]. Findings linking BDNF to intelligence have been somewhat contradictive [Harris et al., 2006; Houlihan et al., 2009; Miyajima et al., 2008]. Here we found lower intelligence scores in the Met‐carriers, but the difference was not significant. A thinner cortex and reduced hippocampal volume has been found in adults carrying the Met‐allele [Pezawas et al., 2004]. Here, we find the opposite pattern. Considering that the cortex is rapidly changing in our group of (pre)pubertal children, it may be that the genetic effect of the BDNF‐allele is age dependent. As genes explain a large part of the association between cortical thickness and intelligence, we may not state with certainty that the BDNF variant is one of them based on our findings.
There are several limitations to take into account when interpreting the results of this study. First, several studies have reported an age‐dependency of the signal contrast throughout the lifespan [Salat et al., 2009; Westlye et al., 2009, 2010] and segmentation is likely to be harder in younger children. It is therefore possible that the association between cortical thickness and intelligence does not change but is obscured at the younger age by a bigger measurement error. However, while we indeed found a decrease of environmental variance (which includes measurement error) over age, this was accompanied by an increase in (absolute) genetic variance, indicating that reduced measurement error cannot be the only reason for the association with intelligence coming up. Second, genetic correlations can be the result of several underlying mechanisms: either the same genetic factors are directly responsible for both phenotypes, or the genetic influences on one of the phenotypes seep through onto the other over time through a causal relationship. Finally, our choice of performing genetic analyses only in those regions that showed a significant correlation between intelligence and cortical thickness does not take into account that it is well possible that genetic and environmental correlations with opposite signs exist. Evidence that this occurred was limited in our sample.
CONCLUSION
In conclusion, the associations between cortical thickness and intelligence are limited at age 9. Over the next 3 years, an association between a thinner cortex, mainly in the left hemisphere, and a higher intelligence arises. These associations at age 12 are predominantly driven by genes. Around the onset of puberty, genes that explain variation in both intelligence and in cortical thickness seem to increase their influence, which manifests itself in the emergence of an association between cortical thickness and intelligence.
ACKNOWLEDGMENTS
The authors thank the participating twins and their families.
Supporting information
Supporting Information Figure
Supporting Information Table 1
Supporting Information Table 3
Supporting Information Table 3
Supporting Information Table 4
Rachel M. Brouwer and Inge L.C. van Soelen contributed equally to this work.
Hilleke E. Hulshoff Pol and Dorret I. Boomsma contributed equally to this work.
REFERENCES
- Bartels M, Rietveld MJ, van Baal GC, Boomsma DI (2002): Genetic and environmental influences on the development of intelligence. Behav Genet 32:237–249. [DOI] [PubMed] [Google Scholar]
- Beekman M, Lakenberg N, Cherny SS, de Knijff P, Kluft CC, van Ommen GJ, Vogler GP, Frants RR, Boomsma DI, Slagboom PE (2001): A powerful and rapid approach to human genome scanning using small quantities of genomic DNA. Genet Res 77:129–134. [DOI] [PubMed] [Google Scholar]
- Boomsma DI, Hulshoff Pol HE (2010): Brain plasticity and intellectual ability are influenced by shared genes. J Neurosci 30:5519–5524. [DOI] [PMC free article] [PubMed] [Google Scholar]
- Boomsma DI, Busjahn A, Peltonen L (2002): Classical twin studies and beyond. Nature reviews. Genetics 3:872–882. [DOI] [PubMed] [Google Scholar]
- Boomsma DI, de Geus EJ, Vink JM, Stubbe JH, Distel MA, Hottenga JJ, Posthuma D, van Beijsterveldt TC, Hudziak JJ, Bartels M, Willemsen G (2006): Netherlands Twin Register: From twins to twin families. Twin Res Hum Genet 9:849–857. [DOI] [PubMed] [Google Scholar]
- Brans RG, Kahn RS, Schnack HG, van Baal GC, Posthuma D, van Haren NE, Lepage C, Lerch JP, Collins DL, Evans AC, Brain development cooperative group (2012): Total and regional brain volumes in a population‐based normative sample from 4 to 18 years: The NIH MRI study of normal brain development. Cereb Cortex 22:1–12. [DOI] [PMC free article] [PubMed] [Google Scholar]
- Brouwer RM, Hulshoff Pol HE, Schnack HG (2010): Segmentation of MRI brain scans using non‐uniform partial volume densities. Neuroimage 49:467–477. [DOI] [PubMed] [Google Scholar]
- Brown TT, Kuperman JM, Chung Y, Erhart M, McCabe C, Hagler DJ, Venkatraman VK, Akshoomoff N, Amaral DG, Bloss, CS , Casey BJ, Chang L, Ernst TM, Frazier JA, Gruen JR, Kaufmann WE, Kenet T, Kennedy DN, Murray SS, Sowell ER, Jernigan TL, Dale AM (2012): Neuroanatomical assessment of biological maturity. Curr Biol 22:1693–1698. [DOI] [PMC free article] [PubMed] [Google Scholar]
- Casey BJ, Tottenham N, Liston C, Durston S (2005): Imaging the developing brain: What have we learned about cognitive development? Trends Cogn Sci 9:104–110. [DOI] [PubMed] [Google Scholar]
- Chiang MC, Baysheva M, Toga AW, Medland SE, Hansell NK, James MR, McMahon KL, de Zubicaray GI, Martin MG, Wright MJ, Thompson PM (2011): BDNF gene effects on brain circuitry replicated in 455 twins. NeuroImage 55:448–454. [DOI] [PMC free article] [PubMed] [Google Scholar]
- Durston S, Nederveen H, van Dijk S, van Belle J, de Zeeuw P, Langen M, van Dijk A (2009): Magnetic resonance simulation is effective in reducing anxiety related to magnetic resonance scanning in children. J Am Acad Child Adolesc Psychiatry 48:206–207. [DOI] [PubMed] [Google Scholar]
- Egan MF, Kojima M, Callicot JH, Goldberg TE, Kolachana BS, Bertolino A, Zaitsev E, Gold B, Goldman D, Dean M, Lu B, Weinberger DR (2003): The BDNF val66met polymorphism affects activity‐dependent secretion of BDNF and human memory and hippocampal function. Cell 112:257–269. [DOI] [PubMed] [Google Scholar]
- Fuster JM. 2002. Frontal lobe and cognitive development. J Neurocytol 31:373–385. [DOI] [PubMed] [Google Scholar]
- Genovese CR, Lazar NA, Nichols T. 2002. Thresholding of statistical maps in functional neuroimaging using the false discovery rate. Neuroimage 15:870–878. [DOI] [PubMed] [Google Scholar]
- Giedd JN, Blumenthal J, Jeffries NO, Castellanos FX, Liu H, Zijdenbos A, Paus T, Evans AC, Rapoport JL (1999): Brain development during childhood and adolescence: A longitudinal MRI study. Nat Neurosci 2:861–863. [DOI] [PubMed] [Google Scholar]
- Gray JD, Milner TA, McEwen BS (2013): Dynamic plasticity: The role of glucocorticoids, brain‐derived neurotrophic factors and other trophic factors. Neuroscience 239:214–227. [DOI] [PMC free article] [PubMed] [Google Scholar]
- Hanscombe KB, Trzaskowski M, Haworth CMA, Davis OSP, Dale PS, Plomin R (2011): Socioeconomic status (SES) and children's intelligence (IQ): In a UK‐representative sample SES moderates the environmental, not genetic, effect on IQ. PLoS One 7(2):e30320. doi: 10.1371/journal.pone.0030320. Epub 2012 Feb 1. [DOI] [PMC free article] [PubMed] [Google Scholar]
- Hansell NK, James MR, Duffy DL, Birley AJ, Luciano M, Geffen GM, Wright MJ, Montgomery GM, Martin NG (2007): Effect of the BDNF V166M polymorphism on working memory in healthy adolescents. Genes Brain Behav 6:260–268. [DOI] [PubMed] [Google Scholar]
- Hariri AR, Goldberg TE, Mattay VS, Kolachana BS, Callicot JH, Egan MF, Weinberger DR (2003): Brain‐derived neurotrophic factor val66met polymorphism affects human memory‐related hippocampal activity and predicts memory performance. J Neurosci 23:6690–6694. [DOI] [PMC free article] [PubMed] [Google Scholar]
- Harris SE, Fox H, Wright AF, Hayward C, Starr JM, Whalley LJ, Deary IJ (2006): The brain‐derived neurotrophic factor Val66Met polymorphism is associated with age‐related change in reasoning skills. Mol Psychiatry 11:505–513. [DOI] [PubMed] [Google Scholar]
- Haworth CM, Wright MJ, Luciano M, Martin NG, de Geus EJ, van Beijsterveldt CE, Bartels M, Posthuma D, Boomsma DI, Davis OS, Kovas Y, Corley RP, Defries JC, Hewitt JK, Olson RK, Rhea SA, Wadsworth SJ, Iacono WG, McGue M, Thompson LA, Hart SA, Petrill SA, Lubinski D, Plomin R (2010): The heritability of general cognitive ability increases linearly from childhood to young adulthood. Mol Psychiatry 15:1112–1120. [DOI] [PMC free article] [PubMed] [Google Scholar]
- Hoekstra RA, Bartels M, Boomsma DI (2007): Longitudinal genetic study of verbal and nonverbal IQ from early childhood to young adulthood. Learn Individ Diff 17:97–114. [Google Scholar]
- Houlihan LM, Harris SE, Luciano M, Gow AJ, Starr JM, Visscher PM, Deary IJ (2009): Replication study of candidate genes for cognitive abilities: The Lothian Birth Cohort 1936. Genes Brain Behav 8:238–247. [DOI] [PubMed] [Google Scholar]
- Jung RE, Haier RJ. 2007. The Parieto‐Frontal Integration Theory (P‐FIT) of intelligence: Converging neuroimaging evidence. Behav Brain Sci 30:135–154. [DOI] [PubMed] [Google Scholar]
- Karama S, Colom R, Johnson W, Deary IJ, Haier R, Waber DP, Lepage C, Ganjavi H, Jung R, Evans AC (2011): Cortical thickness correlates of specific cognitive performance accounted for by the general factor of intelligence in healthy children aged 6 to 18. Neuroimage 55:1443–1453. [DOI] [PMC free article] [PubMed] [Google Scholar]
- Kim JS, Singh V, Lee JK, Lerch J, Ad‐Dab'bagh Y, MacDonald D, Lee JM, Kim SI, Evans AC (2005): Automated 3‐D extraction and evaluation of the inner and outer cortical surfaces using a Laplacian map and partial volume effect classification. Neuroimage 27:210–221. [DOI] [PubMed] [Google Scholar]
- Kremen WS, Prom‐Wormley E, Panizzon MS, Eyler LT, Fischl B, Neale MC, Franz CE, Lyons MJ, Pacheco J, Perry ME, Stevens A, Schmitt JE, Grant MD, Seidman LJ, Thermenos HW, Tsuang MT, Eisen SA, Dale AM, Fennema‐Notestine C (2010): Genetic and environmental influences on the size of specific brain regions in midlife: The VETSA MRI study. Neuroimage 49:1213–1223. [DOI] [PMC free article] [PubMed] [Google Scholar]
- Miyajima F, Ollier W, Mayes A, Jackson A, Thacker N, Rabbitt P, Pendleton N, Horan M, Payton A. (2008): Brain‐derived neurotrophic factor polymorphism Val66Met influences cognitive abilities in the elderly. Genes Brain Behav 7:411–417. [DOI] [PubMed] [Google Scholar]
- Lenroot RK, Schmitt JE, Ordaz SJ, Wallace GL, Neale MC, Lerch JP, Kendler KS, Evans AC, Giedd JN (2009): Differences in genetic and environmental influences on the human cerebral cortex associated with development during childhood and adolescence. Hum Brain Mapp 30:163–174. [DOI] [PMC free article] [PubMed] [Google Scholar]
- Lerch JP, Pruessner J, Zijdenbos AP, Collins DL, Teipel SJ, Hampel H, Evans AC (2008): Automated cortical thickness measurements from MRI can accurately separate Alzheimer's patients from normal elderly controls. Neurobiol Aging 29:23–30. [DOI] [PubMed] [Google Scholar]
- Lyttelton O, Boucher M, Robbins S, Evans A (2007): An unbiased iterative group registration template for cortical surface analysis. Neuroimage 34:1535–1544. [DOI] [PubMed] [Google Scholar]
- Marshall WA, Tanner JM (1969): Variations in pattern of pubertal changes in girls. Arch Dis Child 44:291–303. [DOI] [PMC free article] [PubMed] [Google Scholar]
- Marshall WA, Tanner JM (1970): Variations in pattern of pubertal changes in boys. Arch Dis Child 45:13–23. [DOI] [PMC free article] [PubMed] [Google Scholar]
- McDaniel MA (2005): Big‐brained people are smarter: A meta‐analysis of the relationship between in vivo brain volume and intelligence. Intelligence 33:337–346. [Google Scholar]
- Meulenbelt I, Droog S, Trommelen GJ, Boomsma DI, Slagboom PE (1995): High‐yield noninvasive human genomic DNA isolation method for genetic studies in geographically dispersed families and populations. Am J Hum Genet 57:1252–1254. [PMC free article] [PubMed] [Google Scholar]
- Narr KL, Woods RP, Thompson PM, Szeszko P, Robinson D, Dimtcheva T, Gurbani M, Toga AW, Bilder RM (2007): Relationships between IQ and regional cortical gray matter thickness in healthy adults. Cereb Cortex 17:2163–2171. [DOI] [PubMed] [Google Scholar]
- Neale MC, Boker SM, Xie G, Maes HH. 2006. Mx: Statistical Modeling. VCU Box 900126, Richmond, VA 23298: Department of Psychiatry.
- Peper JS, Brouwer RM, Schnack HG, van Baal GC, van LM, van den Berg SM, Delemarre‐van de Waal HA, Janke AL, Collins DL, Evans AC, Boomsma DI, Kahn RS, Hulshoff Pol HE (2008): Cerebral white matter in early puberty is associated with luteinizing hormone concentrations. Psychoneuroendocrinology 33:909–915. [DOI] [PubMed] [Google Scholar]
- Peper JS, Schnack HG, Brouwer RM, van Baal GC, Pjetri E, Szekely E, van LM, van den Berg SM, Collins DL, Evans AC, Boomsma DI, Kahn RS, Hulshoff Pol HE (2009): Heritability of regional and global brain structure at the onset of puberty: A magnetic resonance imaging study in 9‐year‐old twin pairs. Hum Brain Mapp 30:2184–2196. [DOI] [PMC free article] [PubMed] [Google Scholar]
- Pezawas L, Verchinski BA, Mattay VS, Callicott JH, Kolachana BS, Straub RE, Egan MF, Meyer‐Lindenberg A, Weinberger DR (2004): The brain‐derived neurotrophic factor val66met polymorphism and variation in human cortical morphology. J Neurosci 24:10099–10102. [DOI] [PMC free article] [PubMed] [Google Scholar]
- Plomin R, DeFries JC, McClearn GE, McGuffin P. 2013. Behavioral genetics. New York: Worth Publishers. [Google Scholar]
- Porter JN, Collins PF, Muetzel RL, Lim KO, Luciana M (2011): Associations between cortical thickness and verbal fluency in childhood, adolescence and young adulthood. NeuroImage 55:1865–1877. [DOI] [PMC free article] [PubMed] [Google Scholar]
- Posthuma D, de Geus EJC, Boomsma DI (2001): Perceptual speed and IQ are associated through common genetic factors. Behav Genet 31:593–602. [DOI] [PubMed] [Google Scholar]
- Ramsden S, Richardson FM, Josse G, Thomas MSC, Ellis C, Shakeshaft C, Sehier ML, Price CJ (2011): Verbal and non‐verbal intelligence changes in the teenage brain. Nature 479:113–116. [DOI] [PMC free article] [PubMed] [Google Scholar]
- Sakai KL (2005): Language acquisition and brain development. Science 310:815–819. [DOI] [PubMed] [Google Scholar]
- Salat DH, Lee SY, van der Kouwe AJ, Greve DN, Fischl B, Rosas HD (2009): Age‐associated alterations in cortical gray and white matter signal intensity and gray to white matter contrast. NeuroImage 48:21–28. [DOI] [PMC free article] [PubMed] [Google Scholar]
- Shaw P, Greenstein D, Lerch J, Clasen L, Lenroot R, Gogtay N, Evans A, Rapoport J, Giedd J (2006): Intellectual ability and cortical development in children and adolescents. Nature 440:676–679. [DOI] [PubMed] [Google Scholar]
- Shaw P, Kabani NJ, Lerch JP, Eckstrand K, Lenroot R, Gogtay N, Greenstein D, Clasen L, Evans A, Rapoport JL, Giedd JN, Wise SP (2008): Neurodevelopmental trajectories of the human cerebral cortex. J Neurosci 28:3586–3594. [DOI] [PMC free article] [PubMed] [Google Scholar]
- Sowell ER, Thompson PM, Leonard CM, Welcome SE, Kan E, Toga AW (2004): Longitudinal mapping of cortical thickness and brain growth in normal children. J Neurosci 24:8223–8231. [DOI] [PMC free article] [PubMed] [Google Scholar]
- Sled JG, Zijdenbos AP, Evans AC (1998): A nonparametric method for automatic correction of intensity nonuniformity in MRI data. IEEE Trans Med Imaging 17:87–97. [DOI] [PubMed] [Google Scholar]
- Tamnes CK, Østby Y, Fjell AM, Westlye LT, Due‐Tønnessen P, Walhovd KB (2010): Brain maturation in adolescence and young adulthood: Regional age‐related changes in cortical thickness and white matter volume and microstrucure. Cereb Cortex 20:534–548. [DOI] [PubMed] [Google Scholar]
- Tamnes CK, Fjell AM, Østby Y, Westlye LT, Due‐Tønnessen P, Bjørnerud A, Walhovd KB (2011): The brain dynamics of intellectual development: Waxing and waning white and gray matter. Neuropsychologia 49:3605–3611. [DOI] [PubMed] [Google Scholar]
- Turkheimer E, Haley A, Waldron M, D'Onofrio B, Gottesman II (2003): Socioeconomic status modifies heritability of IQ in young children. Psych Sci 14:623–628. [DOI] [PubMed] [Google Scholar]
- Tzourio‐Mazoyer N, Landeau B, Papathanassiou D, Crivello F, Etard O, Delcroix N, Mazoyer B, Joliot M (2002): Automated anatomical labeling of activations in SPM using a macroscopic anatomical parcellation of the MNI MRI single‐subject brain. Neuroimage 15:273–289. [DOI] [PubMed] [Google Scholar]
- van Beijsterveldt CE, Groen‐Blokhuis M, Hottenga JJ, Franić S, Hudziak JJ, Lamb D, Huppertz C, de Zeeuw E, Nivard M, Schutte N, Swagerman S, Glasner T, van Fulpen M, Brouwer C, Stroet T, Nowotny D, Ehli EA, Davies GE, Scheet P, Orlebeke JF, Kan KJ, Smit D, Dolan CV, Middeldorp CM, de Geus EJ, Bartels M, Boomsma DI (2013): The Young Netherlands Twin Register (YNTR): Longitudinal twin and family studies in over 70,000 children. Twin Res Hum Genet 16:252–267. [DOI] [PubMed] [Google Scholar]
- van Leeuwen M, Peper JS, van den Berg SM, Brouwer RM, Pol HEH, Kahn RS, Boomsma DI (2009): A genetic analysis of brain volumes and IQ in children. Intelligence 37:181–191. [Google Scholar]
- van Soelen ILC, Brouwer RM, van Leeuwen M, Kahn RS, Hulshoff Pol HE, Boomsma DI (2011): Heritability of verbal and performance intelligence in a longitudinal pediatric sample. Twin Res 14:119–128. [DOI] [PubMed] [Google Scholar]
- van Soelen ILC, Brouwer RM, van Baal GCM, Schnack HG, Peper JS, Collins DL, Evans A, Kahn RS, Boomsma DI, Hulshoff Pol (2012): Genetic influences on thinning of the cerebral cortex during development. NeuroImage 59:3871–3880. [DOI] [PubMed] [Google Scholar]
- van Soelen IL, Brouwer RM, van Baal GC, Schnack HG, Peper JS, Chen L, Kahn RS, Boomsma DI, Pol HE (2013): Heritability of volumetric brain changes and height in children entering puberty. Hum Brain Map 34:713–725. [DOI] [PMC free article] [PubMed] [Google Scholar]
- Wechsler D, Kort W, Compaan EL, Belichrodt N, Resing WCM, Schittekatte M, Bosmans M, Vermeir G, Verhaeghe P. 2002. Handleiding WISC‐IIInl [Manual WISC‐IIInl]. London: The Psychological Corporation Limited, Nederlands Insitiuut van Psychologen Dienstencentrum. [Google Scholar]
- Westlye LT, Walhovd KB, Dale AM, Espeseth T, Reinvang I, Raz N, Agartz I, Greve DN, Fischl B, Fjell AM (2009): Increased sensitivity to effects of normal aging and Alzheimer's disease on cortical thickness by adjustment for local variability in gray/white contrast: A multi‐sample MRI study. NeuroImage 47:1545–1557. [DOI] [PMC free article] [PubMed] [Google Scholar]
- Westlye LT, Walhovd KB, Dale AM, Bjørnerud A, Due‐Tønnessen P, Engvig A, Grydeland H, Tamnes CK, Østbye Y, Fjell AM (2010): Differentiating maturational and aging‐related changes of the cerebral cortex by use of thickness and signal intensity. NeuroImage 52:172–185. [DOI] [PubMed] [Google Scholar]
- Yang X, Liu P, Sun J, Wang G, Zeng F, Yuan K, Liu J, Dong M, von Deneen KM, Qin W, Tian J (2012): Impact of brain‐derived neurotrophic factor Val66Met polymorphism on cortical thickness and voxel‐based morphometry in healty chinese yound adults. PLoS One 7:e37777. [DOI] [PMC free article] [PubMed] [Google Scholar]
- Yoon U, Fahim C, Perusse D, Evans AC (2010): Lateralized genetic and environmental influences on human brain morphology of 8‐year‐old twins. Neuroimage 53:1117–1125. [DOI] [PMC free article] [PubMed] [Google Scholar]
Associated Data
This section collects any data citations, data availability statements, or supplementary materials included in this article.
Supplementary Materials
Supporting Information Figure
Supporting Information Table 1
Supporting Information Table 3
Supporting Information Table 3
Supporting Information Table 4