

Abstract
Neuronal plasticity is crucial for flexible interaction with a changing environment and its disruption is thought to contribute to psychiatric diseases like schizophrenia. High‐frequency repetitive transcranial magnetic stimulation (rTMS) is a noninvasive tool to increase local excitability of neurons and induce short‐time functional reorganization of cortical networks. While this has been shown for the motor system, little is known about the short‐term plasticity of networks for executive cognition in humans. We examined 12 healthy control subjects in a crossover study with fMRI after real and sham 5 Hz rTMS to the right dorsolateral prefrontal cortex (DLPFC). During scanning, subjects performed an n‐back working memory (WM) task and a flanker task engaging cognitive control. Reaction times during the n‐back task were significantly shorter after rTMS than after sham stimulation. RTMS compared with sham stimulation caused no activation changes at the stimulation site (right DLPFC) itself, but significantly increased connectivity within the WM network during n‐back and reduced activation in the anterior cingulate cortex during the flanker task. Reduced reaction times after real stimulation support an excitatory effect of high‐frequency rTMS. Our findings identified plastic changes in prefrontally connected networks downstream of the stimulation site as the substrate of this behavioral effect. Using a multimodal fMRI‐rTMS approach, we could demonstrate changes in cortical plasticity in humans during executive cognition. In further studies this approach could be used to study pharmacological, genetic and disease‐related alterations. Hum Brain Mapp 35:140–151, 2014. © 2012 Wiley Periodicals, Inc.
Keywords: plasticity, rTMS, fMRI, prefrontal cortex, working memory, interference control, connectivity
INTRODUCTION
Neuronal plasticity in the adult brain is required to adapt dynamically to changes in the environment or the internal milieu. It has been defined as “any experience dependent enduring change in neuronal or network properties either morphological or functional” [Donoghue et al., 1996]. Well‐studied examples for such plastic reorganization of the cortex are memory and learning [Martin and Morris, 2002], sensory loss [Fujii et al., 2009; Merabet and Pascual‐Leone, 2010], stroke [Rossini et al., 2003; Wang et al., 2010] or traumatic brain injury [Desmurget et al., 2007]. In the context of neuropsychiatric disease, plasticity of the prefrontal cortex is of particular interest, because it is thought to be central to the pathophysiology of various psychiatric disorders such as depression [Castren and Rantamaki, 2010; Lucassen et al., 2010], bipolar disorder [Kapczinski et al., 2008] and schizophrenia [Lewis, 2009]. As a treatment option targeting prefrontal plasticity, repetitive transcranial magnetic stimulation (rTMS) is already in use in depression [Frank et al., 2011] and being investigated for other psychiatric and neurologic disorders.
Despite this clinical and neuroscientific interest, not much is known about the neuronal mechanisms of prefrontal cortical plasticity. However, indirect evidence suggests that at least long‐term plasticity involves changes in distributed cortical networks. Regarding working memory (WM) functions, it could be shown that training of WM tasks over 5 weeks showed increased activation in frontal and parietal regions of the WM network [Olesen et al., 2004] and in addition that plasticity induced by training of WM tasks increased structural connectivity within the WM network [Takeuchi et al., 2010]. Furthermore, in children functional connectivity with the right dorsolateral prefrontal cortex (DLPFC) depended on brain‐derived neurotrophic factor (BDNF) genotype, a genetic variant that is thought to influence cortical plasticity [Thomason et al., 2009].
The most commonly used experimental strategy to directly study neuronal plasticity in the human brain involves the use of rTMS [Pascual‐Leone et al., 1998; Siebner and Rothwell, 2003]. Depending on the frequency of stimulation, inhibitory (with low frequencies of about 1 Hz) and excitatory (with frequencies of 5 Hz and greater) effects on neurons in the stimulated cortex have been observed [Lee et al., 2006]. These effects outlast the stimulation for several minutes up to 1 h [Peinemann et al., 2004] and are therefore thought to reflect changes in synaptic facilitation, most likely through mechanisms of long‐term potentiation in the case of high‐frequency rTMS and long‐term depression in the case of low frequency rTMS [Huerta and Volpe, 2009; Wang et al., 1996]. This is supported by findings of altered activation in brain regions outside the stimulated region after high‐frequency rTMS [Rounis et al., 2006; Siebner et al., 2001] and reports of increased connectivity of brain regions with the stimulated region that outlasted the stimulation itself [Rounis et al., 2005]. Although these studies were mainly directed on the motor system, there is some indirect evidence from behavioral studies which could show that high‐frequency rTMS has an excitatory effect also on the DLPFC by enhancing cognitive performance after stimulation [Hwang et al., 2010; Vanderhasselt et al., 2009]. To date, only few studies have measured the effects of experimentally induced prefrontal plasticity on activation of cognitive networks with a multimodal approach using rTMS and functional magnetic resonance imaging (fMRI). Li et al. 2011 found increased TMS‐specific effective connectivity between left DLPFC and anterior cingulate during administration of lamotrigine and several other studies using a concurrent TMS–fMRI protocol could show how stimulation of frontal eye‐fields specifically affects BOLD signal in retinotopic visual areas V1–V4. [Ruff et al., 2008, 2006, 2009]. Only one study employed an rTMS‐fMRI protocol together with an executive cognitive task [Rounis et al., 2006]. However, this study obtained increased reaction times in a cued response task, behavioral results differing from most previous work and did not explicitly measure connectivity of prefrontal activation with remote areas.
Aim of the Study
To study neuronal plasticity in prefrontal connectivity networks we designed a placebo‐controlled rTMS study with subsequent fMRI assays of key components of executive cognition. First, we used the n‐back task, a combined spatial WM task that maximally activates right DLPFC [Callicott et al., 2000]. Second, a flanker task was employed where ventrolateral and dorsolateral prefrontal activity interact with interference control and inhibition functions of the anterior cingulate cortex (ACC) [Bunge et al., 2002]. Finally, neural activity was studied at rest. The study aimed (a) to replicate behavioral findings of an excitatory effect of 5 Hz rTMS on the DLPFC, and (b) to reveal how induced short‐term plasticity in the right DLPFC impacts on activation in the executive cognition networks it participates in. Based on the evidence summarized above, we expected to see increased activation in prefronto‐parietal networks during the WM task and in the ACC during the flanker task as well as increased connectivity within the cognitive networks activated during WM load, interference control and inhibition.
METHODS
Subjects
Twelve healthy right‐handed subjects (10 females) participated in the study. Mean age was 22.6 (SD 6.4) years, all participants had high school education. Based on a screening interview [Markgraf, 1994] before the experiments, no subject had a history of psychiatric illness. Subjects gave written informed consent. The study was approved by the local ethics committee of the University of Heidelberg.
Experimental Design
Participants were examined twice in intervals of 1 week in a single‐blind cross‐over design with two sessions: real rTMS and sham rTMS. Session order was randomized. We performed rTMS offline in the anteroom of the scanner directly before the fMRI experiments. To keep the interval between rTMS and fMRI as short as possible, subjects were instructed to walk quickly and the transfer into the scanner was practiced before the first session.
Repetitive transcranial magnetic stimulation (RTMS)
RTMS was administered with a MagPro X100 stimulator (MagVenture, Farum, Denmark) and a standard figure‐of‐eight‐shaped coil with static fluid cooling (MFC‐B65). Before each session, subjects were asked to slightly contract their left first dorsal interosseal muscle (FDI). Individual active motor threshold (AMT) and the motor hotspot of activation in M1 was determined by applying single pulse stimuli over the right motor cortex, starting with an intensity of 30% of maximal stimulator output and increasing the power until 5 out of 10 stimulations resulted in a visible twitch of the FDI of the left hand [Rothwell et al., 1999]. Mean motor thresholds are listed in Table 1. The site of stimulation for minimal motor threshold, the so called “motor hot spot” was marked on a latex swimming cap. The site of stimulation for the DLPFC was determined 5 cm anteriorly of the motor hot spot on a parasagittal line and also marked [Pascual‐Leone et al., 1996].
Table 1.
Experimental parameters of rTMS and subsequent fMRI: means, standard deviations, P values (t‐test, two sided)
| Sham rTMS | Real rTMS | P | |
|---|---|---|---|
| Active motor threshold (%) | 44.5 (±4.2) | 45.3 (±3.6) | 0.064 |
| Latency rTMS—n‐back task (s) | 215.3 (±115.7) | 200.4 (±77.8) | 0.725 |
| Latency rTMS—resting state (s) | 507.8 (±119.8) | 482.7 (±77.6) | 0.545 |
| Latency rTMS—flanker task (s) | 777.6 (±123.3) | 753.5 (±77.9) | 0.555 |
The stimulation protocol was a slightly modified version (one cycle longer) of that used by Rizzo et al. 2004 and Rounis et al. 2006, optimized for increased excitability of the prefrontal cortex: seven 1 min trains of 5 Hz stimulation at 90% of the active motor threshold with intertrain intervals of 1 min, resulting in a total of 2,100 stimuli during 13 min. The TMS coil was positioned on the right DLPFC with the handle pointing posteriorly at an angle of 45° laterally to the sagittal line. Current direction was anterior–posterior.
Sham stimulation was administered in exactly the same way as described above, but after determination of the motor threshold, the coil was replaced with a specially designed sham coil (MCF‐P‐B65, MagVenture) that gives the same acoustic output as the original coil, but 80% less magnetic output.
Experimental Tasks
In the scanner, subjects completed first an n‐back WM task (4.3 min, 128 scans), then a resting‐state examination (4 min, 480 scans) and lastly a flanker task (10.2 min, 306 scans). Tasks were run one after the other with only very short verbal information in the interval about which task followed. Latencies from end of stimulation to the beginning of each task are listed in Table 1; see Figure 1 for the experimental design.
Figure 1.
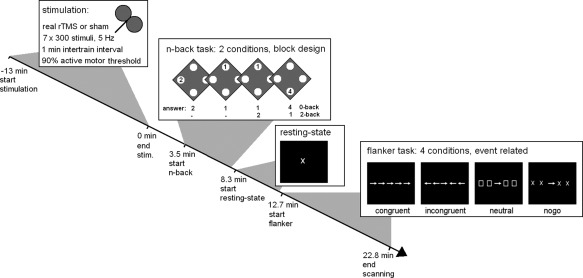
Experimental design of the study. Subjects first received either real or sham rTMS for 13 min and were then transferred to the scanner as quickly as possible where they performed an n‐back working memory task with two conditions alternating in a block design fashion: the 0‐back control condition and the 2‐back working memory condition. Directly subsequent they were scanned during rest when they just looked at a fixation cross. After that they performed a modified Eriksen flanker task with congruent, incongruent and neutral flankers as well as a no‐go condition. Times of task onsets and completion of scanning are means of all subjects and sessions.
n‐Back task
During the WM n‐back task [Callicott et al., 2000] subjects viewed a series of digits (1–4) presented sequentially for 500 ms with an interstimulus interval (ISI) of 1,500 ms on a screen via LCD goggles. The digits were located in the four corners of a diamond shape. In the 0‐back control condition, subjects had to press a button spatially corresponding to the digit presently seen. In the 2‐back WM condition they had to react to the digit seen two instances before the present digit. Four blocks of each condition were presented alternately in block design fashion. Each block lasted 30 sec, plus 1 sec indication of the condition. The whole task was presented in one run lasting 4.27 min or 128 scans. To minimize learning effects between the two sessions, subjects practiced this task before the first session until their performance did not improve between two runs of 20 2‐back trials.
Resting state
For resting‐state examination, subjects were asked to look at a fixation cross in the middle of a dark screen, relax and try not to concentrate on anything. Interviews directly after scanning showed that none of the subjects had slept during the resting condition.
Flanker task
Interference monitoring and response inhibition were examined with a modified version of the Eriksen flanker task [Bunge et al., 2002]. Trials were presented in four experimental conditions: “congruent,” where five arrows in a row all pointed in the same direction, “incongruent,” where the two flanking arrows pointed in the opposite direction from the central arrow, “neutral,” where the central arrow was flanked by two boxes on either side, and “no‐go” where two flanking crosses on each side indicated that the subjects had to withhold their response. Subjects were instructed to press a button corresponding to the direction of the central target arrow as fast and accurately as possible except in the “no‐go” condition. Each stimulus was presented for 800 ms with a variable ISI of 2,200 to 5,200 ms. During this interval, a fixation crosshair was presented. The order of stimulus presentations was pseudorandomly distributed across the session. A total of 145 stimuli (33 no‐go, 31 neutral, 40 incongruent, 41 congruent) was presented in an event‐related design. The whole task lasted 10.1 min or 302 scans.
Functional Imaging Parameters
BOLD fMRI was performed on a Siemens Trio 3T scanner. Scanning parameters were for the functional images during the n‐back and the flanker task: 28 4 mm slices, 1 mm gap, FOV 192 × 192 mm, TR 2 s, TE 30 ms, flip angle 80°. During resting state, in order to obtain more images per time for a better fit of the correlation analyses we used different scanning parameters: 12 5 mm slices, 3.5 mm gap, FOV 192 × 192 mm TR 0.5 s, TE 22 ms, flip angle 45°. After acquisition of the functional scans, an anatomical T1‐weighted three‐dimensional scan was obtained to record the localization of the stimulation site.
Functional Image Processing and Connectivity Analyses
Image processing and statistical analyses were conducted using statistical parametric mapping methods (SPM5; available at: http://www.fil.ion.ucl.ac.uk). Images were realigned to the first image, slice‐time corrected, and spatially normalized into a standard stereotactic space (MNI template) with 3 mm isotropic volume units (voxels) and smoothed with a 9 mm full width at half maximum (FWHM) Gaussian filter.
n‐Back task
First‐level analyses were done for each subject and each run separately using the general linear model (GLM) in a block design with task regressors for 0‐back (control) and 2‐back (experimental condition) as covariates of interest and realignment parameters as covariates of no interest. To identify activation changes in the WM network due to rTMS, we used contrast images of activation during 2‐back minus 0‐back in second‐level random effects paired t‐tests (sham vs. real rTMS).
The procedure for the functional connectivity analysis during the n‐back task was principally the same as described previously [Esslinger et al., 2011]. To avoid possible confounds of the influence of rTMS on localization of the seed voxel, we averaged the contrast images for 2‐back minus 0‐back after real and after sham rTMS and determined the maximally activated voxel in the right DLPFC (mask definition see below) in this average contrast image. To create seed time series, first eigenvariates of the time series from all voxels activated at P < 0.01 within a sphere of 6 mm around this maximally activated voxel were calculated for each run separately. We used seed regions that were functionally defined on the individual level instead of group means or anatomical seed regions to make sure that the seed region was part of each individual's WM network. For the same reason, we did not use stimulation site as seed region, because stimulation site was not determined functionally and distance between stimulation spot and location of maximum activation in the DLPFC was likely to differ between subjects. Using the subfunction spm_fcUtil of SPM5, task related variance was removed by subtracting the part of variance in the time series that could be explained by the task regressors of the model (in this case 0‐back and 2‐back). This approach has been used in several previous studies to derive seed regions for effective connectivity [Meyer‐Lindenberg et al., 2004; Pezawas et al., 2005; Stein et al., 2007]. To account for unspecific noise, first eigenvariates from masks covering cerebrospinal fluid (CSF) and white matter were extracted from the preprocessed data. Connectivity maps were generated for each subject and each run separately using SPM GLM with the seed region time series as covariate of interest and time series from CSF and white matter, as well as the movement parameters as covariates of no interest.
Resting state
During resting state, only seeded connectivity analyses were calculated. Seed regions were the same as described for connectivity analyses in the n‐back task: individual coordinates of maximal activation in the right DLPFC during the n‐back task. First eigenvariates of all voxels in a sphere of 6 mm around these coordinates were used as seed time series. As there was no task‐related activation, these time series were used unaltered in a GLM analysis with time series from CSF and white matter as well as the movement parameters as covariates of no interest as described above for the n‐back task. Second‐level analyses were likewise conducted as described for the n‐back task.
Flanker task
In the flanker task, onsets of the task regressors for activity analyses were set to stimulus onsets and first‐level GLM analyses were calculated for each individual and each run with regressors for the four conditions (congruent, incongruent, no‐go and neutral) as regressors of interest and the six movement parameters as covariates of no interest. Contrast images of incongruent versus congruent trials as a measure for interference control and no‐go versus neutral trials as a measure of inhibition were used in second‐level random effects analyses (paired t‐tests of rTMS vs. sham stimulation runs).
Statistical Inference
We did not expect that effects of rTMS would be significant on a whole‐brain corrected level. Therefore we predefined masks for regions of interest (ROI) for each task and for the activation and connectivity analyses. For each task, we used only one (combined) mask for activation analyses and one for connectivity analyses, which precluded the need of further correction for comparison within multiple regions. For analyses of differential activation during the n‐back task we defined combined right and left DLPFC and during the flanker task the ACC as ROIs. Because we had no predefined region for the network connected with the right DLPFC during the n‐back task and rest, we selected the empirical connectivity map during all sessions in the n‐back task as ROI for the analyses of differential connectivity with right DLPFC between rTMS and sham stimulation in the n‐back task and the resting state data (see below).
For statistical inference, significance threshold was set to P < 0.05, FWE (family wise error) corrected for multiple comparisons within the ROI. All anatomical masks were created a priori using anatomical labels (ACC) and Brodmann areas (BA) provided by the Wake Forest University PickAtlas (available at: http://www.fmri.wfubmc.edu/downloads). BA9 (without medial areas) and BA46 were used for creation of the DLPFC masks. All masks were smoothed with a 9 mm FWHM Gaussian kernel and thresholded at 0.5 to obtain smoother, contiguous masks of approximately the same size as the original PickAtlas masks. The empirical mask of the connectivity network with the right DLPFC was created by first calculating a random effects one‐sample t‐test with the connectivity maps generated during the n‐back task in both TMS conditions (generation of theses maps see Functional Image Processing and Connectivity Analyses). The resulting SPM‐T‐map was thresholded at P = 0.05, FWE‐corrected for the whole brain. Because the critical test, differential connectivity between rTMS and sham stimulation, is independent of this average connectivity across all subjects in both sessions, this procedure avoids circular inference. The mask of the ACC comprised 646 voxels, the combined DLPFC mask 1,172 voxels and the empirical mask of the connectivity network 15,546 voxels.
For correlation analyses between brain function and behavior, contrast estimates from first‐level GLM analyses of each subject were extracted for the voxel showing maximal differences between rTMS and sham stimulation in the group analysis. By selecting this single measure of activity or connectivity changes for each test a priori, we avoided the multiple testing problem otherwise inherent in fMRI analyses. Correlation analyses were performed using Pearsons' r, two‐tailed. Behavioral data were analyzed with repeated measures analysis of variance (ANOVA) with the factors rTMS condition (real/sham) and task (n‐back task: 2‐back/0‐back and flanker task: no‐go/neutral/incongruent/congruent for analysis of percentage of correct answers and neutral/incongruent/congruent for analysis of reaction times). All statistical analyses outside SPM were done using SPSS (version 19, SPSS, Inc).
RESULTS
Behavioral Results
n‐Back task
During the 0‐back condition, two subjects committed one error after sham stimulation and three subjects committed one error after rTMS. There were no missed trials in the 0‐back condition. During 2‐back, subjects made on average 4.6 errors (SD 6.8) and omitted 3.9 trials (SD 3.1) after sham stimulation and made 3.9 errors (SD 4.8) and omitted 4.8 (SD 4.9) trials after rTMS. Rates of correct answers and reaction times are listed in Table 2. There was a significant main effect of task (F (1,11) = 12.9, P = 0.004) with more correct answers in the 0‐back task. No significant influence of rTMS on percentage of correct answers in the n‐back task could be detected. For reaction times (Fig. 2), again, there was a significant main effect of task with faster reaction times during the 2‐back task (F (1,11) = 31.7, P = 1.5E‐4), but also a main effect of rTMS with faster reaction times after rTMS than after sham stimulation (F (1,11) = 13.7, P = 0.004) and an interaction between rTMS condition and task with more improvement after rTMS in the 2‐back condition than in the 0‐back condition (F (1,11) = 6.0; P = 0.032).
Table 2.
Behavioral data during the two tasks: n‐back task and flanker task: means and standard deviations
| n‐Back | Reaction times (ms) | Correct answers (%) | |||||
|---|---|---|---|---|---|---|---|
| 0‐Back | 2‐Back | 0‐Back | 2‐Back | ||||
| Sham rTMS | 506.6 (±145. 6) | 381.4 (±169.6) | 99.5 (±0.8) | 82.3 (±5.5) | |||
| Real rTMS | 489.9 (±119.8) | 288.3 (±196.0) | 99.7 (±0.7) | 81.9 (±5.4) | |||
| Flanker task | Reaction times (ms) | Neutral | Correct answers (%) | Neutral | No‐go | ||
| Congruent | Incongruent | Congruent | Incongruent | ||||
| Sham rTMS | 529.1 (±60.2) | 590.8 (±66.8) | 550.2 (±62.0) | 100 | 98.8 (±2.0) | 100 | 95.5 (±4.7) |
| Real rTMS | 520 (±49.2) | 579 (±52.9) | 545.3 (±52.6) | 100 | 99.2 (±1.6) | 100 | 94.9 (±6.9) |
Figure 2.
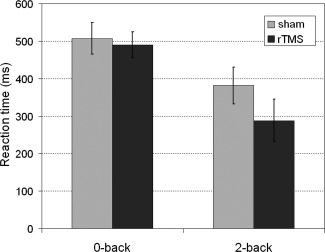
Reaction times during the n‐back task: 0‐back (control) and 2‐back (working memory) condition. Grey = after sham stimulation, black = after rTMS. Means and standard errors.
Flanker task
Subjects committed no errors or omissions during the congruent condition and very few during the incongruent condition (in the sham condition, three subjects missed a trial and in the rTMS condition one subject; in both conditions one subject made one and one subject made two errors). In the nogo condition, subjects answered on average 0.75 times with the congruent direction (SD 0.75) and also 0.75 times with the incongruent direction (SD 0.97) after sham stimulation. In the rTMS condition the corresponding numbers were 0.83 (SD 1.03) and 0.83 (SD 1.47). Rates of correct answers and reaction times are listed in Table 2. Only the main effect of task on percentage of correct answers (F (1,11) = 19.01, P = 2.4E‐7) and on reaction times (F (1,11) = 81.00, P = 7.1E‐11) was significant, but not the effect of rTMS.
FMRI Results—n‐Back Task
Activation
There were no differences in activation during n‐back after the two rTMS conditions in the whole‐brain analyses or ROI analysis in bilateral DLPFC.
Connectivity
When comparing connectivity with the right DLPFC after rTMS with the sham condition in a ROI analysis within the empirical mask of connectivity during the n‐back task, there was significantly increased connectivity with right DLPFC after real rTMS compared with sham stimulation in the ipsilateral superior parietal lobule, maximum at [27 −63 51], T max = 8.50, P (FWE‐corrected) = 0.028. There were no voxels with significantly greater connectivity with the right DLPFC after sham stimulation than after real rTMS. No additional regions of altered coupling were found in a whole‐brain analysis.
FMRI Results—Resting State
During resting state, there were no significant differences in connectivity with the right DLPFC between rTMS and sham stimulation within the empirical mask of connectivity during the n‐back task. Therefore, we conducted a whole‐brain analysis which showed an increase of functional connectivity after rTMS compared with sham stimulation between right DLPFC and right caudate head (see Fig. 3, MNI coordinates [12 9 9], T max = 9.89, P (FWE‐corrected) = 0.022).
Figure 3.
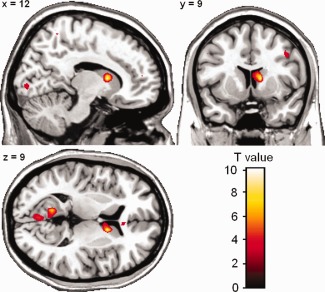
Functional connectivity of right DLPFC during rest. For display all activation is thresholded at P < 0.005, uncorrected, clusters with a minimum of 20 contiguous voxels. [Color figure can be viewed in the online issue, which is available at http://wileyonlinelibrary.com.]
FMRI Results—Flanker Task
Interference control: Incongruent > congruent trials
There was significantly less activation after real rTMS compared with sham stimulation in the ACC (coordinates of maximally activated voxel = [9 30 24], T max = 5.79, P (FWE‐corrected) = 0.039). Post hoc analyses of activation after sham and real stimulation separately revealed that the difference was due to decreased activation after real rTMS. The cluster of decreased activation largely overlapped with the cluster activated during the sham condition (see Fig. 4).
Figure 4.
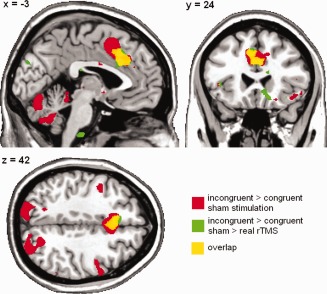
Reduction of activation during the flanker task after rTMS (green areas) overlaid on activation during the flanker task after sham stimulation (red areas). Overlay = yellow areas. For display all activation is thresholded at P < 0.005, uncorrected, clusters with a minimum of 20 contiguous voxels. [Color figure can be viewed in the online issue, which is available at http://wileyonlinelibrary.com.]
Inhibition: No‐go > neutral trials
In the contrast of no‐go > neutral trials, there were no significant differences in activation between the two stimulation conditions. Neither in the whole‐brain analysis, nor in the analysis restricted to the ACC mask did activation differences surpass the threshold for correction for multiple testing.
Correlation of brain activation and connectivity with behavioral data
To study whether changes in brain activation or connectivity due to rTMS were correlated with alteration of performance during the n‐back and the flanker tasks, correlation analyses between differences in brain activation or connectivity in voxels that showed a significant difference and changes in performance after rTMS compared with sham stimulation were calculated. As some connectivity and some behavioral measures correlated with age, partial correlations were calculated with age as covariate. There was a trend toward correlation between connectivity change in the right superior parietal lobule during the n‐back task and reduced reaction times during the 0‐back control condition (r = −0.561, P = 0.071, see Fig. 5). Other measures of activation or connectivity changes did not correlate with changes in task performance.
Figure 5.
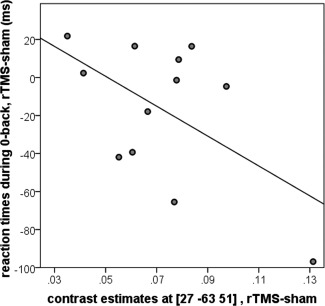
Correlation of the increase in connectivity between right dorsolateral prefrontal cortex (DLPFC) and right superior parietal lobule during the n‐back task and decrease in reaction times during the 0‐back trials after real compared with sham rTMS.
DISCUSSION
The main aim of this study was to determine whether plasticity could be induced and monitored in the DLPFC using rTMS at a frequency of 5 Hz and fMRI as a functional readout. Several findings of this study suggest that plasticity was indeed induced: first, on the behavioral level, subjects reacted significantly faster only during the WM (2‐back) condition after rTMS. In this task, faster reaction times (at constant accuracy) are associated with more effective cognitive processing [Krieger et al., 2005]. This behavioral specificity of the effect only for WM argues in favor of changes induced in the DLPFC, the core brain region supporting WM during the n‐back task [Callicott et al., 1999; Manoach et al., 1997], being responsible for this decrease in reaction times. It is interesting to note that there was no increase in accuracy of task performance although with an average of 82% correct answers in the 2‐back condition there should have been no ceiling effect. Rounis et al. also found a specific effect on reaction times in the invalid condition of a Posner task, and not on the error rate, but in their study, the reaction times slowed down after real rTMS [Rounis et al., 2006]. As the rTMS protocol was virtually the same, only one train of 1 min stimulation longer, the most probable explanation for this inconsistency is that in the Posner task, where the cue precedes the target, a more successful WM maintenance, mediated by a more active DLPFC, could enhance the negative impact of the inconsistent cue on reaction times [MacDonald et al., 2000; Rosen et al., 1999; Vanderhasselt et al., 2010]. In the n‐back WM task, where there is no such conflict, faster processing within the DLPFC could instead translate to faster reaction times because subjects know in advance if they are maintaining the information about the two preceding numerals correctly, which button they need to press next.
The fMRI data further support and specify the induction of neuronal plasticity in DLPFC. Given previous convergent experience [Rounis et al., 2006], we were not surprised that no change in activation was seen at the site of stimulation at the right DLPFC, especially as we were using subthreshold rTMS. Bestmann et al. 2005 found an increase in premotor BOLD signal at the site of stimulation with an interleaved rTMS fMRI protocol only with suprathreshold stimulation and not with stimulation at 90% AMT. Another explanation for the lack of local BOLD signal increase after rTMS might be that there is no differential increase between experimental and control condition during active tasks which is what is measured with fMRI [Stagg et al., 2010].
Where we did see an effect of rTMS on BOLD during the n‐back task was downstream of the DLPFC stimulation site, in the functional coupling of the stimulated area with the ipsilateral superior parietal lobule, a region functionally connected with the right DLPFC during WM [Cole and Schneider, 2007; Oliveri et al., 2001; Schlosser et al., 2006]. Our findings admit the interpretation that LTP‐like changes induced in a region will increase synchronization between two functionally connected regions rather than simply increase activation in the stimulated area. An increase in functional connectivity after synaptic plasticity induction at the site of stimulation has been seen in a previous study [Rounis et al., 2005], although in this case with the sensorimotor hand area using positron emission tomography and psychophysiological interaction. Importantly, disturbed connectivity between DLPFC and the parietal cortex has been implicated as a consequence of DLPFC dysfunction in schizophrenia [Tan et al., 2007] and linked to impaired performance and genetic risk for the disorder [Tan et al., 2009]. Conversely, increased connectivity between these areas has been nominated as a compensatory strategy [Tan et al., 2007], indicating that both the system impacted by DLPFC rTMS in the present study and the directionality of downstream changes found support investigation of this method in schizophrenia.
The fact that we saw a trend toward correlation of this increased connectivity between right DLPFC and parietal cortex and reaction times in the 0‐back task only implies that these plastic changes have an influence on processing speed. It also suggests that additional factors contribute to the increase in behavioral efficiency during the 2‐back trials. Such changes might include connections with areas other than the peak activation in the right DLPFC that was targeted with our connectivity method or connections showing different temporal dynamics [Sakoglu et al., 2010].
Further indicating cognitive‐regional specificity of the rTMS‐induced plasticity, during resting state we did not find significant changes in connectivity of the DLPFC with areas of the WM network, as defined by the connectivity map with right DLPFC during the n‐back task. However, we did observe increased connectivity with the right caudate after rTMS compared with sham. Several studies have reported strong correlations of dorsal caudate activity with lateral and medial prefrontal areas during resting state [Barnes et al., 2010; Di Martino et al., 2008]. Taken together with the observations during the n‐back task, this further supports the proposal that rTMS‐induced plasticity enhances downstream functional coupling of DLPFC with regions coactivated during the specific cognitive state studied.
During the flanker task, which started on average 13.0 min after the stimulation, we found reduced activation in the core region for interference control, the ACC [Botvinick et al., 2001], after real compared with sham stimulation. Convergent data indicate that ACC and DLPFC are active in a “conflict‐control‐loop” during interference control, where ACC monitors for conflicts and DLPFC exerts cognitive control and resolves the conflict [Carter and van Veen, 2007]. Our data might therefore be interpreted as a reduced demand on the conflict monitoring in the ACC in the context of an rTMS‐induced increase in DLPFC efficiency, because DLPFC activation without coactivation of the ACC now seems to be sufficient for task performance with equal speed and precision as in the sham condition. In agreement with this interpretation is a finding by Erickson et al. They found a decrease of activation for the ACC and an increase for the DLPFC over time during an interference control task (Stroop) and interpreted this finding as a consequence of increased experience with the task and better cognitive control [Erickson et al., 2004]. This interpretation is further supported by our observation that functional connectivity between ACC and left DLPFC decreased specifically during the incongruent trials after rTMS. This corresponds well with the “conflict‐control‐loop” model mentioned above, because information flows between these structures if conflict monitoring is invoked. This interpretation also predicts that increased coupling between DLPFC and ACC in the incongruent trials should be correlated positively with increased reaction times, as we in fact observed. As in the case of the changes found during the n‐back task, disturbed interactions between ACC and DLPFC are prominent in schizophrenia [Becker et al., 2008; Kerns et al., 2005; Snitz et al., 2005], again indicating that task‐relevant systems implicated in disease risk can be accessed through prefrontal rTMS.
This study has several limitations. Because the sample size of 12 subjects was rather small and consisted mainly of female subjects, who might differ from males in respect of cortical connectivity [Westerhausen et al., 2011], and subjects of a certain age group, we would be careful to generalize the results to the whole population. Nonetheless, despite the limited sample size, we found strong effects that passed conservative correction for multiple testing within a priori regions of interest after additional correction for multiple regions, where applicable. Nonetheless, while robust, these findings should be interpreted with caution till replicated in an independent sample. The relatively small sample size also precluded randomization of task sequence across subjects, which would have permitted the additional investigation of task by stimulation interactions. As a consequence, the flanker task was performed on average from 12.7 to 22.8 min after the end of stimulation. There are no studies on the duration of after effects of 5 Hz rTMS on the prefrontal cortex, but studies of stimulation of the motor system suggest that these effects can last up to 15 min depending on the site of stimulation: Rizzo et al. 2004 observed increased motor‐evoked potentials (MEPs) until 1 h after applying the same rTMS protocol as we used in this study, only two trains shorter, to the premotor cortex. Two other studies found increased MEPs up to 15 min after stimulation [Rothkegel et al., 2010] and immediately but not 20 min after stimulation of the primary motor cortex with a similar protocol [Zafar et al., 2008]. Our findings of effects of TMS on activity in the ACC and ACC‐prefrontal connectivity during 12 to 23 min after rTMS strengthen the idea that facilitatory after effects have a similar duration after stimulation of the prefrontal cortex. Because of the lack of randomization of task sequence, no comparisons of rTMS effects on the different cognitive domains could be made, neither could we draw conclusions about the temporal dynamic of the effects on the different cognitive domains. This was not the main interest of this study and will be an interesting subject of further studies.
RTMS was performed without exact functional or anatomic localizer. The rule of defining the DLPFC as being located 5 cm anterior of the motor hot spot has been proven effective in rTMS imaging studies [Rounis et al., 2006] and has been extensively used in clinical studies [Brighina et al., 2004; Dang et al., 2007; Pascual‐Leone et al., 1996]. Nevertheless, given the marked anatomical and functional variability of the prefrontal cortex and the fact that neuronavigated rTMS has proven to be more efficient in a study on the therapeutic effect on depression [Fitzgerald et al., 2009], this method might have been suboptimal and the use of functional neuronavigation might have yielded clearer results. Future studies using neuronavigated rTMS on the prefrontal cortex are needed to elucidate the impact of the exact stimulation location on plasticity of cognitive brain systems. Because our TMS equipment was not MR compatible, subjects had to walk into the scanner room and lie down on the scanner table between stimulation and fMRI measurement. As physical activity has been shown to interact with theta burst stimulation [Huang et al., 2008], we cannot exclude that this exercise might also have had an impact on the effects of rTMS in our study, even though we measured activation and connectivity in cognitive and not in motor networks. Since this effect would have been present in sham stimulation as well, it might have attenuated the extent of findings we report. The mode of sham stimulation with only the acoustic impression of rTMS but very reduced local stimulation might have rendered some subjects in the second session conscious as to which treatment they received. This is a problem with most placebo‐controlled TMS studies. Although it is unlikely that this knowledge will have produced the reported results, we can not fully preclude this.
CONCLUSIONS
To conclude, in this combined rTMS fMRI study we identified systems‐level signatures of induced lateral prefrontal neuronal plasticity in the connectivity and activity of task‐specific neural networks. The networks are downstream of, and regulated by the DLPFC, and are critically involved in the pathophysiology of schizophrenia, indicating a potential utility of the methodology to study, and perhaps even modulate, cognitive dysfunction in this disorder. To further elucidate the molecular and genetic mechanisms through which these plastic changes in cortical networks are mediated, future studies using N‐methyl‐d‐aspartic acid (NMDA) receptor blocking agents are planned.
REFERENCES
- Barnes KA, Cohen AL, Power JD, Nelson SM, Dosenbach YB, Miezin FM, Petersen SE, Schlaggar BL (2010): Identifying basal ganglia divisions in individuals using resting‐state functional connectivity MRI. Front Syst Neurosci 4:18. [DOI] [PMC free article] [PubMed] [Google Scholar]
- Becker TM, Kerns JG, Macdonald AW III, Carter CS (2008): Prefrontal dysfunction in first‐degree relatives of schizophrenia patients during a Stroop task. Neuropsychopharmacology 33:2619–2625. [DOI] [PubMed] [Google Scholar]
- Bestmann S, Baudewig J, Siebner HR, Rothwell JC, Frahm J (2005): BOLD MRI responses to repetitive TMS over human dorsal premotor cortex. Neuroimage 28:22–29. [DOI] [PubMed] [Google Scholar]
- Botvinick MM, Braver TS, Barch DM, Carter CS, Cohen JD (2001): Conflict monitoring and cognitive control. Psychol Rev 108:624–652. [DOI] [PubMed] [Google Scholar]
- Brighina F, Piazza A, Vitello G, Aloisio A, Palermo A, Daniele O, Fierro B (2004): rTMS of the prefrontal cortex in the treatment of chronic migraine: A pilot study. J Neurol Sci 227:67–71. [DOI] [PubMed] [Google Scholar]
- Bunge SA, Dudukovic NM, Thomason ME, Vaidya CJ, Gabrieli JD (2002): Immature frontal lobe contributions to cognitive control in children: Evidence from fMRI. Neuron 33:301–311. [DOI] [PMC free article] [PubMed] [Google Scholar]
- Callicott JH, Bertolino A, Mattay VS, Langheim FJ, Duyn J, Coppola R, Goldberg TE, Weinberger DR (2000): Physiological dysfunction of the dorsolateral prefrontal cortex in schizophrenia revisited. Cereb Cortex 10:1078–1092. [DOI] [PubMed] [Google Scholar]
- Callicott JH, Mattay VS, Bertolino A, Finn K, Coppola R, Frank JA, Goldberg TE, Weinberger DR (1999): Physiological characteristics of capacity constraints in working memory as revealed by functional MRI. Cereb Cortex 9:20–26. [DOI] [PubMed] [Google Scholar]
- Carter CS, van Veen V (2007): Anterior cingulate cortex and conflict detection: An update of theory and data. Cogn Affect Behav Neurosci 7:367–379. [DOI] [PubMed] [Google Scholar]
- Castren E, Rantamaki T (2010): The role of BDNF and its receptors in depression and antidepressant drug action: Reactivation of developmental plasticity. Dev Neurobiol 70:289–297. [DOI] [PubMed] [Google Scholar]
- Cole MW, Schneider W (2007): The cognitive control network: Integrated cortical regions with dissociable functions. Neuroimage 37:343–360. [DOI] [PubMed] [Google Scholar]
- Dang T, Avery DH, Russo J (2007): Within‐session mood changes from TMS in depressed patients. J Neuropsychiatry Clin Neurosci 19:458–463. [DOI] [PubMed] [Google Scholar]
- Desmurget M, Bonnetblanc F, Duffau H (2007): Contrasting acute and slow‐growing lesions: A new door to brain plasticity. Brain 130:898–914. [DOI] [PubMed] [Google Scholar]
- Di Martino A, Scheres A, Margulies DS, Kelly AM, Uddin LQ, Shehzad Z, Biswal B, Walters JR, Castellanos FX, Milham MP (2008): Functional connectivity of human striatum: A resting state FMRI study. Cereb Cortex 18:2735–2747. [DOI] [PubMed] [Google Scholar]
- Donoghue JP, Hess G, Sanes JN (1996): Substrates and mechanisms for learning in motor cortex In: Bloedel J, Ebner T, Wise SP, editors. Acquisition of Motor Behavior in Vertebrates.Cambridge, MA:MIT Press; pp363–386. [Google Scholar]
- Erickson KI, Milham MP, Colcombe SJ, Kramer AF, Banich MT, Webb A, Cohen NJ (2004): Behavioral conflict, anterior cingulate cortex, and experiment duration: Implications of diverging data. Hum Brain Mapp 21:98–107. [DOI] [PMC free article] [PubMed] [Google Scholar]
- Esslinger C, Kirsch P, Haddad L, Mier D, Sauer C, Erk S, Schnell K, Arnold C, Witt SH, Rietschel M, Cichon S, Walter H, Meyer‐Lindenberg A (2011): Cognitive state and connectivity effects of the genome‐wide significant psychosis variant in ZNF804A. Neuroimage 54:2514–2523. [DOI] [PubMed] [Google Scholar]
- Fitzgerald PB, Hoy K, McQueen S, Maller JJ, Herring S, Segrave R, Bailey M, Been G, Kulkarni J, Daskalakis ZJ (2009): A randomized trial of rTMS targeted with MRI based neuro‐navigation in treatment‐resistant depression. Neuropsychopharmacology 34:1255–1262. [DOI] [PubMed] [Google Scholar]
- Frank E, Eichhammer P, Burger J, Zowe M, Landgrebe M, Hajak G, Langguth B (2011): Transcranial magnetic stimulation for the treatment of depression: Feasibility and results under naturalistic conditions: A retrospective analysis. Eur Arch Psychiatry Clin Neurosci 261:261–266. [DOI] [PubMed] [Google Scholar]
- Fujii T, Tanabe HC, Kochiyama T, Sadato N (2009): An investigation of cross‐modal plasticity of effective connectivity in the blind by dynamic causal modeling of functional MRI data. Neurosci Res 65:175–186. [DOI] [PubMed] [Google Scholar]
- Huang YZ, Rothwell JC, Edwards MJ, Chen RS (2008): Effect of physiological activity on an NMDA‐dependent form of cortical plasticity in human. Cereb Cortex 18:563–570. [DOI] [PubMed] [Google Scholar]
- Huerta PT, Volpe BT (2009): Transcranial magnetic stimulation, synaptic plasticity and network oscillations. J Neuroeng Rehabil 6:7. [DOI] [PMC free article] [PubMed] [Google Scholar]
- Hwang JH, Kim SH, Park CS, Bang SA, Kim SE (2010): Acute high‐frequency rTMS of the left dorsolateral prefrontal cortex and attentional control in healthy young men. Brain Res 1329:152–158. [DOI] [PubMed] [Google Scholar]
- Kapczinski F, Frey BN, Kauer‐Sant'Anna M, Grassi‐Oliveira R (2008): Brain‐derived neurotrophic factor and neuroplasticity in bipolar disorder. Expert Rev Neurother 8:1101–1113. [DOI] [PubMed] [Google Scholar]
- Kerns JG, Cohen JD, MacDonald AW III, Johnson MK, Stenger VA, Aizenstein H, Carter CS (2005): Decreased conflict‐ and error‐related activity in the anterior cingulate cortex in subjects with schizophrenia. Am J Psychiatry 162:1833–1839. [DOI] [PubMed] [Google Scholar]
- Krieger S, Lis S, Janik H, Cetin T, Gallhofer B, Meyer‐Lindenberg A (2005): Executive function and cognitive subprocesses in first‐episode, drug‐naive schizophrenia: An analysis of N‐back performance. Am J Psychiatry 162:1206–1208. [DOI] [PubMed] [Google Scholar]
- Lee L, Siebner H, Bestmann S (2006): Rapid modulation of distributed brain activity by transcranial magnetic stimulation of human motor cortex. Behav Neurol 17:135–148. [DOI] [PMC free article] [PubMed] [Google Scholar]
- Lewis DA (2009): Neuroplasticity of excitatory and inhibitory cortical circuits in schizophrenia. Dialogues Clin Neurosci 11:269–280. [DOI] [PMC free article] [PubMed] [Google Scholar]
- Li X, Large CH, Ricci R, Taylor JJ, Nahas Z, Bohning DE, Morgan P, George MS (2011): Using interleaved transcranial magnetic stimulation/functional magnetic resonance imaging (fMRI) and dynamic causal modeling to understand the discrete circuit specific changes of medications: Lamotrigine and valproic acid changes in motor or prefrontal effective connectivity. Psychiatry Res 194:141–148. [DOI] [PubMed] [Google Scholar]
- Lucassen PJ, Meerlo P, Naylor AS, van Dam AM, Dayer AG, Fuchs E, Oomen CA, Czeh B (2010): Regulation of adult neurogenesis by stress, sleep disruption, exercise and inflammation: Implications for depression and antidepressant action. Eur Neuropsychopharmacol 20:1–17. [DOI] [PubMed] [Google Scholar]
- MacDonald AW III, Cohen JD, Stenger VA, Carter CS (2000): Dissociating the role of the dorsolateral prefrontal and anterior cingulate cortex in cognitive control. Science 288:1835–1838. [DOI] [PubMed] [Google Scholar]
- Manoach DS, Schlaug G, Siewert B, Darby DG, Bly BM, Benfield A, Edelman RR, Warach S (1997): Prefrontal cortex fMRI signal changes are correlated with working memory load. Neuroreport 8:545–549. [DOI] [PubMed] [Google Scholar]
- Markgraf J (1994): Diagnostisches Kurzinterview bei psychischen Störungen [Diagnostic Interview for Mental Disorders] (Mini‐DIPS).Berlin:Springer. [Google Scholar]
- Martin SJ, Morris RG (2002): New life in an old idea: The synaptic plasticity and memory hypothesis revisited. Hippocampus 12:609–636. [DOI] [PubMed] [Google Scholar]
- Merabet LB, Pascual‐Leone A (2010): Neural reorganization following sensory loss: The opportunity of change. Nat Rev Neurosci 11:44–52. [DOI] [PMC free article] [PubMed] [Google Scholar]
- Meyer‐Lindenberg A, Kohn P, Mervis CB, Kippenhan JS, Olsen RK, Morris CA, Berman KF (2004): Neural basis of genetically determined visuospatial construction deficit in Williams syndrome. Neuron 43:623–631. [DOI] [PubMed] [Google Scholar]
- Olesen PJ, Westerberg H, Klingberg T (2004): Increased prefrontal and parietal activity after training of working memory. Nat Neurosci 7:75–79. [DOI] [PubMed] [Google Scholar]
- Oliveri M, Turriziani P, Carlesimo GA, Koch G, Tomaiuolo F, Panella M, Caltagirone C (2001): Parieto‐frontal interactions in visual‐object and visual‐spatial working memory: Evidence from transcranial magnetic stimulation. Cereb Cortex 11:606–618. [DOI] [PubMed] [Google Scholar]
- Pascual‐Leone A, Rubio B, Pallardo F, Catala MD (1996): Rapid‐rate transcranial magnetic stimulation of left dorsolateral prefrontal cortex in drug‐resistant depression. Lancet 348:233–237. [DOI] [PubMed] [Google Scholar]
- Pascual‐Leone A, Tormos JM, Keenan J, Tarazona F, Canete C, Catala MD (1998): Study and modulation of human cortical excitability with transcranial magnetic stimulation. J Clin Neurophysiol 15:333–343. [DOI] [PubMed] [Google Scholar]
- Peinemann A, Reimer B, Loer C, Quartarone A, Munchau A, Conrad B, Siebner HR (2004): Long‐lasting increase in corticospinal excitability after 1800 pulses of subthreshold 5 Hz repetitive TMS to the primary motor cortex. Clin Neurophysiol 115:1519–1526. [DOI] [PubMed] [Google Scholar]
- Pezawas L, Meyer‐Lindenberg A, Drabant EM, Verchinski BA, Munoz KE, Kolachana BS, Egan MF, Mattay VS, Hariri AR, Weinberger DR (2005): 5‐HTTLPR polymorphism impacts human cingulate‐amygdala interactions: A genetic susceptibility mechanism for depression. Nat Neurosci 8:828–834. [DOI] [PubMed] [Google Scholar]
- Rizzo V, Siebner HR, Modugno N, Pesenti A, Munchau A, Gerschlager W, Webb RM, Rothwell JC (2004): Shaping the excitability of human motor cortex with premotor rTMS. J Physiol 554:483–495. [DOI] [PMC free article] [PubMed] [Google Scholar]
- Rosen AC, Rao SM, Caffarra P, Scaglioni A, Bobholz JA, Woodley SJ, Hammeke TA, Cunningham JM, Prieto TE, Binder JR (1999): Neural basis of endogenous and exogenous spatial orienting. A functional MRI study. J Cogn Neurosci 11:135–152. [DOI] [PubMed] [Google Scholar]
- Rossini PM, Calautti C, Pauri F, Baron JC (2003): Post‐stroke plastic reorganisation in the adult brain. Lancet Neurol 2:493–502. [DOI] [PubMed] [Google Scholar]
- Rothkegel H, Sommer M, Paulus W (2010): Breaks during 5Hz rTMS are essential for facilitatory after effects. Clin Neurophysiol 121:426–430. [DOI] [PubMed] [Google Scholar]
- Rothwell JC, Hallett M, Berardelli A, Eisen A, Rossini P, Paulus W (1999): Magnetic stimulation: Motor evoked potentials. The International Federation of Clinical Neurophysiology. Electroencephalogr Clin Neurophysiol Suppl 52:97–103. [PubMed] [Google Scholar]
- Rounis E, Lee L, Siebner HR, Rowe JB, Friston KJ, Rothwell JC, Frackowiak RS (2005): Frequency specific changes in regional cerebral blood flow and motor system connectivity following rTMS to the primary motor cortex. Neuroimage 26:164–176. [DOI] [PubMed] [Google Scholar]
- Rounis E, Stephan KE, Lee L, Siebner HR, Pesenti A, Friston KJ, Rothwell JC, Frackowiak RS (2006): Acute changes in frontoparietal activity after repetitive transcranial magnetic stimulation over the dorsolateral prefrontal cortex in a cued reaction time task. J Neurosci 26:9629–9638. [DOI] [PMC free article] [PubMed] [Google Scholar]
- Ruff CC, Bestmann S, Blankenburg F, Bjoertomt O, Josephs O, Weiskopf N, Deichmann R, Driver J (2008): Distinct causal influences of parietal versus frontal areas on human visual cortex: evidence from concurrent TMS‐fMRI. Cereb Cortex 18:817–827. [DOI] [PMC free article] [PubMed] [Google Scholar]
- Ruff CC, Blankenburg F, Bjoertomt O, Bestmann S, Freeman E, Haynes JD, Rees G, Josephs O, Deichmann R, Driver J (2006): Concurrent TMS‐fMRI and psychophysics reveal frontal influences on human retinotopic visual cortex. Curr Biol 16:1479–1488. [DOI] [PubMed] [Google Scholar]
- Ruff CC, Blankenburg F, Bjoertomt O, Bestmann S, Weiskopf N, Driver J (2009): Hemispheric differences in frontal and parietal influences on human occipital cortex: Direct confirmation with concurrent TMS‐fMRI. J Cogn Neurosci 21:1146–1161. [DOI] [PMC free article] [PubMed] [Google Scholar]
- Sakoglu U, Pearlson GD, Kiehl KA, Wang YM, Michael AM, Calhoun VD (2010): A method for evaluating dynamic functional network connectivity and task‐modulation: Application to schizophrenia. Magma 23:351–366. [DOI] [PMC free article] [PubMed] [Google Scholar]
- Schlosser RG, Wagner G, Sauer H (2006): Assessing the working memory network: Studies with functional magnetic resonance imaging and structural equation modeling. Neuroscience 139:91–103. [DOI] [PubMed] [Google Scholar]
- Siebner H, Peller M, Bartenstein P, Willoch F, Rossmeier C, Schwaiger M, Conrad B (2001): Activation of frontal premotor areas during suprathreshold transcranial magnetic stimulation of the left primary sensorimotor cortex: A glucose metabolic PET study. Hum Brain Mapp 12:157–167. [DOI] [PMC free article] [PubMed] [Google Scholar]
- Siebner HR, Rothwell J (2003): Transcranial magnetic stimulation: New insights into representational cortical plasticity. Exp Brain Res 148:1–16. [DOI] [PubMed] [Google Scholar]
- Snitz BE, MacDonald A III, Cohen JD, Cho RY, Becker T, Carter CS (2005): Lateral and medial hypofrontality in first‐episode schizophrenia: Functional activity in a medication‐naive state and effects of short‐term atypical antipsychotic treatment. Am J Psychiatry 162:2322–2329. [DOI] [PubMed] [Google Scholar]
- Stagg CJ, O'Shea J, Johansen‐Berg H (2010): Imaging the effects of rTMS‐induced cortical plasticity. Restor Neurol Neurosci 28:425–436. [DOI] [PubMed] [Google Scholar]
- Stein JL, Wiedholz LM, Bassett DS, Weinberger DR, Zink CF, Mattay VS, Meyer‐Lindenberg A (2007): A validated network of effective amygdala connectivity. Neuroimage 36:736–745. [DOI] [PubMed] [Google Scholar]
- Takeuchi H, Sekiguchi A, Taki Y, Yokoyama S, Yomogida Y, Komuro N, Yamanouchi T, Suzuki S, Kawashima R (2010): Training of working memory impacts structural connectivity. J Neurosci 30:3297–3303. [DOI] [PMC free article] [PubMed] [Google Scholar]
- Tan HY, Callicott JH, Weinberger DR (2007): Dysfunctional and compensatory prefrontal cortical systems, genes and the pathogenesis of schizophrenia. Cereb Cortex 17(Suppl 1):i171–i181. [DOI] [PubMed] [Google Scholar]
- Tan HY, Callicott JH, Weinberger DR (2009): Prefrontal cognitive systems in schizophrenia: Towards human genetic brain mechanisms. Cogn Neuropsychiatry 14:277–298. [DOI] [PubMed] [Google Scholar]
- Thomason ME, Yoo DJ, Glover GH, Gotlib IH (2009): BDNF genotype modulates resting functional connectivity in children. Front Hum Neurosci 3:55. [DOI] [PMC free article] [PubMed] [Google Scholar]
- Vanderhasselt MA, De Raedt R, Leyman L, Baeken C (2009): Acute effects of repetitive transcranial magnetic stimulation on attentional control are related to antidepressant outcomes. J Psychiatry Neurosci 34:119–126. [PMC free article] [PubMed] [Google Scholar]
- Vanderhasselt MA, De Raedt R, Leyman L, Baeken C (2010): Role of the left DLPFC in endogenous task preparation: Experimental repetitive transcranial magnetic stimulation study. Neuropsychobiology 61:162–168. [DOI] [PubMed] [Google Scholar]
- Wang H, Wang X, Scheich H (1996): LTD and LTP induced by transcranial magnetic stimulation in auditory cortex. Neuroreport 7:521–525. [DOI] [PubMed] [Google Scholar]
- Wang L, Yu C, Chen H, Qin W, He Y, Fan F, Zhang Y, Wang M, Li K, Zang Y, Woodward TS, Zhu C (2010): Dynamic functional reorganization of the motor execution network after stroke. Brain 133:1224–1238. [DOI] [PubMed] [Google Scholar]
- Westerhausen R, Kompus K, Dramsdahl M, Falkenberg LE, Gruner R, Hjelmervik H, Specht K, von Plessen K, Hugdahl K (2011): A critical re‐examination of sexual dimorphism in the corpus callosum microstructure. Neuroimage 56:874–880. [DOI] [PubMed] [Google Scholar]
- Zafar N, Paulus W, Sommer M (2008): Comparative assessment of best conventional with best theta burst repetitive transcranial magnetic stimulation protocols on human motor cortex excitability. Clin Neurophysiol 119:1393–1399. [DOI] [PubMed] [Google Scholar]