

Abstract
Neuropsychiatric syndromes are highly prevalent in Alzheimer's disease (AD), but their neurobiology is not completely understood. New methods in functional magnetic resonance imaging, such as intrinsic functional connectivity or “resting‐state” analysis, may help to clarify this issue. Using such approaches, alterations in the default‐mode and salience networks (SNs) have been described in Alzheimer's, although their relationship with specific symptoms remains unclear. We therefore carried out resting‐state functional connectivity analysis with 20 patients with mild to moderate AD, and correlated their scores on neuropsychiatric inventory syndromes (apathy, hyperactivity, affective syndrome, and psychosis) with maps of connectivity in the default mode network and SN. In addition, we compared network connectivity in these patients with that in 17 healthy elderly control subjects. All analyses were controlled for gray matter density and other potential confounds. Alzheimer's patients showed increased functional connectivity within the SN compared with controls (right anterior cingulate cortex and left medial frontal gyrus), along with reduced functional connectivity in the default‐mode network (bilateral precuneus). A correlation between increased connectivity in anterior cingulate cortex and right insula areas of the SN and hyperactivity syndrome (agitation, irritability, aberrant motor behavior, euphoria, and disinhibition) was found. These findings demonstrate an association between specific network changes in AD and particular neuropsychiatric symptom types. This underlines the potential clinical significance of resting state alterations in future diagnosis and therapy. Hum Brain Mapp 35:1237–1246, 2014. © 2013 Wiley Periodicals, Inc.
Keywords: Alzheimer's disease, default mode network, salience network, functional connectivity, neuropsychiatric symptoms
INTRODUCTION
Neuropsychiatric symptoms (NPS) are highly prevalent in patients with dementia. This is particularly the case in those with Alzheimer's disease (AD), where studies report a prevalence of NPS that varies from 60 to 90% during the course of the disease [Youn et al., 2011]. However, despite this high prevalence, the neurobiology underlying these symptoms is poorly understood. The most widespread theories about the genesis of cognitive deficits and NPS in AD relate to anatomic‐structural changes, associated with pathological features (neuritic plaques, neurofibrillary tangles, and loss of synaptic density, among others), in the limbic, paralimbic, and neocortical regions. In addition, NPS may be associated with dysfunction of various neurotransmitter systems due to neuronal death in specific transmitter source nuclei (cholinergic, serotonergic, noradrenergic, etc.) [Cummings, 2000].
In addition to the observed anatomical deficits, recent advances in the neuroimaging of dementia have highlighted concurrent dysfunctions in functional networks. Such networks have been identified across a number of imaging modalities, most prominently fMRI, and are characterized by inter‐regional correlations in spontaneous BOLD fluctuations (known as functional connectivity) in the absence of an experimental paradigm or any other explicit stimulus [van den Heuvel and Pol, 2010]. Different networks are spatially distinct but functionally related and have been found to be present at rest, during tasks, and even during sleep and anesthesia [Deshpande et al., 2010; Fox and Raichle, 2007; van den Heuvel and Pol, 2010]. Neurodegenerative diseases, such as AD, can disrupt activity within the networks [Seeley et al., 2009], as well as the complex system of interconnections between the different networks, causing cognitive problems (memory, attention, language, praxis, and executive functions), and NPS (apathy, depression, agitation, disinhibition, etc.) [Bruen et al., 2008; Gauthier et al., 2010; Lyketsos et al., 2011]. In the case of AD, one of the most relevant networks appears to be the default mode network (DMN). The role of the DMN, which consists of regions such as the posterior cingulate cortex (PCC), precuneus, ventromedial prefrontal cortex, and the hippocampal formation, remains unclear; however, it is widely accepted that this system shows increased activity when a person is not focused on activities directed to the external environment (e.g., when an individual recalls autobiographical facts and events, or plans the future) [Buckner et al., 2008]. Some studies in AD have shown a breakdown in functional connectivity in the DMN, even at early stages of the disease [Greicius et al., 2004; Zhang et al., 2010]. In addition, Celone et al. 2006 reported associations between DMN connectivity and memory performance assessed outside of the scanner, whereas Westlye et al. 2011 showed a negative correlation between DMN synchronization and performance on memory tests, suggesting a neurocognitive significance of brain activity patterns during rest in healthy elderly individuals who are carriers of the AD‐related apolipoprotein ε4 gene (APOE4).
A second network that seems to be relevant in AD is the salience network (SN), which comprises the anterior cingulate cortex (ACC), the frontal insula, the amygdala and the striatum. Activity in the SN is related to emotionally relevant stimuli, which can originate either internally or from the external environment [Seeley et al., 2007]. In the case of AD (and the behavioral variant of frontotemporal dementia), Zhou et al. 2010 showed a negative correlation between the connectivity of the SN and the DMN, meaning that decreasing activity in the DMN is related to increased activity in the SN and vice versa). A dynamic interaction between these networks may provide regulation of shifts in attention, as well as access to personal resources for general cognitive processing and specific cognitive domains. Such mechanisms would have important implications for psychopathological disorders involving dysfunctional saliency processing, which can diminish the ability to direct attentional resources and goal‐relevant cognition [Menon, 2011].
Several unanswered questions remain, however, regarding the role of these functional networks in the development of AD symptoms. To our knowledge, no studies have investigated the correlation between neuropsychiatric syndromes and disruptions in the DMN or SN in AD. One study by Seeley et al. 2007 did find significant correlations between the level of anxiety in healthy adults before MRI scanning and the degree of connectivity of the ACC (an important part of the SN). The authors proposed that behavioral symptoms in AD, which often involve early emotional sensitizations such as irritability and anxiety, might be associated with functional alterations in SN [Zhou et al., 2010].
We based our study hypothesis on the following premises: (1) alterations in functional networks may be related to NPS; and (2) disruptions in one network may interfere with other networks (e.g., the negative correlation in connectivity patterns between DMN and SN). We hypothesized that alterations in DMN and SN connectivity may be responsible at least in part for the NPS of AD patients. More specifically, we sought to determine whether an increase in connectivity in the SN could lead to hyperactivity behaviors, such as agitation and irritability. With regard to the DMN, we hypothesized that a decrease in connectivity within this network could lead to apathy, potentially through deficits in forming expectations for the future or recounting recent events [Buckner et al., 2008]. Given the anticorrelation between SN and DMN, it is plausible to hypothesize that decreases in DMN connectivity might also be related to hyperactivity behaviors, which would fit with observations of combined apathy and agitation in patients with dementia.
To test our hypotheses, we correlated the scores of the neuropsychiatric inventory (NPI) subsyndromes, as defined by Aalten et al. 2007, with individual maps SN and DMN connectivity in patients with mild to moderate AD, considering age, atrophy, and dementia severity as covariates. The subsyndromes used were apathy, hyperactivity, affective syndrome, and psychosis. The use of NPI subsyndromes, rather than unitary symptoms, is supported by the fact that various individual symptoms usually manifest together and have a similar course over time, suggesting a common biological basis. In addition, pharmacological studies have shown that drug treatments have an effect on behavioral features in dementia when neuropsychiatric subsyndromes are considered but not when individual symptoms are considered [Gauthier et al., 2005; Herrmann et al., 2005]. We also compared the patterns of connectivity between patients and a group of healthy elderly people.
MATERIALS AND METHODS
Subjects
We studied 37 subjects over the age of 50 years (73.85 ± 8.19). Of those subjects, 20 had mild to moderate AD and were treated at the Neuropsychology and Dementia Outpatient Clinic (UNICAMP University Hospital). The remaining 17 subjects were healthy control subjects, matched for age and sex. Routine laboratory studies, including B12 levels, folate levels, syphilis serology, and thyroid hormone levels, were performed for all patients. The local ethics committee approved these experiments. The diagnosis of probable AD was based on criteria established by the National Institute of Neurological and Communicative Disorders, and the Stroke/Alzheimer's Disease and Related Disorders Association [McKhann et al., 1984]. We only included patients who were classified as clinical dementia rating (CDR) 1 (13 patients) and 2 (seven patients). All patients had at least one psychiatric symptom, as measured by the NPI. Exclusion criteria included a history of other neurological or psychiatric diseases, previous head injury with loss of consciousness, drug or alcohol addiction, prior chronic exposure to neurotoxic substances, and a Hachinski ischemic score >4. Patients who met the clinical criteria for probable AD but had extensive white matter hyperintensities on T 2‐weighted MRI were also excluded. Fifteen patients underwent MRI scanning on the same day that their caregivers completed the NPI interview. In the remaining five cases, the interviews were performed 2 days before the MRI scanning. The control group consisted of subjects who were classified as CDR 0 and had no history of neurological diseases, psychiatric diseases, or memory complaints.
Neuropsychological, Neuropsychiatric, and Functional Evaluations
Global cognitive status was measured using the Mini Mental Status Examination [MMSE, Folstein et al., 1975; Brazilian version by Brucki et al., 2003]. Episodic memory was evaluated by the Rey auditory verbal learning test [Rey, 1964]. Visual perception was assessed with subtests of Luria's Neuropsychological Investigation (LNI), using items G12, G13, G14 (the patient is asked to examine and name pictures of objects that are scribbled over or superimposed on another picture), along with G17 (an item from Raven's test) and one item for mental rotation of figures (in both items, the patient is asked to complete a structure, a portion of which is missing, by choosing from various options) [Christensen, 1975]. Four items from the Ratcliff's manikin test for mental rotation were also used [Ratcliff, 1979]. Constructive praxis was evaluated using the Rey‐Osterrieth's Complex Figure test [Osterrieth, 1944]. Language tests included the Boston Naming Test [Kaplan et al., 1983] and verbal fluency for category words (animals) and phonology (FAS). Working memory was assessed by the forward (FDS) and backward digit span subtest of the WAIS‐R [Wechsler, 1987]. Executive functions were evaluated using the Trail Making Test A and B, Stroop color‐word test and Clock drawing test.
The neuropsychiatric assessment consisted of the Neuropsychiatric Inventory (NPI) [Cummings et al., 1994] based on an interview with the closest caregiver. The NPI consists of a detailed evaluation of the following 12 neuropsychiatric domains: hallucinations, delusions, agitation/aggression, depression, anxiety, irritability, disinhibition, euphoria, apathy, aberrant motor behavior, change in night‐time sleep behavior, and changes in appetite and eating. The questions were read to the caregiver exactly as written. If the caregiver failed to comprehend the question, we repeated it in alternate terms. After reading the screening question, the caregiver was asked if the behavior described had been observed. If the answer was “no” then we proceeded to the next section and read the next screening question. If the answer was “yes,” then the subquestions were read, and yes/no responses were obtained. The caregiver was then asked to rate the frequency and severity of the behaviors within that domain, based on the most abnormal behavior revealed in the subquestions. The scores were calculated by multiplying the frequency of the symptoms (from 1 to 4: rarely, sometimes, often and very often) by the intensity (from 1 to 3: mild, moderate and severe). Each NPI domain score may thus vary from 0 to 12. Based on a study by Aalten et al. 2007, we considered the following four subsyndromes: apathy, hyperactivity (the sum of agitation, disinhibition, irritability, euphoria, and aberrant motor behavior scores), psychosis (delusions, hallucinations, and night‐time behavior disturbances) and affective syndrome (depression and anxiety). We also applied the CDR using a semistructured interview and Pfeffer's daily‐life activities questionnaire.
Data analysis was performed using Systat software 12.0. Student's t‐tests were performed for intergroup comparisons of the demographic and cognitive scores. On occasions where the data violated the assumptions of parametric tests, we performed the Mann Whitney test. The results were considered to be statistically significant when P < 0.05.
Magnetic Resonance Image Acquisition
Structural and functional images were acquired on a 3T MRI scanner (Philips Achieva, Best, The Netherlands). A set of structural images was composed with the following sequences: (a) sagittal high‐resolution T 1‐weighted with gradient echo images that were acquired with TR/TE = 7/3.2 ms, FOV = 240 × 240, and isotropic voxels of 1 mm3; (b) coronal and axial FLAIR (fluid‐attenuated inversion recovery) T 2‐weighted images, anatomically aligned at the hippocampus with image parameters set to TR/TE/TI = 12,000/140/2,850 ms, FOV = 220 × 206, voxels reconstructed to 0.45 × 0.45 × 4.00 mm3 with the gap between slices set to 1 mm; (c) coronal IR (inversion recovery) T 1‐weighted images with TR/TE/TI = 3,550/15/400 ms, FOV = 180 × 180 and voxels reconstructed to 0.42 × 0.42 × 3.00 mm3; (d) coronal multiecho (five echos) T 2‐weighted images with TR/TE = 3,300/30 ms, FOV = 180 × 180, voxels reconstructed to 0.42 × 0.42 × 3.00 mm3.
Functional images were acquired during rest. Subjects were instructed to keep their eyes closed and to not think of anything in particular. Axial T 2*‐weighted images had TR/TE = 2,000/30 ms, FOV = 240 × 240, 40 axial slices per volume, and isotropic voxels set to 3 × 3 × 3 mm3. For each participant, we acquired 10‐min of echo planar images (300 volumes) and discarded the first three volumes.
The participants' sensory stimulation was limited to the noise of the scanner during image acquisitions. To reduce noise, all subjects wore earplugs. In addition, all subjects had their head movements restricted by a soft Velcro strap.
Structural Imaging Analysis
To exclude the influence of structural abnormalities, we evaluated gray matter (GM) density through voxel‐based morphometry (VBM) analysis. VBM is a technique that allows the assessment of the volume or concentration of gray and white matter across the whole brain through an automated postprocessing MRI evaluation [Ashburner and Friston, 2000]. The voxelwise approach does not require prior information about GM [Good et al., 2001]. We carried out VBM analysis on 3D, sagittal T 1‐weighted images, with a thickness of 1 mm (TR/TE = 22/9 ms, flip angle = 35°, matrix = 256 × 220) using the FSL toolbox (http://www.fmrib.ox.ac.uk/fsl/) [Smith et al., 2004]. Images were skull stripped using the BET algorithm [Smith, 2002] and GM was automatically segmented using the FAST4 algorithm [Zhang et al., 2001]. GM maps were then normalized to MNI standard space with affine registration [Jenkinson et al., 2002; Jenkinson and Smith, 2001]. Registered images were divided by the Jacobian of the warp field in order to correct local deformation. Resulting images were smoothed with an 8‐mm FWHM isotropic Gaussian kernel. Smoothed GM images were then used in subsequent analysis.
Functional Imaging Analysis
Functional images were converted from DICOM to the NIfTI format using Philips scanner software. Images were preprocessed by removing linear trends before slice timing and motion correction algorithms were applied. The motion correction step took the first volume of the time series as its reference and output six parameters of head movement, three related to head translation and three associated to the head rotation (yaw, pitch, and roll). Subsequently, images were normalized to MNI standard space and smoothed with a 6 mm FWHM Gaussian kernel. We applied Fourier filters on smoothed images, setting a bandpass from 0.01 to 0.1 Hz, and regressed these data with the motion parameters previously calculated. All of these steps were done with the AFNI software package (http://afni.nimh.nih.gov/). Subsequently, probabilistic independent component (IC) analysis (pICA) [Beckmann and Smith, 2004; Guo, 2011] was estimated in order to extract independent spatial maps (IC) for each subject. ICs were obtained with the FSL toolbox, Multivariate Exploratory Linear Optimized Decomposition into Independent Components (MELODIC v3.0). We allowed the MELODIC algorithm to determine as many ICs as was necessary to explain 99% of the variability of preprocessed data (default option).
The set of ICs components was masked with the atlas of functional ROIs (fROI) available on the Stanford's Functional Imaging in Neuropsychiatric Disorders website (http://findlab.stanford.edu/index.html) [Shirer et al., 2012]. We used the “ventral and dorsal DMN” (vDMN and dDMN) and the “anterior and posterior SN” (aSN and pSN) to extract z‐values of ICs within and outside of the fROIs. To do this, we used a linear template‐matching procedure that involves taking the average z‐score of voxels falling within the template minus the average z‐score of voxels outside the template and selecting the component in which this difference (the goodness‐of‐fit) was the greatest. The z‐scores here reflect the degree to which a given voxel's time series correlates with the overall component time series, scaled by the standard deviation of the residual Gaussian noise [Greicius et al., 2004]. This procedure was estimated by the following equation:
Among the set of ICs, we selected the one with the highest value of GOF to use for the second level of analysis and to calculate correlations with NPI scores. Thus, one IC was chosen for each fROI (vDMN, dDMN, aSN, and pSN) to enter subsequent analyses.
Differences between controls and patients were estimated by nonparametric permutation tests (RANDOMISE ‐ 5000 permutations) [Nichols and Holmes, 2002]. The P values calculated were corrected for multiple comparisons according to the threshold‐free cluster enhancement algorithm implemented in FSL [Anderson and Robinson, 2001; Bullmore et al., 1999; Hayasaka and Nichols, 2003]. We included each subject's 3D map of GM in this analysis to correct the results for atrophy on a voxelwise basis.
Correlations Between NPI and DMN and SN Connectivity
We used the same nonparametric approach to evaluate the correlation between patients' selected ICs (vDMN, dDMN, aSN, and pSN) and NPI syndromes (apathy, hyperactivity, affective syndrome, and psychosis). Age, dementia severity (as measured by CDR sum of boxes (memory, orientation, judgment, and problem solving, community affairs, home and hobbies, and personal care), and GM maps were entered nuisance variables. Statistical maps were then corrected for multiple comparisons with P < 0.01, FDR corrected.
RESULTS
Cognitive and Neuropsychiatric Evaluations
As shown in Table 1, there was no difference between the AD group and the controls with regard to age (P = 0.43), but there was a significant difference in the two groups regarding education (P < 0.05). The AD patients performed worse in all tests, which included episodic memory, attention and working memory, visuospatial skills, executive functions, and language (Table 1). Distribution of NPI symptoms and subsyndromes are shown in Table 2 and Figure 1.
Table 1.
Demographic, functional, and neuropsychological data
| AD | Controls | P | |
|---|---|---|---|
| Age (years) | 73.85 ± 8.19 | 72.33 ± 6.37 | 0.43a |
| Education (years) | 6.95 ± 4.45 | 10.16 ± 5.36 | <0.05 |
| CDR–SB | 6.72 ± 2.74 | 0 | |
| Pfeffer Functional Activity Questionnaire | 18.45 ± 7.83 | 0 | |
| MMSE | 16.35 ± 6.22 | 28.55 ± 1.85 | <0.0001 |
| RAVLT: COD | 18.83 ± 7.53 | 45.66 ± 8.46 | <0.0001 |
| RAVLT: A7 | 0.55 ± 1.09 | 8.26 ± 0.61 | <0.0001 |
| BNT | 29.53 ± 13.80 | 52.46 ± 4.89 | <0.0001 |
| Semantic VF | 6.88 ± 3.12 | 18.00 ± 4.20 | <0.0001a |
| Phonologic VF (FAS) | 13.82 ± 9.76 | 33.46 ± 13.19 | <0.0001 |
| VSP‐LNI | 13.25 ± 3.76 | 18.13 ± 1.24 | <0.0001 |
| FDS | 3.82 ± 1.70 | 5.40 ± 2.16 | 0.02a |
| BDS | 2.05 ± 1.81 | 4.33 ± 1.54 | 0.002a |
| TMT‐A (s) | 225.67 ± 98.66 | 66.73 ± 20.32 | <0.0001 |
| TMT‐B (s) | 278.73 ± 56.60 | 123.07 ± 83.34 | <0.0001 |
| Stroop test: Congruent (s) | 98.52 ± 41.51 | 58.06 ± 18.69 | 0.004 |
| Stroop test: Congruent (errors) | 0.23 ± 0.75 | 0.06 ± 0.25 | 0.62 |
| Stroop test: Incongruent (s) | 216.24 ± 59.00 | 108.20 ± 28.20 | 0.008 |
| Stroop test: Incongruent (errors) | 34.52 ± 23.93 | 2.53 ± 3.75 | <0.0001 |
| Clock drawing test (0–10) | 5.53 ± 0.79 | 9.46 ± 0.35 | 0.0004 |
| Rey complex figure (copy) | 14.00 ± 3.37 | 34.60 ± 1.19 | <0.0001 |
Data presented as mean ± SD.
Mann–Whitney test was applied due to non‐normal distribution.
MMSE, mini‐mental status examination; RAVLT‐COD, encoding of Rey auditory verbal learning test (sum of A1 + A2 + … + A5); RAVLT ‐A7, delayed recall of RAVLT; BNT, Boston naming test; VF, verbal fluency; VSP‐LNI, visuospatial perception item of Luria's neuropsychological investigation; FDS, forward digit span; BDS, backward digit span; TMT, Trail Making Test. Significance levels of comparisons between AD and healthy groups are given in the final column.
Table 2.
Neuropsychiatric inventory syndromes and symptoms
| NPI subsyndromes | NPI symptoms | Mean ± SD | % of patients with symptom |
|---|---|---|---|
| Apathy | Apathy | 4.25 ± 3.22 | 90 |
| Appetite and eating abnormalities | 1.70 ± 2.93 | 35 | |
| Hyperactivity | Agitation | 1.10 ± 2.75 | 30 |
| Disinhibition | 0.30 ± 1.34 | 5 | |
| Irritability | 1.2 ± 2.19 | 40 | |
| Euphoria | 0.2 ± 0.89 | 5 | |
| Aberrant motor behavior | 1.45 ± 2.32 | 35 | |
| Affective | Depression | 1.55 ± 2.28 | 35 |
| Anxiety | 0.95 ± 2.25 | 25 | |
| Psychosis | Hallucinations | 0.10 ± 0.30 | 10 |
| Delusions | 0.15 ± 0.48 | 10 | |
| Night time behavior disturbances | 1.20 ± 2.17 | 30 |
Figure 1.

Box and whiskers plot showing the distribution of NPI syndromes scores: hyperactivity (mean ± SD: 4.05 ± 6.18), apathy (4.25 ± 3.22), affective syndrome (2.50 ± 4.28), and psychosis (1.45 ± 2.41). The box extends from the 25th percentile to the 75th percentile, with a horizontal line at the median. Whiskers extend down to the smallest value and up to the largest.
Differences in the DMN and SN in AD Patients and Healthy Elderly
We found areas of decreased connectivity in the dorsal DMN (atrophy corrected), and in particular in its posterior anatomical structures, when comparing the AD group to the control subjects (P < 0.01, corrected for multiple comparisons). These were the right precuneus (MNI coordinates: 6, −66, 24; 205 voxels; z = 4.12) and left precuneus (−2, −64, 54; 160 voxels; z = 3.82) (Fig. 2A). The same analysis did not show any areas of increased connectivity in the DMN in AD patients.
Figure 2.
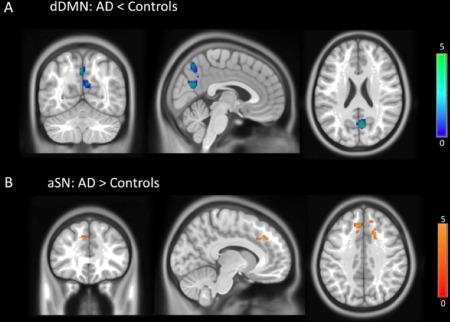
(A) Dorsal DMN areas of decreased functional connectivity in AD patients (atrophy corrected): right precuneus (MNI coordinates: 6, −66, 24) and left precuneus (−2, −64, 54); P < 0.01, corrected for multiple comparisons. (B) Anterior SN areas of increased connectivity in AD patients (atrophy corrected): right cingulate gyrus (18, 20, 38) and left medial frontal gyrus (−8, 32, 38); P < 0.01, corrected.
The opposite pattern was found in relation to the anterior SN. AD patients showed areas of increased connectivity (atrophy corrected) in the right cingulate gyrus (18, 20, 38; 96 voxels; z = 4.42; P < 0.01, corrected) and left medial frontal gyrus (−8, 32, 38; 79 voxels; z = 4.08; P < 0.01, corrected) (Fig. 2B). We did not find any significant differences between AD and controls in the connectivity of the ventral DMN and posterior SN.
Multiple Regressions of NPI Syndromes With DMN and SN
We performed multiple regressions between the dorsal and ventral DMN and anterior and posterior SN maps and the NPI syndromes of apathy, affective symptoms, hyperactivity, and psychosis. We found significant areas of positive correlation with hyperactivity in the anterior SN (atrophy corrected), specifically in the right ACC (MNI: 8, 28, 18; 180 voxels; z = 4.82; P < 0.01, corrected) and right insula (44, 10, −6; 68 voxels; z = 4.36; P < 0.01, corrected) (Fig. 3). All other regressions did not show any significant correlation between dorsal/ventral DMN or anterior/posterior SN with NPI syndromes following correction for multiple comparisons and GM atrophy.
Figure 3.

Areas of positive correlations between anterior SN and hyperactivity syndrome (atrophy corrected): right ACC (MNI: 8, 28, 18) and right insula (44, 10, −6); P < 0.01, corrected for multiple comparisons.
DISCUSSION
Using resting‐state fMRI in a group of patients with mild to moderate AD and age and sex matched controls, we showed that alterations in the intrinsic connectivity of the anterior SN predict behavioral symptoms in AD patients. Specifically, we demonstrated that hyperactivity syndrome is associated with aSN hyperconnectivity in the ACC and right insula. This correlation remains even after correction for GM atrophy. No correlations were found between DMN connectivity and NPS, or between SN connectivity and other NPS (apathy, psychosis, and affective syndromes) following correction for atrophy.
To our knowledge, our study is the first to report a correlation between alterations in SN connectivity and a specific NPS in AD. The relevance of the role of functional networks in psychopathology has been increasingly recognized, especially the SN, which is important in the appropriate assignment of saliency to external stimuli or internal mental events. The SN, with the anterior insula as its integral outflow hub, assists target brain regions in the generation of appropriate behavioral responses to salient stimuli [Menon, 2011]. This property of detecting salient events (from the external environment or internally) may be susceptible to dysfunction (ineffective or enhanced detection) leading to inappropriate behaviors. We found that hyperactivity syndrome (composed of symptoms of agitation, disinhibition, irritability, euphoria, and aberrant motor behavior symptoms) is related to enhanced connectivity in SN nodes such as the ACC and right AI. This syndrome, at least in part, could be a manifestation of an anxiety disorder, in which hyperactivity of AI has been consistently implicated [Menon, 2011; Paulus and Stein, 2006].
In accordance to Menon's triple network model, we suggest that in AD patients, enhanced saliency detection might cause misperception of common events as if they were emotionally relevant. This might cause symptoms such as agitation, euphoria, and irritability, which more directly involve emotional sensations. Furthermore, aberrant motor behavior also seems to involve stereotypical features (e.g., rummaging through drawers, manipulation of buttons, etc.); since the SN also receives information about representations of goals and motor plans (Palaniyappan and Liddle, 2012), this kind of behavior may be associated with dysfunctional representations of complex movements. We also propose that dysfunctional processing of stimuli by a hypoconnected DMN, as occurs in AD patients, might compromise the conscious awareness of the sensation caused by the stimuli. For example, a person who is walking incessantly may be in pain or be thirsty, although they cannot consciously process these sensations properly. Therefore, AD patients seem to have an altered response to a wide array of internal and external stimuli, as well as problems in the conscious awareness of the sensations caused by these stimuli. Considering the entire set of findings, it is possible that an alteration in the balance of functional connectivity networks in SN and DMN will predict the behaviors of hyperactivity observed in our patients.
In this regard, another plausible explanation could be based on a neurobiological account of Freudian constructs. According to Carhart‐Harris and Friston 2010, Freud's descriptions of the primary and secondary processes are consistent with self‐organized activity in hierarchical cortical systems, where the secondary process entailed by ego functions are associated with the suppressive effect of the DMN on its subcortical nodes and anticorrelated networks, such as the SN with its limbic and paralimbic components (frontoinsular cortices, amygdala). The hyperactivity syndrome of our AD patients could thus be equated with a primitive, at least partly unconscious, primary process thinking and behavior. Our finding of hypoconnectivity in the dorsal DMN and hyperconnectivity in the SN suggests that there have been a weakening or loss of top‐down DMN‐associated ego control over limbic activity in those hierarchically lower systems involved with the primary process. In our view, Carhart‐Harris and Friston's neurobiological Freudian account and Menon's triple network model complement each other in explaining our findings. Previous authors have found associations between SN connectivity and NP symptoms. For example, Seeley et al. 2007 found a correlation between stressor‐associated anticipatory anxiety levels before MRI scanning and ACC connectivity in young subjects without neurologic or psychiatric diseases. In AD patients, Zhou et al. 2010 also found increased SN connectivity in the ACC, and suggested that this finding may be related to behavioral symptoms involving emotional sensations such as irritability and anxiety. In addition, a number of authors have suggested that the SN may also be involved in other psychiatric diseases, such as schizophrenia, especially those with the major features of psychosis [Palaniyappan and Liddle, 2011].
Regarding the neurobiology of hyperactivity syndrome, there are few studies about the neural correlates of agitation, irritability, and aberrant motor behavior in AD. Tekin et al. 2001 demonstrated that neurofibrillary tangles in the ACC were related to agitation in AD patients, while in a SPECT study, Rolland et al. 2005 found a correlation between wandering behavior and left parietotemporal hypoperfusion. However, Bruen et al. 2008, who found a correlation between agitation scores and low GM density in bilateral ACC, noted that neuropathological evidence did not coincide with the appearance of the symptom. It is possible that hyperconnectivity in the ACC of AD patients (and hyperactivity syndrome) may precede the pathological findings described by these authors. Moreover, they did not find a correlation with other symptoms of hyperactivity syndrome. More work to support this hypothesis is required, however.
Regarding the relevance of functional connectivity disruptions in AD, some authors speculate that DMN problems may precede beta‐amyloid pathology. This hypothesis is supported by recent studies which have demonstrated that disconnection precedes atrophy in the PCC [Gili et al., 2011] and that asymptomatic carriers of APOE4 have a reduction in PCC connectivity, along with increased SN connectivity [Machulda et al., 2011]. Another possibility is that typical AD pathology may disrupt functional networks, with atrophy in some key DMN components, secondary to classic AD pathology, potentially initiating connectivity alterations in the whole network. Should this be the case, atrophy in the hippocampi may have led to a decrease in connectivity in the PCC; for example, studies using diffusion tensor imaging in patients with medial temporal lobe epilepsy with hippocampal sclerosis showed dysfunctions in the uncinate and arcuate fasciculus, involving frontal and posterior parietal regions in addition to the corpus callosum and cingulum [Thivard et al., 2005]. Following this model, it is possible that a decrease in DMN connectivity may cause an increase in other networks, including the SN. This is supported by a number of studies that have shown a negative correlation between the SN and DMN [Greicius and Krasnow, 2003; Fox et al., 2005; Zhou et al., 2010], with our study providing additional evidence. This correlation between DMN and SN activity has led some authors to suggest that they are functionally related, proposing that the SN plays a role in switching brain states from the internally guided DMN to an external task‐related activity mode [Sridharan et al., 2008; Palaniyappan and Liddle, 2011].
Our study has some limitations. First, we studied a relatively small cohort, although our findings were robust to a wide range of potential confounds and to multiple comparison correction, suggesting a reasonable degree of power. Second, it would be better to assess NPS symptoms during MRI scanning rather than through indirect methods; however, in most cases, we performed the NPI interview on the same day as the scan procedure, which could minimize this problem. Finally, future studies could test the validity of the method used here for evaluating clinical responses to pharmacological and nonpharmacological treatments of NP syndromes in AD and other forms of dementia.
CONCLUSIONS
Our findings demonstrate a correlation between hyperactivity syndrome and alterations in the connectivity of the SN in areas without anatomic atrophy. These results underline the potential clinical significance of resting state alterations in future diagnosis and therapy. However, these findings do not explain the whole phenomenon of NPS symptoms in AD—several other well‐established causes, including structural, genetic, biochemical, and environmental factors, are also related to these complex mental dysfunctions and may influence intrinsic connectivity patterns.
REFERENCES
- Aalten P, Verhey FR, Boziki M, Bullock R, Byrne EJ, Camus V, Caputo M, Collins D, De Deyn PP, Elina K, Frisoni G, Girtler N, Holmes C, Hurt C, Marriott A, Mecocci P, Nobili F, Ousset PJ, Reynish E, Salmon E, Tsolaki M, Vellas B, Robert PH (2007): Neuropsychiatric syndromes in dementia. Results from the European Alzheimer Disease Consortium: Part I. Dement Geriatr Cogn Disord 24:457–463. [DOI] [PubMed] [Google Scholar]
- Anderson MJ, Robinson J (2001): Permutation tests for linear models. Aust NZ J Stat 43:75–78. [Google Scholar]
- Ashburner J, Friston KJ (2000): Voxel‐based morphometry—The methods. Neuroimage 11(6 Pt 1):805–821. [DOI] [PubMed] [Google Scholar]
- Beckmann CF, Smith SM (2004): Probabilistic independent component analysis for functional magnetic resonance imaging. IEEE Trans Med Imaging 23:137–152. [DOI] [PubMed] [Google Scholar]
- Brucki SM, Nitrini R, Caramelli P, Bertolucci PH, Okamoto IH (2003): [Suggestions for utilization of the mini‐mental state examination in Brazil]. Arq Neuropsiquiatr 61:777–781. [DOI] [PubMed] [Google Scholar]
- Bruen PD, McGeown WJ, Shanks MF, Venneri A (2008): Neuroanatomical correlates of neuropsychiatric symptoms in Alzheimer's disease. Brain 131(Pt 9):2455–2463. [DOI] [PubMed] [Google Scholar]
- Buckner RL, Andrews‐Hanna JR, Schacter DL (2008): The brain's default network: Anatomy, function, and relevance to disease. Ann NY Acad Sci 1124:1–1138. [DOI] [PubMed] [Google Scholar]
- Bullmore ET, Suckling J, Overmeyer S, Rabe‐Hesketh S, Taylor E, Brammer MJ (1999): Global, voxel, and cluster tests, by theory and permutation, for a difference between two groups of structural MR images of the brain. IEEE Trans Med Imaging 18:32–42. [DOI] [PubMed] [Google Scholar]
- Carhart‐Harris RL, Friston KJ (2010). The default‐mode, ego‐functions and free‐energy: A neurobiological account of Freudian ideas. Brain 133:1265–1283. [DOI] [PMC free article] [PubMed] [Google Scholar]
- Celone KA, Calhoun VD, Dickerson BC, Atri A, Chua EF, Miller SL, DePeau K, Rentz DM, Selkoe DJ, Blacker D, Albert MS, Sperling RA (2006): Alterations in memory networks in mild cognitive impairment and Alzheimer's disease: An independent component analysis. J Neurosci 26:10222–10231. [DOI] [PMC free article] [PubMed] [Google Scholar]
- Christensen A‐L.1975. Luria's Neuropsychological Investigation, Manual and Test Material, 4th ed Copenhagen:Munksgaard. [Google Scholar]
- Cummings JL, Mega M, Gray K, Rosenberg‐Thompson S, Carusi DA, Gornbein J (1994): The Neuropsychiatric Inventory: Comprehensive assessment of psychopathology in dementia. Neurology 44:2308–2314. [DOI] [PubMed] [Google Scholar]
- Cummings JL (2000): Cognitive and behavioral heterogeneity in Alzheimer's disease: Seeking the neurobiological basis. Neurobiol Aging 21:845–861. [DOI] [PubMed] [Google Scholar]
- Deshpande G, Kerssens C, Sebel PS, Hu X (2010): Altered local coherence in the default mode network due to sevoflurane anesthesia. Brain Res 1318:110–121. [DOI] [PMC free article] [PubMed] [Google Scholar]
- Folstein MF, Folstein SE, McHugh PR (1975): “Mini‐mental state”. A practical method for grading the cognitive state of patients for the clinician. J Psychiatr Res 12:189–198. [DOI] [PubMed] [Google Scholar]
- Fox MD, Snyder AZ, Vincent JL, Corbetta M, Van Essen DC, Raichle ME (2005): The human brain is intrinsically organized into dynamic, anticorrelated functional networks. Proc Natl Acad Sci USA 102:9673–9678. [DOI] [PMC free article] [PubMed] [Google Scholar]
- Fox MD, Raichle ME (2007): Spontaneous fluctuations in brain activity observed with functional magnetic resonance imaging. Nat Rev Neurosci 8:700–711. [DOI] [PubMed] [Google Scholar]
- Gauthier S, Wirth Y, Mobius HJ (2005): Effects of memantine on behavioural symptoms in Alzheimer's disease patients: An analysis of the Neuropsychiatric Inventory (NPI) data of two randomised, controlled studies. Int J Geriatr Psychiatry 20:459–464. [DOI] [PubMed] [Google Scholar]
- Gauthier S, Cummings J, Ballard C, Brodaty H, Grossberg G, Robert P, Lyketsos C (2010): Management of behavioral problems in Alzheimer's disease. Int Psychogeriatr 22:346–372. [DOI] [PubMed] [Google Scholar]
- Gili T, Cercignani M, Serra L, Perri R, Giove F, Maraviglia B, Caltagirone C, Bozzali M (2011): Regional brain atrophy and functional disconnection across Alzheimer's disease evolution. J Neurol Neurosurg Psychiatry 82:58–66. [DOI] [PubMed] [Google Scholar]
- Good CD, Johnsrude IS, Ashburner J, Henson RN, Friston KJ, Frackowiak RS (2001): A voxel‐based morphometric study of ageing in 465 normal adult human brains. Neuroimage 14(1 Pt 1):21–36. [DOI] [PubMed] [Google Scholar]
- Greicius MD, Krasnow B, Reiss AL, Menon V (2003): Functional connectivity in the resting brain: A network analysis of the default mode hypothesis. Proc Natl Acad Sci U S A 100:253–258. [DOI] [PMC free article] [PubMed] [Google Scholar]
- Greicius MD, Srivastava G, Reiss AL, Menon V (2004): Default‐mode network activity distinguishes Alzheimer's disease from healthy aging: Evidence from functional MRI. Proc Natl Acad Sci U S A 101:4637–4642. [DOI] [PMC free article] [PubMed] [Google Scholar]
- Guo Y (2011): A general probabilistic model for group independent component analysis and its estimation methods. Biometrics 67:1532–1542. [DOI] [PMC free article] [PubMed] [Google Scholar]
- Hayasaka S, Nichols TE (2003): Validating cluster size inference: Random field and permutation methods. Neuroimage 20:2343–2356. [DOI] [PubMed] [Google Scholar]
- Herrmann N, Rabheru K, Wang J, Binder C (2005): Galantamine treatment of problematic behavior in Alzheimer disease: Post‐hoc analysis of pooled data from three large trials. Am J Geriatr Psychiatry 13:527–534. [DOI] [PubMed] [Google Scholar]
- Jenkinson M, Bannister P, Brady M, Smith S (2002): Improved optimization for the robust and accurate linear registration and motion correction of brain images. Neuroimage 17:825–841. [DOI] [PubMed] [Google Scholar]
- Jenkinson M, Smith S (2001): A global optimisation method for robust affine registration of brain images. Med Image Anal 5:143–156. [DOI] [PubMed] [Google Scholar]
- Kaplan EF, Goodglass H, Weintraub S (1983). The Boston Naming Test, 2nd ed Philadelphia:Lea & Febiger. [Google Scholar]
- Lyketsos CG, Carrillo MC, Ryan JM, Khachaturian AS, Trzepacz P, Amatniek J, Cedarbaum J, Brashear R, Miller DS (2011): Neuropsychiatric symptoms in Alzheimer's disease. Alzheimer Dement 7:532–539. [DOI] [PMC free article] [PubMed] [Google Scholar]
- Machulda MM, Jones DT, Vemuri P, McDade E, Avula R, Przybelski S, Boeve BF, Knopman DS, Petersen RC, Jack CR Jr (2011): Effect of APOE epsilon4 status on intrinsic network connectivity in cognitively normal elderly subjects. Arch Neurol 68:1131–1136. [DOI] [PMC free article] [PubMed] [Google Scholar]
- McKhann G, Drachman D, Folstein M, Katzman R, Price D, Stadlan EM (1984): Clinical diagnosis of Alzheimer's disease: Report of the NINCDS‐ADRDA Work Group under the auspices of Department of Health and Human Services Task Force on Alzheimer's Disease. Neurology 34:939–944. [DOI] [PubMed] [Google Scholar]
- Menon V (2011): Large‐scale brain networks and psychopathology: A unifying triple network model. Trends Cogn Sci 15:483–506. [DOI] [PubMed] [Google Scholar]
- Nichols TE, Holmes AP (2002): Nonparametric permutation tests for functional neuroimaging: A primer with examples. Hum Brain Mapp 15:1–25. [DOI] [PMC free article] [PubMed] [Google Scholar]
- Osterrieth PA (1944). [The test of copying a complex figure: A contribution to the study of perception and memory]. Arch Psychol 30:286–356. [Google Scholar]
- Palaniyappan L, Liddle PF (2012): Does the salience network play a cardinal role in psychosis? An emerging hypothesis of insular dysfunction. J Psychiatry Neurosci 37:17–27. [DOI] [PMC free article] [PubMed] [Google Scholar]
- Paulus MP, Stein MB (2006). An insular view of anxiety. Biol Psychiatry 60:383–387. [DOI] [PubMed] [Google Scholar]
- Ratcliff G (1979): Spatial thought, mental rotation and the right cerebral hemisphere. Neuropsychologia 17:49–54. [DOI] [PubMed] [Google Scholar]
- Rey A.1964. [Clinical examination in psychology]. Paris:Press Universitaire de France. [Google Scholar]
- Rolland Y, Payoux P, Lauwers‐Cances V, Voisin T, Esquerre JP, Vellas B (2005): A SPECT study of wandering behavior in Alzheimer's disease. Int J Geriatr Psychiatry 20:816–820. [DOI] [PubMed] [Google Scholar]
- Seeley WW, Menon V, Schatzberg AF, Keller J, Glover GH, Kenna H, Reiss AL, Greicius MD (2007): Dissociable intrinsic connectivity networks for salience processing and executive control. J Neurosci 27:2349–2356. [DOI] [PMC free article] [PubMed] [Google Scholar]
- Seeley WW, Crawford RK, Zhou J, Miller BL, Greicius MD (2009): Neurodegenerative diseases target large‐scale human brain networks. Neuron 62:42–52. [DOI] [PMC free article] [PubMed] [Google Scholar]
- Shirer WR, Ryali S, Rykhlevskaia E, Menon V, Greicius MD (2012): Decoding subject driven cognitive states with whole‐brain connectivity patterns. Cereb Cortex 22:158–165. [DOI] [PMC free article] [PubMed] [Google Scholar]
- Smith SM (2002): Fast robust automated brain extraction. Hum Brain Mapp 17:143–155. [DOI] [PMC free article] [PubMed] [Google Scholar]
- Smith SM, Jenkinson M, Woolrich MW, Beckmann CF, Behrens TE, Johansen‐Berg H, Bannister PR, De Luca M, Drobnjak I, Flitney DE, Niazy RK, Saunders J, Vickers J, Zhang Y, De Stefano N, Brady JM, Matthews PM (2004): Advances in functional and structural MR image analysis and implementation as FSL. Neuroimage 23(Suppl 1):S208–S219. [DOI] [PubMed] [Google Scholar]
- Sridharan D, Levitin DJ, Menon V (2008): A critical role for the right fronto‐insular cortex in switching between central‐executive and default‐mode networks. Proc Natl Acad Sci U S A 105:12569–12574. [DOI] [PMC free article] [PubMed] [Google Scholar]
- Tekin S, Mega MS, Masterman DM, Chow T, Garakian J, Vinters HV, Cummings JL (2001): Orbitofrontal and anterior cingulate cortex neurofibrillary tangle burden is associated with agitation in Alzheimer disease. Ann Neurol 49:355–361. [PubMed] [Google Scholar]
- Thivard L, Lehericy S, Krainik A, Adam C, Dormont D, Chiras J, Baulac M, Dupont S (2005): Diffusion tensor imaging in medial temporal lobe epilepsy with hippocampal sclerosis. Neuroimage 28:682–690. [DOI] [PubMed] [Google Scholar]
- van den Heuvel MP, Hulshoff Pol HE (2010): Exploring the brain network: A review on resting‐state fMRI functional connectivity. Eur Neuropsychopharmacol 20:519–534. [DOI] [PubMed] [Google Scholar]
- Wechsler D (1987). Manual for the Wechsler Memory Scale‐Revised (WMS‐R). San Antonio:The Psychological Corporation. [Google Scholar]
- Westlye ET, Lundervold A, Rootwelt H, Lundervold AJ, Westlye LT (2011): Increased hippocampal default mode synchronization during rest in middle‐aged and elderly APOE epsilon4 carriers: Relationships with memory performance. J Neurosci 31:7775–7783. [DOI] [PMC free article] [PubMed] [Google Scholar]
- Youn JC, Lee DY, Jhoo JH, Kim KW, Choo IH, Woo JI (2011): Prevalence of neuropsychiatric syndromes in Alzheimer's disease (AD). Arch Gerontol Geriatr 52:258–263. [DOI] [PubMed] [Google Scholar]
- Zhang HY, Wang SJ, Liu B, Ma ZL, Yang M, Zhang ZJ, Teng GJ (2010): Resting brain connectivity: Changes during the progress of Alzheimer disease. Radiology 256:598–606. [DOI] [PubMed] [Google Scholar]
- Zhang Y, Brady M, Smith S (2001): Segmentation of brain MR images through a hidden Markov random field model and the expectation‐maximization algorithm. IEEE Trans Med Imaging 20:45–57. [DOI] [PubMed] [Google Scholar]
- Zhou J, Greicius MD, Gennatas ED, Growdon ME, Jang JY, Rabinovici GD, Kramer JH, Weiner M, Miller BL, Seeley WW (2010): Divergent network connectivity changes in behavioural variant frontotemporal dementia and Alzheimer's disease. Brain 133(Pt 5):1352–67. [DOI] [PMC free article] [PubMed] [Google Scholar]