

Abstract
Suffering from anhedonia, patients with major depressive disorder (MDD) exhibit alterations in several parts of the serotonergic neurotransmitter system, which are in turn involved in reward processing. However, previous investigations of the serotonin transporter (SERT) focused on regional differences with varying results depending on the clinical syndrome. Here, we aimed to describe the serotonergic system of MDD patients on a network level by evaluating SERT associations across brain regions. Twenty medication free patients with major depression and 20 healthy controls underwent positron emission tomography using the radioligand [11C]DASB. SERT binding potentials (BPND) were quantified voxel‐wise with the multilinear reference tissue model 2. In addition, SERT BPND was extracted from the dorsal raphe nucleus (DRN) as an indicator of midbrain serotonergic neurotransmission. Whole‐brain linear regression analysis was applied to evaluate the association of DRN SERT bindings to those in projection areas, which was followed by ANCOVA to assess differences in interregional relationships between patients and controls. Although both groups showed widespread positive correlations, group differences were restricted to decreased SERT associations between the DRN and the ventral striatum (right and left respectively: t = 5.85, P < 0.05 corrected and t = 5.07, P < 0.1 corrected) when comparing MDD patients (R 2 = 0.11 and 0.24) to healthy subjects (R 2 = 0.72 and 0.66, P < 0.01 and 0.05 corrected). Adjusting for age and sex did not change these findings. This study indicates a disturbed regulation between key regions involved in reward processing via the SERT. Our interregional approach highlights the importance of evaluating pathophysiological alterations on a network level to gain complementary information in addition to regional investigations. Hum Brain Mapp 35:3857–3866, 2014. © 2014 Wiley Periodicals, Inc.
Keywords: serotonin transporter, major depression, ventral striatum, dorsal raphe nucleus, positron emission tomography, interregional association
INTRODUCTION
The experience of pleasure and reward represents an important aspect for one's mental health and comprises the three primary components of liking (pleasure), wanting (motivation), and learning (predicting future rewards) [Berridge and Kringelbach, 2008]. Within the brain several key structures of reward processing have been identified [Kranz et al., 2010]. In addition to the anterior cingulate and orbitofrontal cortices, these include several subcortical areas such as the ventral striatum (VStr) with the nucleus accumbens (NAcc), lateral habenulae, amygdala, substantia nigra, and ventral tegmental area.
Patients with major depressive disorder (MDD) suffer among other symptoms from a lack of motivation and hedonic experience [Hasler et al., 2004; Pizzagalli et al., 2005]. This is further emphasized by alterations within the aforementioned areas during reward processing in depression [Nestler and Carlezon, 2006]. Reports include attenuated neural response to rewarding stimuli like emotional expressions and monetary rewards [Pizzagalli et al., 2009] and abnormal reward‐learning [Kumar et al., 2008].
The majority of research investigating the neurobiological underpinnings of anhedonia in MDD has focused on the neurotransmitter dopamine [Nestler and Carlezon, 2006]. However, dopaminergic imaging studies still found mixed results, depending on the specific patient subgroup [Dunlop and Nemeroff, 2007; Savitz and Drevets, 2013]. Recent findings also highlighted a substantial involvement in reward processing for the serotonin (5‐HT) system [Kranz et al., 2010]. Evidence comes from electrophysiological recordings of non‐human primates, indicating that dorsal raphe nucleus (DRN) neurons encode information of expected and received rewards [Nakamura et al., 2008]. Furthermore, several serotonergic projection areas have been associated with different kinds of rewards, which include the NAcc in pleasure processing, the hypothalamus for natural rewards and the amygdala in reward‐learning.
Within the 5‐HT system, the serotonin transporter (SERT) is responsible for reuptake of extracellular 5‐HT into the presynaptic neuron and, hence, represents a major target for pharmacological treatment [Bauer et al., 2007]. In the midbrain raphe nuclei, where 5‐HT neurons originate from, the SERT further modulates serotonergic neurotransmission, since 5‐HT reuptake influences raphe autoinhibition [Tao et al., 2000], which in turn decreases serotonergic cell firing [Lira et al., 2003]. Following the monoamine hypothesis in MDD, reduced 5‐HT levels have been suggested to emerge from high synaptic clearance by increased SERT expression [Meyer, 2007, 2012]. However, previous investigations of regional SERT have led to diverse results. Compared to healthy controls, MDD patients showed either no difference [Meyer et al., 2004], decreases, especially in subjects with DSM‐IV axis I comorbidities [Parsey et al., 2006a] or increases in SERT binding [Cannon et al., 2007], in particular for patients with severe pessimism [Meyer et al., 2004].
In addition to regional differences, recent work demonstrated the usefulness of investigating pathological alterations within entire networks of the brain. This includes the evaluation of functional connectivity [Sheline et al., 2009] and neurotransmitter interactions [Hahn et al., 2010]. Therefore, this study aimed to investigate associations of the serotonergic neurotransmitter system between the midbrain raphe region and projection areas in MDD patients. Specifically, using dorsal raphe SERT binding, we evaluated the relation between this indicator of midbrain 5‐HT neurotransmission and SERT binding in projection areas as well as alterations of these networks in major depression.
METHODS
Participants
Twenty outpatients with major depression were included in this study (mean age ± sd = 41.4 ± 8.7 years, 13 female) as described previously [Lanzenberger et al., 2012]. Briefly, diagnosis was assessed by the structured clinical interview for DSM‐IV (SCID) with average scores at the 17‐item Hamilton scale for depression (HAMD) of 20.0 ± 3.9 at the day of PET measurement. Patients had no comorbid axis II disorder and were drug‐free for at least 3 months (4 months for fluoxetine) at time of PET scanning. Additional exclusion criteria were presence or history of any comorbid axis I disorders except anxiety disorders/symptoms (n = 4). Further sample demographics are provided in Table 1. For comparison, 20 healthy controls were pooled from different studies (mean age ± sd = 31.3 ± 9.7 years, 7 females), which were also part of a recently reported database of 5‐HT binding proteins [Savli et al., 2012]. All subjects underwent standard medical examinations including routine blood and pregnancy tests, electrocardiography as well as assessment of general physical and neurological status. None of the participants reported history of or current substance abuse. Written informed consent was obtained from all subjects after detailed explanation of the study protocol and all subjects received reimbursement for participation. This study was approved by the Ethics Committee of the Medical University of Vienna (ethics nr: 784/2009, 578/2006) and procedures were performed according to the Declaration of Helsinki.
Table 1.
Sample demographics
| MDD patients | Healthy controls | |
|---|---|---|
| Age (years) | 41.4 ± 8.7* | 31.3 ± 9.7 |
| Gender (m/f) | 7/13 | 13/7 |
| Handedness (r/l) | 19/1 | 16/4 |
| Smoking | ||
| Yes/no | 8/12 | 9/11 |
| Cig. per daya | 7.1 ± 5.6 | 12.5 ± 12.5 |
| Age of onset (years) | 34.7 ± 12.7 | — |
| Prior treatment | ||
| SSRI/SNRI/none | 7/1/12 | — |
| Duration (months)a | 31.5 ± 27.8 | — |
| Drug free (months)a | 19.5 ± 25.1 | — |
Data are given as mean ± standard deviation.
For those subjects smoking or receiving prior treatment, respectively. *: P < 0.05 for group differences (assessed with independent samples t tests or χ 2‐tests as appropriate, both two‐tailed). Cig: cigarettes, MDD: major depressive disorder, SNRI: serotonin norepinephrine reuptake inhibitor, SSRI: selective serotonin reuptake inhibitor.
Positron Emission Tomography (PET)
Measurements were carried out with a GE Advance PET scanner (General Electric Medical Systems, Waukesha, WI) at the Department of Nuclear Medicine, Medical University of Vienna, Austria, as described previously [Lanzenberger et al., 2012; Savli et al., 2012]. In short, head movement was minimized using a cushioned polyurethane mold. Following a 5‐min transmission scan (retractable 68Ge rod sources), the 3D dynamic emission measurement was started simultaneously with the intravenous bolus injection of the radioligand [11C]DASB. For radioligand synthesis see Haeusler et al. [2009]. Mean injected dose was 359.79 ± 76.48 MBq, specific activity at time of injection was 34.98 ± 19.05 MBq nmol−1 and radiochemical purity was 98.59% ± 1.14%. Total acquisition time was 90 min and reconstructed images comprised a spatial resolution of 4.36‐mm full‐width at half‐maximum 1 cm next to the center of the field of view (35 slices).
Data Preprocessing and Kinetic Modeling
PET image preprocessing was carried out in SPM8 (Wellcome Trust Center for Neuroimaging, London, UK; http://www.fil.ion.ucl.ac.uk/spm/) using default algorithms and parameters unless otherwise specified [Hahn et al., 2012]. Following realignment to the mean image (quality = 1), scans were summed up across time and spatially normalized (affine regularization = average sized template) to a tracer‐specific template [Savli et al., 2012] within stereotactic MNI‐space (Montreal Neurological Institute). The obtained transformation matrix was then applied to each time frame.
Quantification of serotonin transporter binding potentials (BPND [Innis et al., 2007]) was carried out with the multilinear reference tissue model 2 (MRTM2, [Ichise et al., 2003]) using PMOD 3.3 (PMOD Technologies, Zurich, Switzerland). Here, the individual clearance rate of the radiotracer from the reference region to plasma (k 2') was estimated for each subject from transporter rich and poor regions [Ichise et al., 2003], namely the striatum and cerebellar gray matter (excl. vermis and venous sinus), respectively. The regions of interest (ROI) were taken from an automated anatomical labeling (AAL)‐based atlas [Savli et al., 2012]. The cerebellar gray matter was chosen since it has been identified as optimal reference region for the quantification of the serotonin transporter using [11C]DASB [Meyer 2007; Parsey et al., 2006b]. For the calculation of k 2', the average time activity curves were extracted across left and right hemisphere. Following the implementation within the voxel‐wise quantification tool of PMOD 3.3, the MRTM model is used for an initial estimation of k 2' (maximum error = 10%), whereas this value is subsequently inserted into MRTM2 to compute whole‐brain BPND maps. These voxel‐wise binding potential maps were used for the representation of SERTs in projection areas. On the other hand, a midbrain ROI (0.83 cm3, four axial slices) was used to define SERT binding within the origin of serotonergic neurons from individual BPND maps. This ROI comprised the dorsal part of the raphe nuclei (DRN) [Savli et al., 2012] and was intentionally chosen larger [Cannon et al., 2006] than previously suggested for individual delineation [Kranz et al., 2012] to compensate for uncertainties in spatial normalization. Although the separation between the dorsal and median raphe nuclei is a challenging task, several studies demonstrated accurate delineation with several radioligands [Kranz et al., 2012; Lanzenberger et al., 2012; Son et al., 2012]. The correct DRN delineation and location of the ROI was inspected visually for each subject and by autocorrelation with the BPND maps within each group (see statistics and results sections as well as Supporting Information Fig. S1).
Statistical Analysis
To investigate the association of serotonin transporters between the midbrain DRN and projection areas, voxel‐wise linear regression analysis was computed separately for each group (i.e., patients and controls) in SPM8 as described previously [Hahn et al., 2010]. Here, BPND values of the midbrain DRN region served as independent variable and voxel‐wise BPND maps as dependent variable. The resulting t‐maps were then transformed to R‐maps representing the correlation coefficient using the VBM toolbox 8 (http://dbm.neuro.uni-jena.de/vbm/). Direct comparison between MDD patients and healthy controls was assessed by voxel‐wise ANCOVA in SPM8, evaluating differences in the regression slopes β with the following t‐statistic [Hahn et al., 2010]:
| (1) |
Here, SE(β1−β2) represents the pooled standard error, which is in turn calculated by
| (2) |
Similarly, we tested for differences in correlation coefficients by comparing R values from regions with significant group differences. For this, correlation coefficients R were normalized (R′) with Fisher's r‐to‐z transformation:
| (3) |
Subsequently, a Z‐statistic was computed in MatlabR2010a (The Mathworks, Natick, MA) to compare the transformed correlation coefficients between patients and controls [Hahn et al., 2010]:
| (4) |
with n 1 and n 2 being the sample size of each group. Given the different information inherent to regression and correlation coefficients, we report group differences for both variables. Specifically, β represents the slope of a regression line (i.e., the change in the dependent variable for each unit change in the independent one), whereas R (and R 2) indicate how much of the variance of the dependent variable can be explained by the independent one. Statistics were corrected for multiple comparisons at the voxel‐level using family wise error (FWE) for t‐values and Bonferroni adjustment for Z‐values. However, to provide a more detailed view of the results, we also report findings at P< 0.001 uncorrected voxel‐level with an additional cluster extent threshold of k = 20 voxels to reduce the number of false positives [Hahn et al., 2012]. Furthermore, only voxels with an absolute value of SERT BPND ≥ 0.1 were evaluated to ensure sufficient signal to noise ratio [Savli et al., 2012]. To rule out potentially confounding effects of sex and age, linear regression analyses were computed between these variables and SERT binding potentials for patients and controls separately. Furthermore, sex and age were included as nuisance variables in a subsequent evaluation of group comparisons.
RESULTS
Average SERT BPND values for selected ROIs are provided in Supporting Information Table SI, showing no significant differences between patients and controls (all P > 0.05 corrected). For both groups the strong autocorrelation in the midbrain DRN indicates an accurate spatial normalization and ROI location (Fig. 1a,b, Table 2, Supporting Information Fig. S1). Furthermore, only positive associations between midbrain DRN and projection areas were observed. In healthy subjects, highest correlations were found in the VStr (including the NAcc) and amygdala (P < 0.05 FWE‐corrected) followed by the putamen, caudatus, thalamus and insula (P < 0.001 uncorrected, Fig. 1a, Table 2). In contrast, MDD patients exhibited a markedly different correlation pattern. Associations were most pronounced in the putamen, pallidum, amygdala, (para)hippocampus, thalamus and insula (P < 0.05 FWE‐corrected, Fig. 1b, Table 2).
Figure 1.
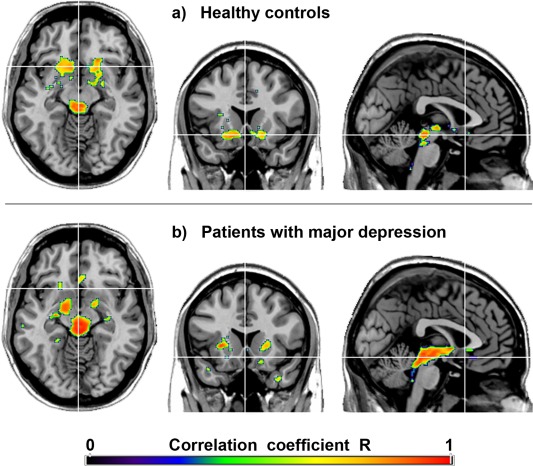
Topological association patterns of the serotonin transporter (SERT) binding potentials (BPND). Voxel‐wise maps represent the correlation coefficients R between SERTs of the midbrain dorsal raphe nucleus and projection areas in healthy subjects (a) and patients with major depression (b). Crosshair is at MNI coordinates x/y/z = 0/17/‐11 mm. P < 0.001 uncorrected for visualization. Left is right. [Color figure can be viewed in the online issue, which is available at http://wileyonlinelibrary.com.]
Table 2.
Regression analysis of the serotonin transporter (SERT) in healthy controls and patients with major depressive disorder (MDD) showed positive associations between midbrain dorsal raphe (DRN) SERT binding and projection areas
| Region | MNI (mm) | Coefficients | ||||
|---|---|---|---|---|---|---|
| x | y | z | t value | Beta | R | |
| Healthy controls | ||||||
| DRN | 4 | −28 | −14 | 12.38***† | 1.29 | 0.95 |
| VStr/Nacc R | 16 | 14 | −14 | 7.55***† | 0.75 | 0.87 |
| VStr/Nacc L | −20 | 24 | −12 | 8.07***† | 0.42 | 0.89 |
| Putamen R | 22 | −8 | −8 | 6.15*** | 0.52 | 0.82 |
| Putamen L | −34 | −12 | 6 | 5.18*** | 0.28 | 0.77 |
| Caudatus R | 20 | 22 | −4 | 6.74***# | 0.48 | 0.85 |
| Caudatus L | −16 | 22 | −6 | 4.55*** | 0.47 | 0.73 |
| Pallidum R | 18 | −2 | −4 | 4.57*** | 0.38 | 0.73 |
| Pallidum L | −18 | 2 | −6 | 6.11*** | 0.43 | 0.82 |
| Amygdala R | 22 | 0 | −10 | 7.02***† | 0.52 | 0.86 |
| Amygdala L | −30 | −4 | −16 | 6.35*** | 0.35 | 0.83 |
| Parahipp L | −36 | −18 | −26 | 4.72*** | 0.22 | 0.74 |
| Thalamus R | 8 | −28 | 0 | 4.77*** | 0.76 | 0.75 |
| Thalamus L | −18 | −26 | 0 | 4.89*** | 0.52 | 0.76 |
| Insula R | 36 | −2 | 16 | 5.18*** | 0.20 | 0.77 |
| Insula L | −34 | 6 | 12 | 4.77*** | 0.17 | 0.75 |
| ACC | −2 | 20 | −10 | 4.72*** | 0.29 | 0.74 |
| Inf Temp R | 36 | 0 | −34 | 5.52*** | 0.21 | 0.79 |
| MDD patients | ||||||
| DRN | −4 | −30 | −12 | 17.88***† | 1.28 | 0.97 |
| VStr/Nacc R | 16 | 14 | −14 | 1.19 | 0.07 | 0.27 |
| VStr/Nacc L | −20 | 22 | −10 | 1.91 | 0.09 | 0.41 |
| Putamen R | 28 | 16 | 0 | 10.38***† | 0.23 | 0.93 |
| Putamen L | −28 | 6 | 8 | 7.75***† | 0.24 | 0.88 |
| Pallidum R | 16 | −4 | 0 | 7.25***† | 0.38 | 0.86 |
| Pallidum L | −14 | −6 | −4 | 6.23***# | 0.34 | 0.83 |
| Amygdala R | 16 | −6 | −12 | 8.13***† | 0.71 | 0.89 |
| Amygdala L | −18 | −2 | −16 | 7.35***† | 0.56 | 0.87 |
| Hippocamp R | 28 | −16 | −14 | 7.59***† | 0.20 | 0.87 |
| Hippocamp L | −30 | −20 | −8 | 7.97***† | 0.16 | 0.88 |
| Parahipp R | 28 | 0 | −30 | 7.31***† | 0.44 | 0.86 |
| Parahipp L | −26 | 4 | −30 | 9.50***† | 0.38 | 0.91 |
| Thalamus R | 12 | −28 | 4 | 8.56***† | 0.67 | 0.90 |
| Thalamus L | −22 | −24 | 10 | 5.66*** | 0.22 | 0.80 |
| Insula R | 32 | 8 | 10 | 9.02***† | 0.21 | 0.90 |
| ACC | −4 | 20 | −4 | 5.82*** | 0.41 | 0.81 |
| Orbitofrontal R | 24 | −18 | 8 | 4.67*** | 0.19 | 0.74 |
| MDD vs. controls | t value (beta) | Z value (R) | ||||
| VStr/Nacc R | 16 | 14 | −14 | 5.85***† | 3.10**† | |
| VStr/Nacc L | −20 | 22 | −10 | 5.07***# | 2.54*† | |
The DRN values represent the peak autocorrelation, which confirms accurate spatial normalization and region of interest location. Significant group differences were restricted to the ventral striatum (VStr) including nucleus accumbens (NAcc). *P < 0.05 uncorrected, **P < 0.01 and ***P < 0.001 uncorrected each with an extent threshold of k = 20 voxels. #P < 0.1 and †P < 0.05 corrected for multiple comparisons with family wise error (t values comparing regression coefficients beta) and Bonferroni‐adjustment (Z values comparing transformed correlation coefficients R'). ACC: anterior cingulate cortex. Inf Temp: inferior temporal gyrus. Parahipp: Parahippocampus.
Direct comparison between depressed patients and healthy controls exhibited differences in SERT associations between the midbrain DRN and projection areas in the right (t = 5.85, P < 0.05 FWE‐corrected) and left VStr incl. NAcc (t = 5.07, P < 0.1 FWE‐corrected, Fig. 2, Table 2). That is, a 4.6–6.1 times lower regression coefficient was found in patients (β = 0.08 and 0.12) compared to controls (β = 0.49 and 0.55 across the entire right and left VStr clusters, respectively). In other words, one unit change in midbrain DRN SERT binding has four to six times less effect on VStr SERT in MDD patients. Similarly, the correlation coefficients in the VStr were 1.7–2.6 times lower in patients (R = 0.33 and 0.49) than in healthy subjects (R = 0.85 and 0.81, P < 0.05 Bonferroni‐corrected). This in turn means that the explained variability (R 2) was 2.7–6.6 fold lower in the patient group. As shown in the maximum intensity projection (Fig. 2a), no further differences were found between MDD patients and healthy controls even at uncorrected significance levels.
Figure 2.
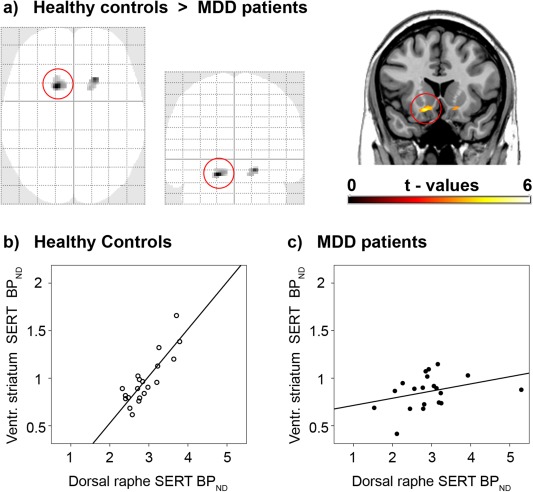
Direct comparison between patients with major depressive disorder (MDD) and healthy controls in serotonin transporter (SERT) associations between the midbrain dorsal raphe nucleus (DRN) and projection areas. (a) As shown in the maximum intensity projection (SPM8 glass brain), voxel‐wise ANCOVA resulted in group differences only within the ventral striatum of both hemispheres (incl. nucleus accumbens, P < 0.001, k > 20 voxels). Coronal plane is at y = 17 mm MNI‐space, left is right. (b,c) Scatter plots are extracted for the entire cluster which is marked by the red circle. Healthy subjects (b, R 2 = 0.72) but not MDD patients (c, R 2 = 0.11) show a strong SERT association between the DRN and the ventral striatum. See Table 2 for details. [Color figure can be viewed in the online issue, which is available at http://wileyonlinelibrary.com.]
Evaluating the influence of age on SERT BPND showed negative correlations only at uncorrected significance levels. For healthy controls, these included the thalamus, insula, medial prefrontal as well as middle and posterior cingulate cortices. In patients associations were found in the caudate nucleus and insula (all P < 0.001). None of the groups showed correlations with age in the midbrain or VStr. This is further illustrated by scatterplots showing no significant association of SERT binding in these regions with age. Similarly, the number of cigarettes smoked per day did not correlate significantly with the SERT BPND in the midbrain or VStr (all P > 0.05, Supporting Information Fig. S2) [Erritzoe et al., 2010]. No significant effects of sex on SERT BPND were found for healthy subjects or patients. Importantly, controlling for the effects of these variables in a subsequent evaluation of group comparisons did not change the above mentioned differences between patients and controls when including sex (t = 5.74 and 5.04 for right and left VStr, respectively) or age (t = 5.56 and 4.79) in the ANCOVA model. Further voxel‐wise evaluation of clinical variables showed no significant correlations between SERT binding in any brain region with duration of illness, duration of treatment and duration of drug free latency (all P > 0.05 FWE‐corrected, the latter two variables were rank‐ordered due to non‐normal distribution).
DISCUSSION
Using an interregional approach we observed positive correlations of the serotonin transporter between the midbrain dorsal raphe nucleus and projection areas in healthy controls and MDD patients. More importantly, patients with major depression exhibited a reduced SERT association in the ventral striatum bilaterally as compared to healthy subjects.
The VStr with the NAcc represents a key region for reward processing [Kranz et al., 2010], which is activated in response to various stimuli such as monetary gains, appetitive cues and sexual arousal. In line with anhedonia being one of the most common symptoms in major depression, dysfunction of the NAcc has been repeatedly demonstrated in these patients [Drevets et al., 1992; Kumar et al., 2008]. Furthermore, the VStr is a major target for deep brain stimulation in MDD patients, leading to decreased symptom severity of anhedonia [Schlaepfer et al., 2008]. In addition to the NAcc, the dorsal raphe nucleus has also been implicated in several aspects of reward such as wanting and liking [Nakamura et al., 2008] as well as reward prediction and omission [Ranade and Mainen, 2009]. Accordingly, DRN dysfunction has been reported in MDD patients in regards to the number of neurons [Michelsen et al., 2008] as well as cell firing in an animal model [Lira et al., 2003].
The VStr/NAcc furthermore experiences strong serotonergic innervation by the DRN [Hornung, 2010]. This structural connection is complemented by a possible regulatory model of the serotonergic neurotransmitter system. Increases in DRN serotonin transporters imply a higher clearance of extracellular 5‐HT [Tao et al., 2000], which leads to reduced activation of inhibitory serotonin‐1A autoreceptors. This in turn increases raphe cell firing [Lira et al., 2003], which is followed by enhanced serotonin synthesis [Hillegaart et al., 1990] and higher extracellular 5‐HT levels at nerve terminals [Bundgaard et al., 2006]. According to the “use it or lose it” theory [Steiner et al., 2008], this finally leads to increased SERT expression in projection areas [Milak et al., 2005] due to its regulation by synaptic 5‐HT via internalization [Ramamoorthy and Blakely, 1999]. The model is further supported by our finding of only positive SERT correlations between the DRN and projection areas and recent simulation studies [Best et al., 2010]. Interestingly, the here observed associations were stronger than reported previously [Bose et al., 2011], whereas these differences might be attributable to methodological issues. Instead of a region of interest analysis we computed voxel‐wise SERT associations between the DRN and projection areas. Such a whole‐brain analysis carries the benefit of topological specificity, which might be lost in a region of interest approach. This is especially the case if the ROIs cover large brain areas but the effects are restricted only to subparts, which in turn may increase false negative results. Furthermore, the VStr was previously not investigated in this context [Bose et al., 2011], whereas voxel‐wise analyses do not require an a priori choice of the ROIs. Hence, voxel‐wise approaches avoid disadvantages regarding the size, shape, location or selection of the regions. However, these advantages go along with the trade‐off that voxel‐wise analyses require stronger statistical corrections for multiple comparisons. Voxel‐wise approaches are further dependent on accurate spatial normalization, which can be achieved most precisely with structural MRI scans. As MR images were however not available in the current study, our results may need to be confirmed by future investigations. In that sense, potential registration problems accompanied by spatial normalization can be avoided best through manual ROI delineation based on structural MRI scans of each individual subject.
The proposed modulatory pathway seems to be altered in MDD patients, which further underlines the involvement of the NAcc, the DRN and the serotonergic system in reward processing [Kranz et al., 2010]. Specifically, our finding suggests a disturbed regulation of the NAcc by the DRN via the serotonin transporter. The missing association in our MDD patients, however, suggests that SERT binding levels in projection areas are not only altered [Meyer, 2007, 2012] since this might still yield a correlation with DRN binding (i.e., a simple shift of the regression line). Instead, our data indicates that the interaction between brain areas adds important information to regional approaches. Considering that only SERT binding was assessed in this study, it is however possible that the observed differences in MDD patients are also the result of alterations in other binding proteins regulating serotonergic neurotransmission. In addition to midbrain SERT [Lira et al., 2003], this may comprise a major modulator of DRN cell firing, namely serotonin‐1A autoreceptors [Parsey et al., 2010]. Furthermore, within the VStr, alterations have been reported for three different proteins regulating extracellular 5‐HT levels. This includes decreases in serotonin‐1B autoreceptor binding [Murrough et al., 2011] and function [Svenningsson et al., 2006] but increases in monoamine oxidase A binding [Meyer et al., 2006] and again the serotonin transporter [Cannon et al., 2007; Meyer et al., 2004]. Hence, it seems that alterations are caused by a complex interaction of several action sites of the serotonergic signaling pathway. Furthermore, these differences may also extend to interactions with other neurotransmitters such as dopamine [Yawata et al., 2012]. The dopamine system plays a central role in the processing of reward in MDD [Nestler and Carlezon, 2006] and its neurotransmission has been suggested to be partly regulated by 5‐HT [Alex and Pehek, 2007]. Further interactions within the NAcc include cholinergic interneurons [Warner‐Schmidt et al., 2012] and the facilitation of beta‐endorphin release by 5‐HT [Zangen et al., 1999]. In summary, more work is required to identify the exact mechanism of this alteration. As a first step, we identified the disturbance of a major 5‐HT pathway in MDD through this interregional approach, which emphasizes the importance of investigating neurotransmitter systems on a network level.
One limitation of the current study is that associations could only be investigated for the entire group rather than individual subjects. Such group analyses have however been proven useful for the evaluation of e.g., structural [Bullmore and Sporns, 2009] and metabolic connectivity [Morbelli et al., 2012]. Here, we aimed to apply the concept of connectivity to a neurotransmitter level [Hahn et al., 2010] by using a priori known anatomical connections, namely projections of 5‐HT neurons originating in the raphe nuclei [Hornung, 2010]. Although the dorsal and median raphe nuclei (MRN) do partly overlap in the rostro‐caudal axis, the majority of serotonin‐neurons (78%) of the DRN are located in the rostral subpart at the level of the trochlear nucleus [Baker et al., 1990, 1991b]. On the other hand, serotonin‐synthesizing neurons within the MRN are mainly confined to the pontine tegmentum below the decussation of the superior cerebellar peduncle [Baker et al., 1991a]. Hence, these differences in the location of serotonin neurons between the MRN and DRN seem to enable the differentiation of the two nuclei with PET, even with a spatial resolution of several millimeters [Kranz et al., 2012; Lanzenberger et al., 2012; Son et al., 2012]. Regarding the sample, the number of subjects is comparable to previous PET studies [Cannon et al., 2007; Meyer et al., 2004] but still rather low. Hence, it is possible that less pronounced alterations in MDD patients were missed in this work, whereas the sample size still enabled a robust detection of major group differences. This in turn required to pool as many control subjects as possible from different studies which in turn lead to the suboptimal matching regarding age and gender distributions between patients and controls. However, age showed significant correlations with SERT binding only at uncorrected significance levels (but not in the midbrain or VStr) and more importantly adjusting for age and sex did not change the findings of this study. Finally, no arterial blood samples were available to quantify SERTs independent of a reference region. This may however be less of a problem for two reasons. First, even a 50% difference in cerebellar specific binding between subjects leads to only 3.5% bias for group comparisons in target regions [Meyer, 2007]. Second, we investigated the associations between regions rather than binding alterations within single areas. Therefore, group differences in the reference region affect SERT binding in both midbrain DRN and projection areas, which in turn would only shift the regression line but would not change the association itself [Hahn et al., 2010]. Similarly, an underestimation of SERT binding caused by partial volume effects (PVE) is unlikely to affect the interregional associations. Although small structures such as the raphe nuclei suffer from PVE, a correction may only induce a rather constant elevation of raphe binding in all subjects. This effect has also been observed for the serotonin‐1A receptor antagonist [carbonyl‐11C]WAY‐100635 [Hahn et al., 2012], which shows even more pronounced PVE in the raphe than [11C]DASB. Nevertheless, we cannot exclude that the observed group differences may at least in part be attributable to volumetric variation of the raphe nucleus.
In conclusion, the reduced serotonin transporter association between the midbrain dorsal raphe and the ventral striatum/nucleus accumbens complement the biological mechanisms of anhedonia in major depression and further underlines the importance of the serotonergic system in reward processing. In addition to previously reported regional alterations of the serotonin transporter, our interregional approach provides important information on a neurotransmitter network level.
Supporting information
Supplementary Information Figures Table Legends
Supplementary Information Figure S1.
Supplementary Information Figure S2.
Supplementary Information Table S1.
ACKNOWLEDGMENTS
The authors are grateful to Elena Akimova, Christoph Spindelegger, Martin Fink, and Dietmar Winkler for medical support and the native‐speaker Marie Spies for English proofreading.
Conflict of interest: Without any relevance to this work, S. Kasper declares that he has received grant/research support from Eli Lilly, Lundbeck A/S, Bristol‐Myers Squibb, Servier, Sepracor, GlaxoSmithKline, Organon, and has served as a consultant or on advisory boards for AstraZeneca, Austrian Science Found, Bristol‐Myers Squibb, GlaxoSmithKline, Eli Lily, Lundbeck A/S, Pfizer, Organon, Sepracor, Janssen, and Novartis, and has served on speakers' bureaus for AstraZeneca, Eli Lilly, Lundbeck A/S, Servier, Sepracor and Janssen. R. Lanzenberger received travel grants or conference speaker honoraria from AstraZeneca, Lundbeck A/S, and Roche Austria. M. Mitterhauser and W. Wadsak received speaker honoraria from Bayer. Parts of this study were presented at the 19th European Psychiatric Association (EPA) Congress, Vienna, the 10th World Congress of Biological Psychiatry (WFSBP), Prague and the 26th Congress of the European College of Neuropsychopharmacology (ECNP), Barcelona.
Andreas Hahn was recipient of a DOC‐fellowship of the Austrian Academy of Sciences at the Department of Psychiatry and Psychotherapy. This study was supported by funds from the Oesterreichische Nationalbank (Anniversary Fund, project numbers: 13214, 13675) to Rupert Lanzenberger and Markus Mitterhauser, and partly by an investigator‐initiated and unrestricted research grant from H. Lundbeck A/S, Denmark, to Siegfried Kasper
REFERENCES
- Alex KD, Pehek EA (2007): Pharmacologic mechanisms of serotonergic regulation of dopamine neurotransmission. Pharmacol Ther 113:296–320. [DOI] [PMC free article] [PubMed] [Google Scholar]
- Baker KG, Halliday GM, Tork I (1990): Cytoarchitecture of the human dorsal raphe nucleus. J Comp Neurol 301:147–161. [DOI] [PubMed] [Google Scholar]
- Baker KG, Halliday GM, Halasz P, Hornung JP, Geffen LB, Cotton RG, Tork I (1991a): Cytoarchitecture of serotonin‐synthesizing neurons in the pontine tegmentum of the human brain. Synapse 7:301–320. [DOI] [PubMed] [Google Scholar]
- Baker KG, Halliday GM, Hornung JP, Geffen LB, Cotton RG, Tork I (1991b): Distribution, morphology and number of monoamine‐synthesizing and substance P‐containing neurons in the human dorsal raphe nucleus. Neuroscience 42:757–775. [DOI] [PubMed] [Google Scholar]
- Bauer M, Bschor T, Pfennig A, Whybrow PC, Angst J, Versiani M, Moller HJ (2007): World federation of societies of biological psychiatry (WFSBP) guidelines for biological treatment of unipolar depressive disorders in primary care. World J Biol Psychiatry 8:67–104. [DOI] [PubMed] [Google Scholar]
- Berridge KC, Kringelbach ML (2008): Affective neuroscience of pleasure: Reward in humans and animals. Psychopharmacology (Berl) 199:457–480. [DOI] [PMC free article] [PubMed] [Google Scholar]
- Best J, Nijhout HF, Reed M (2010): Serotonin synthesis, release and reuptake in terminals: A mathematical model. Theor Biol Med Model 7:34. [DOI] [PMC free article] [PubMed] [Google Scholar]
- Bose SK, Mehta MA, Selvaraj S, Howes OD, Hinz R, Rabiner EA, Grasby PM, Turkheimer FE, Murthy V (2011): Presynaptic 5‐HT1A is related to 5‐HTT receptor density in the human brain. Neuropsychopharmacology 36:2258–2265. [DOI] [PMC free article] [PubMed] [Google Scholar]
- Bullmore E, Sporns O (2009): Complex brain networks: Graph theoretical analysis of structural and functional systems. Nat Rev Neurosci 10:186–198. [DOI] [PubMed] [Google Scholar]
- Bundgaard C, Larsen F, Jorgensen M, Gabrielsson J (2006): Mechanistic model of acute autoinhibitory feedback action after administration of SSRIs in rats: Application to escitalopram‐induced effects on brain serotonin levels. Eur J Pharm Sci 29:394–404. [DOI] [PubMed] [Google Scholar]
- Cannon DM, Ichise M, Fromm SJ, Nugent AC, Rollis D, Gandhi SK, Klaver JM, Charney DS, Manji HK, Drevets WC (2006): Serotonin transporter binding in bipolar disorder assessed using [11C]DASB and positron emission tomography. Biol Psychiatry 60:207–217. [DOI] [PubMed] [Google Scholar]
- Cannon DM, Ichise M, Rollis D, Klaver JM, Gandhi SK, Charney DS, Manji HK, Drevets WC (2007): Elevated serotonin transporter binding in major depressive disorder assessed using positron emission tomography and [11C]DASB; comparison with bipolar disorder. Biol Psychiatry 62:870–877. [DOI] [PubMed] [Google Scholar]
- Drevets WC, Videen TO, Price JL, Preskorn SH, Carmichael ST, Raichle ME (1992): A functional anatomical study of unipolar depression. J Neurosci 12:3628–3641. [DOI] [PMC free article] [PubMed] [Google Scholar]
- Dunlop BW, Nemeroff CB (2007): The role of dopamine in the pathophysiology of depression. Arch Gen Psychiatry 64:327–337. [DOI] [PubMed] [Google Scholar]
- Erritzoe D, Frokjaer VG, Haahr MT, Kalbitzer J, Svarer C, Holst KK, Hansen DL, Jernigan TL, Lehel S, Knudsen GM (2010): Cerebral serotonin transporter binding is inversely related to body mass index. Neuroimage 52:284–289. [DOI] [PubMed] [Google Scholar]
- Haeusler D, Mien LK, Nics L, Ungersboeck J, Philippe C, Lanzenberger RR, Kletter K, Dudczak R, Mitterhauser M, Wadsak W (2009): Simple and rapid preparation of [11C]DASB with high quality and reliability for routine applications. Appl Radiat Isot 67:1654–1660. [DOI] [PubMed] [Google Scholar]
- Hahn A, Lanzenberger R, Wadsak W, Spindelegger C, Moser U, Mien L‐K, Mitterhauser M, Kasper S (2010): Escitalopram enhances the association of serotonin‐1A autoreceptors to heteroreceptors in anxiety disorders. J Neurosci 30:14482–14489. [DOI] [PMC free article] [PubMed] [Google Scholar]
- Hahn A, Wadsak W, Windischberger C, Baldinger P, Hoflich AS, Losak J, Nics L, Philippe C, Kranz GS, Kraus C, Mitterhauser M, Karanikas G, Kasper S, Lanzenberger R (2012): Differential modulation of the default mode network via serotonin‐1A receptors. Proc Natl Acad Sci USA 109:2619–2624. [DOI] [PMC free article] [PubMed] [Google Scholar]
- Hasler G, Drevets WC, Manji HK, Charney DS (2004): Discovering endophenotypes for major depression. Neuropsychopharmacology 29:1765–1781. [DOI] [PubMed] [Google Scholar]
- Hillegaart V, Hjorth S, Ahlenius S (1990): Effects of 5‐HT and 8‐OH‐DPAT on forebrain monoamine synthesis after local application into the median and dorsal raphe nuclei of the rat. J Neural Transm Gen Sect 81:131–145. [DOI] [PubMed] [Google Scholar]
- Hornung JP (2010): The neuroanatomy of the serotonergic system In: Müller CP, Jacobs BL, editors. Handbook of the behavioral neurobiology of serotonin. London: Academic Press; pp 51–64. [Google Scholar]
- Ichise M, Liow JS, Lu JQ, Takano A, Model K, Toyama H, Suhara T, Suzuki K, Innis RB, Carson RE (2003): Linearized reference tissue parametric imaging methods: Application to [11C]DASB positron emission tomography studies of the serotonin transporter in human brain. J Cereb Blood Flow Metab 23:1096–1112. [DOI] [PubMed] [Google Scholar]
- Innis RB, Cunningham VJ, Delforge J, Fujita M, Gjedde A, Gunn RN, Holden J, Houle S, Huang SC, Ichise M, Iida H, Ito H, Kimura Y, Koeppe RA, Knudsen GM, Knuuti J, Lammertsma AA, Laruelle M, Logan J, Maguire RP, Mintun MA, Morris ED, Parsey R, Price JC, Slifstein M, Sossi V, Suhara T, Votaw JR, Wong DF, Carson RE (2007): Consensus nomenclature for in vivo imaging of reversibly binding radioligands. J Cereb Blood Flow Metab 27:1533–1539. [DOI] [PubMed] [Google Scholar]
- Kranz GS, Kasper S, Lanzenberger R (2010): Reward and the serotonergic system. Neuroscience 166:1023–1035. [DOI] [PubMed] [Google Scholar]
- Kranz GS, Hahn A, Savli M, Lanzenberger R (2012): Challenges in the differentiation of midbrain raphe nuclei in neuroimaging research. Proc Natl Acad Sci USA 109:E2000. [DOI] [PMC free article] [PubMed] [Google Scholar]
- Kumar P, Waiter G, Ahearn T, Milders M, Reid I, Steele JD (2008): Abnormal temporal difference reward‐learning signals in major depression. Brain 131:2084–2093. [DOI] [PubMed] [Google Scholar]
- Lanzenberger R, Kranz GS, Haeusler D, Akimova E, Savli M, Hahn A, Mitterhauser M, Spindelegger C, Philippe C, Fink M, Wadsak W, Karanikas G, Kasper S (2012): Prediction of SSRI treatment response in major depression based on serotonin transporter interplay between median raphe nucleus and projection areas. Neuroimage 63:874–881. [DOI] [PubMed] [Google Scholar]
- Lira A, Zhou M, Castanon N, Ansorge MS, Gordon JA, Francis JH, Bradley‐Moore M, Lira J, Underwood MD, Arango V, Kung HF, Hofer MA, Hen R, Gingrich JA (2003): Altered depression‐related behaviors and functional changes in the dorsal raphe nucleus of serotonin transporter‐deficient mice. Biol Psychiatry 54:960–971. [DOI] [PubMed] [Google Scholar]
- Meyer JH (2007): Imaging the serotonin transporter during major depressive disorder and antidepressant treatment. J Psychiatry Neurosci 32:86–102. [PMC free article] [PubMed] [Google Scholar]
- Meyer JH (2012): Neuroimaging markers of cellular function in major depressive disorder: Implications for therapeutics, personalized medicine, and prevention. Clin Pharmacol Ther 91:201–214. [DOI] [PubMed] [Google Scholar]
- Meyer JH, Houle S, Sagrati S, Carella A, Hussey DF, Ginovart N, Goulding V, Kennedy J, Wilson AA (2004): Brain serotonin transporter binding potential measured with carbon 11‐labeled DASB positron emission tomography: Effects of major depressive episodes and severity of dysfunctional attitudes. Arch Gen Psychiatry 61:1271–1279. [DOI] [PubMed] [Google Scholar]
- Meyer JH, Ginovart N, Boovariwala A, Sagrati S, Hussey D, Garcia A, Young T, Praschak‐Rieder N, Wilson AA, Houle S (2006): Elevated monoamine oxidase a levels in the brain: An explanation for the monoamine imbalance of major depression. Arch Gen Psychiatry 63:1209–1216. [DOI] [PubMed] [Google Scholar]
- Michelsen KA, Prickaerts J, Steinbusch HW (2008): The dorsal raphe nucleus and serotonin: Implications for neuroplasticity linked to major depression and Alzheimer's disease. Prog Brain Res 172:233–264. [DOI] [PubMed] [Google Scholar]
- Milak MS, Ogden RT, Vinocur DN, Van Heertum RL, Cooper TB, Mann JJ, Parsey RV (2005): Effects of tryptophan depletion on the binding of [11C]‐DASB to the serotonin transporter in baboons: Response to acute serotonin deficiency. Biol Psychiatry 57:102–106. [DOI] [PubMed] [Google Scholar]
- Morbelli S, Drzezga A, Perneczky R, Frisoni GB, Caroli A, van Berckel BN, Ossenkoppele R, Guedj E, Didic M, Brugnolo A, Sambuceti G, Pagani M, Salmon E, Nobili F (2012): Resting metabolic connectivity in prodromal Alzheimer's disease. A European Alzheimer Disease Consortium (EADC) project. Neurobiol Aging 33:2533–2550. [DOI] [PubMed] [Google Scholar]
- Murrough JW, Henry S, Hu J, Gallezot JD, Planeta‐Wilson B, Neumaier JF, Neumeister A (2011): Reduced ventral striatal/ventral pallidal serotonin1B receptor binding potential in major depressive disorder. Psychopharmacology (Berl) 213:547–553. [DOI] [PMC free article] [PubMed] [Google Scholar]
- Nakamura K, Matsumoto M, Hikosaka O (2008): Reward‐dependent modulation of neuronal activity in the primate dorsal raphe nucleus. J Neurosci 28:5331–5343. [DOI] [PMC free article] [PubMed] [Google Scholar]
- Nestler EJ, Carlezon WA Jr. (2006): The mesolimbic dopamine reward circuit in depression. Biol Psychiatry 59:1151–1159. [DOI] [PubMed] [Google Scholar]
- Parsey RV, Hastings RS, Oquendo MA, Huang YY, Simpson N, Arcement J, Huang Y, Ogden RT, Van Heertum RL, Arango V, Mann JJ (2006a): Lower serotonin transporter binding potential in the human brain during major depressive episodes. Am J Psychiatry 163:52–58. [DOI] [PubMed] [Google Scholar]
- Parsey RV, Kent JM, Oquendo MA, Richards MC, Pratap M, Cooper TB, Arango V, Mann JJ (2006b): Acute occupancy of brain serotonin transporter by sertraline as measured by [11C]DASB and positron emission tomography. Biol Psychiatry 59:821–828. [DOI] [PubMed] [Google Scholar]
- Parsey RV, Ogden RT, Miller JM, Tin A, Hesselgrave N, Goldstein E, Mikhno A, Milak M, Zanderigo F, Sullivan GM, Oquendo MA, Mann JJ (2010): Higher serotonin 1A binding in a second major depression cohort: Modeling and reference region considerations. Biol Psychiatry 68:170–178. [DOI] [PMC free article] [PubMed] [Google Scholar]
- Pizzagalli DA, Jahn AL, O'Shea JP (2005): Toward an objective characterization of an anhedonic phenotype: A signal‐detection approach. Biol Psychiatry 57:319–327. [DOI] [PMC free article] [PubMed] [Google Scholar]
- Pizzagalli DA, Holmes AJ, Dillon DG, Goetz EL, Birk JL, Bogdan R, Dougherty DD, Iosifescu DV, Rauch SL, Fava M (2009): Reduced caudate and nucleus accumbens response to rewards in unmedicated individuals with major depressive disorder. Am J Psychiatry 166:702–710. [DOI] [PMC free article] [PubMed] [Google Scholar]
- Ramamoorthy S, Blakely RD (1999): Phosphorylation and sequestration of serotonin transporters differentially modulated by psychostimulants. Science 285:763–766. [DOI] [PubMed] [Google Scholar]
- Ranade SP, Mainen ZF (2009): Transient firing of dorsal raphe neurons encodes diverse and specific sensory, motor, and reward events. J Neurophysiol 102:3026–3037. [DOI] [PubMed] [Google Scholar]
- Savitz JB, Drevets WC (2013): Neuroreceptor imaging in depression. Neurobiol Dis 52:49–65. [DOI] [PubMed] [Google Scholar]
- Savli M, Bauer A, Mitterhauser M, Ding YS, Hahn A, Kroll T, Neumeister A, Haeusler D, Ungersbock J, Henry S, Isfahani SA, Rattay F, Wadsak W, Kasper S, Lanzenberger R (2012): Normative database of the serotonergic system in healthy subjects using multi‐tracer PET. NeuroImage 63:447–459. [DOI] [PubMed] [Google Scholar]
- Schlaepfer TE, Cohen MX, Frick C, Kosel M, Brodesser D, Axmacher N, Joe AY, Kreft M, Lenartz D, Sturm V (2008): Deep brain stimulation to reward circuitry alleviates anhedonia in refractory major depression. Neuropsychopharmacology 33:368–377. [DOI] [PubMed] [Google Scholar]
- Sheline YI, Barch DM, Price JL, Rundle MM, Vaishnavi SN, Snyder AZ, Mintun MA, Wang S, Coalson RS, Raichle ME (2009): The default mode network and self‐referential processes in depression. Proc Natl Acad Sci USA 106:1942–1947. [DOI] [PMC free article] [PubMed] [Google Scholar]
- Son YD, Cho ZH, Kim HK, Choi EJ, Lee SY, Chi JG, Park CW, Kim YB (2012): Glucose metabolism of the midline nuclei raphe in the brainstem observed by PET‐MRI fusion imaging. Neuroimage 59:1094–1097. [DOI] [PubMed] [Google Scholar]
- Steiner JA, Carneiro AM, Blakely RD (2008): Going with the flow: Trafficking‐dependent and ‐independent regulation of serotonin transport. Traffic 9:1393–1402. [DOI] [PMC free article] [PubMed] [Google Scholar]
- Svenningsson P, Chergui K, Rachleff I, Flajolet M, Zhang X, El Yacoubi M, Vaugeois JM, Nomikos GG, Greengard P (2006): Alterations in 5‐HT1B receptor function by p11 in depression‐like states. Science 311:77–80. [DOI] [PubMed] [Google Scholar]
- Tao R, Ma Z, Auerbach SB (2000): Differential effect of local infusion of serotonin reuptake inhibitors in the raphe versus forebrain and the role of depolarization‐induced release in increased extracellular serotonin. J Pharmacol Exp Ther 294:571–579. [PubMed] [Google Scholar]
- Warner‐Schmidt JL, Schmidt EF, Marshall JJ, Rubin AJ, Arango‐Lievano M, Kaplitt MG, Ibanez‐Tallon I, Heintz N, Greengard P (2012): Cholinergic interneurons in the nucleus accumbens regulate depression‐like behavior. Proc Natl Acad Sci USA 109:11360–11365. [DOI] [PMC free article] [PubMed] [Google Scholar]
- Yawata S, Yamaguchi T, Danjo T, Hikida T, Nakanishi S (2012): Pathway‐specific control of reward learning and its flexibility via selective dopamine receptors in the nucleus accumbens. Proc Natl Acad Sci USA 109:12764–12769. [DOI] [PMC free article] [PubMed] [Google Scholar]
- Zangen A, Nakash R, Yadid G (1999): Serotonin‐mediated increases in the extracellular levels of beta‐endorphin in the arcuate nucleus and nucleus accumbens: A microdialysis study. J Neurochem 73:2569–2574. [DOI] [PubMed] [Google Scholar]
Associated Data
This section collects any data citations, data availability statements, or supplementary materials included in this article.
Supplementary Materials
Supplementary Information Figures Table Legends
Supplementary Information Figure S1.
Supplementary Information Figure S2.
Supplementary Information Table S1.