

Abstract
Functional neuroimaging has been widely used to study the activation patterns of the motor network in patients with Parkinson's disease (PD), but these studies have yielded conflicting results. This meta‐analysis of previous neuroimaging studies was performed to identify patterns of abnormal movement‐related activation in PD that were consistent across studies. We applied activation likelihood estimation (ALE) of functional neuroimaging studies probing motor function in patients with PD. The meta‐analysis encompassed data from 283 patients with PD reported in 24 functional neuroimaging studies and yielded consistent alterations in neural activity in patients with PD. Differences in cortical activation between PD patients and healthy controls converged in a left‐lateralized fronto‐parietal network comprising the presupplementary motor area, primary motor cortex, inferior parietal cortex, and superior parietal lobule. Both, increases as well as decreases in motor cortical activity, which were related to differences in movement timing and selection in the applied motor tasks, were reported in these cortical areas. In the basal ganglia, PD patients expressed a decrease of motor activation in the posterior motor putamen, which improved with dopaminergic medication. The likelihood of detecting a decrease in putaminal activity increased with motor impairment. This reduced motor activation of the posterior putamen across previous neuroimaging studies indicates that nigrostriatal dopaminergic denervation affects neural processing in the denervated striatal motor territory. In contrast, fronto‐parietal motor areas display both increases as well as decreases in movement related activation. This points to a more complex relationship between altered cortical physiology and nigrostriatal dopaminergic denervation in PD. Hum Brain Mapp 35:3227–3237, 2014. © 2013 Wiley Periodicals, Inc.
Keywords: Parkinson's disease, functional magnetic resonance imaging, positron emission tomography, meta analysis, motor
INTRODUCTION
Parkinson's disease is a chronic disabling neurological disease characterized by akinesia, rigidity, tremor, and postural instability [Jankovic, 2008]. The pathophysiological hallmark of PD is progressing degeneration of nigrostriatal dopaminergic neurons [Lang and Lozano, 1998a,b], but it remains elusive exactly how the loss of dopaminergic neurons leads to the clinical motor symptoms of PD. To address this question, functional neuroimaging studies including functional magnetic resonance imaging (fMRI) and H2O‐positron emission tomography (H2O‐PET) have been used in numerous studies over the last two decades. These studies have reported changes in cortical motor activity in PD, yet the distribution as well as the direction of regional activation changes varied across studies [Grafton, 2004, Rowe and Siebner, 2012, Stoessl et al., 2011]. This raises the question whether functional neuroimaging studies are useful in revealing general mechanisms underlying motor impairment in PD, or if the observed activation patterns are specific to the patient group or motor task tested in the respective experiment. In the current study, we aimed to overcome typical constraints and limitations of functional neuroimaging studies such as small sample sizes, and heterogeneity of the studied patient group by using a coordinate‐based quantitative meta‐analysis approach. This enabled us to identify core features of abnormal motor activation in PD, which are consistently expressed across a range of motor tasks and patient cohorts.
METHODS
Literature Search and Study Selection
A literature search was conducted on Pubmed (http://www.pubmed.org) using the following search strings: “Parkinson's disease” OR “Parkinson disease” OR “Parkinsons disease” AND “functional magnetic resonance” OR “fMRI” OR “positron emission tomography” OR “PET.” This search resulted in 1,698 studies on the final search on January 18, 2013. Further studies were identified through review papers and reference tracing of retrieved articles. Only fMRI or H2O‐PET studies that used motor paradigms and that were written in English language were screened for eligibility. Exclusion criteria were as follows:
review articles reporting no original data,
studies testing passive movements, motor learning or executive control (e.g., task switching), since these tasks assess neural processes that are distinct to movement execution,
motor tasks were tested against each other rather than against baseline or a control task (e.g., fixation),
the contrasts “PD OFF medication vs. healthy controls,” “PD ON medication vs. healthy controls,” or “PD ON medication vs. PD OFF medication” were not reported,
analyses were based on regions of interest (i.e., not whole brain analyses), multivariate analyses or covariance analyses,
less than 6 PD patients were included,
studies in which PD patients were treated with deep brain stimulation or other drugs than levodopa (e.g., apomorphine), because these treatments induce distinct effects on the sensorimotor system in PD [Bradberry et al., 2012, Ko et al., 2013].
Another study [Schwingenschuh et al., 2013] had to be excluded because of a significant age difference between the PD and control group. If a publication did not report the group stereotactic coordinates of activation maxima, we contacted the authors by email. This procedure resulted in 24 studies that were included in the meta‐analysis (Table 1) [Baglio et al., 2011; Buhmann et al., 2003; Cerasa et al., 2006; Eckert et al., 2006; Gonzalez‐Garcia et al., 2011; Haslinger et al., 2001; Holiga et al., 2012; Hughes et al.; 2010, Katschnig et al., 2011; Kraft et al., 2009; Maillet et al., 2012; Mallol et al., 2007; Mattay et al., 2002; Payoux et al., 2010; Pinto et al., 2011; Rowe et al., 2002; Sabatini et al., 2000; Samuel et al., 1997; Tessa et al., 2010, 2012, 2013; Turner et al., 2003; Wu and Hallett, 2005; Wu et al., 2010].
Table 1.
Studies included in the meta‐analysis
| Study | Modality | # PD | # C | UPDRS‐III OFF | UPDRS‐III ON | Age PD | Age C | # Foci | Contrast |
|---|---|---|---|---|---|---|---|---|---|
| Baglio et al., 2011 | fMRI | 15 | 11 | 21.5 | 66.5 | 66.9 | 6 | ON vs. C | |
| Task: | Button presses with right index finger (timing: external, selection: external) | ||||||||
| Buhmann et al., 2003 | fMRI | 8 | 10 | 54 | 57 | 2 | ON vs. OFF | ||
| Task: | Random finger opposition task at 0.33 Hz with right and left hand (timing: external, selection: internal) | ||||||||
| Cerasa et al., 2006 | fMRI | 10 | 11 | 27.5 | 64.2 | 63.4 | 8 | OFF vs. C | |
| Task: | Synchronized tapping with right index finger at 1.33 Hz (timing: external, selection: external) | ||||||||
| fMRI | 10 | 11 | 27.5 | 64.2 | 63.4 | 3 | OFF vs. C | ||
| Task: | Continuation of the tapping with right index finger without stimulus (timing: internal, selection: external) | ||||||||
| Eckert et al., 2006 | fMRI | 9 | 9 | 20.6 | 10.7 | 63.3 | 60.6 | 18 | OFF vs. C |
| fMRI | 9 | 9 | 20.6 | 10.7 | 63.3 | 60.6 | 9 | ON vs. C | |
| fMRI | 9 | 9 | 20.6 | 10.7 | 63.3 | 60.6 | 4 | ON vs. OFF | |
| Task: | Opening and closing of right fist at ∼1 Hz (timing: internal, selection: external) | ||||||||
| Gonzalez‐Garcia et al., 2011 | fMRI | 17 | 10 | 41 | 64.4 | 8 | ON vs. C | ||
| Task: | Button presses with right and left hand in pre‐defined order (timing: external, selection: external) | ||||||||
| fMRI | 17 | 10 | 41 | 64.4 | 5 | ON vs. C | |||
| Task: | Button presses with right and left hand in random order (timing: external, selection: external) | ||||||||
| Haslinger et al., 2001 | fMRI | 8 | 8 | 15.8 | 11.8 | 60.8 | 54.4 | 7 | OFF vs. C |
| fMRI | 8 | 8 | 15.8 | 11.8 | 60.8 | 54.4 | 8 | ON vs. C | |
| fMRI | 8 | 8 | 15.8 | 11.8 | 60.8 | 54.4 | 10 | ON vs. OFF | |
| Task: | Joystick‐movements with right hand with four spatial dof (timing: external, selection: internal) | ||||||||
| Holiga et al., 2012 | fMRI | 12 | 33.5 | 9.6 | 56 | 5 | ON vs. OFF | ||
| Task: | Index‐to‐thumb opposition movements with right and left hand at 1 Hz (timing: external, selection: external) | ||||||||
| Hughes et al., 2010 | fMRI | 16 | 15 | 31.3 | 18.9 | 63.9 | 66.5 | 10 | ON vs. C |
| Task: | Specified and chosen button presses with right hand (timing: external, selection: both) | ||||||||
| Katschnig et al., 2011 | fMRI | 20 | 20 | 37.9 | 66.8 | 62.3 | 2 | OFF vs. C | |
| Task: | Dorsiflexion of right and left ankle at 1 Hz (timing: external, selection: external) | ||||||||
| Kraft et al., 2009 | fMRI | 12 | 12 | 21 | 13.9 | 60.8 | 53 | 12 | OFF vs. C |
| fMRI | 12 | 12 | 21 | 13.9 | 60.8 | 53 | 8 | ON vs. C | |
| fMRI | 12 | 12 | 21 | 13.9 | 60.8 | 53 | 4 | ON vs. OFF | |
| Task: | Grip‐force task with right and left hand simultaneously (timing: external, selection: external) | ||||||||
| fMRI | 12 | 12 | 21 | 13.9 | 60.8 | 53 | 13 | OFF vs. C | |
| fMRI | 12 | 12 | 21 | 13.9 | 60.8 | 53 | 4 | ON vs. C | |
| fMRI | 12 | 12 | 21 | 13.9 | 60.8 | 53 | 4 | ON vs. OFF | |
| Task: | Grip‐force task with right and left hand alternating (timing: external, selection: external) | ||||||||
| Maillet et al., 2012 | fMRI | 12 | 40.3 | 10 | 59.8 | 2 | ON vs. OFF | ||
| Task: | Joystick‐movements with right hand with four spatial dof at 0.5 Hz (timing: external, selection: internal) | ||||||||
| Mallol et al., 2007 | fMRI | 13 | 11 | 22.6 | 64.9 | 61.9 | 13 | OFF vs. C | |
| Task: | Finger‐to‐thumb opposition and rotating movements of right hand (timing: internal, selection: external) | ||||||||
| Mattay et al. 2002 | fMRI | 7 | 8.8 | 5 | 55 | 7 | ON vs. OFF | ||
| Task: | Button presses with right hand (0‐back task) (timing: external, selection: external) | ||||||||
| Payoux et al., 2011 | PET | 8 | 10 | 22 | 12 | 62 | 67 | 3 | OFF vs. C |
| PET | 8 | 10 | 22 | 12 | 62 | 67 | 1 | ON vs. OFF | |
| Task: | Joystick‐movements with right hand with four spatial dof at 0.33 Hz (timing: external, selection: internal) | ||||||||
| Pinto et al., 2011 | fMRI | 9 | 15 | 33 | 59 | 55 | 6 | OFF vs. C | |
| Task: | Joystick‐movements with right hand with four spatial dof at 0.5 Hz (timing: external, selection: internal) | ||||||||
| Rowe et al., 2002 | fMRI | 12 | 12 | 33.7 | 62 | 62 | 2 | OFF vs. C | |
| Task: | Sequential finger movements of right hand at 0.33 Hz (timing: external, selection: external) | ||||||||
| Sabatini et al., 2000 | fMRI | 6 | 6 | 16 | 61 | 59 | 15 | OFF vs. C | |
| Task: | Finger‐to‐thumb opposition movements and fist clenching with right hand (timing: external, selection: external) | ||||||||
| Samuel et al., 1997 | PET | 6 | 6 | 17.7 | 70.2 | 64.3 | 7 | OFF vs. C | |
| Task: | Sequential finger movements of right hand at 0.33 Hz (timing: external, selection: external) | ||||||||
| PET | 6 | 6 | 17.7 | 70.2 | 64.3 | 10 | OFF vs. C | ||
| Task: | Bimanual sequential finger movements at 0.33 Hz (timing: external, selection: external) | ||||||||
| Tessa et al., 2010 | fMRI | 15 | 11 | 16.1 | 70.1 | 69 | 12 | OFF vs. C | |
| Task: | Continuous tapping of right hand (timing: internal, selection: external) | ||||||||
| Tessa et al., 2012 | fMRI | 15 | 13 | 16.3 | 68.1 | 64.2 | 4 | OFF vs. C | |
| Task: | Continuous writing of “8”‐figures with right hand (timing: internal, selection: external) | ||||||||
| Tessa et al., 2013 | fMRI | 11 | 10 | 13.5 | 67.7 | 64 | 6 | OFF vs. C | |
| Task: | Continuous tapping of left hand (timing: internal, selection: external) | ||||||||
| Turner et al., 2003 | PET | 12 | 12 | 41.4 | 57 | 58 | 9 | OFF vs. C | |
| Task: | Tracking task with right hand (timing: external, selection: external) | ||||||||
| Wu et al., 2005 | fMRI | 12 | 12 | 25.5 | 61.2 | 61.8 | 12 | OFF vs. C | |
| Task: | Sequential finger tapping with right hand at ∼0.5 Hz (timing: internal, selection: external) | ||||||||
| Wu et al., 2010 | fMRI | 15 | 15 | 20.7 | 59.7 | 60.3 | 15 | OFF vs. C | |
| Task: | In‐phase movements of both index fingers at ∼0.5 Hz (timing: internal, selection: external) | ||||||||
| fMRI | 15 | 15 | 20.7 | 59.7 | 60.3 | 20 | OFF vs. C | ||
| Task: | Anti‐phase movements of both index fingers at ∼0.5 Hz (timing: internal, selection: external) | ||||||||
# PD # C, number of PD patients and controls enrolled in the respective study; # Foci, number of activation foci reported in the respective study; dof, degrees of freedom.
Meta‐analysis Based on Activation Likelihood Estimation
The meta‐analyses were carried out using the revised version [Eickhoff et al., 2012] of the activation likelihood estimation (ALE) approach for coordinate‐based meta‐analyses [Turkeltaub et al., 2002]. ALE tests for a significant convergence between activation foci from different experiments as compared to a random distribution of foci. The term “experiment” refers to a contrast of interest (e.g., PD‐ON vs. PD‐OFF) for a given study, i.e., one study can comprise several experiments. A detailed description of the ALE technique can be found elsewhere [Eickhoff et al., 2009, 2012; Turkeltaub et al., 2012]. In short, activation foci from different experiments were modelled as spatial 3D Gaussian probability distributions, where the size of the distribution depends on the sample size (number of participants) in the respective experiment. Combining probabilities for foci in each experiment resulted in a modelled activation (MA) map. Subsequently, voxel‐wise ALE scores were computed by taking the union of the MA maps describing the convergence of results across experiments at each grey matter voxel. The nonparametric P values of ALE scores were derived by the proportion of equal or higher values obtained under the random (null) distribution and thresholded at a cluster level‐corrected threshold of P < 0.05 family‐wise error (FWE)‐corrected. When pooling contrasts (e.g. “PD‐OFF vs. controls” comprised the contrasts “PD‐OFF > controls” and “controls > PD‐OFF”) we subsequently assessed the contribution of experiments reporting respectively increased and decreased activity to each cluster. This was computed by the ratio of ALE‐values at the cluster with and without the experiments in question.
We hypothesized that some of the heterogeneity in reported activation differences between PD patients and healthy controls might be due to differences in the applied motor tasks, for instance related to the mode of movement selection. There is some evidence that PD patients rely more strongly on external cues during motor control than healthy participants [Brown and Marsden, 1988, Georgiou et al., 1994]. Because internally and externally specified movements are associated with distinct neural activation patterns [Hoffstaedter et al., 2013], we labeled each experiment according to the mode of movement timing (internally vs. externally paced) and movement selection (internally generated vs. externally specified movement). This allowed us to conduct separate meta‐analyses for internally vs. externally paced movements as well as internally generated vs. externally specified movements.
Finally, we assessed putative correlations between activation likelihood and motor impairment by computing voxel‐wise Spearman rank correlations between the activation likelihood and the mean Unified Parkinson's Disease Rating Scale‐III (UPDRS‐III) score [Fahn, 1987] of each experiment [Nickl‐Jockschat et al., 2012; Rehme et al., 2012]. The mean UPDRS‐III score was reported in 21 studies for PD patients OFF medication and in 10 studies for PD patients ON medication. Results of the correlation analysis were thresholded at P < 0.05.
Localization of significant effects was guided by the SPM Anatomy Toolbox v1.7 [Eickhoff et al., 2007] and the Harvard‐Oxford subcortical structural atlas [Makris et al., 1999] for cortical and subcortical areas, respectively.
RESULTS
Twenty‐four publications (21 fMRI, 3 H2O‐PET) with an average sample size of 11.8 ± 3.5 (mean ± SD) PD patients and 11.4 ± 3.2 control participants were included (Table 1). These publications collectively reported results from 56 experiments and 283 individual patients. Results from 35 experiments and 193 patients were reported for the contrasts “PD‐OFF vs. controls,” 11 experiments and 77 patients for the contrasts “PD‐ON vs. controls,” and 10 experiments and 79 patients for the contrasts “PD‐ON vs. PD‐OFF.”
Differences in Motor Activation Between PD Patients and Healthy Controls
An overview of significant convergence of activation maxima for the different analyses is given in Table 2. The meta‐analysis for differences between activation in PD patients OFF medication and healthy control participants yielded significant convergence of activation in the right posterior putamen, left inferior parietal cortex (IPC), left primary motor cortex (M1), presupplementary motor area (preSMA), and left superior parietal lobule (SPL) (Fig. 1A). The neuroimaging experiments contributing to the cluster in the right posterior putamen consistently reported decreased activity. A reduction in motor activation was detected in 33.3% of all experiments (Fig. 1B). Conversely, the experiments contributing to the cluster in the left SPL consistently reported an increase in motor activity. Increased motor activation of left SPL was observed in 29.4% of all experiments (Fig. 1C). For the remaining regions, the direction of activation differences between PD‐OFF and Controls were inconsistent across experiments: Experiments reporting decreased activation in PD contributed 75% to the cluster in left M1, 61% to the cluster in left IPC and 60% to the cluster in preSMA, while experiments reporting an increased activation in PD patients contributed respectively, 25, 39, and 40%.
Table 2.
Activation‐likelihood‐estimation analyses for between group contrasts
| Neural region | Side | MNI coordinates | Z value | ||
|---|---|---|---|---|---|
| X | Y | Z | |||
| Difference in activation between PD‐OFF and controls (35 experiments, 193 patients) | |||||
| Putamen | right | 26 | −4 | −8 | 5.09 |
| Inferior parietal cortex | left | −60 | −22 | 22 | 5.04 |
| Precentral gyrus (M1) | left | −36 | −20 | 62 | 4.65 |
| Presupplementary motor area | right | 6 | 12 | 60 | 4.30 |
| Superior parietal lobule | left | −34 | −46 | 62 | 3.99 |
| Decreased activation in PD‐OFF compared to controls (18 experiments, 171 patients) | |||||
| Putamen | right | 26 | −4 | −8 | 5.72 |
| Increased activation in PD‐OFF compared to controls (17 experiments, 157 patients) | |||||
| Superior parietal lobule | left | −26 | −48 | 60 | 4.04 |
| Difference in activation between PD‐ON and controls (11 experiments, 77 patients) | |||||
| Precentral Gyrus (M1) | left | −34 | −24 | 60 | 5.2 |
| Decreased activation in PD‐ON compared to controls (7 experiments, 61 patients) | |||||
| Precentral Gyrus (M1) | left | −34 | −24 | 60 | 5.28 |
| Difference in activation between PD‐ON and PD‐OFF (10 experiments, 79 patients) | |||||
| Middle Frontal Gyrus | right | 34 | 4 | 48 | 4.2 |
| Putamen | right | 26 | 3 | −6 | 4.06 |
| Increased activation in PD‐ON compared to PD‐OFF (7 experiments, 58 patients) | |||||
| Putamen | left | −28 | −4 | −2 | 4.35 |
Clusters with convergence of activation maxima are reported at a statistical threshold of P < 0.05 cluster‐corrected. There were no significant activations for the contrasts PD‐ON > Controls and PD‐OFF > PD‐ON.
Figure 1.
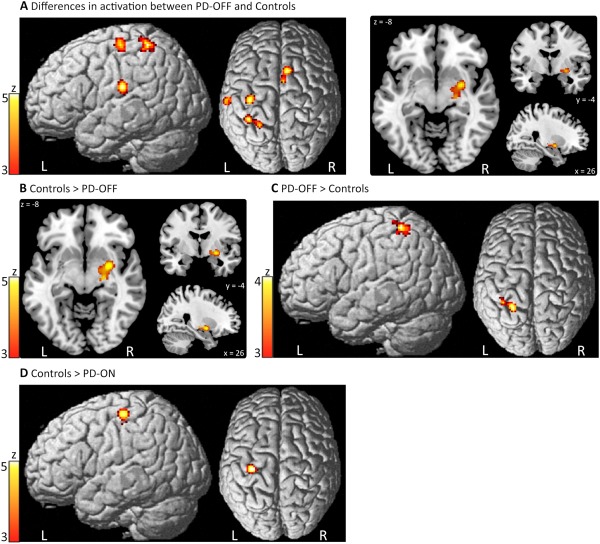
Convergence of activation maxima for the group comparison between PD patients and healthy controls. A: Significant results for the contrast PD‐OFF vs. Controls (i.e., “PD‐OFF > Controls” or “Controls > PD‐OFF”). B: Decreased activation in PD‐OFF compared to Controls. C: Increased activation in PD‐OFF compared to Controls. D: Decreased activation in PD‐ON compared to Controls. Significant activation maxima for the contrast “PD‐ON vs. Controls” are omitted, since they are identical to results of the contrast “Controls > PD‐ON” shown in 1D. L, left; R, right. [Color figure can be viewed in the online issue, which is available at http://wileyonlinelibrary.com.]
Additional analyses focused on the mode of movement selection (i.e., externally vs. internally paced as well as externally specified vs. internally chosen movements). These analyses revealed that M1 activation was significantly decreased in PD patients OFF medication compared to healthy controls during externally‐, but not internally paced and generated movements. Conversely, activation of parietal areas, namely IPC and SPL, was significantly increased in PD patients OFF medication during externally specified, but not internally chosen movements. Activation differences of preSMA remained inconsistent even after separating experiments according to movement timing and selection.
Analysis for difference in activation between PD patients ON medication and healthy controls revealed significant convergence of activation in the left M1 only. In the ON state, task‐related motor activation of M1 was consistently decreased in PD patients relative to healthy controls. A reduction in movement‐related M1 activity was present in 42.9% of all experiments (Fig. 1D).
Effect of Dopaminergic Medication on Motor Activation in PD Patients
Significant convergence of activation maxima for the contrasts comparing PD patients ON and OFF medication were found in the right middle frontal gyrus (MFG) and right putamen (Fig. 2A). Activation differences in these regions, however, were inconsistent across experiments: Experiments reporting increased activation in PD ON contributed 74% to the cluster in right putamen and 62% to the cluster in right MFG, while experiments reporting decreased activation in PD ON contributed respectively, 26 and 38%. These inconsistencies could not be explained by separating experiments according to motor timing and selection (external vs. internal). Conversely, activity of the left putamen was consistently increased after dopaminergic medication, which was detected in 42.9% of all experiments (Fig. 2B).
Figure 2.
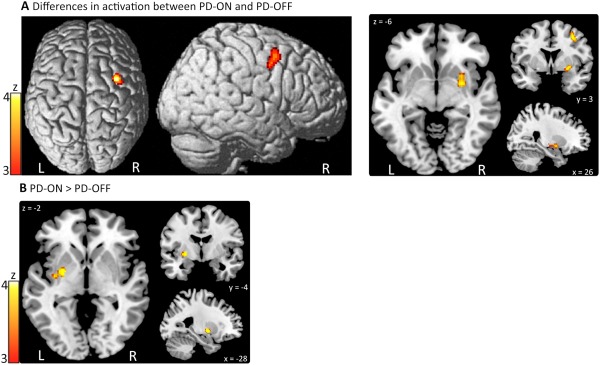
Convergence of activation maxima for the comparison between PD patients ON and OFF medication. A: Significant results for the contrast PD‐ON vs. PD‐OFF (i.e., “PD‐ON > PD‐OFF” or “PD‐OFF > PD‐ON”). B: Increased activation in PD‐ON compared to PD‐OFF. [Color figure can be viewed in the online issue, which is available at http://wileyonlinelibrary.com.]
Correlation Between Motor Activation and Motor Impairment
Motor impairment as indexed by the mean UPDRS‐III OFF score correlated with likelihood of decreased activity in the right putamen in PD patients OFF medication compared to healthy controls (peak: 25 −5 −6, MNI coordinates; rho = 0.63, P < 0.05), indicating that decrease of motor activation of right putamen was more pronounced in PD patients with stronger motor impairment (Fig. 3). A mean UPDRS‐III OFF score of ∼20 could be identified as cut‐off point. Patient cohorts with a mean UPDRS‐III OFF score of more than 20 expressed deficient task‐related activation in the putamen. Of note, the only study with a high mean UPDRS‐OFF score, in which decreased activation of the putamen was not reported, studied ankle movements. That study failed to induce a consistent activation of the putamen in PD patients and healthy controls [Katschnig et al., 2011]. There were no other significant correlations between activation likelihood and UPDRS‐III scores.
Figure 3.
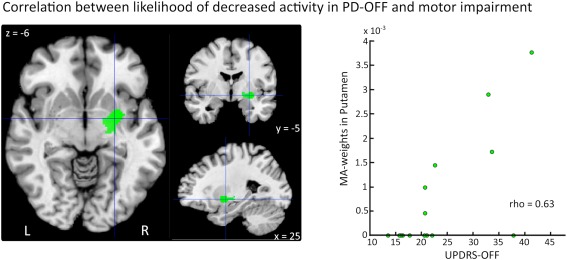
Voxel‐wise Spearman correlations between activation likelihood and UPDRS‐III scores. There was a significant correlation between likelihood of decreased activity in the right Putamen in PD patients (“Control > PD‐OFF”) and motor impairment (rho = 0.63, P < 0.05). Studies that do not report activations of the respective region have an MA‐value of 0. [Color figure can be viewed in the online issue, which is available at http://wileyonlinelibrary.com.]
DISCUSSION
Using this meta‐analysis approach we were able to detect consistent patterns of abnormal neural activity during movements in PD as revealed by fMRI and H2O‐PET studies. Differences in neural activity between PD patients OFF medication and healthy controls converged in a left‐lateralized fronto‐parietal cortical network comprising preSMA, M1, IPC, and SPL. With the exception of left SPL where PD was associated with increased levels of motor activation, PD patients expressed both, decreased as well as increased motor activation in these frontoparietal regions, which could partly be explained by differences in movement timing and selection in the applied motor tasks. In the basal ganglia, PD patients OFF medication showed an attenuation of motor activity in the posterior putamen. Decreased motor activity in the putamen correlated with motor impairment in PD patients OFF medication.
Deficient Motor Activation of the Putamen in PD
The pathophysiological hallmark of PD is a progressive loss of dopaminergic neurons of the substantia nigra pars compacta (SNc) causing nigrostriatal denervation, especially in the posterior motor part of the putamen [Lang and Lozano, 1998a,b]. Dopamine signalling from SNc to the putamen is thought to have a movement facilitating effect by modulating distinct pathways linking the basal ganglia and cortical motor areas [Alexander et al., 1986]. In agreement with this pathophysiological model, we found a consistent decrease of motor‐related activity of the putamen in PD patients who have paused dopaminergic medication.
The likelihood of detecting decreased activity in the right posterior putamen correlated positively with the mean UPDRS‐III scores. This correlation suggests that the magnitude of motor activation in the putamen decreases with progression of motor impairment. In the OFF medication state, decreased motor activation in the putamen was present in PD cohorts with a mean UPDRS‐III group score of about 20. However, recent fMRI studies using regions of interest (ROI) approaches [Holden et al., 2006; Prodoehl et al., 2010; Spraker et al., 2010] showed that decreased motor activation of the putamen could already be detected in patient groups with a lower mean UPDRS‐score (UPDRS‐III OFF scores: 15.7, 16.2, and 17.9, respectively), when the statistical sensitivity for detecting activity changes in the putamen is increased. While PD patients in these studies all had developed symptoms, it is of great clinical interest to detect abnormal neural activity already in presymptomatic disease stages, before symptoms become apparent. Future prospective studies need to evaluate at which stage abnormal neural activity can be detected in PD using fMRI and H2O‐PET.
Our meta‐analysis revealed that dopaminergic medication (PD‐ON > PD‐OFF) significantly augmented motor activation in the left putamen in PD patients. Likewise, neurophysiological studies have shown that dopaminergic medication facilitates high‐frequency coupling from the basal ganglia to the cortex [Litvak et al., 2012; Williams et al., 2002]. Together, these findings provide converging evidence that dopaminergic medication mediates its therapeutic effect primarily at the side of nigrostriatal denervation and hereby, improving neural processing in the cortico‐basal ganglia thalamo‐cortical motor loop.
Motor Activation of Cortical Motor Areas in PD
Previous functional neuroimaging studies in PD have mainly reported changes in activation of cortical motor areas [Grafton, 2004; Rowe and Siebner, 2012]. However, when systematically reviewing previous studies, inconsistencies in the observed cortical activation patterns between different experiments become apparent [Rowe and Siebner, 2012]. For example early studies using single‐photon emission computed tomography (SPECT) [Rascol et al., 1994, 1997], PET [Jahanshahi et al., 1995; Playford et al., 1992] and fMRI [Buhmann et al., 2003; Haslinger et al., 2001] have shown that the preSMA/SMA is hypoactive in PD. Consecutive studies, however, also reported the opposite finding, namely an increase of preSMA activity in PD [Cerasa et al., 2006; Eckert et al., 2006; Turner et al., 2003]. Our meta‐analysis confirmed this discrepancy by showing that there is a significant difference in preSMA activity between PD patients off medication and healthy controls, but that the direction of activity changes (i.e., an increase or decrease in activity) is not consistent across studies. The left IPC and M1 showed a similar heterogeneity with respect to the direction of activity changes in PD patients relative to healthy controls. A likely explanation for the lateralization of the detected cortical network to the left hemisphere is that the majority of studies tested movements of the right hand (Table 1), which was the dominant hand of most patients (21 of the 24 included studies restricted their analysis to right‐handed patients). Task‐specific recruitment of cortical motor networks could also partly explain inconsistencies in terms of regional increases or decreases in motor activation. We deliberately restricted this meta‐analysis to studies probing motor execution, and excluded paradigms probing motor learning or executive control (e.g., response inhibition or task switching). Yet, the included studies still covered a wide variety of motor execution tasks, such as internally and externally paced as well as internally chosen and externally specified movements. When taking into account the mode of movement timing and selection (external vs. internal), our meta‐analyses were able to resolve some of the reported inconsistencies. Activity in M1 was decreased in PD patients OFF medication during externally (but not internally) specified and paced movements, whereas activity of parietal areas (SPL and IPC) was increased in PD patients OFF medication during externally specified, but not internally chosen movements. These findings demonstrate that activation differences between PD patients and healthy participants are task‐dependent and highlight the critical role of external cues on the motor system in PD [Brown and Marsden, 1988].
Of note, the inconsistencies in reported activation differences of preSMA between PD patients and healthy controls could not be explained by differences in motor timing and selection. An important factor determining changes in preSMA activation is the amount of attention that is assigned to the motor task [Rowe et al., 2002]. Rowe et al. found that PD patients OFF medication had increased motor‐related activity in SMA compared to healthy controls in a task, which did not require subjects to attend to their actions. In contrast to healthy controls, PD patients failed to augment SMA activity when asked to attend to their actions [Rowe et al., 2002]. These findings suggest that PD patients “by default” pay attention to their actions, even if this is not explicitly required. Hence, they are not able to further increase their attentional control of movements, when being explicitly asked to do so.
Analysis of resting state (RS) activity has been increasingly recognized as a valuable method for studying task‐independent abnormal neural activation patterns in PD. Interestingly, a recent RS study has demonstrated decreased connectivity between SMA/preSMA and the sensorimotor system in PD, suggesting that such abnormal connectivity patterns of the SMA/preSMA might be central to the pathophysiology underlying PD [Esposito et al., 2013]. However, even in the absence of a task, both increases as well as decreases in connectivity between SMA and other cortico‐subcortical motor regions have been reported [Esposito et al., 2013; Kwak et al., 2010; Wu et al., 2011; Yu et al., 2013]. These inconsistencies might partly be due to differences in preprocessing and statistical analysis of RS fMRI data, and it remains to be elucidated to what extent RS studies can advance our understanding of the abnormal neural mechanisms underlying PD.
An interesting finding of this meta‐analysis was the increased activation of parietal areas in PD patients OFF medication compared to healthy controls. Because parietal motor areas are involved in sensory‐motor transformation and visually‐guided movements [Buneo and Andersen, 2006], one might speculate whether this finding could be related to the increased dependency on external cues that can be observed in some PD patients [Brown and Marsden, 1988; Georgiou et al., 1994]. In line with this hypothesis, we found that SPL as well as IPC were significantly increased in PD patients OFF medication during externally specified, but not internally chosen movements, suggesting a potential compensational role of parietal motor areas in PD. These results grant further research about the functional role of parietal motor areas during motor control in PD.
PD patients ON medication showed a consistent decrease of activity of left M1 as the only significant finding. It is important to note, however, that only relatively few neuroimaging studies actually reported motor activation in the ON medication state. Eleven experiments that were included in the meta‐analysis examined motor activity while patients were ON medication, whereas 35 experiments assessed motor activity in the OFF medication state. Given the small number of studies, the lack of significant differences in cortical activity in nonprimary motor cortical areas in medicated PD patients might simply be due to a lack of power. This negative finding should not be interpreted as evidence for a partial normalization of neural activity after dopaminergic medication.
Limitations
An advantage of meta‐analyses encompassing data from many different experiments is an increase in external validity, i.e., the results are not restricted to a specific small patient group. However, one has to bear in mind that functional neuroimaging studies almost exclusively study PD patients with predominantly akinetic‐rigid symptoms. Tremor‐dominant PD patients are usually excluded because movement artefacts evoked by the tremor heavily interfere with data acquisition. Thus, the drawn conclusions are not necessarily valid for patients with tremor‐dominant PD, who constitute the majority of PD patients [Jankovic et al., 1990]. Recently, methods have been developed to control for movement artefacts induced by tremor, allowing functional neuroimaging studies in tremor‐dominant PD patients [Helmich et al., 2011; Prodoehl et al., 2013]. Future studies are needed to assess to what extent the findings from studies in akinetic‐rigid patients hold true for tremor‐dominant PD patients.
A second limitation is the limited field of view that has been applied during data acquisition particularly in early studies, i.e. not the whole brain was covered during scanning. This limitation mainly affects the orbitofrontal cortex, occipital cortex and the cerebellum. Therefore, our meta‐analysis might lack sufficient sensitivity to detect abnormal activations of these areas, such as an increased activation of the cerebellum in patients with PD. Indeed it has been suggested that cerebellar activity might increase in PD to compensate for deficient cortico‐basal ganglia‐thalamo cortical loops via cereballar‐thalamo‐cortical projections [Wu and Hallett, 2013].
Additionally, fMRI and H2O‐PET studies have a limited resolution of several mm. This makes it difficult to study smaller structures of the basal ganglia, such as the substantia nigra or the subthalamic nucleus, particularly in early studies. Recent advances in fMRI imaging using higher field strength will allow a more detailed analysis of movement‐related activation of smaller basal ganglia structures in PD, which are likely to be involved in motor dysfunction. Finally, only functional neuroimaging studies using classical univariate approaches were included in this meta‐analysis. It is important to note that other approaches, such as multivariate analyses of metabolic [Niethammer and Eidelberg, 2012] or perfusion patterns [Melzer et al., 2011] have been successfully applied to neuroimaging of PD over the last years. For methodological reasons, these studies could not be included in the meta‐analysis, but are nevertheless valuable for studying abnormal neural networks in PD.
CONCLUSION
This meta‐analysis of previous studies that used fMRI and H2O‐PET to examine motor activation in PD shifts the focus from functional alterations at the cortical level to impaired activation in the basal ganglia. The reported activation peaks in the putamen indicate that the OFF‐medication state is associated with a deficient motor activation across different motor tasks and neuroimaging studies. Dopaminergic medication consistently improves motor activation in the putamen, whereas deficient putaminal activation correlates positively with motor impairment in PD. We conclude that functional neuroimaging studies using fMRI and H2O‐PET are useful for mapping abnormal neural activity caused by dopaminergic denervation of the putamen in patients with PD. Cortical changes in motor activation can also be captured with functional neuroimaging, but here the functional alterations are not consistent in terms of PD‐related up‐ or down‐regulation of regional cortical activity, and rely more strongly on the applied motor task.
ACKNOWLEDGMENTS
The funding sources had no involvement in the undertaking of the study. The authors declare no conflict of interest.
REFERENCES
- Alexander GE, Delong MR, Strick PL (1986): Parallel organization of functionally segregated circuits linking basal ganglia and cortex. Annu Rev Neurosci 9:357–381. [DOI] [PubMed] [Google Scholar]
- Baglio F, Blasi V, Falini A, Farina E, Mantovani F, Olivotto F, Scotti G, Nemni R, Bozzali M (2011): Functional brain changes in early Parkinson's disease during motor response and motor inhibition. Neurobiol Aging 32:115–124. [DOI] [PubMed] [Google Scholar]
- Bradberry TJ, Metman LV, Contreras‐Vidal JL, van den Munckhof P, Hosey LA, Thompson JL, Schulz GM, Lenz F, Pahwa R, Lyons KE, Braun AR (2012): Common and unique responses to dopamine agonist therapy and deep brain stimulation in Parkinson's disease: An H(2)(15)O PET study. Brain Stimul 5:605–615. [DOI] [PMC free article] [PubMed] [Google Scholar]
- Brown RG, Marsden CD (1988): Internal versus external cues and the control of attention in Parkinson's disease. Brain 111 (Part 2):323–345. [DOI] [PubMed] [Google Scholar]
- Buhmann C, Glauche V, Sturenburg HJ, Oechsner M, Weiller C, Buchel C (2003): Pharmacologically modulated fMRI—Cortical responsiveness to levodopa in drug‐naive hemiparkinsonian patients. Brain 126:451–461. [DOI] [PubMed] [Google Scholar]
- Buneo CA, Andersen RA (2006): The posterior parietal cortex: Sensorimotor interface for the planning and online control of visually guided movements. Neuropsychologia 44:2594–2606. [DOI] [PubMed] [Google Scholar]
- Cerasa A, Hagberg GE, Peppe A, Bianciardi M, Gioia MC, Costa A, Castriota‐Scanderbeg A, Caltagirone C, Sabatini U (2006): Functional changes in the activity of cerebellum and frontostriatal regions during externally and internally timed movement in Parkinson's disease. Brain Res Bull 71:259–269. [DOI] [PubMed] [Google Scholar]
- Eckert T, Peschel T, Heinze HJ, Rotte M (2006): Increased pre‐SMA activation in early PD patients during simple self‐initiated hand movements. J Neurol 253:199–207. [DOI] [PubMed] [Google Scholar]
- Eickhoff SB, Paus T, Caspers S, Grosbras MH, Evans AC, Zilles K, Amunts K (2007): Assignment of functional activations to probabilistic cytoarchitectonic areas revisited. Neuroimage 36:511–521. [DOI] [PubMed] [Google Scholar]
- Eickhoff SB, Laird AR, Grefkes C, Wang LE, Zilles K, Fox PT (2009): Coordinate‐based activation likelihood estimation meta‐analysis of neuroimaging data: A random‐effects approach based on empirical estimates of spatial uncertainty. Hum Brain Mapp 30:2907–2926. [DOI] [PMC free article] [PubMed] [Google Scholar]
- Eickhoff SB, Bzdok D, Laird AR, Kurth F, Fox PT (2012): Activation likelihood estimation meta‐analysis revisited. Neuroimage 59:2349–2361. [DOI] [PMC free article] [PubMed] [Google Scholar]
- Esposito F, Tessitore A, Giordano A, De Micco R, Paccone A, Conforti R, Pignataro G, Annunziato L, Tedeschi G (2013): Rhythm‐specific modulation of the sensorimotor network in drug‐naive patients with Parkinson's disease by levodopa. Brain 136:710–725. [DOI] [PubMed] [Google Scholar]
- Fahn S, Elton RL, Development Committee UPDRS (1987): Unified Parkinson's disease rating scale In: Fahn S, Marsden CD, Goldstein M, Calne DB, editors. Recent Developments in Parkinson's Disease, Vol. 2 Florham Park, NJ: Macmillan Health Care Information; pp 153–163. [Google Scholar]
- Georgiou N, Bradshaw JL, Iansek R, Phillips JG, Mattingley JB, Bradshaw JA (1994): Reduction in external cues and movement sequencing in Parkinson's disease. J Neurol Neurosurg Psychiatry 57:368–370. [DOI] [PMC free article] [PubMed] [Google Scholar]
- Gonzalez‐Garcia N, Armony JL, Soto J, Trejo D, Alegria MA, Drucker‐Colin R (2011): Effects of rTMS on Parkinson's disease: A longitudinal fMRI study. J Neurol 258:1268–1280. [DOI] [PubMed] [Google Scholar]
- Grafton ST (2004): Contributions of functional imaging to understanding parkinsonian symptoms. Curr Opin Neurobiol 14:715–719. [DOI] [PubMed] [Google Scholar]
- Haslinger B, Erhard P, Kampfe N, Boecker H, Rummeny E, Schwaiger M, Conrad B, Ceballos‐Baumann AO (2001): Event‐related functional magnetic resonance imaging in Parkinson's disease before and after levodopa. Brain 124:558–570. [DOI] [PubMed] [Google Scholar]
- Helmich RC, Janssen MJ, Oyen WJ, Bloem BR, Toni I (2011): Pallidal dysfunction drives a cerebellothalamic circuit into Parkinson tremor. Ann Neurol 69:269–281. [DOI] [PubMed] [Google Scholar]
- Hoffstaedter F, Grefkes C, Zilles K, Eickhoff SB (2013): The "what" and "when" of self‐initiated movements. Cereb Cortex 23:520–530. [DOI] [PMC free article] [PubMed] [Google Scholar]
- Holden A, Wilman A, Wieler M, Martin WR (2006): Basal ganglia activation in Parkinson's disease. Parkinsonism Relat Disord 12:73–77. [DOI] [PubMed] [Google Scholar]
- Holiga S, Moller HE, Sieger T, Schroeter ML, Jech R, Mueller K (2012): Accounting for movement increases sensitivity in detecting brain activity in Parkinson's disease. PLoS One 7:e36271. [DOI] [PMC free article] [PubMed] [Google Scholar]
- Hughes LE, Barker RA, Owen AM, Rowe JB (2010): Parkinson's disease and healthy aging: Independent and interacting effects on action selection. Hum Brain Mapp 31:1886–1899. [DOI] [PMC free article] [PubMed] [Google Scholar]
- Jahanshahi M, Jenkins IH, Brown RG, Marsden CD, Passingham RE, Brooks DJ (1995): Self‐initiated versus externally triggered movements. I. An investigation using measurement of regional cerebral blood flow with PET and movement‐related potentials in normal and Parkinson's disease subjects. Brain 118 (Part 4):913–933. [DOI] [PubMed] [Google Scholar]
- Jankovic J (2008): Parkinson's disease: Clinical features and diagnosis. J Neurol Neurosurg Psychiatry 79:368–376. [DOI] [PubMed] [Google Scholar]
- Jankovic J, McDermott M, Carter J, Gauthier S, Goetz C, Golbe L, Huber S, Koller W, Olanow C, Shoulson I (1990): Variable expression of Parkinson's disease: A base‐line analysis of the DATATOP cohort. The Parkinson Study Group. Neurology 40:1529–1534. [DOI] [PubMed] [Google Scholar]
- Katschnig P, Schwingenschuh P, Jehna M, Svehlik M, Petrovic K, Ropele S, Zwick EB, Ott E, Fazekas F, Schmidt R, Enzinger C (2011): Altered functional organization of the motor system related to ankle movements in Parkinson's disease: insights from functional MRI. J Neural Transm 118:783–793. [DOI] [PubMed] [Google Scholar]
- Ko JH, Mure H, Tang CC, Ma Y, Dhawan V, Spetsieris P, Eidelberg D (2013): Parkinson's disease: Increased motor network activity in the absence of movement. J Neurosci 33:4540–4549. [DOI] [PMC free article] [PubMed] [Google Scholar]
- Kraft E, Loichinger W, Diepers M, Lule D, Schwarz J, Ludolph AC, Storch A (2009): Levodopa‐induced striatal activation in Parkinson's disease: A functional MRI study. Parkinsonism Relat Disord 15:558–563. [DOI] [PubMed] [Google Scholar]
- Kwak Y, Peltier S, Bohnen NI, Muller ML, Dayalu P, Seidler RD (2010): Altered resting state cortico‐striatal connectivity in mild to moderate stage Parkinson's disease. Front Syst Neurosci 4:143. [DOI] [PMC free article] [PubMed] [Google Scholar]
- Lang AE, Lozano AM (1998a): Parkinson's disease. First of two parts. N Engl J Med 339:1044–1053. [DOI] [PubMed] [Google Scholar]
- Lang AE, Lozano AM (1998b): Parkinson's disease. Second of two parts. N Engl J Med 339:1130–1143. [DOI] [PubMed] [Google Scholar]
- Litvak V, Eusebio A, Jha A, Oostenveld R, Barnes G, Foltynie T, Limousin P, Zrinzo L, Hariz MI, Friston K, Brown P (2012): Movement‐related changes in local and long‐range synchronization in Parkinson's disease revealed by simultaneous magnetoencephalography and intracranial recordings. J Neurosci 32:10541–10553. [DOI] [PMC free article] [PubMed] [Google Scholar]
- Maillet A, Krainik A, Debu B, Tropres I, Lagrange C, Thobois S, Pollak P, Pinto S (2012): Levodopa effects on hand and speech movements in patients with Parkinson's disease: A FMRI study. PLoS One 7:e46541. [DOI] [PMC free article] [PubMed] [Google Scholar]
- Makris N, Meyer JW, Bates JF, Yeterian EH, Kennedy DN, Caviness VS (1999): MRI‐based topographic parcellation of human cerebral white matter and nuclei II. Rationale and applications with systematics of cerebral connectivity. Neuroimage 9:18–45. [DOI] [PubMed] [Google Scholar]
- Mallol R, Barros‐Loscertales A, Lopez M, Belloch V, Parcet MA, Avila C (2007): Compensatory cortical mechanisms in Parkinson's disease evidenced with fMRI during the performance of pre‐learned sequential movements. Brain Res 1147:265–271. [DOI] [PubMed] [Google Scholar]
- Mattay VS, Tessitore A, Callicott JH, Bertolino A, Goldberg TE, Chase TN, Hyde TM, Weinberger DR (2002): Dopaminergic modulation of cortical function in patients with Parkinson's disease. Ann Neurol 51:156–164. [DOI] [PubMed] [Google Scholar]
- Melzer TR, Watts R, Macaskill MR, Pearson JF, Rueger S, Pitcher TL, Livingston L, Graham C, Keenan R, Shankaranarayanan A, Alsop DC, Dalrymple‐Alford JC, Anderson TJ (2011): Arterial spin labelling reveals an abnormal cerebral perfusion pattern in Parkinson's disease. Brain 134:845–855. [DOI] [PMC free article] [PubMed] [Google Scholar]
- Nickl‐Jockschat T, Habel U, Michel TM, Manning J, Laird AR, Fox PT, Schneider F, Eickhoff SB (2012): Brain structure anomalies in autism spectrum disorder—A meta‐analysis of VBM studies using anatomic likelihood estimation. Hum Brain Mapp 33:1470–1489. [DOI] [PMC free article] [PubMed] [Google Scholar]
- Niethammer M, Eidelberg D (2012): Metabolic brain networks in translational neurology: Concepts and applications. Ann Neurol 72:635–647. [DOI] [PMC free article] [PubMed] [Google Scholar]
- Payoux P, Brefel‐Courbon C, Ory‐Magne F, Regragui W, Thalamas C, Balduyck S, Durif F, Azulay JP, Tison F Blin O, Esquerre JP, Rascol O (2010): Motor activation in multiple system atrophy and Parkinson disease: A PET study. Neurology 75:1174–1180. [DOI] [PubMed] [Google Scholar]
- Pinto S, Mancini L, Jahanshahi M, Thornton JS, Tripoliti E, Yousry TA, Limousin P (2011): Functional magnetic resonance imaging exploration of combined hand and speech movements in Parkinson's disease. Mov Disord 26:2212–2219. [DOI] [PMC free article] [PubMed] [Google Scholar]
- Playford ED, Jenkins IH, Passingham RE, Nutt J, Frackowiak RS, Brooks DJ (1992): Impaired mesial frontal and putamen activation in Parkinson's disease: A positron emission tomography study. Ann Neurol 32:151–161. [DOI] [PubMed] [Google Scholar]
- Prodoehl J, Spraker M, Corcos D, Comella C, Vaillancourt D (2010): Blood oxygenation level‐dependent activation in basal ganglia nuclei relates to specific symptoms in de novo Parkinson's disease. Mov Disord 25:2035–2043. [DOI] [PMC free article] [PubMed] [Google Scholar]
- Prodoehl J, Planetta PJ, Kurani AS, Comella CL, Corcos DM, Vaillancourt DE (2013): Differences in brain activation between tremor‐ and nontremor‐dominant Parkinson disease. JAMA Neurol 70:100–106. [DOI] [PMC free article] [PubMed] [Google Scholar]
- Rascol O, Sabatini U, Chollet F, Fabre N, Senard JM, Montastruc JL, Celsis P, Marc‐Vergnes JP, Rascol A (1994): Normal activation of the supplementary motor area in patients with Parkinson's disease undergoing long‐term treatment with levodopa. J Neurol Neurosurg Psychiatry 57:567–571. [DOI] [PMC free article] [PubMed] [Google Scholar]
- Rascol O, Sabatini U, Fabre N, Brefel C, Loubinoux I, Celsis P, Senard JM, Montastruc JL, Chollet F (1997): The ipsilateral cerebellar hemisphere is overactive during hand movements in akinetic parkinsonian patients. Brain 120 (Part 1):103–110. [DOI] [PubMed] [Google Scholar]
- Rehme AK, Eickhoff SB, Rottschy C, Fink GR, Grefkes C (2012): Activation likelihood estimation meta‐analysis of motor‐related neural activity after stroke. Neuroimage 59:2771–2782. [DOI] [PubMed] [Google Scholar]
- Rowe JB, Siebner HR (2012): The motor system and its disorders. Neuroimage 61:464–477. [DOI] [PubMed] [Google Scholar]
- Rowe J, Stephan KE, Friston K, Frackowiak R, Lees A, Passingham R (2002): Attention to action in Parkinson's disease: Impaired effective connectivity among frontal cortical regions. Brain 125:276–289. [DOI] [PubMed] [Google Scholar]
- Sabatini U, Boulanouar K, Fabre N, Martin F, Carel C, Colonnese C, Bozzao L, Berry I, Montastruc JL, Chollet F, Rascol O (2000): Cortical motor reorganization in akinetic patients with Parkinson's disease: A functional MRI study. Brain 123 (Part 2):394–403. [DOI] [PubMed] [Google Scholar]
- Samuel M, Ceballos‐Baumann AO, Blin J, Uema T, Boecker H, Passingham RE, Brooks DJ (1997): Evidence for lateral premotor and parietal overactivity in Parkinson's disease during sequential and bimanual movements. A PET study. Brain 120 (Part 6):963–976. [DOI] [PubMed] [Google Scholar]
- Schwingenschuh P, Katschnig P, Jehna M, Koegl‐Wallner M, Seiler S, Wenzel K, Ropele S, Langkammer C, Gattringer T, Svehlik M, Ott E, Fazekas F, Schmidt R, Enzinger C (2013): Levodopa changes brain motor network function during ankle movements in Parkinson's disease. J Neural Transm 120:423–433. [DOI] [PubMed] [Google Scholar]
- Spraker MB, Prodoehl J, Corcos DM, Comella CL, Vaillancourt DE (2010): Basal ganglia hypoactivity during grip force in drug naive Parkinson's disease. Hum Brain Mapp 31:1928–1941. [DOI] [PMC free article] [PubMed] [Google Scholar]
- Stoessl AJ, Martin WW, Mckeown MJ, Sossi V (2011): Advances in imaging in Parkinson's disease. Lancet Neurol 10:987–1001. [DOI] [PubMed] [Google Scholar]
- Tessa C, Lucetti C, Diciotti S, Baldacci F, Paoli L, Cecchi P, Giannelli M, Ginestroni A, Del Dotto P, Ceravolo R, Vignali C, Bonuccelli U, Mascalchi M (2010): Decreased and increased cortical activation coexist in de novo Parkinson's disease. Exp Neurol 224:299–306. [DOI] [PubMed] [Google Scholar]
- Tessa C, Lucetti C, Diciotti S, Paoli L, Cecchi P, Giannelli M, Baldacci F, Ginestroni A, Vignali C, Mascalchi M, Bonuccelli U (2012): Hypoactivation of the primary sensorimotor cortex in de novo Parkinson's disease: A motor fMRI study under controlled conditions. Neuroradiology 54:261–268. [DOI] [PubMed] [Google Scholar]
- Tessa C, Diciotti S, Lucetti C, Baldacci F, Cecchi P, Giannelli M, Bonuccelli U, Mascalchi M (2013): fMRI changes in cortical activation during task performance with the unaffected hand partially reverse after ropinirole treatment in de novo Parkinson's disease. Parkinsonism Relat Disord 19:265–268. [DOI] [PubMed] [Google Scholar]
- Turkeltaub PE, Eden GF, Jones KM, Zeffiro TA (2002): Meta‐analysis of the functional neuroanatomy of single‐word reading: Method and validation. Neuroimage 16:765–780. [DOI] [PubMed] [Google Scholar]
- Turkeltaub PE, Eickhoff SB, Laird AR, Fox M, Wiener M, Fox P (2012): Minimizing within‐experiment and within‐group effects in activation likelihood estimation meta‐analyses. Hum Brain Mapp 33:1–13. [DOI] [PMC free article] [PubMed] [Google Scholar]
- Turner RS, Grafton ST, Mcintosh AR, Delong MR, Hoffman JM (2003): The functional anatomy of parkinsonian bradykinesia. Neuroimage 19:163–179. [DOI] [PubMed] [Google Scholar]
- Williams D, Tijssen M, Van Bruggen G, Bosch A, Insola A, Di Lazzaro V, Mazzone P, Oliviero A, Quartarone A, Speelman H, Brown P (2002): Dopamine‐dependent changes in the functional connectivity between basal ganglia and cerebral cortex in humans. Brain 125:1558–1569. [DOI] [PubMed] [Google Scholar]
- Wu T, Hallett M (2005): A functional MRI study of automatic movements in patients with Parkinson's disease. Brain 128:2250–2259. [DOI] [PubMed] [Google Scholar]
- Wu T, Hallett M (2013): The cerebellum in Parkinson's disease. Brain 136:696–709. [DOI] [PMC free article] [PubMed] [Google Scholar]
- Wu T, Wang L, Hallett M, Li K, Chan P (2010): Neural correlates of bimanual anti‐phase and in‐phase movements in Parkinson's disease. Brain 133:2394–2409. [DOI] [PMC free article] [PubMed] [Google Scholar]
- Wu T, Long X, Wang L, Hallett M, Zang Y, Li K, Chan P (2011): Functional connectivity of cortical motor areas in the resting state in Parkinson's disease. Hum Brain Mapp 32:1443–1457. [DOI] [PMC free article] [PubMed] [Google Scholar]
- Yu R, Liu B, Wang L, Chen J, Liu X (2013): Enhanced functional connectivity between putamen and supplementary motor area in Parkinson's disease patients. PLoS One 8:e59717. [DOI] [PMC free article] [PubMed] [Google Scholar]