

Abstract
Whether phonological deficits in developmental dyslexia are associated with impaired neural sampling of auditory information at either syllabic‐ or phonemic‐rates is still under debate. In addition, whereas neuroanatomical alterations in auditory regions have been documented in dyslexic readers, whether and how these structural anomalies are linked to auditory sampling and reading deficits remains poorly understood. In this study, we measured auditory neural synchronization at different frequencies corresponding to relevant phonological spectral components of speech in children and adults with and without dyslexia, using magnetoencephalography. Furthermore, structural MRI was used to estimate cortical thickness of the auditory cortex of participants. Dyslexics showed atypical brain synchronization at both syllabic (slow) and phonemic (fast) rates. Interestingly, while a left hemispheric asymmetry in cortical thickness was functionally related to a stronger left hemispheric lateralization of neural synchronization to stimuli presented at the phonemic rate in skilled readers, the same anatomical index in dyslexics was related to a stronger right hemispheric dominance for neural synchronization to syllabic‐rate auditory stimuli. These data suggest that the acoustic sampling deficit in development dyslexia might be linked to an atypical specialization of the auditory cortex to both low and high frequency amplitude modulations. Hum Brain Mapp 36:4986–5002, 2015. © 2015 Wiley Periodicals, Inc.
Keywords: reading disorder, phonology, auditory cortex, magnetoencephalography, cortical thickness
INTRODUCTION
The reading disorder in developmental dyslexia has been associated with the inability to properly sample speech signals, hence hampering the perceptual sensitivity to phonological units that is important for grapheme‐phoneme conversion and expert reading acquisition. In particular, it has been proposed that the phonological difficulties of dyslexia would reside in the poor sensitivity (or atypical sampling) of speech units dissociable by their temporal distributional properties in speech [Goswami and Leong, 2013]. Based on speech perception models [e.g., Giraud and Poeppel, 2012a, 2012b], the asynchronous auditory neural response to high frequency amplitude modulations (AM) [∼30 Hz: Lehongre et al., 2011, 2013] in dyslexia has been interpreted as a reduced sensitivity to phonemic units. On the other hand, atypical sampling of slow auditory amplitude fluctuations [∼4 Hz: Hämäläinen et al., 2012] has been associated to reduced sensitivity to syllables in dyslexic individuals. Here, we evaluated whether sensitivity to both fast and slow oscillatory nonverbal auditory stimuli can be found within the same dyslexic individuals. In addition, we sought to better characterize the links between the anatomy of the auditory cortex and its oscillatory responses, taking into account previous studies which have observed structural alterations in dyslexia [Altarelli et al., 2014; Galaburda et al., 1985; Giraud and Ramus, 2013]. Lastly, by assessing both children and adults on similar tasks, we aimed to provide the first evaluation of developmental modulation of typical and atypical auditory sampling (and their structural underpinnings) in relation to that known to occur regarding phonological perceptual sensitivity [Ziegler and Goswami, 2005].
Auditory Neural Entrainment in Skilled and Dyslexic Readers
Several subcortical and cortical auditory brain regions are part of the speech neural network and are tuned to track AM at various rates [Middlebrooks, 2008]. Neural entrainment to temporal speech modulations allows accurate speech analysis through the mechanism of neural oscillatory entrainment, that is, the tendency of oscillatory brain activity to adapt to the spectral properties of external stimuli. Interestingly, the left and right auditory cortex play different roles in the temporal analysis of the speech envelope: the right hemisphere is specialized for processing slow modulations—delta (0–2 Hz) and theta (4–7 Hz) frequency bands—whereas a bilateral processing (also viewed as a left‐bias hemispheric specialization) is associated with the encoding of fast acoustic fluctuations—gamma (>30 Hz) and beta (15–30 Hz) frequency bands [Boemio et al., 2005; Poeppel, 2003; Vanvooren et al., 2014]. The right auditory cortex would therefore be sensitive to processing prosodic and syllabic information in speech [Abrams et al., 2009], while the left auditory cortex bias for processing fast modulations would reflect the sensitivity of this region to encoding phonemic cues [Obleser et al., 2008]. The asymmetric “specialization” of the auditory cortex [Poeppel, 2003] has been observed regardless of the nature of the auditory input and the involvement of higher‐level speech processes [Giraud and Poeppel, 2012a, 2012b; Morillon et al., 2010].
An atypical division of labor between the two hemispheres for sampling the speech signal at different frequencies has been shown to hinder the development of phonological awareness [e.g., Abrams et al., 2009]. In fact, several studies have shown that developmental dyslexia is associated with an altered synchronization of auditory cortex activity to the temporal structure of auditory stimuli [Giraud and Ramus, 2013; Goswami, 2011, 2013; Serniclaes et al., 2001; Tallal, 1980]. In particular, Hämäläinen et al. (2012) reported impaired neural oscillatory entrainment to slow AM white noise (at 2 Hz) in the right hemisphere. In the same vein, Leong and Goswami (2014) found that dyslexic readers presented reduced synchronization to AMs below 20 Hz in speech for rhythm recognition. These results are consistent with the theory positing that the brain responses of dyslexic individuals fail to align with the speech amplitude envelope that specifically encodes syllabic information [Goswami, 2011]. Interestingly, this proposal also explains the crucial role of “phonemic awareness” deficits in the manifestation of developmental dyslexia across languages [Caravolas et al., 2012]: in fact, a reduced sensitivity to syllables might impair the processing of fast phonemic‐rate information by disrupting the hierarchical coupling between the phase of low‐frequency (delta, theta) and the amplitude of high‐frequency (gamma) oscillations in auditory brain regions [Gross et al., 2013]. While Hämäläinen et al. (2012) did not measure neural entrainment at high frequencies and could not test the mutual influence of slow and fast neural oscillations, Lehongre et al. (2013) showed that an atypical left‐bias for neural entrainment to fast modulations was also found in dyslexic readers for speech stimuli, regardless of similar deficits in slow frequency bands (see also Lehongre et al., 2011 for non verbal stimuli).
The Neuroanatomy of the Auditory Cortex in Dyslexic Populations
The division of labor between the left and right auditory cortex in sampling information in the frequency domain [Poeppel, 2003] may well be linked to structural pro‐left hemispheric asymmetries [Foundas et al., 1994; Geschwind and Galaburda, 1985], such as those found in the neural structure of superficial layers of the auditory cortex [layer III; Hutsler and Galuske, 2003]. However, no structural index of the auditory cortex has been identified so far as significantly contributing to the development of the rhythmic sensitivity of neural oscillatory activity responding to speech.
Several studies have shown structural pro‐left asymmetries in the size of the planum temporale in approximately 70% of adult and infant post‐mortem brains [Geschwind and Levitsky, 1968; Witelson and Pappiel, 1973]. Interestingly, these asymmetries in the planum temporale contribute to reading abilities in children [Eckert and Leonard, 2001]. Moreover, the seminal studies by Galaburda (1989) and Galaburda et al. (1985) showed an anatomical symmetry of the planum temporale in dyslexia, due to an enlarged planum in the right hemisphere in dyslexic individuals. Although some of the subsequent work analyzing the size of auditory cortex with MRI confirmed Galaburda's findings [Larsen et al., 1990], recent studies have failed to do so [Leonard et al., 2001; Schultz et al., 1994].
In this study, we quantify the hemispheric asymmetry in cortical thickness (CT) of the left and right auditory cortex to better characterize its relations with the putative asymmetric hemispheric sampling of auditory signals in developmental dyslexia. According to Giraud and Poeppel's model (2012), two different neuronal populations specialized for sampling either slow or fast speech temporal structures in superficial layers (II/III) of the auditory cortex interact to encode stimulus‐driven spiking activity coming from deeper layers [Giraud and Poeppel, 2012a, 2012b]. Genetic factors associated with dyslexia could impair the neural migration of such populations of neurons toward other layers [“ectopias,” Galaburda and Kemper, 1979] and compromise efficient interactions between the neural populations specialized for low and high frequency sampling [Caviness et al., 1978; Galaburda et al., 1985; Giraud and Ramus, 2013]. Assuming that the organization of the microcolumnar structure within auditory regions affects the extent to which they are sensitive to the rates of auditory temporal fluctuations [Giraud and Ramus, 2013], we sought (i) to assess whether neuroanatomical asymmetries of the auditory cortex are tied to functional hemispheric asymmetries such as those characterizing hemispheric specialization for auditory sampling, (ii) and to determine whether abnormal structural asymmetry can contribute to the sampling deficits in dyslexia.
Reading‐Related Developmental Changes in the Structure and Function of the Auditory Cortex
A comprehensive understanding of the “oscillatory” bases of developmental dyslexia should take into account how the deficits change across development and with the amount of reading experience and exposure [Goswami et al., 2014]. This question is particularly relevant in the context of this study, since we know that the size of the phonological units to which prereaders are sensitive decreases as soon as their reading skills develop. In fact, children are highly sensitive to the syllabic (large grain) structure of words before learning to read and become progressively more sensitive to phonemic (small‐grain) units as they learn how to read [Anthony and Francis, 2005; Goswami and Bryant, 1990; Morais et al., 1987; Ziegler and Goswami, 2005]. Indeed, once literacy is taught, phonemic categories are rapidly acquired [Cossu et al., 1988; Harris and Giannouli, 1999; Liberman et al., 1974], and continue developing until adulthood, together with reading fluency [Torgesen et al., 1999]. Low frequency sampling linked to syllabic stress may in fact be trained from birth [e.g., Curtin, 2010; Molnar et al., 2014] until the exposure of alphabetic principles, where an enhancement of neural entrainment to high frequencies should be observed. Therefore, the sensitivity of the right hemisphere to slow frequencies (prosodic‐ and syllabic‐rates) in speech may already be highly tuned before the first print exposure, whereas the left hemispheric‐bias to high frequencies (phonemic‐rate) may largely depend on age‐related reading experiential factors [Minagawa‐Kawai et al., 2011]. Interestingly, both the prosodic and phonemic dimensions of phonological processing seem to be affected in dyslexic individuals across their lifespan [e.g., in children: Goswami and Leong, 2013; Serniclaes et al., 2004; in adults: Pennington et al., 1990; Soroli et al., 2010]. However, such findings in children and adults have been reported separately. Studies that directly compare both age groups with an identical paradigm could provide additional evidence about the evolution of the trajectory of the phonological deficits in dyslexia [e.g., Lallier et al., 2009].
Regarding the anatomical underpinning of the developmental changes associated with auditory, phonological, and reading development, previous studies have shown that the CT of both left and right auditory regions similarly decreases with chronological age factors [Magnotta et al., 1999; Shaw et al., 2008]. Mirroring age‐related structural changes, reading experience has also been shown to induce morphological variation in both the grey and white matter of the brain reading network [Richardson and Price, 2009], including the auditory cortex [Blackmon et al., 2010]. This cortical thinning is associated with increasing functional efficiency that emerges at the neuronal level due to synaptic pruning [Lu et al., 2007; Sowell et al., 2004]. Therefore, it is still unclear whether changes due to reading experience could be considered separately from chronological age factors that cause cortical thinning [Magnotta et al., 1999; Shaw et al., 2008]. Here we determine how anatomical developmental changes in auditory regions relate to changes in auditory neural entrainment linked to both chronological age (i.e., comparing children and adults including both skilled and dyslexic readers) and reading experiential factors at play above and beyond the influence of chronological age (i.e., comparing dyslexic and skilled readers independently of their age).
The Present Study
Behavioral, functional, and structural data were collected from two groups of skilled and dyslexic reader adults and children. From magnetoencephalographic (MEG) recordings, we evaluated the phase‐locking of the oscillatory responses elicited in the left and the right auditory cortex with auditory signals (AM white noise) modulated at theoretically relevant frequencies (delta, theta, and gamma) [Hämäläinen et al., 2012; Lehongre et al., 2011]. Furthermore, we calculated the lateralization index (LI) that allowed us to better characterize the hemispheric dominance and asymmetry of the effects [Abrams et al., 2009]. We expected differences in synchronization strength and hemispheric specialization to occur between dyslexic and skilled readers for both slow [delta, theta; Hämäläinen et al., 2012] and fast [gamma; Lehongre et al., 2011] AM rates. Moreover, auditory sampling strength and hemispheric specialization were expected to be sensitive to chronological age: if phonemic sensitivity increases with the amount of reading exposure and experience (Anthony and Francis, 2005), adults should present stronger brain sensitivity (and stronger left hemispheric bias) to gamma modulations than children. However, the consistency of neural phase‐locking to slow rate AM noise that supports prosodic and syllabic processing should be similar in adults and children, in line with developmental data suggesting that phonological sensitivity to these speech rhythms should be mastered before reading acquisition. Moreover, atypical hemispheric asymmetry for auditory entrainment to phonemic‐rate modulations was expected to be stronger in dyslexic adults than in dyslexic children. Indeed, if phonemic‐rate processing is refined based on the amount of reading exposure, larger gaps between dyslexic and skilled readers should be visible for the adult groups compared to the children groups.
Structural analysis based on CT was expected to reveal a cortical thinning of the auditory cortex due to chronological age factors. After partialling out the cortical thinning effect due to chronological age, we should also observe a cortical thinning (synaptic pruning) in auditory regions due to the functional efficiency developed with reading experience. If phonemic sensitivity increases with reading experience and this is supported by an enhancement of phonemic‐rate AM tracking and synaptic pruning in auditory regions, we predict observation of a negative correlation between cortical thinning and synchronization strength to gamma modulations, at least in skilled readers. On the other hand, this relation is not expected for the dyslexic participants, if reading impairment is associated with the development of the perceptual sensitivity to phonemic‐rate auditory information [Lehongre et al., 2011].
MATERIALS AND METHODS
Participants
The present experiment was undertaken with the understanding and written consent of each participant (or the legal tutor of each child below 18 years old). Forty‐two individuals took part in this study. Participants attending or having completed an education level superior to secondary school were assigned to the adult group. Ten skilled reader children (five females) and 10 dyslexic children (four females) matched in age (t(18) = 1.01, P > 0.05; age range: 8.0–14.3 years) participated in the study. Eleven skilled reader adults (seven females) and 11 dyslexic reader adults (six females) matched in age (t(20) = 0.37, P > 0.05; age range: 17.3–44.9 yrs.) composed the adult group. All participants had Spanish as their native language and were not fluent in any other language. All participants had normal or corrected‐to‐normal vision and reported no hearing impairments and were right handed. All the dyslexic individuals taking part in this study reported reading and/or writing difficulties and had all received a formal diagnosis of dyslexia. None of the skilled readers reported reading or spelling difficulties or had received a previous formal diagnosis of dyslexia.
Behavioral Data
Intelligence quotient (adults and children)
Children were administered the Wechsler Intelligence Scale for Children‐Revised (WISC‐R) [Wechsler, 2001], and adults were administered the Wechsler Adult Intelligence Scale (WAIS) batteries [Wechsler, 2008] to measure the intelligence quotient.
Reading (adults and children)
The reading performance of participants was evaluated with the word reading list and pseudoword reading list of the PROLEC‐R battery [Cuetos et al., 2009]. For each of the two lists, accuracy and total time to read the list were recorded.
Spelling aloud task (adults)
Since Spanish is a transparent language, highly regular grapheme‐to‐phoneme conversion rules may help overcome reading problems in adults, particularly with increasing reading experience and age. To increase the sensitivity of a diagnosis of written language difficulties in the older group, we assessed phonological abilities bearing on visual word recognition but that do not directly tap reading activity and that have been shown to be impaired in dyslexic adult readers of transparent orthographies [Helenius et al., 2002]. Adult participants were presented with a spelling aloud task. In this task, they were presented with 15 Spanish words, one by one, and they had to spell them aloud letter by letter. The words varied in frequency and length (2–5 syllables; 6–10 letters). Participants’ responses were recorded.
Phonological processing (adults and children)
Pseudoword repetition (phonological short term memory)
Participants listened to 24 pseudowords one after the other using headphones and were instructed to repeat them as accurately as possible. Items varied from 2 to 4 syllables (eight of 2, 3, and 4 syllables) and their structure followed Spanish phonotactic rules. They did not include the repetition of any phoneme. The number of correctly repeated pseudowords was recorded and converted into percentages. Phonemic errors were then analyzed, for example, phonemic addition (/taØforbegun/→/tasforbegun/), phonemic substitution (/talsomen/→/kalsomen/), phonemic permutation (/musbolife/→/muslobife/), and phonemic omission (/taforbegun/→/taforbeguØ/). The total number of phonemic errors was recorded.
Phonemic deletion (phonemic awareness)
Participants had to listen to pseudowords using headphones and were instructed to remove the first sound of the pseudoword and produce what remained. Twenty‐four items were presented. These were two syllables‐long and followed Spanish phonotactic rules. Half of the items started with a consonantal cluster (e.g., /tr/) and the remaining half with a simple consonant‐vowel syllable (e.g., /pa/). The number of correct answers was recorded and converted into percentages. Then, errors were classified into the following categories: phoneme deletions errors (e.g., /pladi/→/adi/) and phonemic errors occurring outside of the deletion site (e.g., /pladi/→/lati/).
Functional Data (MEG Recording)
Stimuli
Auditory stimuli were obtained by modulating the amplitude of white noise sounds. The stimuli were generated at a sampling frequency of 44.1 kHz and modulated using Matlab R2010 (Mathworks, Natick, MA) functions. AM were applied at the following frequencies: 2, 4, 7, 30, and 60 Hz rates with 100% depth. In addition, one condition included nonmodulated white noise. All stimuli lasted 10 s and appeared 25 times throughout the task. The order of the presentation of stimuli was pseudo‐randomized across the experiment, with the only constraint that two stimuli modulated at identical frequency were never presented consecutively.
Procedure
During the MEG recording, the participants sat comfortably in the magnetically shielded room watching a silent movie and hearing the stimuli. Participants were asked to pay attention to the movie and try to avoid head movements and blinks. Auditory stimuli were delivered to both ears using Presentation software (http://www.neurobs.com/) via plastic tubes. The volume levels were tuned (75–80 dB sound pressure level) to optimize the listening condition for all participants.
Data acquisition and preprocessing
MEG functional data
MEG raw data were acquired using a whole‐scalp MEG system (Elekta‐Neuromag, Helsinki, Finland) installed at the Basque Center on Cognition, Brain and Language (BCBL): (http://www.bcbl.eu/bcbl-facilitiesresources/meg/). The system is equipped with 102 sensor triplets (a magnetometer and two orthogonal planar gradiometers) uniformly distributed around the head of the participant. Head position inside the helmet was continuously monitored using four head position indicator coils. The location of each coil relative to the anatomical fiducials (nasion, left and right preauricular points) was defined with a three‐dimensional (3D) digitizer (Fastrak Polhemus, Colchester, VA). This procedure is critical for head movement compensation during data recording. Digitalization of the fiducials plus ∼100 additional points evenly distributed over the scalp of the participant were used during off‐line data analysis to spatially align the MEG sensor coordinates with T 1 images. MEG recordings were acquired continuously with a bandpass filter at 0.01–330 Hz at a sampling rate of 1 kHz. Ocular activity was monitored with two pairs of electrodes in a bipolar montage placed on the external chanti of each eye (horizontal electro‐oculogram [EOG]) and above and below the right eye (vertical EOG).
To remove external magnetic noise from the MEG recordings, data were preprocessed off‐line using the Signal‐Space‐Separation method [Taulu and Kajola, 2005] implemented in Maxfilter 2.1 (Elekta‐Neuromag). MEG data were also corrected for head movements, and bad channels were substituted using interpolation algorithms implemented in the software.
Subsequent analyses were performed using Matlab R2010 (MathWorks). Heart beat and EOG artifacts were detected using independent component analysis (ICA) and linearly subtracted from recordings. The ICA decomposition was performed using the Infomax algorithm implemented in Fieldtrip toolbox [Bell and Sejnowski, 1995; Oostenveld et al., 2011]. Raw data were segmented into epochs of duration corresponding to a two modulation cycles (1000, 500, 285, 66, and 33 ms long epochs for the 2, 4, 7, 30, and 60 Hz AM rates, respectively). Epochs with MEG peak‐to‐peak amplitude values exceeding 4000 ft (magnetometer) or 3000 ft/cm (gradiometer) were considered as artifact contaminated and rejected from the subsequent analyses. On average, the percentage of epochs retained in the final analyses were 67% (SD: 16%), 76% (12%), 83% (11%), 89% (9%), and 88% (13%) for the 2, 4, 7, 30, and 60 Hz modulation frequencies, respectively. There were no significant differences (P values > 0.1) in the number of accepted trials between groups across all AM frequencies.
MEG measures computation
Phase Locking Values—Source level measures
The forward solution was based on the anatomical MRI (T 1) of each individual participant. MRI images were segmented using Freesurfer software [Dale and Sereno, 1993; Fischl et al., 1999]. The MEG forward model was computed using a single shell boundary‐element model using the MNE software [Gramfort et al., 2014] for pairs of orthogonal tangential current dipoles distributed on a 5 mm homogeneous grid source space covering the whole brain. The cross‐spectral density matrix for all sensors was computed from the Fourier transformed artifact‐free epochs at the AM frequency. Based on the forward model and the cross‐spectral density matrix, dynamic imaging of coherent sources algorithm [Gross et al., 2001] was applied to obtain spatial filter coefficients for every source location and orientation. Source activity at the AM frequency was then obtained as the matrix product of the spatial filter coefficients arranged in a row vector with each Fourier transformed epoch at the AM frequency arranged in a column vector. For each source the phase locking value (PLV) [Lachaux et al., 1999] was computed as follows:
| (1) |
with the phase of the source activity for the nth epoch and where the sum is performed across the N artifact‐free epochs. Source data in both orientations were combined to obtain a single optimum orientation that maximizes the PLV. Thus, five PLV maps (one for each modulation rate: 2, 4, 7, 30, and 60 Hz) were obtained for each participant. The PLV takes a value of 1 when the phase is identical across epochs and it takes a value close to 0 when the phase is inconsistent across epochs.
PLV maps for each frequency were transformed from individual MRIs to the standard Montreal Neurological Institute (MNI)‐Colin 27 brain using the spatial normalization algorithm implemented in Statistical Parametric Mapping (SPM8, Wellcome Department of Cognition Neurology, London, UK). Within the MNI space, brain regions showing significant PLVs across conditions (2, 4, 7, 30, and 60 Hz AM frequencies) and regardless of the group (skilled readers and dyslexics) were identified with a nonparametric permutation test [Nichols and Holmes, 2002]. To do so, we first computed “surrogate” PLV maps, which were PLV maps computed with the condition‐specific epoch length but using the data from the unmodulated noise condition. “Authentic” and surrogate maps were subtracted and further averaged across subjects (regardless of the group). Values from this contrast were then compared to their permutation distribution (permutation within subjects, performed over the label authentic and surrogate) built from a subset of 1000 permutations. Briefly, for each permutation, authentic and surrogate PLV maps from each individual were swapped with probability 0.5, the contrast map was then computed from these shuffled PLV maps, and the permutation distribution for that permutation was set to the maximal value (across all sources) of the contrast map. Sources with nonpermuted PLV contrast above the 95‐percentile of the permutation distribution were considered significantly (P < 0.05) phase‐locked to auditory stimulation. Bilateral superior temporal gyrus (BA42), middle and posterior regions of the temporal sulcus (BA22), and the Heschl's s gyrus (BA41) showed robust PLV effects (Supporting Information Fig. 1S; Supporting Information Table 1S) [Giraud et al., 2000]. The statistical analysis was repeated for each frequency rate separately (Fig. 1), and overall, these same regions were significantly activated (Table 1). Intracranial recordings found significant synchronization between neural oscillations and AM white noise regardless of the frequency rate in the same regions [stereoelectroencephalography; Bancaud et al., 1965; Liégeois‐Chauvel et al., 2004]. Thus, we defined a region of interest (ROI) including the previously mentioned Brodmann areas (BA41, BA42, and BA22). The mask defined by the ROI was applied to the corresponding PLV map for each participants and mean of the masked PLVs in the left hemisphere and right hemisphere was calculated separately.
Figure 1.
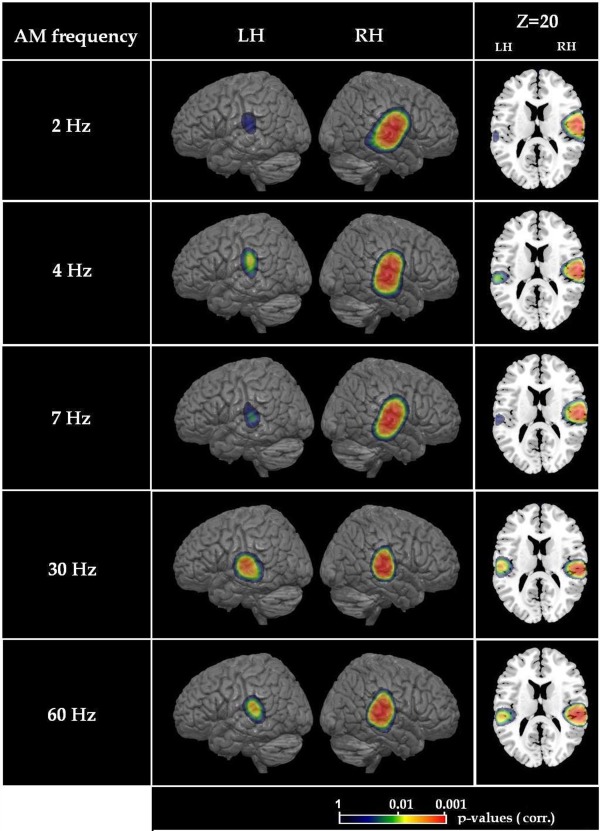
(A): Statistical map (P values) representing sources that present stronger synchronization compared to the unmodulated noise condition at each AM frequency across all participants. (B): The brain slice in the axial plane at Z = 20 (MNI coordinates) illustrates source deepness.
Table 1.
Brain source of maximum significance (minimum P‐value) for each AM frequency and hemisphere
| AM frequency | Brain region | BA | MNI coordinates | ||
|---|---|---|---|---|---|
| 2 Hz | R superior temporal sulcus | BA22 | 62 | −10 | 11 |
| 2 Hz | L superior temporal gyrus | BA42 | −61 | −26 | 15 |
| 4 Hz | R superior temporal sulcus | BA22 | 63 | −17 | 6 |
| 4 Hz | L inferior parietal | BA40 | −59 | −27 | 24 |
| 7 Hz | R superior temporal sulcus | BA22 | 62 | −16 | 7 |
| 7 Hz | L superior temporal sulcus | BA22 | −62 | −25 | 8 |
| 10 Hz | R superior temporal sulcus | BA22 | 62 | −17 | 5 |
| 10 Hz | L superior temporal sulcus | BA22 | −59 | −21 | 9 |
| 15 Hz | R superior temporal sulcus | BA22 | 61 | −18 | 10 |
| 15 Hz | L superior temporal sulcus | BA22 | 58 | −24 | 11 |
| 30 Hz | R superior temporal sulcus | BA22 | 60 | −24 | 6 |
| 30 Hz | L superior temporal sulcus | BA22 | −57 | −19 | 7 |
| 60 Hz | R superior temporal sulcus | BA22 | 59 | −27 | 9 |
| 60 Hz | L superior temporal gyrus | BA22 | −58 | −30 | 16 |
AM, amplitude modulation; BA, Brodmann area; R, right; L, left.
Brain hemispheric synchronization dominance for each frequency rate and participant was determined by a measure called the lateralization index (LI). The LI can be written as
where A R and A L expressed mean of the masked PLVs in the right and left hemisphere respectively. LI values vary between −1 and 1. Positive LI indicate a right hemisphere dominance, while negative values indicate a left hemisphere dominance.
Structural Data (MRI Recording)
MRI structural data
All subjects underwent structural MRI scanning in a single session, using the same 3.0 Tesla Siemens Magnetom Trio Tim scanner (Siemens AG, Erlangen, Germany), located at the BCBL in Donostia‐San Sebastián. A high‐resolution T 1‐weighted scan was acquired with a 3D ultrafast gradient echo (MPRAGE) pulse sequence using a 32‐channel head coil and with the following acquisition parameters: FOV = 256; 160 contiguous axial slices; voxel resolution 1 mm × 1 mm × 1 mm; TR = 2300 ms, TE = 2.97 ms, flip angle = 9°. Cortical reconstruction and volumetric segmentation was performed with the Freesurfer image analysis suite, (http://surfer.nmr.mgh.harvard.edu/). Briefly, this processing includes motion correction, removal of non‐brain tissue, automated Talairach transformation, segmentation of the subcortical white matter and deep gray matter volumetric structures, tessellation of the gray matter white matter boundary, automated topology correction, and surface deformation following intensity gradients to optimally place the gray/white and gray/cerebrospinal fluid borders at the location where the greatest shift in intensity defines the transition to the other tissue class [Dale et al., 1999; Fischl and Dale, 2000; Fischl et al., 2002; Segonne et al., 2004].
CT—structural level measures
A number of deformable procedures were performed automatically in the data analysis pipeline, including surface inflation and registration to a spherical atlas. This method uses both intensity and continuity information from the entire three dimensional MR images in segmentation and deformation procedures to produce representations of CT, calculated as the closest distance from the gray/white boundary to the gray/CSF boundary at each vertex on the tessellated surface. These maps were not restricted to the voxel resolution of the original data and thus afford detection of submillimeter differences between groups. The CT analysis was restricted to the ROI defined in the MNI‐Colin 27 space and was calculated separately for the right and left hemisphere. Finally, the cortical surface was resampled to each subject's space, and average cortical thickness data were obtained in each hemisphere independently for each subject. LI values were also obtained. In this case, A R and A L reflect mean CT values restricted to the ROI in the right and left hemisphere, respectively.
Statistical Analysis
Evaluation of the reading disorder in the dyslexic groups
Regarding the reading skills of children (Table 2), z‐scores were computed based on the corresponding age norms [Cuetos et al., 2009]. For adults, z‐scores were computed based on the performance of 46 skilled monolingual Spanish adults matched for age (M = 32.46; SD = 11.57) with the control and dyslexic groups of this study (F < 1). This norm was created and used for the purpose of this study since the PROLEC‐R battery offers normative data up to the age of 15 − 16 years. In the absence of normative data for the spelling aloud task designed for this study, we used the t distribution method [t modified, Crawford and Howell, 1998] to establish the presence of a deficit for each dyslexic adult as compared to the control group. This test has been shown to be robust in the case of small control groups [Crawford et al., 2006]. General IQ scores obtained by each participant were compared to 80 (only participants with a score superior to 80 were included in the study).
Table 2.
Characteristics of the four groups of participants regarding their IQ, reading and spelling skills
| Dyslexic group | Control group | |||||
|---|---|---|---|---|---|---|
| M(SD) | Range | z score | M(SD) | Range | z score | |
| Children (n = 20) | ||||||
| n = 10 | n = 10 | |||||
| IQ (Standard score) | 113.9(10.0) | 98–122 | – | 111.0 (8.0) | 100–130 | |
| Word readinga | n = 10 | n = 10 | ||||
| Accuracy (/40) | 34.3(6.0) | 18–39 | −7.0e | 39.4(.08) | 38–40 | −0.05 |
| Time (s) | 73.4(48.2) | 29–202 | −3.7e | 30.0(7.0) | 20–48 | 0.60 |
| Pseudoword readinga | n = 10 | n = 10 | ||||
| Accuracy (/40) | 28.8(6.3) | 16–34 | −3.9e | 37.0(1.4) | 34–39 | −0.25 |
| Time (s) | 95.7(59.1) | 43–245 | −2.7e | 53.3(8.2) | 43–60 | 0.34 |
| Adults (n = 22) | ||||||
| n = 11 | n = 11 | |||||
| IQ (standard score) | 118.5(4.5) | 115–131 | – | 125.2(4.4) | 115–127 | |
| Word readingb | n = 11 | n = 11 | ||||
| Accuracy (/40) | 38.4(1.6) | 35–40 | −4.2e | 39.8(.038) | 39–40 | −0.15 |
| Time (s) | 37.2(11.7) | 23–66 | −4.6e | 23.3(3.98) | 19–27 | −0.46 |
| Pseudoword readingb | n = 11 | n = 11 | ||||
| Accuracy (/40) | 34.(3.66) | 28–40 | −4.5e | 39.0(.085) | 37–40 | 0.04 |
| Time (s) | 63.0(16.4) | 49–110 | −7.8e | 39.0(5.36) | 32–50 | −1.2 |
| Spelling aloudc | n = 11 | n = 11 | ||||
| Accuracy (/15) | 9.7(2.0) | 8–12 | −2.12d | 14.45(0.049) | 14–15 | 0.0 |
n = number of participants that took part in the task.
z‐scores computed based on the PROLEC‐R age‐matched normative data.
z‐scores computed based on 46 skilled reader adults on the PROLEC‐R reading lists.
t modified statistics computed based on the mean performance of the control group.
P < 0.05.
P < 0.01.
Group differences in phonological processing and brain measures
Independent ANOVAs with group (dyslexic vs. control) and age (adults vs. children) as between‐subject factor were conducted on the measures obtained in the two phonological processing tasks. The number of participants that completed each phonological processing task is indicated in Table 3.
Table 3.
Characteristics of the four groups of participants regarding their phonological skills
| Phonological skills | Dyslexic group | Control group | P | ||
|---|---|---|---|---|---|
| M(SD) | Range | M(SD) | Range | ||
| Children (n = 20) | |||||
| Pseudoword repetition | n = 8 | n = 10 | |||
| Accuracy (%) | 78.6(6.7) | 66.6–87.5 | 85.0(7.9) | 70.8–100 | <0.005 |
| Number of phonemic errors | 6.5(2.2) | 3–10 | 4.9(3.9) | 0–13 | 0.05 |
| Phonemic deletion | n = 9 | n = 9 | |||
| Total accuracy (%) | 78.7(23.6) | 25–100 | 91.1(8.9) | 83.3–100 | n.s. |
| Number of deletion errors | 3.7(4.8) | 0–13 | 1.7(2.0) | 0–7 | 0.23 |
| Number of errors out of deletion site | 2.8(3.6) | 0–12 | 1.1(1.2) | 0–3 | 0.14 |
| Adults (n = 22) | |||||
| Pseudoword repetition | n = 9 | n = 11 | |||
| Accuracy (/40) | 79.1(9.0) | 66.6–91.6 | 91.8 (5.7) | 79–100 | <0.005 |
| Number of phonemic errors | 5.8(2.0) | 2‐9 | 2.4(2.2) | 0–7 | <0.05 |
| Phonemic deletion | n = 11 | n = 11 | |||
| Total accuracy (%) | 82.9(15.2) | 41.6‐100 | 90.9(13.6) | 62.5–100 | n.s |
| Number of deletion errors | 3.1(3.1) | 0–12 | 2.2(3.2) | 0–9 | 0.23 |
| Number of errors out of deletion site | 2.2(2.2) | 0–8 | 0.4(0.9) | 0–3 | 0.14 |
The P‐value of the dyslexics vs. control comparison is provided in the last column. n = number of participants that took part in the task.
The analysis of the brain responses of participants during the passive listening task consisted in conducting mixed‐design ANOVAs for each frequency condition separately (2 Hz, 4 Hz, 7 Hz, 30 Hz, and 60 Hz) on the mean of the masked PLVs, with hemisphere (left vs. right) as the within‐subject factor and group and age as the between‐subject factor. Based on the observed significant effects of the between‐subject factor, mean LI values were computed for the groups that significantly differed on PLVs. These LI values were tested against zero with a single t‐test to determine a left or right significant lateralization for that specific frequency.
Lastly, a mixed‐design ANOVA was conducted on CT with hemisphere as the within‐subject factor, and group and age as the between‐subject factor. The structural data of two participants was excluded from the analysis due to data acquisition problems in the MRI scanning. Thus, the CT of 20 dyslexic readers (10 children and 10 adults) and 20 normal readers (10 children and 10 adults) was calculated.
For all ANOVAs, Bonferroni post hoc tests were used when appropriate and data transformation was performed when the assumptions to conduct ANOVA were violated.
Correlation analyses
Correlations between reading skills, phonological skills, and brain measures (LI of the PLVs at the frequencies showing significant group effects, and the LI of the CT) were conducted. Note that only reading time measures were used since accuracy scores were very high with little variance in the data (Table 2). In transparent orthographies, reading speed is known to be a stronger predictor of reading skills than reading accuracy. Data transformation was performed on reading times (1/x − corrected) to respect normality. Correlation analysis between the two brain lateralization indexes (structural—CT and functional—PLVs) were also computed.
RESULTS
Behavioral Results
Table 2 presents the behavioral assessment for both dyslexic and skilled readers.
IQ
All participants obtained an IQ score superior to 80 on the WISC‐R or WAIS tests, suggesting normal intelligence in all our participants. However, a main group effect was found (F(1,38) = 4.34, P = 0.04, n p 2 = 0.1) suggesting that the dyslexic participants exhibited lower IQ than their control peers regardless of age (F < 1) (Table 2)1. IQ was controlled for in further group comparisons and correlation analyses conducted within a sample including both dyslexic and control participants.
Reading and Spelling Aloud Skills
Overall, both the group of dyslexic children and the group of dyslexic adults showed negative average z‐scores, reflecting significantly impaired reading time and accuracy for both words and pseudowords (and spelling aloud for the dyslexic adults) compared to the age‐matched norm. All corresponding averaged z‐scores fell within the normal range for the two control groups (Table 2).
Phonological Skills
A main effect of group (F(1,33) = 10.6, P < 0.01, n p 2 = 0.24) but not age (F < 1) was found for total accuracy in the pseudoword repetition task, showing that dyslexic participants were worse at performing the task than control participants, regardless of the age (F(1,33) = 1.46, P = 0.23, n p 2 = 0.04). Accordingly, dyslexic participants made more phonemic errors than their controls (F(1,33) = 6.5, P < 0.05, n p 2 = 0.17). Children tended to produce more phonemic errors (M Ch = 5.6, SDCh = 3.4) than adults (M Ad = 4, SDAd = 2.8) overall (F(1,33) = 2.1, P = 0.15, n p 2 = 0.06). No interaction was found between the two factors (F < 1).
On the phonemic deletion task, no main effect or interaction was found on the total accuracy, the numbers of errors on the deletion site or outside of the deletion site (all Fs < 2.2). Still, it is noteworthy that dyslexic participants generally made more errors than their controls (Table 3).
Functional Results—PLVs
No significant main effect of hemisphere, group or age or interaction between these factors was found on the PLVs for the 2 and 7 Hz frequency rates (all Fs < 3.1, Ps > 0.8). Below, we report the three main results emerging in the MEG analyses, as well as correlation of brain measures with reading and phonological measures.
Atypical Low Frequency (4 Hz) Synchronization Enhancement in Dyslexia Regardless of Age
We observed a significant group effect for the synchronization strength at the 4 Hz frequency rate (F(1,37) = 4.8, P < 0.05, n p 2 = 0.1) that was neither modulated by age or hemisphere (Fs < 1.9). Overall, dyslexic participants presented stronger synchronization at 4 Hz (M Dys = 0.14, SDDys = 0.05) compared to controls (M Ctr = 0.11, SDCtr = 0.05). Hemispheric specialization patterns of LI values were assessed for the dyslexic and control groups separately. LI values showed a right hemispheric lateralization for brain synchronization at 4 Hz in the control group (M Ctr = 0.15, SDCtr = 0.33, P < 0.05), whereas this hemispheric dominance was not present for the dyslexic participants (M Dys = 0.09, SDDys = 0.34, P = 0.21) (Fig. 2A). Positive partial correlations (controlling for chronological age and IQ) were found between LI values and both word and pseudoword reading times (reciprocal transformation) in the control group, (Word: r = 0.54, P < 0.01 (Fig. 3A); Pseudoword: r = 0.44, P < 0.05 (Fig. 3B)) but not within the dyslexic group (P > 0.7). In the control group, the faster the word and pseudoword reading, the more right lateralized the PLVs at 4 Hz.
Figure 2.
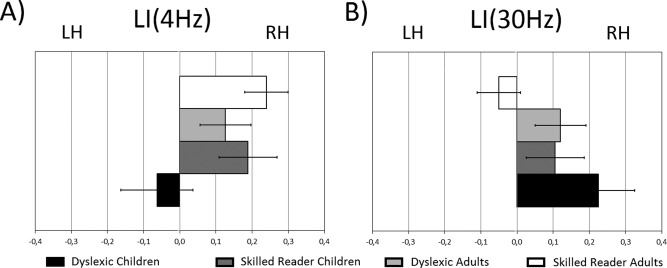
The mean and standard error of the LI at 4 Hz (A) and 30 Hz (B) in dyslexic children (black), skilled reader children (dark grey), dyslexic adults (light grey), and skilled reader adults (white) are represented (positive values indicate a rightward lateralization while negative values a leftward lateralization).
Figure 3.
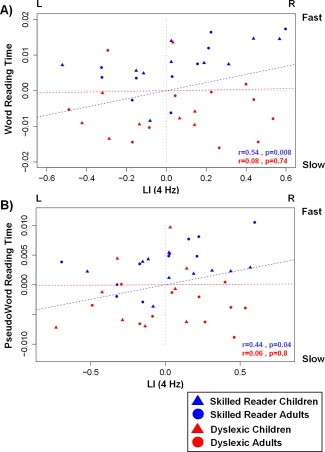
Correlation between the LI values at 4 Hz (LI(4Hz) on x axis; negative and positive values indicate left and right hemispheric dominance, respectively) and the residual values (age and IQ corrected) of the inverse of word (A) and pseudoword (B) reading times (y axis) within the group of skilled (children: blue triangle, adults: blue circle) and dyslexic (children: red triangle, adults: red circle) readers.
High Frequency (30–60 Hz) Synchronization Enhancement with Age Regardless of the Group
An age effect was found for the synchronization strength for both conditions of gamma frequency (30 Hz: F(1,37) = 10.2, P < 0.01, n p 2 = 0.21; 60 Hz: F(1,37) = 11.44, P < 0.01, n p 2 = 0.23). Adults showed stronger neural synchronization to the AM noises (30 Hz: M Ad = 0.06, SDAd = 0.02; 60 Hz: M Ad = 0.05, SDAd = 0.05) than children (30 Hz: M Ch = 0.03, SDCh = 0.02; 60 Hz: M Ch = 0.015, SDCh = 0.01). Hemispheric specialization patterns of LI values at 30 Hz and 60 Hz were assessed for children and adults separately. LI values at 30 Hz reflected a rightward hemispheric lateralization of the PLVs in children (M Ch = 0.17, SDCh = 0.32, P = 0.03), but not in adults (M Ch = 0.02, SDCh = 0.29, P = 0.72) (Fig. 2B). No hemispheric asymmetry in the PLVs was found for AM noise at 60 Hz, in either of the groups (Supporting Information Fig. 2S). When individual chronological age and IQ were partialled out, the number of errors at repeating pseudowords and LI values at 30 Hz showed a significant positive relationship in adults (r = 0.51, P = 0.02) but not in children (r = 0.1, P = 0.7) indicating that adults with the strongest leftward hemispheric lateralization for AM noise at 30 Hz were the most accurate in repeating pseudowords (Fig. 4).
Figure 4.
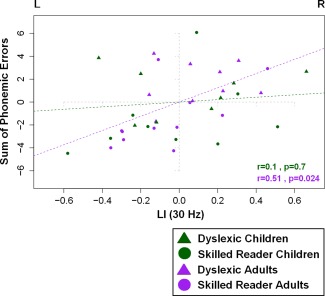
Correlation between the LI values at 30 Hz (LI(30 Hz) on x axis; negative and positive values indicate left and right dominance, respectively) and the residual values (age and IQ corrected) of the sum of phonemic errors in the phonological short term memory task (y axis) within the group of children (dyslexic: green triangle, control: green circle) and adults (dyslexic: purple triangle, control: purple circle) readers.
Right‐Lateralized Neural Entrainment to AM Noise at 30 Hz in Adults and Children with Dyslexia
Interestingly, a hemisphere by group interaction was observed for the synchronization strength at 30 Hz (F(1,37) = 4.13, P < 0.05, n p 2 = 0.1), which was not modulated by age (F(1,37) = 0.53). Post hoc analysis showed that PLVs were higher in the dyslexic group than the control group in the right hemisphere (P < 0.05; M Dys = 0.06, SDDys = 0.03; M Ctr = 0.04, SDCtr = 0.02), whereas no group difference was found in the left hemisphere (P > 0.5; M Dys = 0.04, SDDys = 0.02; M Ctr = 0.04, SDCtr = 0.03). Moreover, greater PLVs were found in the right compared to the left hemisphere in the dyslexic group (P = 0.02) indicating an asymmetry toward the right hemisphere. In controls, no difference was found between the two hemispheres (P = 0.68), suggesting bilateral sensitivity to 30 Hz modulations.
Analyses of the LI values confirmed that dyslexic participants presented a significant rightward hemispheric lateralization for the neural synchronization to AM modulations at 30 Hz (M Dys = 0.17, SDDys = 0.27, P < 0.01), while controls showed no hemispheric bias (M Ctr = 0.02, SDCtr = 0.29, P = 0.72) (Fig. 2B). No correlation was found between the LI values at 30 Hz and reading, phonemic awareness, or phonological short‐term memory measures after controlling for IQ and chronological age (all rs < 0.34, Ps > 0.14).
STRUCTURAL RESULTS—CT
An age effect on CT was found (F(1,35) = 33.3, P < 0.01, n p 2 = 0.48), which also interacted with hemisphere (F(1,35) = 5.6, P < 0.05, n p 2 = 0.14). Post hoc analysis revealed that the auditory cortex was thinner in adults (M RH = 2.7, SDRH = 0.15; M LH = 2.7, SDLH = 0.18) than children (M RH = 2.9, SDRH = 0.13; M LH = 3, SDLH = 0.11) in both right (P < 0.001) and left (P < 0.01) hemispheres. Moreover, the right auditory cortex was thinner than the left auditory cortex in children (P < 0.01) but not in adults (P = 0.64) (Fig. 5). Analyses of the LI of CT confirmed that children show a significant rightward asymmetry of the auditory cortices (P = 0.04) that was not present in adults (P = 0.46). No main effect or interaction effect involving the factor group was found (Fs < 2.44).
Figure 5.
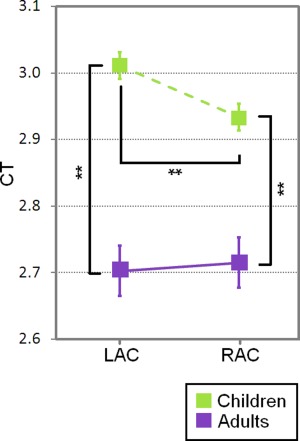
Mean and standard error of the CT in the left (LAC) and right (RAC) auditory cortex in adults (purple) and children (green) (**P < 0.01).
RELATION BETWEEN FUNCTIONAL (PLVs) and STRUCTURAL (CT) RESULTS
Because both CT and PLVs at 4 Hz and 30 Hz played a significant role in both the age and group differences presented above, we performed partial correlation analyses, controlling for chronological age and IQ, between the functional and structural LI measures within the control group and the dyslexic group as well as in the child group and the adult group. For the 4 Hz frequency rate, we observed a positive correlation between LI of both CT and PLVs at 4 Hz in the dyslexic group (r = 0.5, P = 0.01). A lateralized bias in the neural synchronization to AM noise at 4 Hz to the right hemisphere was associated with a left hemispheric bias for cortical thinning. No such correlation emerged within the control group (r = 0.2, P = 0.2) (Fig. 6A). When considering the 30 Hz frequency rate, LI of CT and PLVs correlated negatively within the whole control group (r = −0.4, P < 0.05), indicating that an asymmetry of neural synchronization to AM noise at 30 Hz toward the left hemisphere was associated with cortical thinning bias towards this same left hemisphere. No such correlation was found within the dyslexic group (r = 0.15, P = 0.27) (Fig. 6B).
Figure 6.
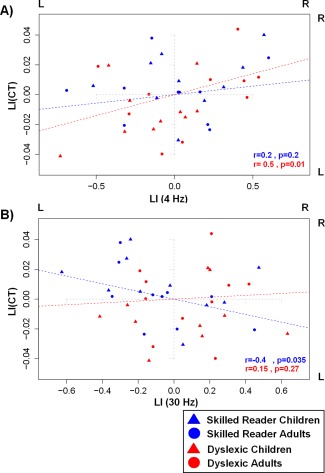
(A): Correlation between the LI at 4 Hz (LI(4 Hz) on the x axis; negative and positive values indicate left and right dominance respectively) and the LI of the CT (LI(CT)) (y axis; negative and positive values indicate thicker CT in the left (relative to the right) and right (relative to the left) auditory cortex respectively) within skilled (n = 20, blue) (children: blue triangle, adults: blue circle) and dyslexic (children: red triangle, adults: red circle) readers. (B): Correlation between the LI at 30 Hz (LI(30 Hz)) and LI(CT) in skilled (children: blue triangle, adults: blue circle) and dyslexic (children: red triangle, adults: red circle) readers.
DISCUSSION
This study adds important evidence to support the idea that atypical neural sampling of auditory signals at slow or/and fast frequency bands underlies developmental dyslexia [Lehongre et al., 2013; Power et al., 2013]. Children and adults were tested for the first time with a similar paradigm, allowing us to examine whether the neural sampling deficit in developmental dyslexia is modulated by developmental changes. Importantly, we used MEG recordings in association with the structural brain images of the participants to provide insights on the neural sources of the sampling deficit found in dyslexia.
Our results showed atypical neural synchronization to both syllabic‐ and phonemic‐rate modulations in the dyslexic group compared to their control peers. Models of typical speech perception show that neuronal activity from the right auditory cortex is optimized for sampling speech information occurring at low frequencies (at delta‐theta) [Abrams et al., 2009], while high frequencies are processed bilaterally [Boemio et al., 2005; Vanvooren et al., 2014] or with a left hemispheric bias [Poeppel, 2003]. Consistent with this literature, both skilled reader adults and children showed a rightward asymmetric specialization for sampling slow AM noise (4 Hz) and a bilateral synchronization for faster AM noise (30 Hz). Dyslexic children and adults showed the opposite pattern, that is, an absence of significant rightward lateralization for low frequencies (4 Hz), and a rightward lateralization for high frequencies (30 Hz).
Abnormal sensitivity and lateralization patterns for neural synchronization to low frequency temporal features present in nonspeech and speech signals have previously been associated with reading impairments [Hämäläinen et al., 2012; Power et al., 2013]. Accordingly, we found a significant relationship between synchronization asymmetries at 4 Hz and reading speed within the control group, showing that stronger rightward asymmetric synchronization was associated with faster pseudoword and word reading. Contrary to what was observed for hemispheric asymmetry, the overall strength of synchronization for AM noise processing at 4 Hz did not seem to contribute to normal reading. In fact, PLVs were stronger in the dyslexic group than in the control group in both hemispheres. This unexpected high neural synchronization to the auditory stimuli in our dyslexic sample may indicate a greater reliance on sampling auditory information at the syllabic‐rate in these participants compared to their skilled reader peers. Interestingly, sensitivity to the phonological syllabic rate (∼4 Hz) is of special relevance for Spanish, which falls within the rhythmic class of syllable‐timed languages [Ramus et al., 1999]. The high availability of syllabic‐rate information in Spanish may have led our dyslexic participants to compensate by relying more strongly on temporal modulations at this rate, possibly to cope with their impaired right hemispheric specialization. Crosslinguistic differences in phonological parameters could also explain why we did not observe any group difference at the lowest rate (2 Hz). According to the temporal sampling theory of dyslexia [Goswami, 2011], atypical temporal sampling within both the delta (2 Hz) and theta (4 Hz) ranges should contribute to reading disorders, since they relate to the encoding of syllabic‐relevant speech rates (e.g., syllabic stress and syllable, respectively; Goswami, 2015). Supporting evidence has been reported for speech [Power et al., 2013] and nonspeech [Hämäläinen et al., 2012] stimuli in English individuals. Contrary to Spanish, English is a stress‐timed language and stress might be especially prominent and relevant for speech segmentation and phonological development in this language. Rhythm variations between Spanish and English might therefore have an impact on the strength of the sampling deficits observed at delta in dyslexia (and possibly theta, as proposed earlier). This deficit in the delta range might also be less strong for stimuli that do not directly tap into language, like those in the present study, so we cannot yet rule out the possibility that an atypical speech sampling at delta has a role to play in dyslexia, even in syllable‐timed languages (see Bourguignon et al., 2013 for the importance of the delta band for speech processing in French).
Regarding phonemic‐rate conditions (30 Hz and 60 Hz), we observed a rightward synchronization asymmetry for the dyslexic group, driven by an atypical synchronization enhancement in the right auditory cortex to the low gamma rate (30 Hz). In fact, the same atypical hemispheric lateralization pattern for speech sampling in the low gamma range has been reported in dyslexic adults [Lehongre et al., 2013] and prereaders with high hereditary risk for dyslexia [Vanvooren et al., 2014]. Right hemispheric bias has been linked to inattentive speech and non‐speech processing [Scott et al., 2009] which, in the case of this study, may indicate that dyslexic individuals suffer from a limitation in the resources allocated to the processing of stimuli occurring at phonemic‐relevant rates.
Interestingly, the neurophysiological oscillatory anomalies observed in our dyslexic group were not modulated by the chronological age of participants, neither at syllabic‐ nor at phonemic‐ rates (4 Hz and 30 Hz, respectively). Dyslexic adults therefore showed a deficit even when compared to younger skilled readers with “more comparable” reading experience, which supports a possible causal link between the sampling deficit and the reading difficulties of our dyslexic participants. Regarding syllabic‐rate processing, the size of the deficit of the dyslexic group was not modulated by developmental changes. Interestingly, all our participants had possibly already reached the highest developmental point in terms of their sensitivity to, and rightward asymmetries for, the processing of syllabic‐rate units (low frequencies: 4 Hz). This is in line with studies showing that this specific oscillatory sampling mechanism may be achieved before reading is acquired, in normal prereaders, as well as prereader children with high hereditary risk for dyslexia [Vanvooren et al., 2004].
Regarding phonemic‐rate neural auditory synchronization, adults showed stronger synchronization values than children for both the 30 Hz and 60 Hz conditions. This sensitivity enhancement to high frequencies was associated to better phonemic processing in adults only (who have greater reading experience than children, as illustrated by fewer phonemic errors in adults than children in the pseudoword repetition task). This higher phonemic sensitivity goes hand in hand with the acquisition of reading expertise [Castles and Coltheart, 2004]. In ddition, whereas adults did not show any hemispheric specialization for synchronizing their neural response to these stimuli, a rightward hemispheric asymmetry was observed in children (see also Vanvooren et al., 2004 in pre‐readers). Following the rationale discussed earlier, this right hemisphere asymmetry in children might stem from the allocation of fewer (or less tuned) attentional resources to phonemic‐rate stimuli [Scott et al., 2009]. Thus, the rightward lateralization is present in the early stages of reading acquisition but vanishes with reading experience, moving toward a symmetric sensitivity for phonemic‐rate auditory processing. To move from this rightward asymmetry to a symmetric sensitivity, the left hemisphere should be more actively involved in entrainment to fast frequency modulations (30 Hz) relative to the right hemisphere. Studies using tonal judgment tasks suggest that left and right hemisphere regions respond differently if the stimuli provide the possibility to access linguistic information [Klein et al., 2001]. Indeed, right hemisphere regions would be specialized in pitch discrimination [Zatorre et al., 1992] while left hemisphere regions are required for a linguistic categorization of the pitch [Gandour et al., 1998]. The stronger involvement of the left auditory cortex in processing high frequency (phonemic) rates could explain why adults present better performance in categorizing phonemes compared to children [Hazan and Barrett, 2000].
In line with these observed age effects, an age‐related improvement in phonemic‐rate sensitivity was observed in the dyslexic adults compared to the dyslexic and skilled reader children. The dyslexic adults (some of whom had received training and remediation throughout life) may therefore have kept on improving their sensitivity to phonemic speech information throughout development, like their age‐matched controls. Nonetheless, this enhancement did not allow them to catch up with their peers in their reading and phonological skills.
Regarding anatomical variations, we observed that CT in the auditory cortex of participants was modulated by their age group, independently of their reading level status. In particular, the auditory cortex in both the left and the right hemispheres was thinner in adults than in children. This data is consistent with research reporting developmental changes in cortical thinning in these regions [Magnotta et al., 1999; Shaw et al., 2008]. In spite of the evidence provided by studies showing that auditory regions are typically larger in the left hemisphere than the right hemisphere [Altarelli et al., 2014; Galaburda et al., 1978; Geschwind and Levitsky, 1968; Penhune et al., 1996; Rademacher et al., 1993; Shapleske et al., 1999], this structural asymmetry was only obtained in our group of children.
No structural differences between skilled readers and dyslexics were thus found in the left and right auditory cortex [Eckert et al., 2003; Schultz et al., 1994]. Nevertheless, we observed variations between the dyslexic and the control groups regarding the links between structural and functional asymmetries. After controlling for nonverbal IQ and chronological age (i.e., controlling for cortical thinning due to maturation; Magnotta et al., 1999; Shaw et al., 2008), we observed that the cortical thickness asymmetries and pruning were linked to a stronger phonemic‐rate (30 Hz) sensitivity in skilled readers, but to a stronger syllabic‐rate (4 Hz) sensitivity in dyslexic readers. Thus, the left auditory regions might be specialized for processing phonological units of different sizes (phoneme vs. syllable) in skilled and dyslexic readers. This relation between the CT pruning and the specialization to process high frequency oscillations might be a critical factor in improving phonological processing at the phonemic‐level and adequate reading development. The lack of this relation in our dyslexic participants suggests that they may rely on syllabic units (large grain) for phonological analysis, whereas skilled readers may preferentially use smaller units such as phonemes. This result is also in line with the synchronization enhancement observed at 4 Hz in the dyslexic group compared to the group of skilled readers.
Lastly, the impaired phonological sampling highlighted here in our dyslexic participants may also stem from a perturbation of the streams of information propagation (bottom‐up, top‐down) between lower and higher‐level auditory regions. In fact, genetic factors (ectopias, Galaburda and Kemper, 1979) in dyslexia have been proposed to alter the neural interactions (gamma‐theta) within the auditory cortex [Giraud and Ramus, 2013] involved in speech coding. Nevertheless, since we used non‐linguistic stimuli (AM white noise), our study of the temporal sampling deficits in developmental dyslexia was constrained to the evaluation of the atypical neural responses within auditory primary areas. Future studies should be conducted to better characterize how an atypical auditory sampling in dyslexics hinders the following processing steps in higher‐level areas (i.e., left inferior frontal gyrus) during speech perception.
Supporting information
Supporting Information
ACKNOWLEDGMENTS
The following experiment was performed in accordance to the Ethics of the World Medical Association (Declaration of Helsinki). The authors would like to thank María Paz Suárez Coalla and Fernando Cuetos for the recruitment of participants, Margaret Gillon‐Dowens for comments on previous versions of the manuscript, and all the families and participants taking part in this study.
Footnotes
The group effect in the IQ scores was better examined by analyzing the group effects on the scores obtained on the performance and verbal subscales. We conducted an ANOVA with group (dyslexic vs. control) and age (adults vs. children) as between‐subject factors, and subscales (performance, verbal) as within‐subject factor on the IQ scores. This analysis did not reveal any subscale effect (F < 1). However a statistically significant group × subscale interaction emerged (F(1,38) = 6.64, P = 0.014, np2 = 0.15), showing that the dyslexic group had lower scores than the skilled readers group on the verbal subscale (P < 0.015) but not on the performance subscale (P > 0.50). No group × age × subscale interaction was found (F < 1).
REFERENCES
- Abrams DA, Nicol T, Zecker S, Kraus N (2009): Abnormal cortical processing of the syllable rate of speech in poor readers. J Neurosci 29:7686–7693. [DOI] [PMC free article] [PubMed] [Google Scholar]
- Altarelli I, Leroy F, Monzalvo K, Fluss J, Billard C, Dehaene‐Lambertz G, Galaburda AM, Ramus F (2014): Planum temporale asymmetry in developmental dyslexia: Revisiting an old question. Hum Brain Mapp 35:5717–5735. [DOI] [PMC free article] [PubMed] [Google Scholar]
- Anthony JL, Francis DJ (2005): Development of phonological awareness. Curr Dir Psychol Sci 14:255–259. [Google Scholar]
- Bancaud J, Talairach J, Bonis A, Schaub C, Szikla G, Morel P, Bordas‐Ferrer M (1965): La Stéréoélectroencéphalographie dans L'épilepsie: Informations Neurophysiopathologiques Apportées par L'investigation Fonctionnelle Stereotaxique. Paris, France: Masson. [Google Scholar]
- Bell AJ, Sejnowski TJ (1995): An information‐maximization approach to blind separation and blind deconvolution. Neural Comput 7:1129–1159. [DOI] [PubMed] [Google Scholar]
- Blackmon K, Barr WB, Kuzniecky R, Dubois J, Carlson C, Quinn BT, Blumberg M, Halgren E, Hagler DJ, Mikhly M, Devinsky O, McDonald CR, Dale AM, Thesen T (2010): Phonetically irregular word pronunciation and cortical thickness in the adult brain. Neuroimage 51:1453–1458. [DOI] [PMC free article] [PubMed] [Google Scholar]
- Boemio A, Fromm S, Braun A, Poeppel D (2005): Hierarchical and asymmetric temporal sensitivity in human auditory cortices. Nat Neurosci 8:389–395. [DOI] [PubMed] [Google Scholar]
- Bourguignon M, De Tiege X, de Beeck MO, Ligot N, Paquier P, Van Bogaert P, Goldman S, Hari R, Jousmäki V (2013): The pace of prosodic phrasing couples the listener's cortex to the reader's voice. Hum Brain Mapp 34:314–326. [DOI] [PMC free article] [PubMed] [Google Scholar]
- Caravolas M, Lervåg A, Mousikou P, Efrim C, Litavský M, Onochie‐Quintanilla E, Salas N, Schöffelová M, Defior S, Mikulajová M, Seidlová‐Málková G, Hulme C (2012): Common patterns of prediction of literacy development in different alphabetic orthographies. Psychol Sci 23:678–686. [DOI] [PMC free article] [PubMed] [Google Scholar]
- Castles A, Coltheart M (2004): Is there a causal link from phonological awareness to success in learning to read? Cognition 91:77–111. [DOI] [PubMed] [Google Scholar]
- Caviness VJ, Evrard P, Lyon G (1978): Radial neuronal assemblies, ectopia and necrosis of developing cortex: A case analysis. Acta Neuropathol 41:67–72. [DOI] [PubMed] [Google Scholar]
- Cossu G, Shankweiler D, Liberman IY, Katz L, Tola G (1988): Awareness of phonological segments and reading ability in Italian children. Appl Psycholinguist 9:1–16. [Google Scholar]
- Crawford JR, Howell DC (1998): Comparing an individual's test score against norms derived from small samples. Clin Neuropsychol 12:482–486. [Google Scholar]
- Crawford JR, Garthwaite PH, Azzalini A, Howell DC, Laws KR (2006): Testing for a deficit in single case studies: Effects of departures from normality. Neuropsychologia 44:666–677. [DOI] [PubMed] [Google Scholar]
- Cuetos F, Rodriguez B, Ruano E. Arribas, D. 2009. Bateria de Evaluacion de los Procesos Lectores, Revisada. Madrid, Spain: TEA Ediciones, S.A. [Google Scholar]
- Curtin S (2010): Young infants encode lexical stress in newly encountered words. J Exp Child Psychol 105:376–385. [DOI] [PubMed] [Google Scholar]
- Dale AM, Sereno MI (1993): Improved localization of cortical activity by combining EEG and MEG with MRI cortical surface reconstruction: A linear approach. J Cogn Neurosci 5:162–176. [DOI] [PubMed] [Google Scholar]
- Dale AM, Fischl B, Sereno MI (1999): Cortical surface‐based analysis. Segmentation and surface reconstruction. Neuroimage 9:179–194. [DOI] [PubMed] [Google Scholar]
- Eckert MA, Leonard CM (2003): Developmental disorders: Dyslexia In: Hugdahl K, Davidson R, editors. Brain Asymmetry. Cambridge, MA: MIT Press. [Google Scholar]
- Eckert MA, Lombardino LJ, Leonard CM (2001): Planar asymmetry tips the phonological playground and environment raises the bar. Child Dev 72:988–1002. [DOI] [PubMed] [Google Scholar]
- Fischl B, Dale AM (2000): Measuring the thickness of the human cerebral cortex from magnetic resonance images. Proc Natl Acad Sci USA 97:11050–11055. [DOI] [PMC free article] [PubMed] [Google Scholar]
- Fischl B, Sereno MI, Dale AM (1999): Cortical surface‐based analysis. II: Inflation, flattening, and a surface‐based coordinate system. Neuroimage 9:195–207. [DOI] [PubMed] [Google Scholar]
- Fischl B, Salat DH, Busa E, Albert M, Dieterich M, Haselgrove C, van der Kouwe A, Killiany R, Kennedy D, Klaveness S, Montillo A, Makris N, Rosen B, Dale AM (2002): Whole brain segmentation: Automated labeling of neuroanatomical structures in the human brain. Neuron 33:341–355. [DOI] [PubMed] [Google Scholar]
- Foundas AL, Leonard CM, Gilmore R, Fennell E, Heilman KM (1994): Planum temporale asymmetry and language dominance. Neuropsychologia 32:1225–1231. [DOI] [PubMed] [Google Scholar]
- Galaburda AM (1989): Ordinary and extraordinary brain development: Anatomical variation in developmental dyslexia. Ann Dyslexia 39:67–79. [DOI] [PubMed] [Google Scholar]
- Galaburda AM, Kemper TL (1979): Cytoarchitectonic abnormalities in developmental dyslexia: A case study. Ann Neurol 6:94–100. [DOI] [PubMed] [Google Scholar]
- Galaburda AM, LeMay M, Kemper TL, Geschwind N (1978): Right‐left asymmetrics in the brain. Science 199:852–856. [DOI] [PubMed] [Google Scholar]
- Galaburda AM, Sherman GF, Rosen GD, Aboitiz F, Geschwind N (1985): Developmental dyslexia: Four consecutive patients with cortical anomalies. Ann Neurol 18:222–233. [DOI] [PubMed] [Google Scholar]
- Gandour J, Wong D, Hutchins G (1998): Pitch processing in the human brain is influenced by language experience. Neuroreport 9:2115–2119. [DOI] [PubMed] [Google Scholar]
- Geschwind N, Levitsky W (1968): Human brain: Left‐right asymmetries in temporal speech region. Science 161:186–187. [DOI] [PubMed] [Google Scholar]
- Geschwind N, Galaburda AM (1985): Cerebral lateralization: Biological mechanisms, associations, and pathology: I. A hypothesis and a program for research . Arch Neurol 42:428–459. [DOI] [PubMed] [Google Scholar]
- Giraud AL, Lorenzi C, Ashburner J, Wable J, Johnsrude I, Frackowiak R, Kleinschmidt A (2000): Representation of the temporal envelope of sounds in the human brain. J Neurophysiol 84:1588–1598. [DOI] [PubMed] [Google Scholar]
- Giraud AL, Poeppel D (2012a): Cortical oscillations and speech processing: Emerging computational principles and operations. Nat Neurosci 15:511–517. [DOI] [PMC free article] [PubMed] [Google Scholar]
- Giraud AL, Poeppel D. (2012b): Speech perception from a neurophysiological perspective In: The Human Auditory Cortex. New York: Springer; pp 225–260. [Google Scholar]
- Giraud AL, Ramus F (2013): Neurogenetics and auditory processing in developmental dyslexia. Curr Opin Neurobiol 23:37–42. [DOI] [PubMed] [Google Scholar]
- Goswami U (2011): A temporal sampling framework for developmental dyslexia. Trends Cogn Sci 15:3–10. [DOI] [PubMed] [Google Scholar]
- Goswami U (2015): Sensory theories of developmental dyslexia: Three challenges for research. Nat Rev Neurosci 16:43–54. [DOI] [PubMed] [Google Scholar]
- Goswami U, Bryant P (1990): Phonological Skills and Learning to Read. London, UK: Lawrence Erlbaum; p 1. [Google Scholar]
- Goswami U, Leong V (2013): Speech rhythm and temporal structure: Converging perspectives. Lab Phonol 4:67–92. [Google Scholar]
- Goswami U, Power AJ, Lallier M, Facoetti A (2014): Oscillatory “temporal sampling” and developmental dyslexia: Toward an over‐arching theoretical framework. Front Hum Neurosci 8:904. [DOI] [PMC free article] [PubMed] [Google Scholar]
- Gramfort A, Luessi M, Larson E, Engemann D, Strohmeier D, Brodbeck C, Parkkonen L, Hämäläinen M (2014): MNE software for processing MEG and EEG data. NeuroImage 86:446–460. [DOI] [PMC free article] [PubMed] [Google Scholar]
- Gross J, Kujala J, Hämäläinen M, Timmermann L, Schnitzler A, Salmelin R (2001): Dynamic imaging of coherent sources: Studying neural interactions in the human brain. Proc Natl Acad Sci USA 98:694–699. [DOI] [PMC free article] [PubMed] [Google Scholar]
- Gross J, Hoogenboom N, Thut G, Schyns P, Panzeri S, Belin P, Garrod S (2013): Speech rhythms and multiplexed oscillatory sensory coding in the human brain. PLoS Biol 11:e1001752doi: 10.1371/journal.pbio.1001752 [DOI] [PMC free article] [PubMed] [Google Scholar]
- Harris M, Giannouli V. (1999): Learning to read and spell in Greek In: Harris M. and Hatano G, editors. Learning to Read and Write: A Cross‐Linguistic Perspective. Cambridge, UK: Cambridge University Press; pp 51–70. [Google Scholar]
- Hämäläinen JA, Rupp A, Soltesz F, Szucs D, Goswami U (2012): Reduced phase locking to slow amplitude modulation in adults with dyslexia: An MEG study. Neuroimage 59:2952–2961. [DOI] [PubMed] [Google Scholar]
- Hazan V, Barrett S (2000): The development of phonemic categorization in children aged 6‐12. J Phonetics 28:377–396. [Google Scholar]
- Helenius P, Salmelin R, Service E, Connolly JF, Leinonen S, Lyytinen H (2002): Cortical activation during spoken‐word segmentation in nonreading‐impaired and dyslexic adults. J Neurosci 22:2936–2944. [DOI] [PMC free article] [PubMed] [Google Scholar]
- Hutsler J, Galuske RA (2003): Hemispheric asymmetries in cerebral cortical networks. Trends Neurosci 26:429–435. [DOI] [PubMed] [Google Scholar]
- Klein D, Zatorre RJ, Milner B, Zhao V (2001): A cross‐linguistic PET study of tone perception in Mandarin Chinese and English speakers. NeuroImage 13:646–653. [DOI] [PubMed] [Google Scholar]
- Lachaux JP, Rodriguez E, Martinerie J, Varela FJ (1999): Measuring phase synchrony in brain signals. Hum Brain Mapp 8:194–208. [DOI] [PMC free article] [PubMed] [Google Scholar]
- Lallier M, Thierry G, Tainturier MJ, Donnadieu S, Peyrin C, Billard C, Valdois S (2009): Auditory and visual stream segregation in children and adults: An assessment of the amodality assumption of the sluggish attentional shifting theory. Brain Res 1302:132–147. [DOI] [PubMed] [Google Scholar]
- Larsen JP, Høien T, Lundberg I, Ødegaard H (1990): MRI evaluation of the size and symmetry of the planum temporale in adolescents with developmental dyslexia. Brain Lang 39:289–301. [DOI] [PubMed] [Google Scholar]
- Lehongre K, Ramus F, Villiermet N, Schwartz D, Giraud AL (2011): Altered low‐gamma sampling in auditory cortex accounts for the three main facets of dyslexia. Neuron 72:1080–1090. [DOI] [PubMed] [Google Scholar]
- Lehongre K, Morillon B, Giraud AL, Ramus F (2013): Impaired auditory sampling in dyslexia: Further evidence from combined fMRI and EEG. Front Hum Neurosci 7:454 [DOI] [PMC free article] [PubMed] [Google Scholar]
- Leonard CM, Eckert MA, Lombardino LJ, Oakland T, Kranzler J, Mohr CM, King WM, Freeman A (2001): Anatomical risk factors for phonological dyslexia. Cereb Cortex 11:148–157. [DOI] [PubMed] [Google Scholar]
- Leong V, Goswami U (2014): Impaired extraction of speech rhythm from temporal modulation patterns in speech in developmental dyslexia. Front Hum Neurosci 8:6. [DOI] [PMC free article] [PubMed] [Google Scholar]
- Liberman IY, Shankweiler D, Fischer FW, Carter BJ (1974): Explicit syllable and phoneme segmentation in the young child. J Exp Child Psychol 18:201–212. [Google Scholar]
- Liégeois‐Chauvel C, Lorenzi C, Trébuchon A, Régis J, Chauvel P (2004): Temporal envelope processing in the human left and right auditory cortices. Cereb Cortex 14:731–740. [DOI] [PubMed] [Google Scholar]
- Lu LH, Leonard CM, Thompson PM, Kan E, Jolley J, Welcome SE, Toga AW, Sowell ER (2007): Normal developmental changes in inferior frontal gray matter are associated with improvement in phonological processing: A longitudinal MRI analysis. Cereb Cortex 17:1092–1099. [DOI] [PubMed] [Google Scholar]
- Magnotta VA, Andreasen NC, Schultz SK, Harris G, Cizadlo T, Heckel D, Nopoulos P, Flaum M (1999): Quantitative in vivo measurement of gyrification in the human brain: Changes associated with aging. Cereb Cortex 9:151–160. [DOI] [PubMed] [Google Scholar]
- Middlebrooks JC (2008): Auditory cortex phase locking to amplitude‐modulated cochlear implant pulse trains. J Neurophysiol 100:76–91. [DOI] [PMC free article] [PubMed] [Google Scholar]
- Minagawa‐Kawai Y, van der Lely H, Ramus F, Sato Y, Mazuka R, Dupoux E (2011): Optical brain imaging reveals general auditory and language‐specific processing in early infant development. Cereb Cortex 21:254–261. [DOI] [PMC free article] [PubMed] [Google Scholar]
- Molnar M, Lallier M, Carreiras M (2014): The amount of language exposure determines nonlinguistic tone grouping biases in infants from a bilingual environment. Lang Learn 64:45–64. [Google Scholar]
- Morais J, Alegria J, Content A (1987): The relationship between segmental analysis and alphabetic literacy: An interactive view. Cah Psychol Cogn 7:415–438. [Google Scholar]
- Morillon B, Lehongre K, Frackowiak RS, Ducorps A, Kleinschmidt A, Poeppel D, Giraud AL (2010): Neurophysiological origin of human brain asymmetry for speech and language. Proc Natl Acad Sci USA 107:18688–18693. [DOI] [PMC free article] [PubMed] [Google Scholar]
- Nichols TE, Holmes AP (2002): Nonparametric permutation tests for functional neuroimaging: A primer with examples. Hum Brain Mapp 15:1–25. [DOI] [PMC free article] [PubMed] [Google Scholar]
- Obleser J, Eisner F, Kotz SA (2008): Bilateral speech comprehension reflects differential sensitivity to spectral and temporal features. J Neurosci 28:8116–8123. [DOI] [PMC free article] [PubMed] [Google Scholar]
- Oostenveld R, Fries P, Maris E, Schoffelen JM (2011): FieldTrip: Open source software for advantage analysis of MEG, EEG, and invasive electrophysiological data. Comput Intell Neurosci 2011:156869 [DOI] [PMC free article] [PubMed] [Google Scholar]
- Penhune VB, Zatorre RJ, MacDonald JD, Evans AC (1996): Interhemispheric anatomical differences in human primary auditory cortex: Probabilistic mapping and volume measurement from magnetic resonance scans. Cereb Cortex 6:661–672. [DOI] [PubMed] [Google Scholar]
- Pennington BF, van Orden GC, Smith SD, Green PA, Haith MM (1990): Phonological processing skills and deficits in adult dyslexics. Child Dev 61:1753–1778. [PubMed] [Google Scholar]
- Poeppel D (2003): The analysis of speech in different temporal integration windows: Cerebral lateralization as “asymmetric sampling in time.” Speech Commun 41:245–255. [Google Scholar]
- Power AJ, Mead N, Barnes L, Goswami U (2013): Neural entrainment to rhythmic speech in children with developmental dyslexia. Front Human Neurosci 7: [DOI] [PMC free article] [PubMed] [Google Scholar]
- Rademacher J, Caviness VS, Steinmetz H, Galaburda AM (1993): Topographic variation of the human primary cortices and its relevance to brain mapping and neuroimaging studies. Cereb Cortex 3:313–329. [DOI] [PubMed] [Google Scholar]
- Ramus F, Nespor M, Mehler J (1999): Correlates of linguistic rhythm in the speech signal. Cognition 73:265–292. [DOI] [PubMed] [Google Scholar]
- Richardson F, Price C (2009): Structural MRI studies of language function in the undamaged brain. Brain Struct Funct 213:511–523. [DOI] [PMC free article] [PubMed] [Google Scholar]
- Schultz RT, Cho NK, Staib LH, Kier LE, Fletcher JM, Shaywitz SE (1994): Brain morphology in normal and dyslexic children: The influence of sex and age. Ann Neurol 35:732–742. [DOI] [PubMed] [Google Scholar]
- Scott SK, Rosen S, Beaman CP, Davis JP, Wise RJ (2009): The neural processing of masked speech: Evidence for different mechanisms in the left and right temporal lobes. J Acoust Soc Am 125:1737–1743. [DOI] [PubMed] [Google Scholar]
- Segonne F, Dale AM, Busa E, Glessner M, Salat D, Hahn HK, Fischl B (2004): A hybrid approach to the skull stripping problem in MRI. Neuroimage 22:1060–1075. [DOI] [PubMed] [Google Scholar]
- Serniclaes W, Sprenger‐Charolles L, Carré R, Demonet JF (2001): Perceptual discrimination of speech sounds in developmental dyslexia. J Speech Lang Hear Res 44:384–399. [DOI] [PubMed] [Google Scholar]
- Serniclaes W, Heghe SV, Mousty P, Carré R, Sprenger‐Charolles L (2004): Allophonic mode of speech perception in dyslexia. J Exp Child Psychol 87:336–361. [DOI] [PubMed] [Google Scholar]
- Shapleske J, Rossell SL, Woodruff PWR, David AS (1999): The planum temporale: A systematic, quantitative review of its structural, functional and clinical significance. Brain Res Rev 29:26–49. [DOI] [PubMed] [Google Scholar]
- Shaw P, Kabani NJ, Lerch JP, Eckstrand K, Lenroot R, Gogtay N, Greenstein D, Clasen L, Evans A, Rapoport J, Giedd J, Wise SP (2008): Neurodevelopmental trajectories of the human cerebral cortex. J Neurosci 28:3586–3594. [DOI] [PMC free article] [PubMed] [Google Scholar]
- Soroli E, Szenkovits G, Ramus F (2010): Exploring dyslexics' phonological deficit III: Foreign speech perception and production. Dyslexia 16:318–340. [DOI] [PubMed] [Google Scholar]
- Sowell ER, Thompson PM, Toga AW (2004): Mapping changes in the human cortex throughout the span of life. Neuroscientist 10:372–392. [DOI] [PubMed] [Google Scholar]
- Tallal P (1980): Auditory temporal perception, phonics, and reading disabilities in children. Brain Lang 9:182–198. [DOI] [PubMed] [Google Scholar]
- Taulu S, Kajola M (2005): Presentation of electromagnetic multichannel data: The signal space separation method. J Appl Phys 97:124905–124910. [Google Scholar]
- Torgesen JK, Wagner RK, Rashotte CA, Rose E, Lindamood P, Conway T, Garvan C (1999): Preventing reading failure in young children with phonological processing disabilities: Group and individual responses to instruction. J Educ Psychol 91:579 [Google Scholar]
- Vanvooren S, Poelmans H, Hofmann M, Ghesquière P, Wouters J (2014): Hemispheric asymmetry in auditory processing of speech envelope modulations in prereading children. J Neurosci 34:1523–1529. [DOI] [PMC free article] [PubMed] [Google Scholar]
- Wechsler D. 2001. Intelligence Scale for Children‐Revised. New York, NY: Psychological Corporation. [Google Scholar]
- Wechsler D. 2008. Wechsler Adult Intelligence Scale–Fourth Edition (WAIS–IV). San Antonio, TX: NCS Pearson. [Google Scholar]
- Witelson S, Pappiel W (1973): Left hemisphere specialization for language in newborn: Neuroanatomical evidence of asymmetry. Brain 96:641–646. [DOI] [PubMed] [Google Scholar]
- Zatorre RJ, Evans AC, Meyer E, Gjedde A (1992): Lateralization of phonemic and pitch discrimination in speech processing. Science 256:846–849. [DOI] [PubMed] [Google Scholar]
- Ziegler J, Goswami U (2005): Reading acquisition, developmental dyslexia, and skilled reading across languages: A psycholinguistic grain size theory. Psychol Bull 131:3–29. [DOI] [PubMed] [Google Scholar]
Associated Data
This section collects any data citations, data availability statements, or supplementary materials included in this article.
Supplementary Materials
Supporting Information