

Abstract
Several recent studies using functional magnetic resonance imaging (fMRI) have shown that repetitive transcranial magnetic stimulation (rTMS) affects not only brain activity in stimulated regions but also resting‐state functional connectivity (RSFC) between the stimulated region and other remote regions. However, these studies have only demonstrated an effect of either excitatory or inhibitory rTMS on RSFC, and have not clearly shown the bidirectional effects of both types of rTMS. Here, we addressed this issue by performing excitatory and inhibitory quadripulse TMS (QPS), which is considered to exert relatively large and long‐lasting effects on cortical excitability. We found that excitatory rTMS (QPS with interstimulus intervals of 5 ms) decreased interhemispheric RSFC between bilateral primary motor cortices, whereas inhibitory rTMS (QPS with interstimulus intervals of 50 ms) increased interhemispheric RSFC. The magnitude of these effects on RSFC was significantly correlated with that of rTMS‐induced effects on motor evoked potential from the corresponding muscle. The bidirectional effects of QPS were also observed in the stimulation over prefrontal and parietal association areas. These findings provide evidence for the robust bidirectional effects of excitatory and inhibitory rTMSs on RSFC, and raise a possibility that QPS can be a powerful tool to modulate RSFC. Hum Brain Mapp 35:1896–1905, 2014. © 2013 Wiley Periodicals, Inc.
Keywords: fMRI, rs‐fcMRI, rTMS, QPS, transcallosal connection
INTRODUCTION
Transcranial magnetic stimulation (TMS) is one of the noninvasive tools to stimulate neurons in the human brain [Allen et al., 2007; Barker et al., 1985; Merton and Morton, 1980], and has recently been used for treating neurological or neuropsychiatric diseases such as Parkinson disease and severe depression [George et al., 1999; Post et al., 1999; Pridmore and Belmaker, 1999]. For experimental purposes, repetitive TMS (rTMS) has been applied as one of the valuable tools to induce reversible changes in an intact human brain [Fox et al., 2012; Pascual‐Leone et al., 2000]. rTMS has also been used to show the causal relationship between certain types of behavior and brain activity or structures [Fox et al., 2012; Kanai et al., 2011; O'Shea et al., 2007; Romei et al., 2011; Strafella et al., 2001; van Schouwenburg et al., 2012; Zaretskaya et al., 2010].
Recently, several studies [Eldaief et al., 2011; van der Werf et al., 2010; Vercammen et al., 2010] have taken advantage of functional magnetic resonance imaging (fMRI) to investigate effects of rTMS on resting‐state functional connectivity (RSFC) [Beckmann et al., 2005; Biswal et al., 1995, 2010; Damoiseaux et al., 2006; Duann et al., 2009; Fox and Raichle, 2007; Fox et al., 2005; Greicius et al., 2003; Honey et al., 2007; Kilpatrick et al., 2006; Koyama et al., 2011; Murphy et al., 2009; Smith et al., 2009; Tian et al., 2012; Toro et al., 2008; van Kesteren et al., 2010; Vincent et al., 2006]. However, all the previous studies have mainly reported an effect induced by either excitatory or inhibitory rTMS: Some of the studies have shown significant effects induced by inhibitory rTMS on RSFC [van der Werf et al., 2010; Vercammen et al., 2010]. Another study has shown the effects of both excitatory and inhibitory rTMSs, but the influence induced by inhibitory rTMS was found to be limited and moderate compared with that induced by excitatory rTMS [Eldaief et al., 2011]. Consequently, despite the importance of establishing a protocol to clearly modulate functional connectivity for clinical and experimental purposes, to the best of our knowledge, effects of the excitatory and inhibitory rTMSs of similar magnitudes on RSFC have not been reported.
In particular, the bidirectional modulation of functional connectivity should be requisite for clinical purposes because some neurological and psychiatric disorders induce an increase or a decrease in functional connectivity [Fox et al., 2012]. For example, brain strokes in the motor area pathologically enhance transcallosal inhibition from the intact motor area over the lesion motor area, which is considered to prevent the recovery of functions of the lesion area [Duque et al., 2005; Grefkes et al., 2008; Murase et al., 2004]. Moreover, patients with schizophrenia have been shown to have pathologically reduced interhemispheric prefrontal functional connectivity [Meyer‐Lindenberg, 2010; Meyer‐Lindenberg et al., 2005] and an abnormal increase in functional connectivity with the medial temporal regions [Meyer‐Lindenberg, 2010; Whitfield‐Gabrieli et al., 2009]. A protocol of rTMS that enables bidirectional modulation of functional connectivity could be one of the promising tools to improve these neurological and psychiatric symptoms.
In the present study, we aimed to address this issue by investigating the effects of quadripulse rTMS (QPS) on interhemispheric RSFC between contralateral brain regions. The rTMS protocol (Fig. 1A) is reported to attain long‐lasting effect for ∼30 min to 2 h after the stimulation [Hamada et al., 2007, 2008], which is much longer than that induced by conventional rTMS (ca. 15 min). In addition, to improve the sensitivity to the rTMS‐induced effects, we mainly measured the changes in interhemispheric RSFC between bilateral homologous regions. According to previous studies [Stark et al., 2008; Zuo et al., 2010], the interhemispheric RSFC consistently shows a large value, which implies that the effects on interhemispheric RSFC are robust to various noises such as individual differences and fluctuations of rTMS stimulation. By administering QPS over inter‐hemispheric RSFC, we aimed at demonstrating the bidirectional effects of excitatory and inhibitory rTMS on RSFC.
Figure 1.
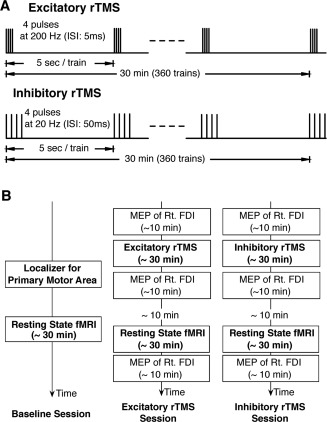
Experimental procedure. A. rTMS Protocol. Two types of rTMS were used in the present study. The protocol for excitatory rTMS consisted of 360 trains of quadripulse rTMS at 5‐ms interstimulus interval (ISI), whereas that for inhibitory rTMS consisted of 360 trains of quadripulse rTMS at 50 ms ISI. B. Experimental Design. The present overall experimental design consisted of three sessions: the baseline, excitatory and inhibitory rTMS sessions. In the baseline session, the subjects underwent a localizer fMRI scan and a resting‐state fMRI scan. In the two types of rTMS, the subjects were administrated by rTMS ∼10 min before resting‐state fMRI scan. The order of the two rTMS sessions was counter‐balanced across subjects, and the sessions were conducted at an interval longer than 1 week.
METHODS
Subjects
Six healthy adult male volunteers (27‐ to 43‐years old) participated in the present experiments after providing their written informed consent. None of the subjects had any neurological, psychiatric, or other medical problems, or had any contraindication to TMS [Wassermann, 1998]. The procedure of rTMS was in compliance with the guidelines for experimentation on humans [Drummond, 2009]. The entire procedures of both fMRI and rTMS were approved by the Institutional Review Board of School of Medicine, The University of Tokyo.
Overall Design
We calculated RSFC from MRI data obtained before and after one of two types of rTMS (excitatory and inhibitory rTMS) (Fig. 1A) over the left primary motor area (M1). The experiment consisted of three sessions: the baseline, excitatory rTMS, and inhibitory rTMS sessions (Fig. 1B). In the baseline session, the participants were first subjected to functional localizer scanning to identify the left M1 for the right first dorsal interosseous muscle (FDI) individually, and then underwent RSFC scanning as the control. Excitatory and inhibitory rTMSs were applied with an interval of at least 1 week, and the order of these two sessions was randomized and counterbalanced across subjects. Before the rTMS session, motor evoked potentials (MEPs) were recorded from the right FDI as a control. Thereafter, either type of rTMS was applied over the left M1 for 30 min. Approximately 10 min after the rTMS session, we conducted resting‐state fMRI for ∼30 min. After fMRI, MEPs were recorded from the right FDI again to confirm the after‐effects.
MEP Measurement Procedures
The MEP measurement procedure was essentially the same as that in our previous studies [Hamada et al., 2007, 2008]. MEPs were recorded from the right first FDI muscle using pairs of Ag/AgCl surface cup electrodes (9‐mm diameter) placed over the muscle belly (active) and the metacarpophalangeal joint of the index finger (reference). The signals were input to an amplifier (Biotop; GE Marquette Medical Systems, Japan) through filters set at 100 Hz and 3 kHz, and were digitized and stored on a computer for later offline analyses (TMS BiStim tester; Medical Try System, Japan). TMS was administered using a hand‐held figure‐of‐eight coil (9‐cm external diameter at each wing; The Magstim, Whitland, Dyfed, UK). QPS, i.e., a train of four monophasic magnetic pulses, delivered using four magnetic stimulators (Magstim 2002; The Magstim) connected to a specially designed combining module (The Magstim).
Before rTMS, we conducted single‐pulse TMS experiments to determine the following two parameters. First, the optimal stimulation site for the right FDI muscle was determined in each subject as the site eliciting the largest MEP [Hamada et al., 2007, 2008]. Second, the active motor threshold (AMT) for the FDI muscle was defined as the lowest intensity that evoked a small response (>100 µV) when the subjects maintained a slight contraction of the right FDI (∼10% of the maximum voluntary contraction) in more than 5 of 10 consecutive trials. MEPs were also recorded for monitoring M1 excitability changes after rTMS. About 10 min after the end of fMRI, we recorded 20 consecutive MEPs from FDI to compare them with the control MEPs recorded before rTMS.
rTMS Procedure
The rTMS procedure was the same as that in our previous studies [Hamada et al., 2007, 2008]. QPS consisted of trains of four TMS pulses with an inter‐train interval (ITI) of 5 s (Fig. 1A). The target region was the same as the left M1 that was determined by MEP measurement. Each train consisted of four magnetic pulses separated by interstimulus intervals (ISIs) of 5 or 50 ms for excitatory or inhibitory rTMS, respectively. One rTMS block consisted of 360 consecutive trains that took 30 min, and the intensity of rTMS was set at 90% AMT.
fMRI Scanning
MRI scanning was conducted using a 3T MRI scanner with a one‐channel head coil (Signa HDxt 3.0T, GE Healthcare, Milwaukee, WI). T1‐weighted structural images were obtained as the anatomical reference (resolution = 0.81 × 0.81 × 1.20 mm3). fMRI was conducted using gradient echo echo‐planar sequences (TR = 2.5 s, TE = 35 ms, flip angle = 90°, resolution = 4 × 4 × 4 mm3, 32 slices). The first five functional images of each run were discarded to minimize the effects of transient magnetic saturation.
The localizer fMRI scans were conducted to identify the M1 for the right FDI. The fMRI scans consisted of two runs of 5 min, and the subjects were instructed to continuously tap their right or left index finger during blocks of 16 s, intervened by control blocks of resting for 16 s. The resting‐state fMRI scans consisted of five runs of 5 min each, and the subjects were instructed to fix their gaze on a fixation point during the fMRI scans.
In the present procedure of rTMS stimulation, we determined the location of the target region (left M1) on the basis of MEP responses. On the other hand, in the following analysis of rTMS‐induced effects on RSFC, we determined the location of the left M1 on the basis of the functional localizer scan. Although the discrepancy between these two estimations is a potential limitation, fairly good correspondence between the locations of the MEP‐based M1 and the functional‐localizer‐based M1 has been demonstrated in prior literatures [Sparing et al., 2008].
Analysis of fMRI Data
The obtained localizer fMRI images were first realigned, slice‐timing‐corrected, normalized to the default template with interpolation to a 2 × 2 × 2 mm3 space, and spatially smoothed (full width at half maximum = 10 mm, Gaussian filter) using SPM8 (http://www.fil.ion.ucl.ac.uk/spm/). In one subject, the preprocessed data were analyzed in a box‐car design. The event timings of two types of trials (tapping of the right/left index finger) were coded into a general linear model (GLM), together with run‐specific effects and other events of no interest, using the canonical hemodynamic response function in SPM8. By calculating the contrast image defined as right > left, we determined the M1 in the left hemisphere for the right FDI.
The resting‐state functional imaging data were analyzed using the following procedure, which is essentially the same as that used in the previous studies [Fair et al., 2007; Fox et al., 2005]. The images were realigned, slice‐timing‐corrected and normalized to the default template in SPM8. Although we compared BOLD signal magnitude in the whole brain between the baseline and post‐rTMS sessions, we did not detect any consistent difference between them owing to a large variance derived from different sessions. The data were subjected to temporal band‐pass filtering (0.01–0.1 Hz) using in‐house‐written Matlab scripts, and were spatially smoothed (FWHM = 8 mm). GLM was used to regress out nuisance signals that correlated with head motion, whole‐brain signals, average ventricular signals, and average white matter signals.
We first conducted an exploratory search by estimating how rTMS changed the voxel‐wise functional connectivity in the whole brain using the left M1 as a seed region (radius, 5 mm). The coordinates of the left M1 of each subject were determined on the basis of the results of the localizer task. Functional connectivity was calculated on the basis of Pearson's correlation coefficient, and was first transformed to t value as follows.
where BCF indicates the Bartlett correction factor, N is the number of fMRI images, and r denotes Pearson's correlation coefficient. On the basis of Bartlett's theory, we used BCF to take into account autocorrelation in the fMRI signals and to correct the degrees of freedom [van Dijk et al., 2010]. After that, we evaluated corresponding P values and then estimated corresponding z scores. Using the z scores, we estimated the difference between the functional connectivity z‐map for excitatory/inhibitory rTMS and that for the baseline session for each subject as follows.
This difference was subjected to a second‐level analysis using a one‐sample t‐test. Consequently, we obtained two whole‐brain maps: a connectivity map for excitatory rTMS session > baseline session (Fig. 3B) and a connectivity map for inhibitory rTMS session > baseline session (Fig. 3C). Significant connectivity changes were evaluated by using a threshold of FDR‐corrected P < 0.05.
Figure 3.
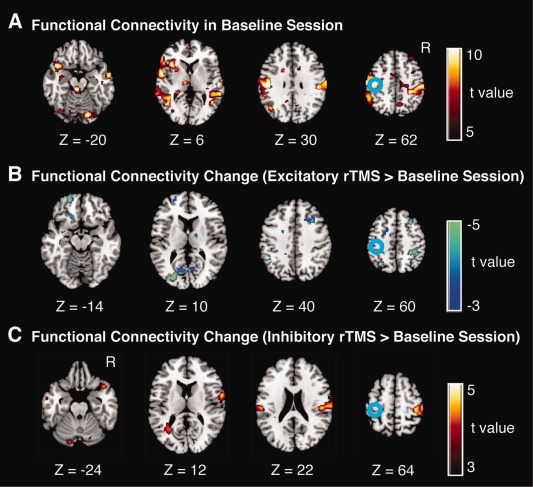
Changes in RSFC after rTMS of left M1. A. Statistical maps of functional connectivity with the left M1 in pre‐rTMS sessions (i.e., baseline sessions). B and C. Changes in RSFC with the left M1 induced by excitatory rTMS (panel B) and inhibitory rTMS (panel C). The color scale shown on the right indicates statistical significance level. The blue circles indicate the approximate location of the left M1, which was determined by the functional localizer scan. These panels indicate the subtraction between the functional connectivity maps of the pre‐rTMS and post‐rTMS sessions; as a consequence, the local effects were eliminated. [Color figure can be viewed in the online issue, which is available at http://wileyonlinelibrary.com.]
We next conducted a region‐of‐interest analysis by estimating changes in interhemispheric RSFC between the stimulated region (i.e., the left M1) and the contra‐lateral region (i.e., the right M1). The stimulated region was determined on the basis of the results of the functional localizer session (radius = 5 mm). The contralateral region was determined as a 5‐mm‐radius sphere around the corresponding voxel (i.e., when the center of the left M1 was [X1, Y1, Z1], the center of the contra‐lateral region was determined to be [−X1, Y1, Z1]). On the basis of the definitions of the regions, we estimated the amount of change in interhemispheric RSFC induced by excitatory and inhibitory rTMS.
RESULTS
MEP Results
We confirmed the excitatory and inhibitory rTMS effects on MEP in the left M1 found in our previous investigations [Hamada et al., 2007, 2008]. We compared the MEPs recorded before the rTMS with average MEPs recorded immediately after and 60 min after the rTMS. Consequently, we found that excitatory rTMS induced a significant increase in normalized MEPs, and the inhibitory rTMS induced a significant decrease (excitatory rTMS, t (5) = 3.0, P < 0.05; inhibitory rTMS, t (5) = 3.2, P < 0.05 in two‐tailed t tests; Fig. 2). These findings were consistent with those of our previous studies [Hamada et al., 2007, 2008], which confirms that the following fMRI results reflected the effects of excitatory/inhibitory rTMS.
Figure 2.
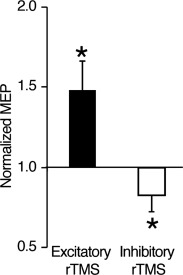
Effects of rTMS on MEP. The Y axis shows the ratio of the post‐rTMS MEP of the right FDI to the baseline MEP. In both excitatory and inhibitory rTMS, the expected changes in MEP were observed. Error bar: s.e.m. *: P < 0.05.
RSFC Results
We conducted an exploratory search by estimating changes in RSFC at every voxel in the whole brain with the seed placed in the left M1, which was determined by the localizer fMRI scanning. After excitatory rTMS, functional connectivity with the left M1 significantly decreased in several regions including the right primary motor area and middle frontal gyrus (Fig. 3B, Table 1). There were no brain regions that showed a significant increase in the RSFC with the left M1. In contrast, after inhibitory rTMS, functional connectivity significantly increased in brain regions including the left primary motor area, bilateral superior temporal gyrus, and left cerebellum (Fig. 3C, Table 1). There were no brain regions showing a significant decrease in the RSFC with the left M1. Among these responsive regions shown in Figure 3B,C, significant bidirectional changes were observed at the contralateral M1 after both excitatory and inhibitory rTMSs. Note that Figure 3B,C show the subtraction between the functional connectivity maps of the pre‐rTMS and post‐rTMS sessions, and the local effects were not detected.
Table 1.
RSFC change induced by quadripulse rTMS
| Anatomical label | MNI coordinates | t value | ||
|---|---|---|---|---|
| X | Y | Z | ||
| Excitatory rTMS > baseline session | ||||
| Lt. middle frontal gyrus | −22 | 54 | −14 | −4.5 |
| Lt. middle occipital gyrus | −24 | −90 | 10 | −4.8 |
| Rt. middle frontal gyrus | 28 | 20 | 40 | −4.2 |
| Rt. middle frontal gyrus | 30 | 6 | 58 | −4.3 |
| Rt. precentral gyrus (M1) | 34 | −20 | 60 | −4.4 |
| Inhibitory rTMS > baseline session | ||||
| Lt. cerebellum | −14 | −82 | −22 | 3.9 |
| Rt. superior temporal gyrus | 40 | 14 | −24 | 4.6 |
| Rt. precentral gyrus | 64 | 0 | 12 | 4.8 |
| Lt. postcentral gyrus | −60 | −20 | 20 | 4.7 |
| Rt. inferior parietal lobule | 50 | −26 | 22 | 4.8 |
| Rt. postcentral gyrus | 64 | −18 | 24 | 4.7 |
| Rt. precentral gyrus (M1) | 32 | −30 | 64 | 4.9 |
MNI: montreal neurological institute. Anatomical labels are based on WFU pickatlas (http://fmri.wfubmc.edu/).
We then conducted a region‐of‐interest analysis by evaluating rTMS‐induced changes in interhemispheric RSFC between the stimulated region and the coordinate‐based contralateral region. The excitatory rTMS significantly decreased interhemispheric RSFC (t (5) = 13.0, P < 0.001, Fig. 4A). In contrast, after the inhibitory rTMS, interhemispheric RSFC significantly increased (t (5) = 11.8, P < 0.001, Fig. 4A), which is consistent with the findings of previous studies in which the effects of inhibitory rTMS on RSFC were investigated [Eldaief et al., 2011; Vercammen et al., 2010]. In addition, these effects were statistically significant even in a single‐subject‐level analysis (Table 2): In the case of the excitatory rTMS, the least sensitive subject exhibited a significant decrease in interhemispheric RSFC as shown by a large z value (|z| = 5.3, P < 10−6). In the case of the inhibitory rTMS, even the least sensitive subject also showed a significant increase in interhemispheric RSFC as shown by a large z value (|z| = 6.1, P < 10−6). These results show that the inhibitory and excitatory rTMSs induced significant bidirectional changes in interhemispheric RSFC. These bidirectional changes were also observed even when we defined the contra‐lateral right M1 on the basis of the localizer fMRI images (P < 10−5). Indeed, exploratory functional connectivity analysis revealed that the right M1 defined on the basis of the functional localizer was located closely to the brain regions that showed the largest changes in RSFC with the left M1 in both single‐level analysis and group‐level analysis (Supporting Information Fig. 1).
Figure 4.
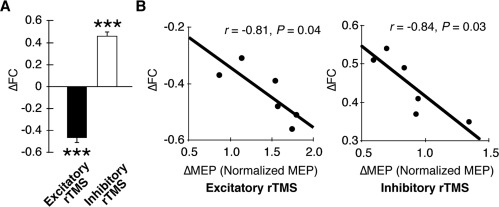
Changes in inter‐hemispheric RSFC. A. Group effects of rTMS. Excitatory and inhibitory rTMS induced significant decrease and increase in interhemispheric RSFC between the bilateral M1s. ***: P < 0.001 in one‐sample t tests. Error bars: s.e.m. B. Correlation between effects of rTMS on MEP and RSFC. The magnitudes of the effects on inter‐hemispheric RSFC were significantly correlated with the magnitude of the effects on MEP.
Table 2.
Statistical significance of interhemispheric RSFC change
| Subject | Excitatory rTMS | Inhibitory rTMS | |||||||
|---|---|---|---|---|---|---|---|---|---|
| Pre‐rTMS RSFC (z pre‐rTMS) | Post‐rTMS RSFC (z post‐rTMS) | ΔFC | Z value | P value | Post‐rTMS RSFC (z ost‐rTMS) | ΔFC | Z value | P value | |
| S1 | 0.45 | −0.03 | −0.48 | −8.3 | <1 × 10⁻⁶ | 0.94 | 0.49 | 8.5 | <1 × 10⁻⁶ |
| S2 | 0.41 | −0.1 | −0.51 | −8.8 | <1 × 10⁻⁶ | 0.95 | 0.54 | 9.6 | <1 × 10⁻⁶ |
| S3 | 0.48 | 0.09 | −0.39 | −6.7 | <1 × 10⁻⁶ | 0.89 | 0.41 | 7.1 | <1 × 10⁻⁶ |
| S4 | 0.42 | −0.14 | −0.56 | −9.7 | <1 × 10⁻⁶ | 0.93 | 0.51 | 8.8 | <1 × 10⁻⁶ |
| S5 | 0.52 | 0.15 | −0.37 | −6.4 | <1 × 10⁻⁶ | 0.87 | 0.35 | 6.1 | <1 × 10⁻⁶ |
| S6 | 0.54 | 0.23 | −0.31 | −5.3 | <1 × 10⁻⁶ | 0.91 | 0.37 | 6.4 | <1 × 10⁻⁶ |
Z and P values were obtained by test of the difference in Pearson correlation coefficients. ΔFC = zpost‐rTMS – zpre‐rTMS.
Moreover, the magnitude of the changes in interhemispheric RSFC was significantly correlated with the magnitude of the changes in MEP in both of the excitatory and inhibitory rTMSs (excitatory rTMS: r = −0.81, P = 0.04, inhibitory rTMS: r = −0.84, P = 0.03, Fig. 4B). In contrast, the changes in RSFC showed neither significant correlation with the intensity of rTMS, baseline MEP amplitude, nor the intensity of the fMRI local activation. These significant correlations confirm that the observed changes in interhemispheric RSFC were induced by the rTMS. Furthermore, these bidirectional effects on RSFC were observed in rTMSs over the prefrontal and parietal association areas (Supporting Information Figs. 3 and 2, Supporting Information Table 1).
DISCUSSION
In this study, using a QPS protocol, we found that excitatory rTMS over the M1 induced a decrease in interhemispheric RSFC, whereas inhibitory rTMS induced an increase in RSFC. This effect was consistently significant in all the subjects. The effects were also observed in the prefrontal and parietal association areas, implying that the bidirectional effects of rTMS could be observed in brain areas other than the M1.
The effect of excitatory rTMS on RSFC is consistent with that found in previous studies in which rTMS‐induced changes in functional connectivity were investigated by electroencephalography (EEG) [Fuggetta et al., 2008; Oliviero et al., 2003]. Those studies have demonstrated that excitatory rTMS decreases cortico‐cortical coherence in the alpha band. Our present findings of the effect of inhibitory rTMS on RSFC is also consistent with those of a line of previous studies using EEG [Chen et al., 2003; Strens et al., 2002], positron emission tomography (PET) [Lee et al., 2003], and fMRI [Eldaief et al., 2011; Grefkes et al., 2010; Vercammen et al., 2010]. Previous EEG studies have shown that inhibitory rTMS increases coherence in both the resting state [Strens et al., 2002] and task period [Chen et al., 2003]. Among other PET studies [Horacek et al., 2007; Paus et al., 2001], a previous PET study has shown that inhibitory rTMS increases effective connectivity [Lee et al., 2003]. Prior fMRI studies using inhibitory rTMS have also observed increases in effective connectivity [Grefkes et al., 2010] and functional connectivity [Eldaief et al., 2011; Vercammen et al., 2010]. Another study has shown that rTMS induces the release of dopamine and increases task‐specific functional connectivity [van Schouwenburg et al., 2012]. Although one of the studies has demonstrated large effects of excitatory rTMS and relatively moderate effects of inhibitory rTMS [Eldaief et al., 2011], to the best of our knowledge, our present study is the first to clearly demonstrate the bidirectional effects of excitatory and inhibitory rTMSs on the same RSFCs.
This successful detection of the bidirectional effects is considered to rely on the long‐lasting effects of QPS [Hamada et al., 2007, 2008; Hanajima et al., 2001; Shirota et al., 2010] and interhemispheric RSFC [Stark et al., 2008; Zuo et al., 2010]. The effects induced by conventional rTMS protocols [Eldaief et al., 2011] appear ∼20 min after the stimulation and last up to 60 min after the stimulation [Siebner et al., 2003; Speer et al., 2000; Valero‐Cabre et al., 2007]. In contrast, in the present protocol, the effect of QPS appears ∼10 min after the stimulation and lasts for over 90 min after rTMS [Hamada et al., 2007, 2008]. In the current study, these long‐lasting effects of QPS are considered to enable us to record a sufficient amount of stable fMRI data, which would be one of the major reasons we were able to detect the clear bidirectional effects.
The physiological basis of this rTMS‐induced connectivity change remains unclear. A previous PET study examining online effects of rTMS has demonstrated that excitatory rTMS increases blood flow in the stimulated site immediately after the stimulation [Strafella et al., 2001]. In contrast, several previous MRI studies using arterial‐spin labeling to evaluate the off‐line effects of rTMS have implied that inhibitory rTMS subsequently induces a compensatory increase in blood flow into the stimulated region [Moisa et al., 2010; Orosz et al., 2012]. In addition, a previous study using near‐infrared light to measure cortical activity has shown that the inhibitory‐rTMS‐induced activity change in the stimulated region is similar to that in the contra‐lateral brain region [Parks et al., 2012]. On the basis of these reports, one possible physiological basis is that rTMS induces a compensatory reaction in the stimulated region and subsequently induces a similar reaction in the contra‐lateral region, which should result in an increase in inter‐hemispheric RSFC. Considering the strong correlation between rTMS‐induced RSFC changes and MEP changes (Fig. 4B), we also speculate that the present findings indicate a causal relationship between rTMS‐induced RSFC changes and MEP changes. That is, excitatory and inhibitory rTMSs might enhance and reduce inter‐hemispheric inhibition from the contra‐lateral brain regions, which subsequently decreases and increases activity in the stimulated regions and MEPs decrease and increase, respectively. Although these issues need further investigation, this study has raised a promising possibility that excitatory and inhibitory QPSs serve as powerful tools to modulate RSFC.
Supporting information
Supplementary Information
ACKNOWLEDGMENTS
The authors thank Prof. Shoji Tsuji for his encouragement and support of this study.
REFERENCES
- Allen EA, Pasley BN, Duong T, Freeman RD (2007): Transcranial magnetic stimulation elicits coupled neural and hemodynamic consequences. Science 317:1918–1921. [DOI] [PubMed] [Google Scholar]
- Barker AT, Jalinous R, Freeston IL (1985): Non‐invasive magnetic stimulation of human motor cortex. Lancet 1:1106–1107. [DOI] [PubMed] [Google Scholar]
- Beckmann CF, DeLuca M, Devlin JT, Smith SM (2005): Investigations into resting‐state connectivity using independent component analysis. Philos Trans R Soc Lond B Biol Sci 360:1001–1013. [DOI] [PMC free article] [PubMed] [Google Scholar]
- Biswal B, Yetkin FZ, Haughton VM, Hyde JS (1995): Functional connectivity in the motor cortex of resting human brain using echo‐planar MRI. Magn Reson Med 34:537–541. [DOI] [PubMed] [Google Scholar]
- Biswal BB, Mennes M, Zuo X‐N, Gohel S, Kelly C, Smith SM, Beckmann CF, Adelstein JS, Buckner RL, Colcombe S, Dogonowski AM, Ernst M, Fair D, Hampson M, Hoptman MJ, Hyde JS, Kiviniemi VJ, Kotter R, Li SJ, Lin CP, Lowe MJ, Mackay C, Madden DJ, Madsen KH, Margulies DS, Mayberg HS, McMahon K, Monk CS, Mostofsky SH, Nagel BJ, Pekar JJ, Peltier SJ, Petersen SE, Riedl V, Rombouts SARB, Rypma B, Schlaggar BL, Schmidt S, Seidler RD, Siegle GJ, Sorg C, Teng GJ, Veijola J, Villringer A, Walter M, Wang L, Weng XC, Whitfield‐Gabrieli S Williamson P, Windischberger C, Zang YF, Zhang HY, Castellanos FX, Milham MP (2010): Toward discovery science of human brain function. Proc Natl Acad Sci USA 107:4734–4739. [DOI] [PMC free article] [PubMed] [Google Scholar]
- Chen W‐H, Mima T, Siebner HR, Oga T, Hara H, Satow T, Begum T, Nagamine T, Shibasaki H (2003): Low‐frequency rTMS over lateral premotor cortex induces lasting changes in regional activation and functional coupling of cortical motor areas. Clin Neurophysiol 114:1628–1637. [DOI] [PubMed] [Google Scholar]
- Damoiseaux JS, Rombouts SARB, Barkhof F, Scheltens P, Stam CJ, Smith SM, Beckmann CF (2006):Consistent resting‐state networks across healthy subjects. Proc Natl Acad Sci USA 103:13848–13853. [DOI] [PMC free article] [PubMed] [Google Scholar]
- Drummond GB (2009): Reporting ethical matters in the Journal of Physiology: Standards and advice. J Physiol (Lond) 587:713–719. [DOI] [PMC free article] [PubMed] [Google Scholar]
- Duann JR, Ide JS, Luo X, Li CSR (2009): Functional connectivity delineates distinct roles of the inferior frontal cortex and presupplementary motor area in stop signal inhibition. J Neurosci 29:10171–10179. [DOI] [PMC free article] [PubMed] [Google Scholar]
- Duque J, Hummel F, Celnik P, Murase N, Mazzocchio R, Cohen LG (2005): Transcallosal inhibition in chronic subcortical stroke. NeuroImage 28:940–946. [DOI] [PubMed] [Google Scholar]
- Eldaief MC, Halko MA, Buckner RL, Pascual‐Leone A (2011): Transcranial magnetic stimulation modulates the brain's intrinsic activity in a frequency‐dependent manner. Proc Natl Acad Sci USA 108:21229–21234. [DOI] [PMC free article] [PubMed] [Google Scholar]
- Fair DA, Schlaggar BL, Cohen AL, Miezin FM, Dosenbach NUF, Wenger KK, Fox MD, Snyder AZ, Raichle ME, Petersen SE (2007): A method for using blocked and event‐related fMRI data to study “resting state” functional connectivity. NeuroImage 35:396–405. [DOI] [PMC free article] [PubMed] [Google Scholar]
- Fox MD, Raichle ME (2007): Spontaneous fluctuations in brain activity observed with functional magnetic resonance imaging. Nat Rev Neurosci 8:700–711. [DOI] [PubMed] [Google Scholar]
- Fox MD, Snyder AZ, Vincent JL, Corbetta M, van Essen DC, Raichle ME (2005): The human brain is intrinsically organized into dynamic, anticorrelated functional networks. Proc Natl Acad Sci USA 102:9673–9678. [DOI] [PMC free article] [PubMed] [Google Scholar]
- Fox MD, Halko MA, Eldaief MC, Pascual‐Leone A (2012): Measuring and manipulating brain connectivity with resting state functional connectivity magnetic resonance imaging (fcMRI) and transcranial magnetic stimulation (TMS). NeuroImage 62:2232–2243. [DOI] [PMC free article] [PubMed] [Google Scholar]
- Fuggetta G, Pavone EF, Fiaschi A, Manganotti P (2008): Acute modulation of cortical oscillatory activities during short trains of high‐frequency repetitive transcranial magnetic stimulation of the human motor cortex: A combined EEG and TMS study. Hum Brain Mapp 29:1–13. [DOI] [PMC free article] [PubMed] [Google Scholar]
- George MS, Lisanby SH, Sackeim HA (1999): Transcranial magnetic stimulation: Applications in neuropsychiatry. Arch Gen Psychiatry 56:300–311. [DOI] [PubMed] [Google Scholar]
- Grefkes C, Nowak DA, Eickhoff SB, Dafotakis M, Küst J, Karbe H, Fink GR (2008): Cortical connectivity after subcortical stroke assessed with functional magnetic resonance imaging. Ann N Y Acad Sci 63:236–246. [DOI] [PubMed] [Google Scholar]
- Grefkes C, Nowak DA, Wang LE, Dafotakis M, Eickhoff SB, Fink GR (2010): Modulating cortical connectivity in stroke patients by rTMS assessed with fMRI and dynamic causal modeling. NeuroImage 50:233–242. [DOI] [PMC free article] [PubMed] [Google Scholar]
- Greicius MD, Krasnow B, Reiss AL, Menon V (2003): Functional connectivity in the resting brain: A network analysis of the default mode hypothesis. Proc Natl Acad Sci USA 100:253–258. [DOI] [PMC free article] [PubMed] [Google Scholar]
- Hamada M, Hanajima R, Terao Y, Arai N, Furubayashi T, Inomata‐Terada S, Yugeta A, Matsumoto H, Shirota Y, Ugawa Y (2007): Quadro‐pulse stimulation is more effective than paired‐pulse stimulation for plasticity induction of the human motor cortex. Clin Neurophysiol 118:2672–2682. [DOI] [PubMed] [Google Scholar]
- Hamada M, Terao Y, Hanajima R, Shirota Y, Nakatani‐Enomoto S, Furubayashi T, Matsumoto H, Ugawa Y (2008): Bidirectional long‐term motor cortical plasticity and metaplasticity induced by quadripulse transcranial magnetic stimulation. J Physiol (Lond) 586:3927–3947. [DOI] [PMC free article] [PubMed] [Google Scholar]
- Hanajima R, Ugawa Y, Machii K, Mochizuki H, Terao Y, Enomoto H, Furubayashi T, Shiio Y, Uesugi H, Kanazawa I (2001): Interhemispheric facilitation of the hand motor area in humans. J Physiol (Lond) 531:849–859. [DOI] [PMC free article] [PubMed] [Google Scholar]
- Honey CJ, Kötter R, Breakspear M, Sporns O (2007): Network structure of cerebral cortex shapes functional connectivity on multiple time scales. Proc Natl Acad Sci USA 104:10240–10245. [DOI] [PMC free article] [PubMed] [Google Scholar]
- Horacek J, Brunovsky M, Novak T, Skrdlantova L, Klirova M, Bubenikova‐Valesova V, Krajca V, Tislerova B, Kopecek M, Spaniel F, Mohr P, Höschl C (2007): Effect of low‐frequency rTMS on electromagnetic tomography (LORETA) and regional brain metabolism (PET) in schizophrenia patients with auditory hallucinations. Neuropsychobiology 55:132–142. [DOI] [PubMed] [Google Scholar]
- Kanai R, Dong MY, Bahrami B, Rees G (2011): Distractibility in daily life is reflected in the structure and function of human parietal cortex. J Neurosci 31:6620–6626. [DOI] [PMC free article] [PubMed] [Google Scholar]
- Kilpatrick LA, Zald DH, Pardo JV, Cahill LF (2006): Sex‐related differences in amygdala functional connectivity during resting conditions. NeuroImage 30:452–461. [DOI] [PubMed] [Google Scholar]
- Koyama MS, Di Martino A, Zuo X‐N, Kelly C, Mennes M, Jutagir DR, Castellanos FX, Milham MP (2011): Resting‐state functional connectivity indexes reading competence in children and adults. J Neurosci 31:8617–8624. [DOI] [PMC free article] [PubMed] [Google Scholar]
- Lee L, Siebner HR, Rowe JB, Rizzo V, Rothwell JC, Frackowiak RSJ, Friston KJ (2003): Acute remapping within the motor system induced by low‐frequency repetitive transcranial magnetic stimulation. J Neurosci 23:5308–5318. [DOI] [PMC free article] [PubMed] [Google Scholar]
- Merton PA, Morton HB (1980): Stimulation of the cerebral cortex in the intact human subject. Nature 285:227. [DOI] [PubMed] [Google Scholar]
- Meyer‐Lindenberg A (2010): From maps to mechanisms through neuroimaging of schizophrenia. Nature 468:194–202. [DOI] [PubMed] [Google Scholar]
- Meyer‐Lindenberg AS, Olsen RK, Kohn PD, Brown T, Egan MF, Weinberger DR, Berman KF (2005): Regionally specific disturbance of dorsolateral prefrontal‐hippocampal functional connectivity in schizophrenia. Arch Gen Psychiatry 62:379–386. [DOI] [PubMed] [Google Scholar]
- Moisa M, Pohmann R, Uludag K, Thielscher A (2010): Interleaved TMS/CASL: Comparison of different rTMS protocols. NeuroImage 49:612–620. [DOI] [PubMed] [Google Scholar]
- Murase N, Duque J, Mazzocchio R, Cohen LG (2004): Influence of interhemispheric interactions on motor function in chronic stroke. Ann N Y Acad Sci 55:400–409. [DOI] [PubMed] [Google Scholar]
- Murphy K, Birn RM, Handwerker DA, Jones TB, Bandettini PA (2009): The impact of global signal regression on resting state correlations: Are anti‐correlated networks introduced? NeuroImage 44:893–905. [DOI] [PMC free article] [PubMed] [Google Scholar]
- O'Shea J, Johansen‐Berg H, Trief D, Göbel S, Rushworth MFS (2007): Functionally specific reorganization in human premotor cortex. Neuron 54:479–490. [DOI] [PubMed] [Google Scholar]
- Oliviero A, Strens LHA, Di Lazzaro V, Tonali PA, Brown P (2003): Persistent effects of high frequency repetitive TMS on the coupling between motor areas in the human. Exp Brain Res 149:107–113. [DOI] [PubMed] [Google Scholar]
- Orosz A, Jann K, Wirth M, Wiest R, Dierks T, Federspiel A (2012): Theta burst TMS increases cerebral blood flow in the primary motor cortex during motor performance as assessed by arterial spin labeling (ASL). NeuroImage 61:599–605. [DOI] [PubMed] [Google Scholar]
- Parks NA, Maclin EL, Low KA, Beck DM, Fabiani M, Gratton G (2012): Examining cortical dynamics and connectivity with simultaneous single‐pulse transcranial magnetic stimulation and fast optical imaging. NeuroImage 59:2504–2510. [DOI] [PMC free article] [PubMed] [Google Scholar]
- Pascual‐Leone A, Walsh V, Rothwell J (2000): Transcranial magnetic stimulation in cognitive neuroscience—Virtual lesion, chronometry, and functional connectivity. Curr Opin Neurobiol 10:232–237. [DOI] [PubMed] [Google Scholar]
- Paus T, Castro‐Alamancos MA, Petrides M (2001): Cortico‐cortical connectivity of the human mid‐dorsolateral frontal cortex and its modulation by repetitive transcranial magnetic stimulation. Eur J Neurosci 14:1405–1411. [DOI] [PubMed] [Google Scholar]
- Post RM, Kimbrell TA, McCann UD, Dunn RT, Osuch EA, Speer AM, Weiss SR (1999): Repetitive transcranial magnetic stimulation as a neuropsychiatric tool: Present status and future potential. J Ect 15:39–59. [PubMed] [Google Scholar]
- Pridmore S, Belmaker R (1999): Transcranial magnetic stimulation in the treatment of psychiatric disorders. Psychiatry Clin Neurosci 53:541–548. [DOI] [PubMed] [Google Scholar]
- Romei V, Driver J, Schyns PG, Thut G (2011): Rhythmic TMS over parietal cortex links distinct brain frequencies to global versus local visual processing. Curr Biol 21:334–337. [DOI] [PMC free article] [PubMed] [Google Scholar]
- Shirota Y, Hamada M, Terao Y, Matsumoto H, Ohminami S, Furubayashi T, Nakatani‐Enomoto S, Ugawa Y, Hanajima R (2010): Influence of short‐interval intracortical inhibition on short‐interval intracortical facilitation in human primary motor cortex. J Neurophysiol 104:1382–1391. [DOI] [PubMed] [Google Scholar]
- Siebner HR, Filipovic SR, Rowe JB, Cordivari C, Gerschlager W, Rothwell JC, Frackowiak RSJ, Bhatia KP (2003): Patients with focal arm dystonia have increased sensitivity to slow‐frequency repetitive TMS of the dorsal premotor cortex. Brain 126:2710–2725. [DOI] [PubMed] [Google Scholar]
- Smith SM, Fox PT, Miller KL, Glahn DC, Fox PM, Mackay CE, Filippini N, Watkins KE, Toro R, Laird AR, Beckmann CF (2009): Correspondence of the brain's functional architecture during activation and rest. Proc Natl Acad Sci USA 106:13040–13045. [DOI] [PMC free article] [PubMed] [Google Scholar]
- Sparing R, Buelte D, Meister IG, Pauš T, Fink GR (2008): Transcranial magnetic stimulation and the challenge of coil placement: A comparison of conventional and stereotaxic neuronavigational strategies. Hum Brain Mapp 29:82–96. [DOI] [PMC free article] [PubMed] [Google Scholar]
- Speer AM, Kimbrell TA, Wassermann EM, Repella JD, Willis MW, Herscovitch P, Post RM (2000): Opposite effects of high and low frequency rTMS on regional brain activity in depressed patients. Biol Psychiatry 48:1133–1141. [DOI] [PubMed] [Google Scholar]
- Stark DE, Margulies DS, Shehzad ZE, Reiss P, Kelly AMC, Uddin LQ, Gee DG, Roy AK, Banich MT, Castellanos FX, Milham MP (2008). Regional variation in interhemispheric coordination of intrinsic hemodynamic fluctuations. J Neurosci 28:13754–13764. [DOI] [PMC free article] [PubMed] [Google Scholar]
- Strafella AP, Paus T (2001): Cerebral blood‐flow changes induced by paired‐pulse transcranial magnetic stimulation of the primary motor cortex. J Neurophysiol 85:2624–2629. [DOI] [PubMed] [Google Scholar]
- Strens LHA, Oliviero A, Bloem BR, Gerschlager W, Rothwell JC, Brown P (2002): The effects of subthreshold 1 Hz repetitive TMS on cortico‐cortical and interhemispheric coherence. Clin Neurophysiol 113:1279–1285. [DOI] [PubMed] [Google Scholar]
- Tian L, Ren J, Zang Y (2012): Regional homogeneity of resting state fMRI signals predicts stop signal task performance. NeuroImage 60:539–544. [DOI] [PubMed] [Google Scholar]
- Toro R, Fox PT, Pauš T (2008): Functional coactivation map of the human brain. Cereb Cortex 18:2553–2559. [DOI] [PMC free article] [PubMed] [Google Scholar]
- Valero‐Cabre A, Payne BR, Pascual‐Leone A (2007): Opposite impact on 14C‐2‐deoxyglucose brain metabolism following patterns of high and low frequency repetitive transcranial magnetic stimulation in the posterior parietal cortex. Exp Brain Res 176:603–615. [DOI] [PubMed] [Google Scholar]
- van der Werf YD, Sanz‐Arigita EJ, Menning S, van den Heuvel OA (2010): Modulating spontaneous brain activity using repetitive transcranial magnetic stimulation. BMC Neurosci 11:145. [DOI] [PMC free article] [PubMed] [Google Scholar]
- van Dijk KRA, Hedden T, Venkataraman A, Evans KC, Lazar SW, Buckner RL (2010): Intrinsic functional connectivity as a tool for human connectomics: Theory, properties, and optimization. J Neurophysiol 103:297–321. [DOI] [PMC free article] [PubMed] [Google Scholar]
- van Kesteren MTR, Fernández G, Norris DG, Hermans EJ (2010): Persistent schema‐dependent hippocampal‐neocortical connectivity during memory encoding and postencoding rest in humans. Proc Natl Acad Sci USA 107:7550–7555. [DOI] [PMC free article] [PubMed] [Google Scholar]
- van Schouwenburg MR, O'Shea J, Mars RB, Rushworth MFS, Cools R (2012): Controlling human striatal cognitive function via the frontal cortex. J Neurosci 32:5631–5637. [DOI] [PMC free article] [PubMed] [Google Scholar]
- Vercammen A, Knegtering H, Liemburg EJ, Boer den JA, Aleman A (2010): Functional connectivity of the temporo‐parietal region in schizophrenia: Effects of rTMS treatment of auditory hallucinations. J Psychiatr Res 44:725–731. [DOI] [PubMed] [Google Scholar]
- Vincent JL, Snyder AZ, Fox MD, Shannon BJ, Andrews JR, Raichle ME, Buckner RL (2006): Coherent spontaneous activity identifies a hippocampal‐parietal memory network. J Neurophysiol 96:3517–3531. [DOI] [PubMed] [Google Scholar]
- Wassermann EM (1998): Risk and safety of repetitive transcranial magnetic stimulation: Report and suggested guidelines from the International Workshop on the Safety of Repetitive Transcranial Magnetic Stimulation, June 5–7, 1996. Electroencephalogr Clin Neurophysiol 108:1–16. [DOI] [PubMed] [Google Scholar]
- Whitfield‐Gabrieli S, Thermenos HW, Milanovic S, Tsuang MT, Faraone SV, McCarley RW, Shenton ME, Green AI, Nieto‐Castanon A, LaViolette P, Wojcik J, Gabrieli JDE, Seidman LJ (2009): Hyperactivity and hyperconnectivity of the default network in schizophrenia and in first‐degree relatives of persons with schizophrenia. Proc Natl Acad Sci USA 106:1279–1284. [DOI] [PMC free article] [PubMed] [Google Scholar]
- Zaretskaya N, Thielscher A, Logothetis NK, Bartels A (2010). Disrupting parietal function prolongs dominance durations in binocular rivalry. Curr Biol 20:2106–2111. [DOI] [PubMed] [Google Scholar]
- Zuo XN, Kelly C, Adelstein JS, Klein DF, Castellanos FX, Milham MP (2010): Reliable intrinsic connectivity networks: Test‐retest evaluation using ICA and dual regression approach. NeuroImage 49:2163–2177. [DOI] [PMC free article] [PubMed] [Google Scholar]
Associated Data
This section collects any data citations, data availability statements, or supplementary materials included in this article.
Supplementary Materials
Supplementary Information