

Abstract
Temporal summation of second pain (TSSP) occurs when painful stimuli are presented repetitively (≥0.33 Hz) and results from a C‐fibre evoked enhancement (or “wind‐up”) of the dorsal horn neurons. Based on electrophysiological studies in intact animals, windup is considered a purely central phenomenon. With advancements in functional MRI (fMRI), we can now probe the central mechanisms of this pain response in humans. The aim of this study is to characterize the fMRI responses in the healthy human brainstem and spinal cord that correspond to TSSP. Functional MRI of healthy female adults (N = 15) was conducted while brief, repetitive heat pain stimuli were applied to the right thenar eminence (C6 dermatome), and TSSP (0.33 Hz) and control (0.17 Hz) heat pain paradigms were employed. The stimulus intensity was adjusted to each participant's heat pain sensitivity. Data were analyzed by means of a general linear model, and region‐of‐interest analyses. As predicted, participants demonstrated significant behavioural summation of pain in the TSSP condition. FMRI results identified enhanced activity in the spinal cord dorsal horn at C6 in response to the TSSP condition. Additionally, multiple areas of the brainstem (RVM and PAG) showed greater responses with the TSSP condition. These results suggest that, in humans, increased pain perception in the TSSP condition is reflected by greater responses in the dorsal horn and in regions known to play a role in the descending modulation of pain, which may modulate the spinal cord response. Hum Brain Mapp 36:5038–5050, 2015. © 2015 Wiley Periodicals, Inc.
Keywords: temporal summation, second pain, windup, fMRI, spinal cord, brainstem, human
INTRODUCTION
Temporal summation of second pain (TSSP) is a progressive increase in pain perception which occurs when painful stimuli are presented repetitively (>0.33 Hz) [Price, 1972; Price et al., 1977]. Second pain is mediated by C‐fibres and is described as long‐lasting burning sensations that often outlasts the duration of the stimulus. Published studies using animal models have provided evidence that repetitive C‐fibre stimulation evokes enhancement (or “windup”) of the dorsal horn neurons [Mendell, 1966; Mendell and Wall, 1965; Woolf and Salter, 2000]. However, despite the evidence for spinal windup in animals, and behavioural evidence of TSSP in humans, little is known about the neural representations and mechanisms of TSSP/windup within the human spinal cord. With advances in spinal cord functional MRI, we can, for the first time, noninvasively probe the central mechanisms of this pain response in humans.
Windup of the dorsal horn neurons, and the related TSSP, is known to be a purely central phenomenon and therefore provides a means of probing effects of centrally mediated pain processing [Koltzenburg and Handwerker, 1994; Price et al., 1977]. Moreover, windup has been shown to have features in common with central sensitization. For example, once windup has occurred, the enhanced excitability of the dorsal horn neurons can be maintained with minimal additional input [Staud et al., 2004, 2007b]. In addition, stimuli that evoke windup are sufficient to cause a transient enlargement of the cutaneous receptive fields and enhanced responses to input from C‐fibres [Herrero et al., 2000; Li et al., 1999]. Although windup is not required for central sensitization, the two share common properties. Therefore, characterizing the spinal cord and brainstem responses to TSSP is expected to reveal the central components of pain and the contribution of central sensitization in chronic pain conditions.
Functional neuroimaging has already been used to characterize the neural correlates of TSSP in the brain [Staud et al., 2007a]. Regions responding when TSSP was evoked were located in a number of somatosensory (Thalamus, S2), cognitive (anterior cingulate, prefrontal cortex), affective (insula, anterior cingulate), premotor (cerebellum), and pain modulation areas (rostral anterior cingulate) [Staud et al., 2007a]. Despite the expected importance of the brainstem and spinal cord in TSSP/windup, the properties and locations of the neural correlates in these regions are unknown. However, a number of studies have used fMRI in the spinal cord and brainstem to investigate mechanisms of pain processing in these regions [Dobek et al., 2014; Rempe et al., 2014, 2015; Sprenger et al., 2012; Wheeler‐Kingshott et al., 2014]. Therefore, in the present study, we used fMRI to examine the spinal cord and brainstem representation of TSSP in normal, pain‐free subjects. We hypothesized that the BOLD response in the spinal cord dorsal horn would be enhanced when TSSP is evoked, compared to a control condition without TSSP. We also hypothesized that, compared to the control condition, TSSP would evoke greater brainstem responses in regions known to be involved in the descending modulation of spinal nociception.
MATERIALS AND METHODS
Participants
Participants (N = 20 females, age range = 21–55, M age = 39) had no history of neurological disease, major medical illness, or psychiatric disorder. Participants were recruited from the local community, and provided informed consent. We selected this demographic because chronic pain conditions are more prevalent in middle and older age individuals, and sex differences in pain perception have been demonstrated [Robinson et al., 2004]. This cohort therefore provides a relevant sample for future comparisons with chronic pain patients. All premenopausal subjects were tested during the luteal phase of their menstrual cycles as determined by their menstrual history. Only 15 participants completed all stages of the study (as 5/20 chose not to continue with the imaging sessions). All procedures were in accordance with the Tri‐Council Policy Statement on Ethical Conduct for Research Involving Humans.
Experimental Design
The purpose of this study was to characterize the dorsal horn and brainstem response to C‐fibre activation and TSSP. Therefore, a TSSP pain paradigm was applied to the skin overlying the thenar eminence of the right hand. The rationale for selecting the thenar eminence were twofold; primarily, we selected this region because it is innervated from the 6th cervical dermatome and we can image the cervical cord and brainstem simultaneously. Secondly, noxious thermal stimuli (under 51°C) applied to this area activate predominantly C‐nociceptors and little first/second pain distinction is experienced [Campbell and LaMotte, 1983]. Second‐pain sensations are mediated by C‐fibres as determined previously by conduction latencies [Price et al., 1977] and can be elicited using the described TSSP paradigm [Staud et al., 2007a].
All participants underwent a quantitative sensory testing session and an imaging session. In the first session, heat pain thresholds were determined, and participants became familiar with the study procedures. As a measure of control, participants completed questionnaires to assess depression, anxiety, pain catastrophizing, and social desirability. In the second session, functional MRI of the spinal cord/brainstem was conducted while the TSSP paradigm was employed. Before, and several times throughout each session, participants rated their somatic pain and anxiety on a numerical pain scale (0–100). The scales were anchored with the phrases “no pain/no anxiety” and “the most intense pain/anxiety imaginable” reflecting 0 and 100 scores, respectively. These measures were acquired to ensure that the participant was not experiencing or developing any new pain or anxiety (headache, back pain, etc.).
Questionnaires
All participants were asked to complete the Beck Depression Inventory‐II (BDI‐II) [Beck et al., 1996], the State/Trait Anxiety Questionnaire [Spielberger et al., 1983], the Pain Catastrophizing Scale [Sullivan et al., 1995], and the Social Desirability Scale [Crowne and Marlowe, 1960]. The BDI‐II is a self‐administered 21 item inventory which assesses the affective, motivational, cognitive, and somatic symptoms of depression. Participants rated whether they experience the symptoms on a scale from 0 to 3, with total scores ranging from 0 to 63 (0–13 = minimal depression; 14–19 = mild depression; 20–28 = moderate depression; 29–63 = severe depression). Higher total scores indicate more severe levels of depression. The State/Trait Anxiety Inventory is a 40‐item self‐report measure that is divided into two sections, with 20 items measuring the transient condition of state anxiety and 20 items devoted to the long standing condition of trait anxiety. Responses are rated on a 4‐point Likert scale, ranging from 1 (not at all) to 4 (very much so). Possible scores range from 20 to 80, with higher scores indicating greater anxiety (low anxiety = 20–39, moderate anxiety = 40–59, high anxiety = 60–80). The Pain Catastrophizing Scale is a 13‐item measure consisting of descriptions of various thoughts and feelings people might experience related to pain [Sullivan et al., 1995].The respondent indicates on a Likert‐type scale of 0 (not at all) to 4 (all the time) how often they experience that particular thought or feeling when they are in pain. Scores range from 0 to 52, with higher scores indicating higher levels of catastrophizing. The PCS manual indicates that, although the scores on the PCS are normally distributed, a score of 30 can be thought of as a cutoff for clinically relevant catastrophizing. Finally, the Social Desirability Scale has 33 items to which the participant indicates that the statement is true or false. High scores on this scale indicate that the participant seeks to be viewed as socially appropriate.
Training Session
At the beginning of the first session, participants were trained to use a standardized numerical pain scale (NPS) to rate the magnitude/intensity of their pain experience [Staud et al., 2006; Vierck et al., 1997]. The scale ranges from 0 to 100, in increments of 5, with verbal descriptors at intervals of 10: 0—no sensation, 10—warm, 20—a barely painful sensation (i.e., pain threshold), 30—very weak pain, 40—weak pain, 50—moderate pain, 60—slightly strong pain, 70—strong pain, 80—very strong pain, 90—nearly intolerable pain, and 100—intolerable pain. Participants were shown the scale continuously while they rated their sensations. The descriptors were initially read to the participant, and they were instructed to rate their pain sensation numerically. This scale has been found to be sensitive for discriminating levels of sensation and advantageous to use when rating a series of sensations [Staud et al., 2007a; Vierck et al., 1997].
After participants were instructed on the scale, a series of threshold and calibration tests were performed. All heat sensations were applied to the skin via an MR compatible, Peltier thermode (Medoc®, Ramat Yishai, Israel). The Medoc device was programmed to control the temperature while the thermode was held by one of the experimenters and applied manually to the skin as needed for the specific test or stimulus. First, participants were asked to rate their pain sensations to three different temperatures (45, 46, 47°C) applied to the skin of the forearm for 2 s. Ratings from this test confirmed that participants could distinguish between the temperatures and understood the rating scale. The thermode was then heated to 42°C and contact with the thenar eminence was repeated eight times, every 3 s (i.e., a frequency of 0.33 Hz). For the series of contacts the experimenter was guided by audio cues (imperceptible to the participant) to indicate the duration (1.5 s) and timing onset of each contact. Participants were instructed to rate their pain from each contact, and also to rate the sensation on their hand at 15 and 30 s after the last contact, to provide indications of after‐sensations. This process was repeated at 46°, 50°, 44°, and 48°C. This series of tests was used to determine if the participant experienced temporal summation of second pain and guided our calibration of the appropriate temperature to achieve a sensitivity‐adjusted final rating of 50 ± 10 NPS units on the scale. Therefore, the temperature of the heat stimuli was varied as a function of each subject's TSSP sensitivity, which reflects the individual's peripheral and/or central sensitivity. The final rating of 50 ± 10 NPS units was chosen because healthy participants are unlikely to experience prolonged peripheral or central hypersensitivity at this temperature even with repeated trials.
FMRI Training
During the first session, participants also underwent mock fMRI scanning to become familiar with the scanning environment. Participants lay down on the mock MRI scanner bed and underwent the TSSP protocol as it would be presented in the subsequent MRI sessions. They viewed a rear‐projected screen (via a mirror) on which notifications were displayed when a new run was about to start, when the heat stimuli would begin, and when to say their ratings. As in the earlier tests, the thermode was heated to the calibrated temperature and was applied in a series of 11 brief (1.5 s) contacts to the thenar eminence of the right hand (see Fig. 1). For the TSSP condition, repetitive contacts were made at an interstimulus interval (onset to onset) of 3 s (0.33 Hz) whereas the control condition had an interstimulus interval of 6 s (0.17 Hz) and was unlikely to induce TSSP. Contrary to the earlier tests, participants were instructed to silently rate their pain to each heat contact in an effort to have them remember their pain rating at the time it was experienced, rather than rate a memory of their pain experience. However, they were prompted to verbally report their ratings to the first and last heat contact, after the last heat contact had been applied. This replicated the procedures used to limit movement during the fMRI acquisitions in later sessions. Finally, participants verbally reported ratings 15 and 30 s after the last heat contact was made. A minimum of 2 min of rest was given between each run to prevent long‐term sensitization of nociceptive afferents [Price et al., 1977]. Each participant experienced repeated runs of the TSSP and control paradigms while recorded scanner noises were played to simulate the actual fMRI environment.
Figure 1.
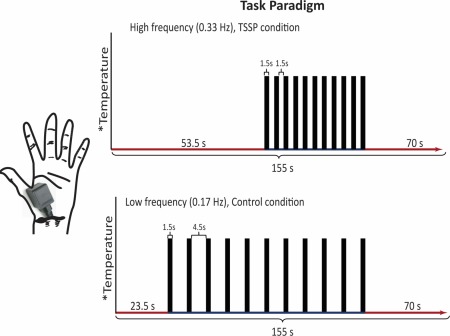
The task paradigm for the TSSP and control conditions. The temperature of stimulation was calibrated for each individual to produce a moderate pain rating (50 on a 100‐point scale) for the last stimulus of the TSSP paradigm. The same temperature was used for both conditions. The duration of the first baseline period was reduced for the control condition, so that the final baseline period was the same between conditions. For the TSSP condition, the heat stimuli were applied every 3 s, for 1.5 s, whereas in the control condition, the heat stimuli were applied every 6 s, also for a duration of 1.5 s. [Color figure can be viewed in the online issue, which is available at http://wileyonlinelibrary.com.]
TSSP Scanning Design
The stimulation paradigms used during fMRI sessions were similar to those practiced during the mock fMRI session. In both TSSP and control conditions, 11 heat contacts were applied, every 3 s or every 6 s, respectively (Fig. 1). The stimulation periods were preceded and followed by rest periods resulting in a duration of 155 s for each paradigm. During fMRI sessions participants were prompted to provide ratings one time, immediately after the last heat contact, and ratings of after‐sensations were not obtained. Again, participants viewed instructions on a rear‐projection screen (via a mirror) which notified them when a new scan was about to begin, when the application of heat stimuli would begin, and when to report their ratings into a noise‐canceling microphone. Six runs of each of the TSSP and control conditions were implemented in a random, counterbalanced order, and a minimum of 2 min rest was given between each run.
FMRI Data Acquisition
All image data were acquired using a 3T whole‐body MRI system (Siemens Magnetom Trio; Siemens, Erlangen, Germany). Participants were positioned supine and were supported by padding as needed for comfort and to restrict bulk body movement, and entered the MRI system head first. Initial localizer images were acquired in three planes as a reference for slice positioning for subsequent fMRI studies. Data were acquired using a posterior head coil (6 elements), a posterior neck coil (3 elements), and, depending on the size of the participant, the upper three elements of a phased‐array spine receiver coil (6× 3 array). A body coil was used for transmitting radio‐frequency (RF) excitation pulses. In order to obtain optimal spatial fidelity in the brainstem and spinal cord, as well as BOLD sensitivity, fMRI data were acquired using a half‐Fourier single‐shot fast spin‐echo sequence [Bosma and Stroman, 2014a]. A 3D volume that spanned from the T1 vertebra to above the thalamus was imaged repeatedly to produce each fMRI time‐series. Nine sagittal slices were acquired contiguously with a repetition time (TR) of 6.75 s/vol, an echo time of 76 ms to optimize the T2‐weighted BOLD sensitivity, a 28 × 21 cm field‐of‐view with 1.5 × 1.5 × 2 mm3 resolution. A total of 138 volumes were acquired for each condition (over 6 repeated runs). The image quality was enhanced by means of spatial suppression pulses anterior to the spine to reduce motion artefacts caused by breathing, swallowing, etc, and motion compensating gradients in the head–foot direction.
Data Analysis
Data preprocessing
The 3D spinal cord/brainstem functional imaging data were analyzed with custom‐made software written in MatLab®. Image data were first converted to NIfTI format, and were coregistered to correct for bulk motion using the nonrigid 3D registration tool in the Medical Image Registration Toolbox (MIRT) [Myronenko and Song, 2009, 2010]. The images were then resized to 1 mm cubic voxels and spatially normalized using custom‐made automated normalization software written in MatLab. For the normalization, predefined sections of our normalized template, which we have generated from images of 356 participants, were matched in position and rotation angle to sections of the original image data, based on the maximum cross‐correlation. The first section identified included the corpus callosum and thalamus, because these regions have distinct features which tend to make their location unambiguous. In subsequent sections the position and angle were weighted towards predicted values based on prior segments resulting in a stable mapping process. The mapping to the normalized template was also fine‐tuned using the MIRT toolbox [Myronenko and Song, 2010]. The normalized data were then smoothed with a 3 × 3 × 5 mm (R/L × A/P × S/I) boxcar kernel. The time‐series data from repeated acquisitions from each participant, in each study condition, were averaged prior to data analysis. This process has been shown to reduce effects of random and physiological noise which are uncorrelated across repeated acquisitions while reinforcing BOLD responses that are time locked to the stimulation paradigm [Bosma and Stroman 2014a; Stroman et al., 2012].
Anatomical region map
An anatomical map was defined within the normalized template for multiple brainstem and spinal cord regions based on anatomical atlases and published descriptions, with 3D regions labelled manually on our normalized template image (used in the normalization step) [Naidich et al., 2009; Talairach and Tournoux, 1988; Williams et al., 1995]. This map was used to automatically label the voxels with significant BOLD responses in the GLM analysis. These regions included the right dorsal region of the C6 spinal cord segment, the parabrachial nucleus (PBN), the locus coeruleus (LC), the rostral ventromedial medulla (RVM) [nucleus raphe magnus (NRM) and nucleus gigantocellularis (NGc)], the nucleus tractus solitaries (NTS), the dorsal reticular nucleus (DRt), the periaqueductal gray matter (PAG), and the hypothalamus. The spinal cord segments were identified based on the distance in millimeters from the pontomedullary junction (PMJ) as described by Lang [1993] and Lang and Bartram [1982]. All anatomical regions described in the analyses and results below are in reference to this region map and are expected to be in close proximity to the regions that they depict, within the accuracy of our image data and published descriptions of the anatomy.
General linear model analysis
A first‐level analysis was conducted on the preprocessed data for each participant, for each condition, using a general linear model (GLM) as implemented in the statistical parametric mapping (SPM) software package [Worsley and Friston, 1995]. The basis set used for the GLM analysis included (1) a paradigm matching the timing of each heat contact and pre‐ and post‐ and interstimulus baseline periods (to model peripheral input to the spinal cord), (2) a term that estimated the timing of the after‐sensations of the pain response as a block paradigm, (3) two nuisance regressor terms to account for physiological noise, and (4) a constant function. The nuisance regressor terms were taken as the first two principal components obtained from a principal components analysis of the time‐series data across all voxels in the spinal cord and brainstem. These terms have been shown to account for sources of global variance that are common across a large number of voxels and originate from physiological motion, whereas BOLD responses are more highly localized [Bosma and Stroman, 2014a]. The models of peripheral stimulation and after‐sensation timing were convolved with the BOLD hemodynamic response function [Worsley and Friston, 1995].
Second‐level analyses were carried out using a random‐effects method to determine the consistency of BOLD response magnitudes (β values) determined from the GLM, on a voxel‐by‐voxel basis. The BOLD responses were contrasted between study conditions (TSSP vs. control). Significant activity was inferred at P < 0.001, and the problem of multiple comparisons was addressed by limiting active regions to those with a spatial extent of at least 10 mm3, based on the “stat_threshold” function written by K.J. Worseley [Bosma and Stroman, 2014b].
ROI and time‐series analysis
Region‐of‐interest (ROI) analysis in the dorsal horn was carried out by defining 3D volumes in the normalized representation of the cord, as detailed below, and determining average responses over these volumes. Anatomical regions were as defined in the region map described above. In this map the sixth cervical (C6) segment spans from 78 to 92 mm along the cord from the PMJ. Within each segment the cord cross‐sectional area was divided right/left and dorsal/ventral to define quadrants. The time‐series data were extracted from the C6 right dorsal region in both the TSSP and control conditions and the average BOLD signal changes in the DH during the stimulation periods were compared.
RESULTS
Somatic Pain Ratings and Questionnaires
The participants reported no somatic pain or anxiety before or during the fMRI scans. Their mean ± SD Beck's Depression Inventory score was 8.8 ± 5 and their mean ± SD Spielberger State/Trait Anxiety scores were 33 ± 8 and 38 ± 10, respectively. These scores suggest that our fMRI analysis was not confounded by incidental somatic pain or high levels of anxiety or depression. Their scores on the Pain Catastrophizing scale were 15 ± 5 and on the Social Desirability scale were 15 ± 10. These scores indicate that our subjects were in the normal range for these variables.
Behavioural Results
During the mock scanner training session, pain ratings to the first and last pain stimuli were obtained immediately after the last heat stimuli. Results from a repeated measures ANOVA indicated a significant main effects of condition (TSSP vs. control) F(1,14) = 35.87, P < 0.001 and a significant main effect of the pain ratings between the first and last heat pain stimuli F(1,14) = 83.85, P < 0.001. There was also a significant condition (TSSP vs. control) × stimulus (first rating vs. last rating) interaction F(1,14) = 16.72, P = 0.001. Dependent t tests showed that pain ratings in the TSSP condition for the first heat stimuli (14.9 ± 9.4, mean ± SD), were significantly lower than ratings of the last heat stimuli (48.4 ± 14.3) (t(14) = 9.9, P < .001). The pain ratings were also significantly higher for the last heat stimuli in the TSSP condition (48.4 ± 14.3) compared to the control condition (26.5 ± 11.2), (t(14) = 5.6, P < 0.001). Furthermore, average ratings to the after‐sensations, were significantly greater in the TSSP condition (8.9 ± 5.2) compared to the control condition (4.1 ± 2.6), (t(14) = 3.8, P = 0.001) (see Fig. 2).
Figure 2.
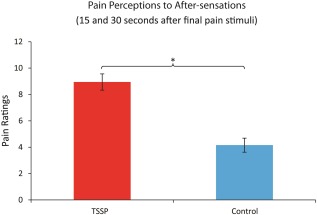
Reported ratings of after‐sensations obtained from each participant, for each condition, during the fMRI training sessions. Ratings of residual sensations/pain on the hand were obtained 15 and 30 s after the last heat stimulus. Asterisk indicates a significant difference, P < .05, error bars indicate standard error. [Color figure can be viewed in the online issue, which is available at http://wileyonlinelibrary.com.]
Pain ratings obtained during the fMRI scanning session were also compared using a repeated measures ANOVA. The results indicated a significant main effect of the pain ratings between the conditions (TSSP vs. control) F(1,14) = 59.3, P < 0.001 and a significant main effect of the pain ratings between the first and last heat pain stimuli F(1,14) = 82.79, P < 0.001. There was also a significant condition (TSSP vs. control) × stimulus (first rating vs. last rating) interaction F(1,14) = 26.42, P < 0.001. Dependent t tests confirmed a significantly higher pain response to the last heat stimuli (51.6 ± 14.6) compared to the first pain stimuli (19.5 ± 14.3) in the TSSP condition (t(14) = 9.7, P < 0.001) (Fig. 3). The pain ratings were also significantly higher for the last heat contact in the TSSP condition (51.6 ± 14.6) compared to the control condition (23.4 ± 12.5), (t(14) = 7.2, P < 0.001). Importantly, there were no significant differences between the ratings to the first or last heat stimuli, in either condition, between the training session and the fMRI session (all P > 0.05).
Figure 3.
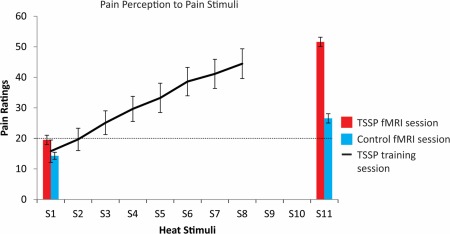
Plots of the mean pain ratings across participants for the first and last heat pain stimuli, in the TSSP and control conditions (red and blue bars, respectively, error bars indicate standard error). In addition, each participant rated their pain to each of eight repeated stimuli (S) for the TSSP condition during the training session (line). In the fMRI session, all participants were asked to remember the numeric ratings of the pain intensity related to the first and last heat stimuli (11 heat stimuli (S) in total) and reported their ratings at the end of the stimulation period. The ratings to the first heat stimuli did not differ significantly between conditions, whereas the ratings to the first and the last in each condition were significantly different, as were the ratings to the last stimuli of the two conditions (P < .001). A rating of 20 represents the pain threshold (dotted line). [Color figure can be viewed in the online issue, which is available at http://wileyonlinelibrary.com.]
ROI Analysis Results
In the spinal cord and brainstem, BOLD activity increased during TSSP trials and remained elevated after the last of the 11 stimuli for more than 40 s in the dorsal horn, RVM, LC, PBN, and in the PAG (Fig. 4). In contrast, the BOLD responses in the control trials returned to baseline within approximately 10 s after the last stimulus. The average BOLD signal change in the DH during the stimulation period was significantly greater in the TSSP condition compared to the control condition.
Figure 4.
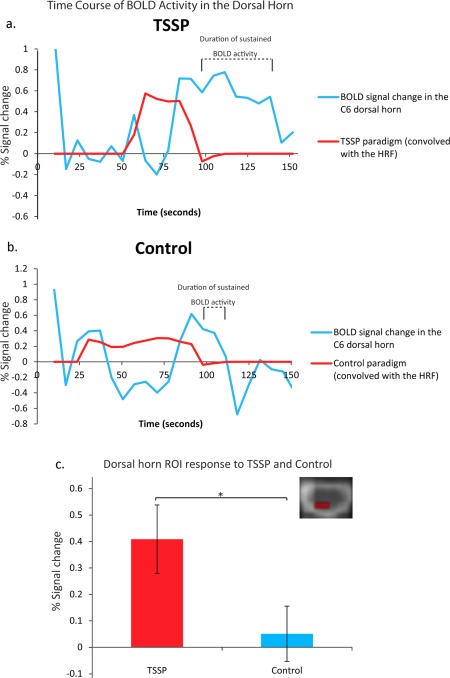
The measured BOLD signal time courses (blue) related to (a) TSSP and (b) control conditions are plotted in relation to the model paradigms convolved with the hemodynamic response function (red). The duration of BOLD response corresponding to the after‐sensations is indicated above each time‐course plot. The first volume is not shown to avoid variable T1‐weighting in the plotted time courses. The bottom plot (c) shows the % signal change from the dorsal horn ROI during task stimulation in the TSSP condition compared to the control condition (error bars indicate standard error, P < .05). [Color figure can be viewed in the online issue, which is available at http://wileyonlinelibrary.com.]
BOLD Comparisons Between TSSP and Control Conditions
A GLM analysis was performed on the TSSP and control data and revealed active voxels in a number of consistent pain‐related regions. A contrast analysis was performed to determine areas of the cord and brainstem responding more to the TSSP paradigm, compared to the Control paradigm (Fig. 5a, Table 1). Consistent with the psychophysical data, the BOLD responses were larger in the regions of the RVM, NTS, and PAG, in the TSSP condition compared to the control condition. Furthermore, the responses to the after‐sensations were identified and compared between conditions (Fig. 5b). There was significantly greater BOLD activity seen in the ipsilateral dorsal horn corresponding to the after‐sensations, but not to the model paradigm for the thermal stimulation. There was also greater BOLD activity in the NRM and PAG in response to the TSSP condition (Table 2).
Figure 5.
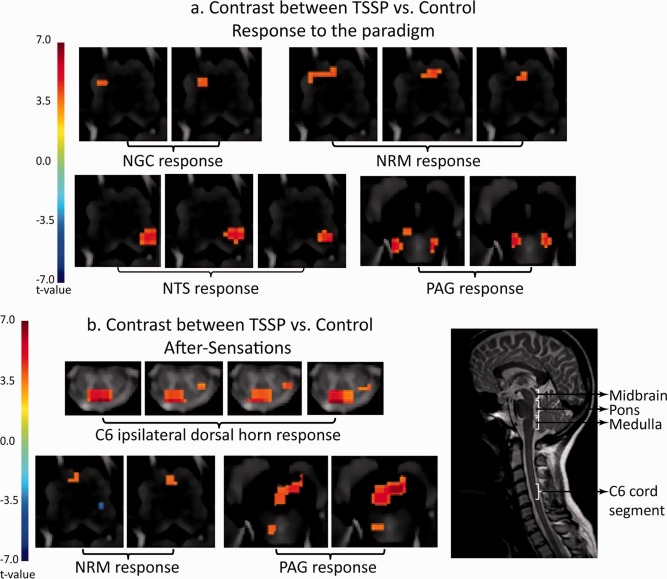
Results of the contrast analysis comparing BOLD signal changes between the TSSP and control conditions. The results are overlaid on high resolution transverse slices. The color scale indicates the significance of areas with different responses between the conditions (t value). A midline sagittal slice (taken from fMRI data) from one participant is shown for reference and illustrates the approximate location of the midbrain, pons, medulla, and C6 cord segment. (a) Key areas with significantly different responses to the stimulation paradigm are demonstrated in the vicinity of the NGC, NRM, and NTS in the medulla, and PAG in the midbrain. (b) Key areas with significantly different responses to the after‐sensations are shown to be the right dorsal horn region of the C6 segment, near the NRM in the medulla, and in the vicinity of the PAG. [Color figure can be viewed in the online issue, which is available at http://wileyonlinelibrary.com.]
Table 1.
Regions with greater responses to TSSP compared to the control condition
| Anatomical region |
X (R → L) |
Y (A → P) |
Z (I → S) |
k | T |
|---|---|---|---|---|---|
| NGC | −0.95 | 5.58 | −4.47 | 214 | 3.50 |
| NRM | 4.89 | 9.89 | 0.63 | 86 | 3.90 |
| NTS | −8.03 | 11.34 | 2.3 | 58 | 3.48 |
| Thalamus | −7.02 | 3.82 | 31.56 | 273 | 3.80 |
| −4.46 | 8.59 | 45.32 | 180 | 3.45 | |
| Caudal medulla | −0.41 | 6.25 | −41.93 | 32 | 3.54 |
| PAG | −3.41 | 7.74 | 18.89 | 92 | 3.83 |
All statistical inferences were made at P < 0.001, cluster threshold at 10 voxels. The coordinates x, y, z, refer to the absolute distance in millimeters from the pontomedullary junction relative to the mid‐line in the R/L direction, and the anterior edge of the medulla/cord in the A/P direction, k refers to the cluster size (1 mm cubic voxels), and t is the average t value across each cluster of contiguous voxels. NRM: nucleus raphe magnus, NTS: nucleus tractus solitarius, NGC: nucleus gigantocellularis, PAG: periaqueductal gray matter.
Table 2.
Key areas with significantly greater responses to the after‐sensations in the TSSP condition compared to the control condition
| Anatomical region |
x (R → L) |
Y (A → P) |
Z (I → S) |
k | t |
|---|---|---|---|---|---|
| Dorsal horn | −7.70 | 7.54 | −118.15 | 13 | 3.54 |
| NTS | −2.9 | 13.4 | 3.1 | 10 | 3.52 |
| NRM | −0.50 | −0.92 | 4.75 | 12 | 3.51 |
| −3.2 | −3.92 | 8.12 | 25 | 3.80 | |
| PAG | −0.67 | 3.94 | 21.35 | 51 | 3.79 |
| Thalamus | 2.25 | −10.29 | 40.71 | 31 | 3.57 |
All statistical inferences were made at P < 0.001, cluster threshold at 10 voxels. The coordinates x, y, z, refer to the absolute distance in millimeters from the pontomedullary junction relative to the midline in the R/L direction, and the anterior edge of the medulla/cord in the A/P direction, k refers to the cluster size (1 mm cubic voxels), and t is the average t value across each cluster of contiguous voxels. NRM: nucleus raphe magnus, NTS: nucleus tractus solitarius, PAG: periaqueductal gray matter.
DISCUSSION
The purpose of this study was to use fMRI to characterize the neural correlates of TSSP in the spinal cord and brainstem. All participants reported significantly greater pain to the last heat stimulus in the TSSP condition compared to the control condition; as is characteristic of the behavioural manifestation of TSSP. Paralleling the differences in pain perception, we observed greater TSSP‐related BOLD activity in the spinal cord dorsal horn, consistent with windup as previously observed in electrophysiological studies of animals. We also detected greater BOLD responses in multiple areas of the brainstem that are known to be involved in the descending modulation of pain, including the RVM and the PAG. Together, these results suggest enhanced excitability of human spinal cord neurons to TSSP and corresponding changes in descending modulation from the brainstem.
The enhanced excitability of spinal cord neurons, or “windup”, in response to successive painful stimuli was first detected using extracellular recordings in dorsal horn neurons in the spinothalamic tract, in animal preparations [Chung et al., 1979; Mendell and Wall, 1965; Wagman and Price, 1969]. The perception of TSSP reported in human behavioural studies is thought to represent the behavioural correlate of windup [Anderson et al., 2013]. The combination of fMRI and behavioural results presented here is the first demonstration of the dorsal horn response to TSSP/windup in humans. We determined that the BOLD signal changes in the DH during the repeated heat pain stimuli were significantly greater in the TSSP condition compared to the control condition (Fig. 4). Although the BOLD response time‐course in the DH does not correspond with the timing of the repeated heat pain stimuli, it closely resembles windup responses observed in spinothalamic lamina I neurons in the cat [Craig and Andrew, 2002]. Using a similar paradigm to the present study, Craig and Andrew reported that at 49°C the spinothalamic neurons responded only after 8–10 stimulation contacts [Craig and Andrew, 2002]. An estimate of the BOLD response to windup observed in the cat (based on the electrophysiological recordings by Craig and Andrew [2002], convolved with the BOLD hemodynamic response function), is strikingly similar to our observed BOLD responses in the human DH during the stimulation period (Fig. 4). This correspondence provides evidence that the spinal cord activity in the TSSP condition is consistent with windup. Furthermore, electrophysiological studies have shown that repeated stimulation with heat pulses results in a progressive suppression of C‐fibre responses [Adriaensen et al., 1984; Koltzenburg and Handwerker, 1994; Price et al., 1977] while the same stimulation results in prolonged discharges of dorsal horn neurons with each successive stimulus [Mendell and Wall, 1965; Price et al., 1971; Wagman and Price, 1969]. We therefore conclude the observed enhancement of the dorsal horn response in the TSSP condition does not simply reflect increasing peripheral input.
The fMRI response in the DH includes both ascending and descending contributions. Input from supraspinal structures is known to modulate windup [Herrero et al., 2000; Hillman and Wall, 1969] and in our study of intact humans, we expect that there is substantial modulation of the dorsal horn response to the TSSP condition by these structures. This is consistent with the BOLD responses in brainstem regions that are known to participate in pain modulation. This is further supported by the findings of Staud et al., who demonstrated that a number of brain regions respond to the TSSP paradigm [Staud et al., 2007a]. However, the time courses presented by Staud et al., differ substantially from the time‐series presented here in the dorsal horn. This is likely due to the fact that the time‐course of the DH response reflects the modulation of spinal cord activity by descending input. Additionally, we detected significant fMRI responses to after‐sensations which are sustained from the BOLD response to the heat pain stimuli. The delay in DH response to TSSP, combined with the supraspinally modulated DH response, and the response to the after‐sensations, make the fMRI response to TSSP difficult to model and predict. However, it is important to note that overall we detected greater signal changes in the DH in response to TSSP compared to the control condition, which parallels the difference in pain perception between the two conditions.
Our results demonstrate an increased recruitment of several supraspinal regions, including the RVM and PAG, which have a greater response to the TSSP condition compared to the control condition. Our results demonstrate an increased recruitment of several supraspinal regions, including the RVM and PAG, which have a greater response to the TSSP condition compared to the control condition. Both the PAG and the RVM are known to play facilitory ascending and inhibitory descending roles in determining pain perception, and the balance between these states is dynamic [Heinricher et al., 2009]. The PAG is known to be involved in a number of diverse functions, all of which seem to maintain homeostasis. These functions include emotional processing, and homeostatic and physiological processes such as cardiovascular regulation, and respiratory function. Furthermore, the role of the PAG in pain processing has been widely described. For example, several neuroimaging studies have demonstrated that the PAG is significantly more active during a distraction condition and that the activation was predictive of changes in perceived pain intensity [Tracey et al., 2002; Valet et al., 2004]. Stimuli that evoke strong negative affect responses, including both physical pain as well as viewing negative images has also been shown to elicit strong PAG activity [Buhle et al., 2013]. Recently, altered connectivity between the PAG and a number of pain‐related regions (i.e., anterior cingulate, central medial prefrontal cortex) has been demonstrated to be greater in patients with chronic low back pain, compared to controls, thereby providing evidence for impairments in descending pain modulation [Yu et al., 2014]. Recent work has demonstrated that subdivisions of this structure serve different functions; however, due to the resolution of our images, we are unable to determine precisely which subregion of the PAG is responding. The greater response of the PAG (and the RVM) shown in our results is likely due to greater ascending input from the spinal cord in response to TSSP as well as a greater engagement of the descending control mechanisms in response to the increasing pain perception.
In the TSSP condition, there is a strong response in the DH during the time period after the last heat stimulus was applied. This corresponded with the increased ratings of after‐sensations in the TSSP condition compared to the control condition, and has been described in previous psychophysical experiments [Staud et al., 2001]. Our study did not fully explore this aspect of the TSSP response, and ratings to the after‐sensations were only acquired in the training session. This was to avoid inducing movement during imaging that could confound our ability to detect changes in the BOLD signal. Pain ratings to the heat stimuli (first and last stimuli) were acquired however in both the training and fMRI sessions and there were no significant differences between these ratings. Therefore, we confidently expect that the ratings of the after‐sensations in the training session reflect what was experienced in the fMRI session. Future study designs can be optimized to increase the number of ratings of the after‐sensations, and include the acquisition of these rating in the fMRI session. Furthermore, modeling of the response to the after‐sensations is challenging because they are sustained from the stimulation response and the time taken to resolve is unknown. More work is warranted to understand the time course properties of these responses. Given that previous studies have demonstrated that the ratings of after‐sensations can be used to differentiate between control and chronic pain conditions [Staud et al., 2001], it will be important for future studies to compare the after‐sensation BOLD responses between these groups.
The aim of the current study was to characterize the spinal cord and brainstem response to the summation of second pain. We are confident that the paradigm we used elicited C‐fibre mediated second pain for the following reasons: (1) all participants qualitatively described the pain as a burning sensation, (2) the paradigm evoked after‐sensations that are reminiscent of the prolonged pain sensations intrinsic to TSSP [Staud et al., 2001; Vierck et al., 1997], and (3) we followed the paradigm used by Staud et al. [2007a,b] who were able to measure the conduction latencies of the pain response and demonstrated the paradigm induced a second pain response. Unlike Staud et al., who stimulated the foot, we were unable to measure response latencies in our study because we stimulated the thenar eminence, which does not yield easily distinguishable first and second pain responses. We selected the thenar eminence so that we would be able to capture relevant spinal cord and brainstem regions in our imaging field of view, but also because stimulation to this area has been demonstrated to primarily elicit a second pain response [Campbell and LaMotte, 1983]. We also utilized a contact heat paradigm to avoid the changes in temperature and the active cooling of the skin to the baseline temperature between heat pulses that occurs in triangular ramp paradigms [Staud et al., 2007a, 2007b]. Contact heat however, does introduce mechanical stimuli and activates mechanoreceptors in addition to heat nociceptors. However, the pressure applied to the skin was not painful, was consistently placed in the same location, and was present in both the TSSP and control conditions. We were also unable to compare 2 heat stimuli TSSP and control conditions in addition to our 11 stimuli conditions. These conditions would have enabled us to more directly compare our results to those of Staud et al., and would have provided further evidence that we were capturing a second pain response [Vierck et al., 1997]. However, due to the nature of our imaging protocol, the BOLD response to two heat stimuli would not be adequately captured.
One limitation of spinal cord and brainstem imaging is the lack of a standard, validated anatomical MRI template with the structures of the brainstem clearly outlined that can be co‐registered to functional data. Work is currently being done to address this limitation [Ullmann et al., 2014], and we have created our own normalized template using numerous anatomical references to identify the structures [Naidich et al., 2009]. We use our template as a reference to identify our areas of activity, although we recognize that these voxels are only in proximity to the anatomical structures of interest. Finally, we used an uncorrected P value to evaluate the statistical inference and a cluster thresholding procedure to control for multiple comparisons, as described previously [Poline et al., 1997]. Given that our region of interest is limited to the spinal cord/brainstem, and the number of voxels examined per region is low, this approach is relatively conservative and comparable to reports in previous studies [Brooks et al., 2008; Cohen‐Adad et al., 2009; Moffitt et al., 2005].
CONCLUSIONS
In conclusion, the results of this study are the first to characterize the neural representation of TSSP in the human spinal cord and brainstem. Our results indicate greater BOLD activity in the dorsal horn of the spinal cord reflecting perceptual differences in pain between the conditions. The timing of the BOLD responses to repeated brief stimuli corresponds with electrophysiological evidence of windup in the cat dorsal horn [Craig and Andrew, 2002]. We also found a significant TSSP‐related response in brainstem regions that we conclude reflects an engagement of the ascending and descending modulation pathways. Finally, we demonstrate a strong BOLD response to after‐sensations in the TSSP condition, which parallels the perception of sustained sensations after the last pain stimulus. Therefore, given the relationship between after‐sensations, the maintenance of windup, and central sensitization, paradigms that capitalize on these responses may be useful tools for furthering our understanding of the mechanisms that underlie chronic pain.
Supporting information
Supplementary Information
ACKNOWLEDGMENTS
We would also like to thank Don Brien for his help with acquiring the data, and Janet Mirtle‐Stroman for her help with participant recruitment. All authors confirm that they have no conflicts of interest to declare.
REFERENCES
- Adriaensen H, Gybels J, Handwerker HO, Vanhees J (1984): Suppression of C‐fiber discharges upon repeated heat stimulation may explain characteristics of concomitant pain sensations. Brain Res 302:203–211. [DOI] [PubMed] [Google Scholar]
- Anderson RJ, Craggs JG, Bialosky JE, Bishop MD, George SZ, Staud R, Robinson ME (2013): Temporal summation of second pain: Variability in responses to a fixed protocol. Eur J Pain 17:67–74. [DOI] [PMC free article] [PubMed] [Google Scholar]
- Beck AT, Steer RA, Ball R, Ranieri W (1996): Comparison of Beck depression inventories‐IA and ‐II in psychiatric outpatients. J Pers Assess 67:588–597. [DOI] [PubMed] [Google Scholar]
- Bosma RL, Stroman PW (2014a): Assessment of data acquisition parameters, and analysis techniques for noise reduction in spinal cord fMRI data. Magn Reson Imaging 32:473–461. [DOI] [PubMed] [Google Scholar]
- Bosma, RL , Stroman, PW (2014b): Spinal cord response to stepwise and block presentation of thermal stimuli: A functional MRI study. J Magn Reson Imaging 41:1318–1325. [DOI] [PubMed] [Google Scholar]
- Brooks JC, Beckmann CF, Miller KL, Wise RG, Porro CA, Tracey I, Jenkinson M (2008): Physiological noise modelling for spinal functional magnetic resonance imaging studies. Neuroimage 39:680–692. [DOI] [PubMed] [Google Scholar]
- JT Buhle, H Kober, KN Ochsner, P Mende‐Siedlecki, J Weber, BL Hughes, E Kross, LY Atlas, K McRae, TD Wager (2013): Common representation of pain and negative emotion in the midbrain periaqueductal gray. Soc Cogn Affect Neurosci 8:609–616. [DOI] [PMC free article] [PubMed] [Google Scholar]
- Campbell JN, LaMotte RH (1983): Latency to detection of first pain. Brain Res 266:203–208. [DOI] [PubMed] [Google Scholar]
- Chung JM, Kenshalo DRJ, Gerhart KD, Willis WD (1979): Excitation of primate spinothalamic neurons by cutaneous C‐fiber volleys. J Neurophysiol 42:1354–1369. [DOI] [PubMed] [Google Scholar]
- Cohen‐Adad J, Hoge RD, Leblond H, Xie G, Beaudoin G, Song AW, Krueger G, Doyon J, Benali H, Rossignol S (2009): Investigations on spinal cord fMRI of cats under ketamine. Neuroimage 44:328–339. [DOI] [PubMed] [Google Scholar]
- Craig AD, Andrew D (2002): Responses of spinothalamic lamina I neurons to repeated brief contact heat stimulation in the cat. J Neurophysiol 87:1902–1914. [DOI] [PubMed] [Google Scholar]
- Crowne DP, Marlowe D (1960): A new scale of social desirability independent of psychopathology. J Consult Psychol 24:349–354. [DOI] [PubMed] [Google Scholar]
- Dobek CE, Beynon ME, Bosma RL, Stroman PW (2014): Music modulation of pain perception and pain‐related activity in the brain, brain stem, and spinal cord: A functional magnetic resonance imaging study. J Pain Off J Am Pain Soc 15:1057–1068. [DOI] [PubMed] [Google Scholar]
- Heinricher MM, I Tavares, JL Leith, BM Lumb (2009): Descending control of nociception: Specificity, recruitment and plasticity. Brain Research Reviews 60:214–225. [DOI] [PMC free article] [PubMed] [Google Scholar]
- Herrero JF, Laird JM, Lopez‐Garcia JA (2000): Wind‐up of spinal cord neurones and pain sensation: Much ado about something? Prog Neurobiol 61:169–203. [DOI] [PubMed] [Google Scholar]
- Hillman P, Wall PD (1969): Inhibitory and excitatory factors influencing the receptive fields of lamina 5 spinal cord cells. Exp Brain Res 9:284–306. [DOI] [PubMed] [Google Scholar]
- Koltzenburg M, Handwerker HO (1994): Differential ability of human cutaneous nociceptors to signal mechanical pain and to produce vasodilatation. J Neurosci 14:1756–1765. [DOI] [PMC free article] [PubMed] [Google Scholar]
- Lang J (1993): Clinical Anatomy of the Cervical Spine. New York: Thieme Medical Publishers; pp 192. [Google Scholar]
- Lang J, Bartram CT (1982): Fila radicularia of the ventral and dorsal radices of the human spinal cord. Gegenbaurs Morphol Jahrb 128:417–462. [PubMed] [Google Scholar]
- Li J, Simone DA, Larson AA (1999): Windup leads to characteristics of central sensitization. Pain 79:75–82. [DOI] [PubMed] [Google Scholar]
- Mendell LM (1966): Physiological properties of unmyelinated fiber projection to the spinal cord. Exp Neurol 16:316–332. [DOI] [PubMed] [Google Scholar]
- Mendell LM, Wall PD (1965): Responses of single dorsal cord cells to peripheral cutaneous unmyelinated fibres. Nature 206:97–99. [DOI] [PubMed] [Google Scholar]
- Moffitt MA, Dale BM, Duerk JL, Grill WM (2005): Functional magnetic resonance imaging of the human lumbar spinal cord. J Magn Reson Imaging, 21:527–535. [DOI] [PubMed] [Google Scholar]
- Myronenko A, Song XB (2009): Image registration by minimization of residual complexity. Proc Cvpr IEEE 49–56. [Google Scholar]
- Myronenko A, Song XB (2010): Intensity‐based image registration by minimizing residual complexity. IEEE Trans Med Imaging 29:1882–1891. [DOI] [PubMed] [Google Scholar]
- Naidich THP, Delman BN, Sorensen AG, Kollias SS, Haacke EM (2009): Internal Architecture of the Brain Stem with Key Axial Sections. Duvernoy's Atlas of the Human Brain Stem and Cerebellum. New York: Springer; pp 79–82. [Google Scholar]
- Poline JB, Worsley KJ, Evans AC, Friston KJ (1997): Combining spatial extent and peak intensity to test for activations in functional imaging. NeuroImage 5:83–96. [DOI] [PubMed] [Google Scholar]
- Price DD (1972): Characteristics of second pain and flexion reflexes indicative of prolonged central summation. Exp Neurol 37:371–387. [DOI] [PubMed] [Google Scholar]
- Price DD, Hull CD, Buchwald NA (1971): Intracellular responses of dorsal horn cells to cutaneous and sural nerve A and C fiber stimuli. Exp Neurol 33:291. [DOI] [PubMed] [Google Scholar]
- Price DD, Hu JW, Dubner R, Gracely RH (1977): Peripheral suppression of first pain and central summation of second pain evoked by noxious heat pulses. Pain 3:57–68. [DOI] [PubMed] [Google Scholar]
- Rempe T, Wolff S, Riedel C, Baron R, Stroman PW, Jansen O, Gierthmuhlen J (2014): Spinal fMRI reveals decreased descending inhibition during secondary mechanical hyperalgesia. PLoS One 9:e112325. [DOI] [PMC free article] [PubMed] [Google Scholar]
- Rempe T, Wolff S, Riedel C, Baron R, Stroman PW, Jansen O, Gierthmuhlen J (2015): Spinal and supraspinal processing of thermal stimuli: An fMRI study. J Magn Reson Imaging 41:1046–1055. [DOI] [PubMed] [Google Scholar]
- Robinson ME, Wise EA, Gagnon C, Fillingim RB, Price DD (2004): Influences of gender role and anxiety on sex differences in temporal summation of pain. J Pain Off J Am Pain Soc 5:77–82. [DOI] [PubMed] [Google Scholar]
- Spielberger CD, Gorsuch RL, Lushene R, Vagg PR, Jacobs GA (1983): Manual for the State‐Trait Anxiety Inventory (STAI) (Self Evaluation Questionnaire). Palo Alto, CA: Consulting Psychologists Press. [Google Scholar]
- Sprenger C, Eippert F, Finsterbusch J, Bingel U, Rose M, Buchel C (2012): Attention modulates spinal cord responses to pain. Curr Biol 22:1019–1022. [DOI] [PubMed] [Google Scholar]
- Staud R, Vierck CJ, Cannon RL, Mauderli AP, Price DD (2001): Abnormal sensitization and temporal summation of second pain (wind‐up) in patients with fibromyalgia syndrome. Pain 91:165–175. [DOI] [PubMed] [Google Scholar]
- Staud R, Price DD, Robinson ME, Mauderli AP, Vierck CJ (2004): Maintenance of windup of second pain requires less frequent stimulation in fibromyalgia patients compared to normal controls. Pain 110:689–696. [DOI] [PubMed] [Google Scholar]
- Staud R, Price DD, Fillingim RB (2006): Advanced continuous‐contact heat pulse design for efficient temporal summation of second pain (windup). J Pain Off J Am Pain Soc 7:575–582. [DOI] [PubMed] [Google Scholar]
- Staud R, Craggs JG, Robinson ME, Perlstein WM, Price DD (2007a): Brain activity related to temporal summation of C‐fiber evoked pain. Pain 129:130–142. [DOI] [PMC free article] [PubMed] [Google Scholar]
- Staud R, Robinson ME, Price DD (2007b): Temporal summation of second pain and its maintenance are useful for characterizing widespread central sensitization of fibromyalgia patients. J Pain Off J Am Pain Soc 8:893–901. [DOI] [PMC free article] [PubMed] [Google Scholar]
- Stroman PW, Bosma RL, Tsyben A (2012): Somatotopic arrangement of thermal sensory regions in the healthy human spinal cord determined by means of spinal cord functional MRI. Magn Reson Med 68:923–931. [DOI] [PubMed] [Google Scholar]
- Sullivan MJL, Bishop SR, Pivik J (1995): The Pain Catastrophizing Scale: Development and validation. Psychol Assess 7:524–532. [Google Scholar]
- Talairach J, Tournoux P. (1988) Co‐planar Sterotaxic Atlas of the Human Brain. New York: Thieme Medical Publishers Inc. [Google Scholar]
- I Tracey, A Ploghaus, JS Gati, S Clare, S Smith, RS Menon, PM Matthews (2002): Imaging attentional modulation of pain in the periaqueductal gray in humans. J Neurosci 22:2748–2752. [DOI] [PMC free article] [PubMed] [Google Scholar]
- Ullmann E, Pelletier Paquette JF, Thong WE, Cohen‐Adad J (2014): Automatic labeling of vertebral levels using a robust template‐based approach. Int J Biomed Imaging 2014:719520. [DOI] [PMC free article] [PubMed] [Google Scholar]
- M Valet, T Sprenger, H Boecker, F Willoch, E Rummeny, B Conrad, P Erhard, TR Tolle (2004): Distraction modulates connectivity of the cingulo‐frontal cortex and the midbrain during pain—an fMRI analysis. Pain 109:399–408. [DOI] [PubMed] [Google Scholar]
- Vierck CJJ, Cannon RL, Fry G, Maixner W, Whitsel BL (1997): Characteristics of temporal summation of second pain sensations elicited by brief contact of glabrous skin by a preheated thermode. J Neurophysiol 78:992–1002. [DOI] [PubMed] [Google Scholar]
- Wagman IH, Price DD (1969): Responses of dorsal horn cells of M. mulatta to cutaneous and sural nerve A and C fiber stimuli. J Neurophysiol 32:803–817. [DOI] [PubMed] [Google Scholar]
- Wheeler‐Kingshott CA, Stroman PW, Schwab JM, Bacon M, Bosma R, Brooks J, Cadotte DW, Carlstedt T, Ciccarelli O, Cohen‐Adad J, Curt A, Evangelou N, Fehlings MG, Filippi M, Kelley BJ, Kollias S, Mackay A, Porro CA, Smith S, Strittmatter SM, Summers P, Thompson AJ, Tracey I (2014): The current state‐of‐the‐art of spinal cord imaging: Applications. Neuroimage 84:1082–1093. [DOI] [PMC free article] [PubMed] [Google Scholar]
- Williams PL, BL, Berry MM, Collins P, Dyson M, Dussek JE, Ferguson MWJ (1995): Gray's Anatomy: The Anatomical Basis of Medicine and Surgery. New York: Churchill‐Livingstone; pp 975–1011. [Google Scholar]
- Woolf CJ, Salter MW (2000): Neuronal plasticity: Increasing the gain in pain. Science 288:1765–1769. [DOI] [PubMed] [Google Scholar]
- Worsley KJ, Friston KJ (1995): Analysis of fMRI time‐series revisited: Again. NeuroImage 2:173–181. [DOI] [PubMed] [Google Scholar]
- R Yu, RL Gollub, R Spaeth, V Napadow, A Wasan, J Kong (2014): Disrupted functional connectivity of the periaqueductal gray in chronic low back pain. NeuroImage Clinical 6:100–108. [DOI] [PMC free article] [PubMed] [Google Scholar]
Associated Data
This section collects any data citations, data availability statements, or supplementary materials included in this article.
Supplementary Materials
Supplementary Information