

ABSTRACT
Traumatic brain injury (TBI) is a common combat injury, often through explosive blast, and produces heterogeneous brain changes due to various mechanisms of injury. It is unclear whether the vulnerability of white matter differs between blast and impact injury, and the consequences of microstructural changes on neuropsychological function are poorly understood in military TBI patients. Diffusion tensor imaging (DTI) techniques were used to assess the neurocircuitry in 37 US service members (29 mild, 7 moderate, 1 severe; 17 blast and 20 nonblast), who sustained a TBI while deployed, compared to 14 nondeployed, military controls. High‐dimensional deformable registration of MRI diffusion tensor data was followed by fiber tracking and tract‐specific analysis along with region‐of‐interest analysis. DTI results were examined in relation to post‐concussion and post‐traumatic stress disorder (PTSD) symptoms. The most prominent white matter microstructural injury for both blast and nonblast patients was in the frontal fibers within the fronto‐striatal (corona radiata, internal capsule) and fronto‐limbic circuits (fornix, cingulum), the fronto‐parieto‐occipital association fibers, in brainstem fibers, and in callosal fibers. Subcortical superior‐inferiorly oriented tracts were more vulnerable to blast injury than nonblast injury, while direct impact force had more detrimental effects on anterior‐posteriorly oriented tracts, which tended to cause heterogeneous left and right hemispheric asymmetries of white matter connectivity. The tractography using diffusion anisotropy deficits revealed the cortico‐striatal‐thalamic‐cerebellar‐cortical (CSTCC) networks, where increased post‐concussion and PTSD symptoms were associated with low fractional anisotropy in the major nodes of compromised CSTCC neurocircuitry, and the consequences on cognitive function were explored as well. Hum Brain Mapp 35:2652–2673, 2014. © 2013 Wiley Periodicals, Inc.
Keywords: traumatic brain injury, diffusion tensor imaging, blast injury, concussion, post‐traumatic stress disorder, neurocircuitry
INTRODUCTION
Traumatic Brain Injury (TBI) is a common combat injury, frequently through blast, in Operation Enduring Freedom in Afghanistan and Operation Iraqi Freedom (OIF/OEF), with mild TBI (mTBI) being the most common among this group [Taber et al., 2006; Warden, 2006]. In the civilian population the majority of TBI incidents are due to automobile accidents and falls [Langlois et al., 2006] while blast‐induced TBI (bTBI) is the signature brain injury for combat troops in the military [Ling et al., 2009]. TBI can be classified according to the type of injury, (closed or blunt vs. open or penetrating), and the severity of brain trauma (mild, moderate, severe). The presence and severity of closed TBI depends on the presence and duration of loss of consciousness (LOC), loss of memory preceding or following injury (amnesia), alteration in mental status at the time of injury, and/or focal neurological deficit [Adams et al., 1989]. Blast‐induced TBI is categorized by injuries resulting from the different physical aspects of the blast phenomenon [Cernak, 2010; Chen et al., 2009]: primary bTBI is from the shockwave; secondary bTBI is from the displacement of the person; tertiary bTBI is from objects striking the person as the result of the blast wind; and quaternary bTBI covers the remaining mitigating factors, including the thermal properties of the blast [Chen et al., 2009]. Blast‐induced TBI can manifest at all levels of severity and types of injury, with the level of bTBI severity based primarily on the duration of altered mental status. For instance, mild bTBI is associated with transient alteration of consciousness or brief LOC (less than 5 minutes) [Ling et al., 2009].
Traumatic axonal injury (TAI) [Kumar et al., 2009; Langlois et al., 2006; Parizel et al., 1998] conventionally refers to white matter damage arising from torsional forces generated by the sudden rotational acceleration/deceleration forces of an impact head injury [Hardman and Manoukian, 2002; Parizel et al., 1998; Parizel et al., 2005; Shaw, 2002]. However, more recent results from experimental studies using animal models of blast exposure have demonstrated that direct blast shockwave is capable of penetrating the calvarium [Chavko et al., 2007] and can induce high strain rates leading to structural deficits such as axonal membrane disruption [Connell et al., 2011], myelin disruption, and neuronal death [Cernak et al., 2004, 2001; Saljo et al., 2002]. Other hypotheses such as pressure wave transfer via the great vessels of the circulatory system (the rippling effect) have been proposed as mechanisms to inflict white matter deformation and to cause secondary systemic tissue response of blast injury [Bhattacharjee, 2008; Cernak, 2010]. Furthermore, it is becoming apparent that there may be differences in disease progression and symptomatology [Kennedy et al., 2010] between impact‐ and blast‐related TBI [French, 2010; Mac Donald et al., 2011]. TAI is considered to be responsible for the majority of TBI‐related neurocognitive deficits [Kocsis and Tessler, 2009; Okie, 2005] and may account for the poor outcomes noted in a relatively small numbers of mild TBI cases [Messe et al., 2011]. However, these microstructural white matter lesions are not apparent using conventional neuroimaging techniques [Inglese et al., 2005; Scheid et al., 2003].
Diffusion tensor imaging (DTI) measures the diffusion behavior of water molecules and is sensitive to differences related to the microstructure of brain nerve tissues. DTI yields estimates of the main direction of axon fibers with reasonably good spatial resolution [Basser and Jones, 2002; Basser et al., 1994; Pierpaoli et al., 1996]. DTI provides a unique insight into the microstructure of numerous tissues. Within the brain, DTI can be used to quantify an index of white matter integrity and extract white matter features for visualization, for example, tractography [Basser et al., 2000]. Neuronal tissue is a fibrillar structure consisting of highly oriented and tightly packed axons that are surrounded by glial cells. Thus, the organized bundles of neuronal tissue restrict the movement of water molecules on a micrometric scale to a greater extent in the direction perpendicular (radial diffusivity) than parallel (parallel diffusivity) to the axonal orientation. Several recent studies have investigated the role of diffusion MR and shown promising results in detecting microstructural changes in mild TBI [Kasahara et al., 2012; Matsushita et al., 2011; Mayer et al., 2010]. Most of the studies evaluated TBI subjects (sub)acutely after injury or at chronic periods. The brain structures that are vulnerable to this type of injury are mainly the brainstem and the corpus callosum (CC), both regions with highly anisotropically oriented axons [Cloots et al., 2013]. The white matter tracts that tend to show abnormal DTI measures in TBI are long association fibers of fronto‐parieto‐temporal pathways such as superior and inferior longitudinal fasciculus, uncinate fasciculus, anterior corona radiata, projection fibers of the fronto‐limbic network such as cingulum bundle and fornix, and the inter‐hemispheric connection, i.e. genu and splenium of corpus callosum [Niogi and Mukherjee, 2010 for review]. However, one recent study failed to find a significant group difference of DTI metrics between mild/moderate bTBI patients and controls [Levin et al., 2010]. This discrepancy is likely due to the heterogeneous mechanisms of injury of military‐related TBI. However, there is a paucity of knowledge on whether the vulnerability of white matter after injury is different between blast‐ and impact‐related TBI, and how the consequences of microstructural changes affect neuropsychological function in military TBI patients.
The objectives of this study are to: (1) assess the structural connectivity changes from military‐related TBI using DTI and MRI diffusion tractography; (2) identify different microstructural changes between blast and impact (nonblast) TBI; and (3) evaluate white matter microstructural changes and their associations with neuropsychological functions/symptoms in TBI patients. We hypothesize that the fibers of fronto‐parieto‐temporal and inter‐hemispheric pathways are vulnerable to injury in military‐related operations, that blast TBI has relatively broad or more heterogeneous distribution of white matter abnormalities compared to direct impact TBI, and that the compromised neurocircuitry has significant effects on the neuropsychological functions of military TBI patients.
MATERIALS AND METHODS
This study was approved by the Institutional Review Board of The Walter Reed Army Medical Center (WRAMC), Washington, D.C. Written informed consent was obtained from all the subjects before participation.
Participants
Thirty‐seven (37) TBI participants (male/female = 29/8, mean age ± standard deviation = 28.2±6.1 years, blast/nonblast = 17/20), who were active duty US military personnel and had been diagnosed with TBI based on the clinical indications [Adams et al., 1989], were recruited into the study and treated at WRAMC between May 2009 and June 2011, following medical evacuation from the OIE/OEF combat theater for their injuries. All patients had sustained a blast‐ or nonblast‐related injury and agreed to the use of their clinical and neuroimaging data for research purposes. The presence of a “blast‐related” injury was defined as a TBI that occurred in which a blast was the cause of the injury (e.g., an explosion causing a vehicle crash; a blast causing one to fall over and strike his head). Although blast was an important component of injury in all of the “blast” cases, these were not primary blast cases and mechanical mechanisms (e.g., motor vehicle accident, fall) were involved in each. Nonblast TBI cases did not have an element of blast involved.
In the majority of cases of mild TBI, extracranial injuries had necessitated evacuation rather than the mild TBI per se. Post‐hoc diagnosis of TBI was based on a routine comprehensive clinical screening evaluation undertaken by medical/health‐care professionals at WRAMC, usually several weeks or months following the injury. As part of the standard clinical pathway, all patients treated at WRAMC who are considered to be “at risk” for TBI undertake a TBI evaluation. A low threshold is purposely used to classify patients “at risk” for TBI. Typically, patients are considered “at risk” for TBI if they sustained an injury to any part of their body above the shoulders during a battle or nonbattle related event, or are injured in any way by an event such as a blast, assault, motor vehicle accident, or fall. For the large majority of patients, these evaluations are completed by a Physician's Assistant who is trained to evaluate the presence and severity of TBI. In some cases, evaluations are also completed by other health‐care professionals such as Neuropsychologists, Social Workers, and Nurses who have specialty training to evaluate TBI. TBI evaluations typically include (a) a patient interview, (b) a comprehensive medical chart review [including the review of in‐theater medical records when available], (c) case conferencing, and (d) family interview and gathering of other collateral information (if available). Diagnosis of TBI is based on the presence and duration of LOC, presence and duration of post‐traumatic amnesia (PTA), duration of alteration of consciousness, and neuroradiological scans. Self‐reported symptoms are routinely obtained during the TBI evaluation but are not used for diagnostic or classification purposes.
Twenty‐nine (29) of the TBI patients were diagnosed as mild TBI, seven (7) as moderate, and one (1) as severe TBI based on duration of LOC, duration of PTA, alteration in mental status at the time of injury, and presence of focal neurological deficit. However, Glasgow Coma Scale (GCS) scores were not generally available, and the available information regarding LOC was limited to categorical data, i.e. LOC < 15 min or LOC 16–60 min. TBI severity was based on standard DoD/VA criteria, i.e., mild TBI as alteration of consciousness and LOC (if present)< 30 min or PTA less than 24 h and no radiologic abnormalities noted on conventional imaging; moderate TBI as positive neuroimaging findings or PTA > 24 h, or LOC > 30 min; and severe TBI involved PTA greater than one week or LOC > 1 day. Twenty (20) of the patients had blast injuries, caused by either improvised explosive device (IED) or rocket attacks. Two patients had multiple episodes of blast injury resulting in mild TBI. The days elapsed since injury ranged from 21 to 1,860 days (all TBI: mean days ± standard deviation = 334.5 ± 503.8 days, median = 88 days; nonblast TBI: 224.9±346.1 days, median = 88 days; blast TBI: 427.7 ± 600.1 days, median = 106 days) with the majority (19 out of 37 TBI participants) injured within 3 months of when the MRI scan was acquired. Among the TBI participants, one patient was diagnosed with social phobia and another patient with claustrophobia. Ten patients had other psychiatric symptoms and problems such as anxiety, depression, and suicidal ideation; among them, five had been diagnosed with comorbid post‐traumatic stress disorder (PTSD), anxiety, and/or depression.
Fourteen (14) healthy controls (HC) were also recruited (male/female = 10/4, mean age ± standard deviation = 26.3 ± 5.2 years), who were military personnel on active duty but had not been previously deployed. Handedness information was only available for 25 TBI participants, who were all right handed.
MR Acquisition
MR Imaging was performed on a 3T 750 MRI scanner (General Electric, Milwaukee, WI) with a 32‐channel head coil. In addition to diffusion‐weighted imaging (DWI), a series of MRI data, including structural MRI, dynamic contrast susceptibility, fMRI, and MR spectroscopic imaging, was acquired for about ninety minutes for all of the participants. DWI was acquired by using a single shot echo planar imaging (EPI) sequence with slice‐selection gradient reversal and peripheral cardiac‐gating (TR/TE ∼ 10,000/90 ms, FOV= 256 x 256 mm2, matrix = 128 x 128, voxel size 2 x 2 x 2 mm3, b = 1,000 s/mm2, 48 noncollinear diffusion gradient directions plus 7 volumes of nondiffusion weighted (b0) evenly distributed among diffusion‐weighted volumes).
Post‐Concussion and PTSD Symptoms
Among the 37 TBI patients, 24 (64.9%) had completed the Neurobehavioral Symptom Inventory (NBSI) [Cicerone and Kalmar, 1995] and PTSD Check List‐Civilian Version (PCLC) [Blanchard et al., 1996] at the time of enrollment/MR scan in the study. The NBSI [Cicerone and Kalmar, 1995] is a 22‐item self‐report of post‐concussion symptoms, including the severity/presence of headache, balance problems, nausea, fatigue, sensitivity to noise, irritability, sadness, nervousness, visual problems, and difficulty concentrating and remembering. The NBSI is scored on a 5‐point scale as follows: 0 = none, 1 = mild, 2 = moderate, 3 = severe, and 4 = very severe. Three cluster scores were also generated for somatic/sensory (NBSIsom; range, 0–44), cognitive (NBSIcog; range, 0–16), affective (NBSIaff; range, 0–28) on the basis of factor analysis [Caplan et al., 2010]. The PCLC [Blanchard et al., 1996] is a 17‐item self‐report measure of PTSD symptoms, designed specifically to address Category B, C, and D symptom criteria of the DSM‐IV (1994) for PTSD, and to rate the presence and severity of each symptom on a 5‐point scale as follows: 1 = not at all, 2 = a little bit, 3 = moderately, 4 = quite a bit, and 5 = extremely. Three cluster scores can be generated based on DSM‐IV Category B (re‐experiencing cluster (PCLCb); range, 5–25), Category C (avoidance cluster (PCLCc); range, 7–35), and Category D (hyperarousal cluster (PCLCd); range, 5–25) criteria.
Neuropsychological Testing
Neuropsychological measures were selected from a larger neurocognitive test battery designed to provide objective documentation of cognitive and emotional functioning. Measures included the Automated Neuropsychological Assessment Metrics (ANAM) [Reeves et al., 2007], the Wechsler Adult Intelligence Scale‐Third Edition (WAIS‐III) [Wechsler, 1997a,b], the Wechsler Test of Adult Reading (WTAR, The Psychological Corporation, 2001), Delis‐Kaplan Executive Function System (D‐KEFS) [Delis et al., 2001], the Continuous Performance Test‐Second Edition (CPT‐II) [Conners, 2002], the California Verbal Learning Test‐Second Edition (CVLT‐II) [Delis et al., 2000], The ANAM test includes the subtests of Simple Reaction Time, Sternberg Procedure, Mathematical Processing, Spatial Processing, Matching to Sample, Code Substitution–Learning and Code Substitution–Delayed subtests [Reeves et al., 2007]. WAIS‐III includes the subtests of Digit Symbol, Block Design and Symbol Search. D‐KEFS includes the subtests of Verbal Fluency, Twenty Questions Test and Prover Test. CPT‐II includes the subtests of Omissions, Commissions, Hit Reaction Time, Variability, Detectability, Response Style, and Perseverations. CVLT includes the subtests of Immediate Recall and Delayed Recall. CPT‐II T scores were obtained from the computer‐generated report based on age and gender norms [Conners, 2002]. Scaled D‐KEFS (with a mean of 10 and a standard deviation of 3), ANAM Throughput (Percent Correct divided by Mean Reaction Time), the demographic predicted WTAR and WAIS‐III, and CVLT‐II raw scores were used for correlation analysis. To control for level of effort applied to neuropsychological testing, the Test of Memory Malingering (TOMM) (Tombaugh, 1996) was administered as a part of neuropsychological batteries and only data with negative response bias, using the specified cut‐offs of greater than 45 of TOMM Trial 1 [O'Bryant et al., 2008], were included.
DTI Processing and Analysis
Preprocessing
Preprocessing of DTI data included correction of motion and eddy current artifacts and digital brain extraction (skull stripping) using software from the FSL toolkits (http://www.fmrib.ox.ac.uk/fsl) [Smith et al., 2004]. A mean nondiffusion (b0) image was created by selecting the temporally central b0 image volume, and aligning the other six b0 images to it using rigid body transformation. The diffusion‐weighted images were then aligned to the mean b0 image using FLIRT's affine transformation [Jenkinson et al., 2002] with 12 degrees of freedom (DOF) to correct for subject head motion and the effects of eddy currents. Diffusion gradient directions were modified and adjusted simultaneously according to the transformation. The brain was then extracted from the mean b0 image using BET [Smith, 2002] to define the brain, and then removing or masking out nonbrain tissue in each of the DWI 3D volumes. Single tensor reconstruction using a simple least squares fit was calculated in order to create DTI scalar images, including fractional anisotropy (FA), trace (the sum of three eigenvalues), and the tensor eigenvalues describing parallel diffusivity (i.e., the main eigenvalue, λ||) and the radial diffusivity (λ⊥, the mean of two minor eigenvalues).
Voxel‐wise analysis of diffusion metrics
Spatial normalization of whole brain DTI metrics was carried out by using high‐dimensional tensor‐based image registration (DTI‐TK, http://www.nitrc.org/projects/dtitk) [Zhang et al., 2005]. The high‐dimensional approach generated a population‐specific template from the study cohort (TBI patients and controls), which was created by symmetrically normalizing and diffeomorphically deforming diffusion tensor images with explicit optimization of tensor orientation [Zhang et al., 2005]. Each individual diffusion tensor image was then normalized to the population‐specific tensor template. In short, several steps, including resampling, smoothing, warping, and registration of diffusion tensor images, were implemented by matching the orientation of the underlying fiber bundle at each voxel to ensure the alignment of white matter tracts. Finally, the population‐specific template was transformed to the IIT2 DTI human template (http://www.nitrc.org/projects/iit2/) [Zhang et al., 2011], which was reconstructed using the same high‐dimensional nonlinear registration algorithms [DTI‐TK, Zhang et al., 2005] and has been demonstrated to be more accurately matched with tensor characteristics in the ICBM‐152 template space than the other existing tensor templates [Mori et al., 2008; Peng et al., 2009]. The aligned individual tensor images in the initial population template space were warped to the final population template in ICBM‐152 space, and the spatially normalized FA, trace, λ||, and λ⊥ images were reconstructed for subsequent whole brain voxel‐wise analyses. To perform tract‐specific statistical mapping analysis, deformable geometric medial models were used to model the continuous medial representations (cm‐reps) of individual sheet‐like white matter structures [Yushkevich et al., 2008]. Under the framework of modeling average tensor‐based features along directions perpendicular to the tracts using cm‐reps, a generic atlas of six major white matter tracts [Yushkevich et al., 2008] was used for the spatial normalization of white matter tracts and tract‐specific statistical analysis across all participants. The six major fiber tracts include the corpus callosum, bilateral cortico‐spinal tracts, inferior longitudinal fasciculi, superior longitudinal fasciculi, inferior fronto‐occipital fasciculi, and uncinate fasciculi.
For whole brain spatial analysis, voxel‐wise analyses of diffusion metrics across the group of study participants were carried out only on the voxels with FA ≥ 0.20, in order to avoid gray matter, which typically has FA between 0.1–0.2 [Mori and van Zijl, 2002] and to minimize mis‐registration. The images of spatially normalized whole brain DTI metrics reconstructed using high‐dimensional tensor warping (DTI‐TK) were smoothed (sigma=2, approximately FWHM = 4.6 mm) before statistical analysis. The JHU‐MNI‐ss atlas [Oishi et al., 2009], after co‐registering to the final population template, was used to map and label the anatomic locations of white matter “lesions” in TBI patients for further region‐of‐interest (ROI) analyses (see below).
To evaluate differences of the asymmetries of injury extent, tract‐based spatial statistics (TBSS) [Smith et al., 2006] was used to generate symmetric mean skeletonized FA and hemispheric asymmetry FA skeleton images to test for asymmetries in diffusion characteristics between blast TBI and nonblast TBI. In brief, the symmetrized mean FA image, after left‐right flipping and averaging, was skeletonized and dilated to ensure that only the skeleton voxels close to being symmetric were used for hemispheric analysis. This flipped skeleton FA was masked with the nonflipped skeleton FA to create a symmetrized skeleton FA. The distance map and the mean skeleton FA mask were then calculated. To avoid mis‐coregistration, the aligned FA images were then projected onto the symmetrized skeleton FA using nonlinear transformation [Andersson et al., 2007], which was then left‐right flipped and subtracted from the former to calculate the hemispheric asymmetry images. Voxel‐wise analysis was performed on the skeletonized hemispheric asymmetry images to test whether the hemispheric asymmetry skeleton FA was significantly different between groups.
Tractography
For deterministic tractography [Mori et al., 1999], we used the tensor line techniques [Lazar et al., 2003] to propagate trajectories from the defined seed voxels. The seed regions, in this case clusters with the voxels identified from the results of voxel‐wise analysis where the mean FA was significantly different between TBI and HC, were used to reconstruct the compromised fiber tracts and to evaluate possible fiber “breaks” in TBI patients. Fiber tracking was performed in the template space where the significant group differences of DTI metrics were identified. The termination criteria were set at maximum angular deviation of 65° [Mukherjee et al., 2008] and minimum voxel FA threshold of 0.2 without specifying the waypoint masks.
Statistical Analyses
All statistical analyses of whole brain voxel‐wise analyses were performed on 1 mm3 isotropic voxels using standard neuroimaging analysis packages (FSL: http://www.fmrib.ox.ac.uk/fsl or AFNI: http://www.afni.nimh.nih.gov/afni). The summary statistics (Table 1) and the regions of interest analysis were carried out using SAS (Cary, NC, version 9.1).
Table 1.
Demographics, injury severity characteristics, and descriptive statistics of post‐concussion from the Neurobehavioral Symptom Inventory (NBSI), and PTSD symptoms from the PTSD Check List‐Civilian Version (PCLC)
| Healthy controls N=14 (10 males) | Traumatic brain injury | |||
|---|---|---|---|---|
| N = 37a (29 males) | ||||
| Mild | Moderate | Severe | ||
| N = 29 | N = 7 | N = 1 | ||
| Age [years] | 26.3 ± 5.2 | 28.2 ± 6.1 | ||
| 28.1 ± 5.6 | 25.7 ± 2.6 | 48 | ||
| Education [years] | 13.8 ± 1.8 | |||
| 13.8 ± 1.9 | 14.0 ± 1.6 | 18 | ||
| Days post injury [days] | _ | 334.5 ± 503.8 | ||
| 405.0 ± 548.8 | 54.0 ± 24.3 | 255 | ||
| NBSI, total | _ | 15.8 ± 11.3 | ||
| 18.9 ± 11.8 | 9.2 ± 7.3 | 9 | ||
| NBSI, somatic/sensory | _ | 6.4 ± 4.9 | ||
| 7.4 ± 5.3 | 3.2 ± 2.4 | 5 | ||
| NBSI, cognitive | _ | 6.9 ± 5.1 | ||
| 8.4 ± 5.4 | 4.8 ± 4.4 | 1 | ||
| NBSI, affective | _ | 4.3 ± 3.2 | ||
| 5.1 ± 3.4 | 2.6 ± 2.3 | 4 | ||
| PCLC, total | _ | 36.1 ± 12.8 | ||
| 37.8 ± 12.3 | 28.8 ± 8.2 | 27 | ||
| PCLC, re‐experiencing | _ | 9.3 ± 4.5 | ||
| 9.3 ± 3.8 | 7.6 ± 3.3 | 5 | ||
| PCLC, avoidance | _ | 14.7 ± 6.1 | ||
| 15.8 ± 6.2 | 10.8 ± 3.9 | 17 | ||
| PCLC, hyperarousal | _ | 12.1 ± 4.6 | ||
| 12.8 ± 4.4 | 10.4 ± 4.6 | 5 | ||
Twenty‐four TBI patients had available scores for education years, NBSI and PCLC.
Group comparisons of whole brain voxel‐wise and region‐of‐interest analyses of DTI measures
General linear model (GLM) analyses evaluated the local group differences, i.e. the level of two groups (HC vs. TBI) or the level of three groups (HC vs. blast TBI vs. nonblast TBI) of measured FA, trace, λ|| and λ⊥values across the whole white matter tracts after regressing out the effects of age and gender. Permutation methods [Nichols and Holmes, 2002] implemented in the FSL package were applied for thresholding on the t‐statistic maps by using cluster size inference to correct for multiple comparisons. Specifically, we used threshold‐free cluster enhancement (TFCE) approaches [Smith and Nichols, 2009] and cluster size inference (randomize and cluster in FSL) to correct for multiple comparisons with controlled family‐wise error (FWE) rate at 5% (P ≤ 0.05 corrected) based on the calculated t‐statistic images.
To evaluate the extent of potential white matter lesions across TBI participants, the Z‐score FA images, calculated by subtracting the mean FA of controls and dividing by the FA standard deviation of total participants, were reconstructed for all spatially normalized voxels. Only those clusters containing voxels with |Z| > 3.5 and with a cluster size of 50 voxels (50 mm3) or more were considered abnormal. Generalized linear models with Poisson response probability distribution (GENMOD in SAS) were applied to evaluate the differences of the normalized volumes which displayed abnormally low FA between blast TBI and nonblast TBI within the white matter regions labeled by the DTI white matter atlas (JHU‐MNI‐ss atlas) [Oishi et al., 2009]. Lateralization indices (L.I.) [Thiebaut de Schotten et al., 2011], defined as
| (1) |
where FAL = volume of low FA in left hemisphere, and FAR = volume of low FA in right hemisphere, were also calculated to evaluate possible differences of the asymmetries of injury extent between blast TBI and nonblast TBI. Statistical significance was inferred for P ≤ 0.05 after correcting multiple comparisons using the Holm‐Bonferroni method for ROI analysis.
Associations between post‐concussion and PTSD symptoms, time post‐injury, neuropsychological measures and DTI measures
The relationships were evaluated between FA and measures of post‐concussion disorder, PTSD symptoms and cognitive function in the TBI patients completing NBSI and/or PCLC self reports (18 mild, 5 moderate, 1 severe) and neuropsychological testing (17 mild, 5 moderate, 1 severe), after accounting for age and gender. For voxel‐wise analysis, statistical inference P‐values were corrected using cluster size inference with random field theory (RFT) [Worsley et al., 1996] (Monte Carlo with AlphaSim in AFNI) to correct for multiple comparisons implemented in AFNI, where those voxels were part of a spatially continuous cluster size of 120 isotropic 1 mm3 voxels or more for the whole brain FA images, and of 22 voxels or more for the skeletonized FA images (corrected P ≤ 0.05). A partial Pearson statistic was used to test for any correlations between neuropsychological testing and FA in the ROIs (N = 76) in the TBI patients. In this, the Holm‐Bonferroni correction was used to correct for multiple comparisons (corrected P ≤ 0.05).
RESULTS
Participant Demographics
Table 1 lists demographics of the participants, and injury severity characteristics and descriptive summary of NBSI and PCLC scores. Age and gender did not differ significantly between groups (HC vs TBI), nor did NBSI or PCLC scores vary between blast TBI and nonblast TBI subgroups. The proportional injury severities were similar between blast (16/20 mild, 4/20 moderate, 0/20 severe) and nonblast TBI (13/17 mild, 3/17 moderate, 1/17 severe) subgroups. However, the total scores of NBSI (including NBSIaff, NBSIsom) and PCLC (including PCLCb) were significantly higher in mild TBI compared with moderate TBI (P < 0.05).
Group Comparisons (HC vs. TBI, Blast TBI vs. Nonblast TBI) of Diffusion Measures
Voxel‐wise analysis of diffusion metrics
The low FA clusters identified through HC vs. TBI comparison were used as seeds or starting points to reconstruct tracts from the calculated mean tensor of the population. Figure 1 shows the significant clusters of diffusivity measures obtained from group comparisons using tensor warping (DTI‐TK) (Fig., 1A–C), and fiber tracking using the low FA clusters as seeds (Fig. 1D).
Figure 1.
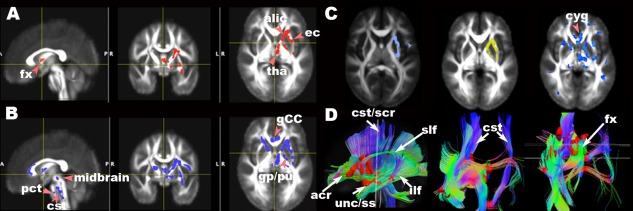
Maps of significant group differences of voxel‐wise analyses of FA (A (FWE=5%, TFCE P ≤ 0.05), B (FWE=5%, TFCE P ≤ 0.06)), trace (C left (light blue, FWE=5%, c > 2.3, P ≤ 0.05)), radial diffusivity (C middle (yellow, FWE=5%, c > 2.5, P ≤ 0.05)), and parallel diffusivity (C right (blue uncorrected P ≤ 0.05)) and reconstructed tracts (D) using lower FA (A) as seeds in axial, sagittal and coronal views overlaid on the mean FA template (1 × 1 × 1 mm3). acr, anterior region of corona radiata; alic, anterior limb of internal capsule; bCC, body of corpus callosum; cst, corticospinal tract in brainstem; cyg, cingulum; gp, globus pallidus; pu, putamen; ec, external capsule; fx, fornix; ilf, inferior longitudinal fasciculus; pct, pontine crossing tracts; scr, superior region of corona radiata; slf, superior longitudinal fasciculus; ss, sagittal stratum, including inferior longitudinal fasciculus and inferior fronto‐occiptal fasciculus; tha, thalamus; unc, uncinate fasciculus.
Fractional anisotropy
Using high dimensional tensor warping for voxel‐wise analyses, TBI as a group had significantly lower FA than HC in regions in the following white matter fiber tracts: left anterior limb of internal capsule, posterior limb of internal capsule, anterior corona radiata, superior corona radiata, external capsule, superior fronto‐occipital fasciculus, thalamus, globus pallidus, putamen, fornix, superior longitudinal fasciculus, uncinate fasciculus, sagittal stratum (including inferior longitudinal fasciculus and inferior longitudinal fasciculus), and brainstem (Fig. 1A). The FA mean and standard deviation of significant clusters found by using tensor warping (TFCE P ≤ 0.05) were 0.38 ± 0.02 for HC and 0.33±0.02 for TBI, respectively (effect size = 1.22). Figure 1A shows the significant voxels of FA group differences in white matter tracts using TFCE corrected at 5% family‐wise error (FWE) (df = 47) overlaid on the normalized mean FA image in select axial and sagittal sections (Fig. 1A, P ≤ 0.05). When the threshold of significance was made less stringent to P ≤ 0.06, more symmetric regions were revealed in both hemispheres (Fig. 1B). Bilaterally symmetrical clusters were revealed in the genu of corpus callosum, cortico‐spinal tract at the level of midbrain, and pontine crossing tracts (Fig. 1B, P ≤ 0.06).
Trace, axial diffusivity (λ| |) and radial diffusivity (λ⊥)
Using DTI‐TK, the TBI sample showed higher trace and radial diffusivity than HC at about the same locations where TBI showed lower FA values. The means of trace and their standard deviations of the significant clusters were 2.25 ± 0.07 (HC) vs. 2.34 ± 0.06 (TBI) (effect size = 1.17) (P ≤ 0.05, c > 2.3, df = 47) (Fig. 1C left). The means of λ⊥ and their standard deviations of the significant clusters were 0.59 ± 0.03 (HC) vs. 0.63 ± 0.02 (TBI) (effect size =1.2) (P ≤ 0.05, c > 2.3, df = 47) (Fig. 1C middle). However, TBI tended to have higher λ || than HC (1.06 ± 0.02 (HC) vs. 1.10 ± 0.02 (TBI), effect size = 1.36, uncorrected P ≤ 0.05) at similar regions where FA, trace and λ⊥were different between TBI and HC (Fig. 1C right).
Fiber tracking using low FA seeds
Using the low FA clusters identified by the tensor warping method (DTI‐TK) as the seed masks, the reconstructed fiber tracts interconnect the critical nodes of the pathways of cortico‐striatal‐thalamic‐cerebellar‐cortical (CSTCC) [Alexander et al., 1986] circuit (a part of the fronto‐striatal circuit) [Blumberg, 2007; Sheline, 2003], fronto‐limbic circuit, and the pyramidal (corticobulbar and corticospinal) tracts of motor systems (Fig. 1D). Upon categorizing the level of disease characteristics into three groups, the nonblast TBI group had lower FA clusters than HC in corresponding locations (P ≤ 0.05), while blast TBI group had fewer low FA clusters of significance compared with HC (uncorrected P ≤ 0.01). However, there was no difference of FA value between blast TBI and nonblast TBI (results not shown).
Tract‐specific analysis
For the whole brain spatial analyses using the cm‐reps method, the low FA clusters were found in the regions of the dorsal component of the left superior longitudinal fasciculus near the posterior part of the superior frontal and parietal lobes, the ventrolateral component of the right superior longitudinal fasciculus (arcuate fasciculus) near the superior temporal lobe (Fig. 2), the anterior parts of the bilateral inferior fronto‐occipital fasciculus (Supporting Information Fig. 1A), the inferior longitudinal fasciculus at the temporo‐occipital junction (Supporting Information Fig. 1B), and the uncinate fasciculus near the lateral aspects of the orbito‐frontal lobes (Supporting Information Fig. 1C) (P ≤ 0.05). The group difference in the cortico‐spinal tract and the corpus callosum is not statistically significant (Supporting Information Fig. 1D).
Figure 2.
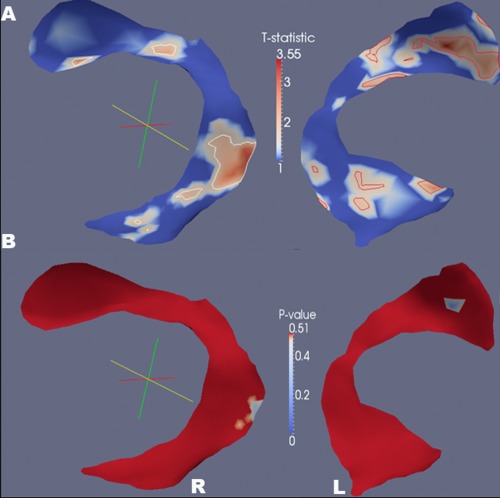
Tract‐specific analysis of fractional anisotropy using the method of continuous medial representations. Significant low FA clusters of the TBI group are shown in regions of superior longitudinal fasciculi (T statistics (A) and p values (B), P ≤ 0.05), where the color indicates the significance of T statistics and P values.
Region‐of‐interest (ROI) analysis of white matter lesions
Among the TBI patients, the presence (percentage frequency) of low FA, defined as Z < −3.5 compared to the mean FA of controls and with cluster size > 120 mm3, was primarily located in the regions of white matter of left precentral lobule (51%), left middle occipital and right middle frontal lobules (49%), left middle frontal and right supper frontal lobules (43%), left superior frontal lobule (41%), left posterior thalamic radiation and right anterior corona radiata (38%), left cingulum and left middle temporal (35%), right middle cerebellar peduncle (32%), left postcentral lobule, right precentral lobule, right thalamus, left cingulum (cingulate part), and left sagital stratum (30%). In comparing blast injury and nonblast injury using ROI analysis, there was no significant difference in the frequency or extent of low FA clusters, nor in the L.I. between nonblast injury and blast injury after correcting for multiple comparisons.
In addition, high FA clusters were found in some of the TBI patients (Supporting Information Fig. 3A). No low (Z < −3.5) or high (Z > 3.5) FA cluster was found among the controls.
Hemispheric asymmetry tract‐specific spatial statistics
Using voxel‐wise hemispheric asymmetry TBSS analysis to evaluate left and right (a)symmetries after correcting for multiple comparisons (P ≤ 0.05), both blast and nonblast TBI differed from HC in the regions of bodies of CC, forceps major/anterior corona radiata, the genu of internal capsule, inferior temporal and cerebellar white matter (Fig. 6A,B). In addition, nonblast TBI differed from HC in the regions of anterior limb of internal capsule, superior longitudinal fasciculus, sagittal stratum, and cuneal white matter (Fig. 6A); while blast TBI differed from HC in the regions of superior corona radiata, cerebral peduncles, posterior dorsal cingulum and precuneal white matter of parietal lobe (Fig. 6B). Blast TBI differed from blast TBI in the regions of thalamus, cuneal white matter, anterior corona radiata, superior longitudinal fasciculus, and sagittal stratum (Fig. 6C).
Figure 6.
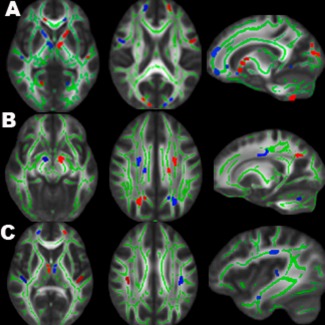
Results of hemispheric asymmetry TBSS of FA between 3 groups: HC vs. nonblast TBI (A), HC vs. blast TBI (B), and nonblast TBI vs. blast TBI (C). Significant hemispheric asymmetry clusters (RFT P ≤ 0.05, dilated for better viewing, red for greater left‐minus‐right asymmetry and blue for lesser left‐minus‐right asymmetry) are overlaid on the mean FA skeleton (green) and MNI FA template. TBI differed from HC in the regions of bodies of CC, forceps major/anterior corona radiata, the genu of internal capsule, inferior temporal and cerebellar white matter (A, B). In addition, nonblast TBI had more (a)symmetry clusters over the anterior‐posteriorly oriented fibers such as anterior limb of internal capsule, superior longitudinal fasciculus and sagittal stratum (A,C), while blast TBI had more over the centrally, inferior‐superiorly oriented fibers such as superior corona radiata, pyramidal tracts, and brainstem fibers (B, C).
Tractography using low FA seeds
Examples of using low FA clusters (Z < −3.5) as seed masks in TBI participants and healthy controls are shown in Figure 3 and Supporting Information Figure 3B,C. The locations of fiber discontinuities were mainly in the pathways of supratentorial projection fibers (i.e., corona radiata), fronto‐temporo‐occipital association fibers, limbic fibers, callosal fibers, infratentorial projection fibers (i.e. cerebellar peduncles) and internal capsules (Fig. 3).
Figure 3.
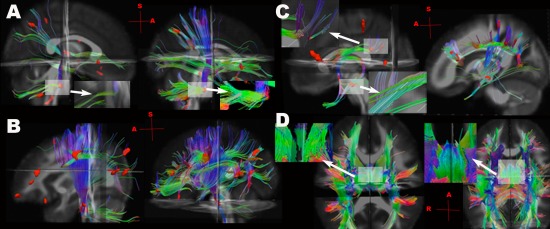
Examples of tractography using the low FA clusters as seeds (red), identified by comparing the individual TBI participant to the mean of healthy controls (Z < −3.5), in TBI participants (left of each subfigure), and in the gender and age matched controls using the same seeds (right of each subfigure). A: A mild blast TBI participant (male, 29 years old, 59 days post‐injury) injured by rocket‐propelled grenade with complaints of dizziness and problems of balance, hearing, vision, memory and concentration. Close‐up view of fiber “breaks” (discontinuity) in middle cerebellar peduncles in the right lower corner of TBI patient (A, Left), compared with the control (A, Right). B: A mild nonblast TBI participant (male, 24 years old, 156 days post‐injury) injured by mine‐resistant ambush‐protected vehicle rollover with complaints of problems with memory, mood, and cognition. Low FA clusters were mainly at prefrontal and parietal regions, as well as pyramidal tracts (red). C: A moderate blast TBI patient (male, 25 years old, 65 days post‐injury) injured by Improvised Explosive Devices (IED) blast with complaints of attention, irritability and cognition. Low FA clusters were found at forceps minor, DLPFC and fornix (arrows). Close‐up view shows fiber “breaks” in the DLPFC in the left upper corner, and in the fornix in the left lower corner (C. Left). D: A moderate blast TBI patient (male, 24 years old, 32 days post‐injury) injured by IED blast with complaints of anxiety, sleep problems, and hearing loss. Close‐up view shows fiber “breaks” in fornix in the left upper corner (D, Left), compared to the intact fornix of one control participant in the left upper corner (D, Right) (see Supporting Information Fig. 3 for more illustrations of the same TBI subject).
Post‐Concussion and PTSD Symptoms, and Time Post‐Injury and Diffusion Measures
NBSI total score was significantly associated with low FA mainly in the regions of the junction of ventral striatum, genu of internal capsule, and optic chiasma near the level of midbrain (Fig. 4A), where TBI as a group had lower FA compared to controls (Fig. 1), and also in the ventral (hippocampal) part of the left cingulum bundle and the left thalamus (RFT corrected P ≤ 0.05, voxel > 120, df = 20) (Fig. 4A). The results of association significance were similar when only including eighteen (18) mild but not moderate or severe TBI patients (results not shown). Likewise, PCLC total score was correlated with low FA in the similar regions with additional clusters in the bilateral superior cerebellar peduncles (SCR) near the midbrain and the dorsal (cingulate) part of the right cingulum bundle (Fig. 4B) (RFT corrected P ≤ 0.05, voxel > 120, df = 33). Increased post‐injury duration was associated with lower FA at the regions of the superior end of the ventral cingulum bundle near the posterior cingulate gyrus, and the superior corona radiata near the dorsomedial segment of the superior frontal lobe (RFT corrected P ≤ 0.05, voxel > 120, df = 33) (Fig. 4C).
Figure 4.
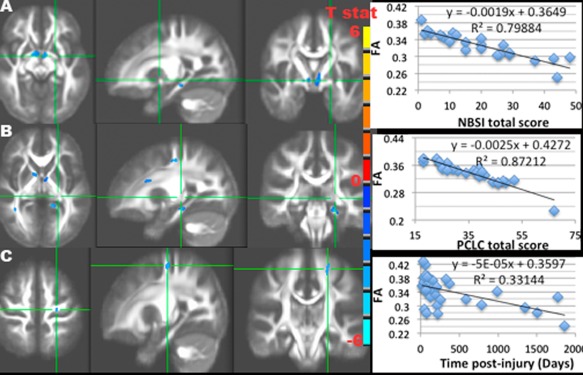
Results of the negative associations between FA and NBSI (A), PCLC (B) total scores, days post‐injury (C), and their scatter plots of the mean FA of all significant clusters (RFT P ≤ 0.05) vs. NBSI (A), PCLC (B) total scores, and days post‐injury (C) in TBI participants, with T statistics of significant clusters (RFT P ≤ 0.05) overlaid on the mean FA image. A: Negative association between NBSI and FA at the ventral striatum and ventral cingulum bundles. B: Negative association between PCLC and FA at the ventral striatum, ventral cingulum bundles, genu of the internal capsules, superior corona radiata, and fronto‐parietal association fibers. C: Negative association between post‐injury duration and FA at the superior corona radiata.
When the NBSI and PCLC scores were subdivided into three subcategories, i.e. NBSIsom, NBSIcog, NBSIaff and PCLCb, PCLCc, PCLCd, the locations of significant correlation were similar to those using total scores, but varied slightly between each subcategory of NBSI or PCLC (Supporting Information Fig. 4 and Fig. 5). Looking at blast and nonblast TBI groups separately, greater post‐concussion and PTSD symptoms in the nonblast subjects were associated with lower FA in the unilateral anterior‐posteriorly oriented tracts, such as anterior and posterior parts of dorsal cingulum bundle, and commissural fibers such as splenium of corpus callosum (p ≤ 0.05) (Fig. 5A,B). The NBSI and PCLC total scores of the blast TBI subjects were correlated with lower FA primarily in the bilateral superior‐inferiorly oriented tracts such as superior corona radiata, the genu of internal capsule, ventral striatum, and the frontal fibers interconnecting fronto‐parieto‐occipital networks (p ≤ 0.05) (Fig. 5C,D).
Figure 5.
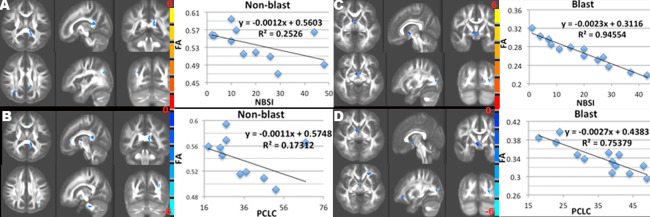
Results of the negative associations between FA and NBSI (A, C) and PCLC (B, D) total scores in nonblast TBI (A, B) and blast TBI (C, D) patients, and their scatter plots of the mean FA of all significant clusters (RFT P ≤ 0.05) vs. NBSI (A, C) and PCLC (B, D) scores with T statistics (color bars) of significant clusters (RFT P ≤ 0.05) overlaid on the mean FA image. Although similar to the findings of Figure 4, there are more anterior‐posteriorly oriented clusters in nonblast TBI (A,B), but more centrally and inferior‐superiorly oriented clusters in blast TBI (C,D).
Neuropsychological (NP) Testing
Table 2 summarizes the neuropsychological measures of twenty‐three TBI patients and their significant correlations with FA. All the TBI patients had greater TOMM Trial 1, score > 45 (range, 46–50), which is above the accepted threshold for invalid responding.
Table 2.
Mean scores and standard deviation of neuropsychologic test batteries of TBI patients, and significant correlations between tasks and FA using voxel‐wise and ROI analyses
| Neuropsychological batteriesa instrument (task/model) | N = 23 TBIb | Correlation | |
|---|---|---|---|
| Voxel‐wise | ROI# | ||
| ANAM (Throughtput) | |||
| Simple Reaction Time | 210.7 ± 38.0 | . | . |
| Sternberg Procedure | 99.5 ± 17.7 | . | . |
| Spatial Processing | 32.9 ± 12.7 | rt cerebell (+), pCC(‐) | . |
| Matching to Sample | 22.2 ± 6.0 | sCC (‐) | . |
| Code Substitution–Learning | 97.8 ± 2.1 | . | . |
| Code Substitution–Delayed | 48.8 ± 17.1 | . | . |
| WAIS‐III (T scores) | |||
| Digit Symbol | 46.7 ± 10.8 | . | rt puta(‐) |
| Block Design | 50.5 ± 8.5 | . | . |
| Symbol Search | 52.5 ± 9.5 | gCC, fx, rt slf, rt cerebell (‐) | rt fx (‐) |
| WTAR (T score) | |||
| Demographic predicted score | 103.2 ± 6.0 | acr, gCC, bCC, occi (+) | rt acr (+) |
| D‐KEFS (Scaled Scores) | |||
| Verbal Fluency‐total correct | 9.9 ± 10.8 | . | . |
| Category fluency | 12.0 ± 4.1 | . | . |
| Twenty Questions Test‐total questions | 11.5 ± 1.7 | . | . |
| Prover Test | 10.4 ± 2.1 | . | . |
| CPT‐II (T scores) | |||
| Omissions | 68.2 ± 50.3 | . | . |
| Commissions | 55.1 ± 9.3 | rt cerebell (+) | . |
| Hit Reaction Time | 45.3 ± 8.3 | cst (‐), rt dcyg(+), precun(+), fx(+), bs (+) | bs (+) |
| Variability | 52.3 ± 14.2 | rt cst (‐) | . |
| Detectability | 50.1 ± 7.1 | rt cp (+) | . |
| Response Style | 48.6 ± 7.0 | bs (+) | . |
| Perseverations | 56.3 ± 15.1 | cerebell (+) | . |
| CVLT (Raw scores) | |||
| Immediate Recall‐total 1–5 Trials Delayed Recall | 50.5 ± 8.5 | lt mcp (+) | . |
| Short Delayed Free Recall | 11.3 ± 2.9 | lt mcp (+) | . |
| Short Delayed Cued Response | 12.3 ± 1.9 | rt scr (+) | . |
| Long Delayed Free Recall | 12.1 ± 2.5 | lt mcp (+) | |
| Long Delayed Cued Response | 12.5 ± 2.2 | lt mcp (+) | |
ANAM, automated neuropsychological assessment metrics; WAIS‐III, Wechsler Adult Intelligence Scale‐Third Edition; WTAR, Wechsler Test of Adult Reading; D‐KEFS, Delis‐Kaplan Executive Function System; CPT‐II, Conners' Continuous Performance Test‐Second Edition; CVLT, California Verbal Learning Test.
Only twenty‐three TBI patients (Mild (N=17), Moderate (N=5), Severe (N=1)) had completed neurocognitive testing.
+, positive correlation; −, negative correlation; lt, left; rt, right; acr, anterior corona radiata; bs, brainstem; CC, corpus callosum (bCC: bodies, gCC: genu, pCC: posterior bodies, sCC: splenium); precun, precuneus; cp, cerebral peduncle; cerebell, cerebellum; cst, corticospinial tract; fx, fornix; mcp, middle cerebellar peduncle; occi, occipital lobe; scr, superior corona radiata; slf, superior longitudinal fasciculus.
For the relationship between cognitive function and post‐concussion and PTSD symptoms (P ≤ 0.05, df = 20), higher PCLC and NBSI total scores correlated with poor Throughput of the ANAM Code Substitution–Learning (r = −0.54 for PCLC and −0.43 for NBSI, respectively) and Code Substitution–Delayed (r = −0.51 and −0.43, respectively). PCLC and NBSI scores correlated positively with Commission Errors (T score) of the CPT‐II (r = 0.54 for PCLC and 0.46 for NBSI, respectively). NBSI also correlated with Omission Errors of the CPT‐II (r = 0.46), and PCLC correlated negatively with Throughput of the ANAM Processing Speed (r = −0.44).
For the correlations between neurocognitive testing batteries and FA using whole‐brain voxel‐wise analysis (RFT corrected P ≤ 0.05), the Throughput of the ANAM Spatial Memory score correlated positively with FA in the right cerebellar white matter, but inversely with FA in the bodies of posterior CC (Supporting Information Fig. 6A). FA in the splenium of CC correlated negatively with the Throughput of the ANAM Matching to Sample (Working Memory) module. WTAR demographic adjusted reading score correlated positively with FA in the regions of bilateral anterior corona radiata, body and genu of CC, and the subcortical white matter of primary visual cortex (Fig. 7A).
Figure 7.
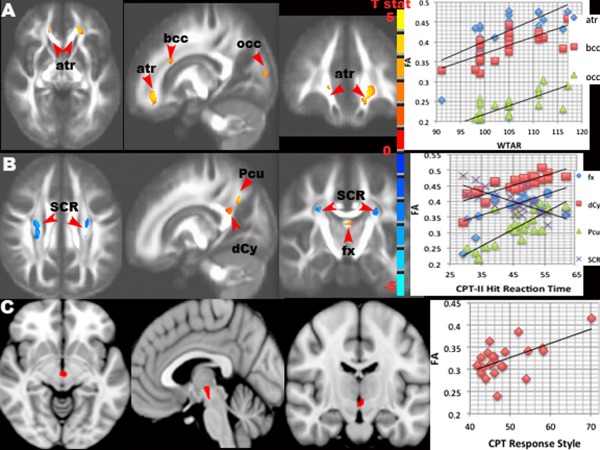
Results of the associations between FA and neuropsychological (NP) testing of Wechsler Test of Adult Reading (WTAR) (A), Conners' Continuous Performance Test (CPT)‐II Hit Reaction Time (B) and Response Style (C) in TBI patients. Significant clusters (t values in (A) and (B), and mask in (C, red)) are overlaid on the mean FA image (A, B) and MNI T1 template (C) (RFT P ≤ 0.05) with their scatter plots of the mean FA vs NP scores. A: WTAR score positively correlated with FA in the anterior thalamic radiation (atr), bodies of corpus callosum (bcc), and occipital (occ) white matter. B: CPT‐II Hit Reaction Time correlated negatively with FA in bilateral corona radiata (SCR), but negatively with FA in the fornix (fx), posterior dorsal cingulum bundle (dCy) / bodies of corpus callosum, and precuneal (Pcu) white matter. C: CPT‐II Response Style correlated positively with FA in the ventral striatum.
For the CPT‐II, the Perseverations score correlated positively with FA in the white matter of bilateral cerebellar hemispheres, and the Commissions score with FA in the right cerebellar hemisphere, as well as the Detectability score with FA in the right cerebral peduncle. The High Variability score correlated with lower FA in the right pyramidal tracts at the level of CC. Hit Reaction Time (HRT) correlated inversely with FA in the bilateral superior corona radiata / pyramidal tracts at the level of the bodies of CC, but positively with FA in the regions of posterior dorsal cingulum bundles and precuneus (Fig. 7B). In addition, FA in the ventral striatum / ventral tegmental area (VTA) was positively associated with Response Style (a measure of inhibition response) (Fig. 7C).
FA in the regions of left pons and left middle cerebellar peduncle correlated with performance of the Immediate Recalled test (sum of total 1–5 trials), and with both of the Short‐Delay and Long‐Delay Free‐Recall tests, as well as with the Long‐Delay Cued Response of CVLT (Supporting Information Fig. 6B). In addition, FA in the right superior corona radiata correlated with Short‐Delay Cued Response (Supporting Information Fig. 6C). However, Symbol Search of WAIS‐III correlated inversely with FA in the regions of the genu of CC, fornix body, right cerebellar hemisphere and right parietal white matter (Supporting Information Fig. 6D).
Using ROI analysis for the correlations between neurocognitive testing batteries and FA (corrected P ≤ 0.05), FA in the right anterior corona radiata correlated positively with demographic adjusted WTAR score (r = 0.72). The Symbol Search of WAIS‐III correlated inversely with FA in the right fornix body (r = −0.69), and a trend in the left fornix body (r = −0.64). The Digit Symbol of WAIS‐III correlated inversely with FA in the right putamen (r = −0.67). Hit Reaction Time correlated with FA in the right red nucleus (r = 0.68), and showed positive trends in the regions of left midbrain and the bodies of bilateral fonix (r = 0.66).
DISCUSSION
Using high‐dimensional tensor warping and tract‐specific analyses, we have revealed evidence of white matter injury in those with military‐related TBI. Indicated primarily by reduced FA and increased trace, the injuries were most prominent in the pathways within the fronto‐striatal and fronto‐limbic circuits, and the fiber tracts in the midbrain and the brainstem regions. The compromised white matter tracts were due to increased radial diffusivity, not decreased axial diffusivity, suggesting possible dsy‐ and de‐myelination with [Cader et al., 2007] or without [Song et al., 2003] axonal injury. Moreover, the compromised fiber tracts (reduced FA) in the nodes of fronto‐striatal and fronto‐limbic circuits were associated with greater post‐concussion and PTSD symptoms. In addition, we demonstrated these white matter microstructural changes could cause heterogeneous left vs. right asymmetries of connectivity depending on the mechanisms of injury; blast injury showed increased damage in central and superior‐inferiorly oriented tracts near subcortical regions, while nonblast TBI subjects showed more damage in anterior‐posteriorly or left‐right oriented tracts. In summary, these findings suggest the networks of the fronto‐striatal circuit and the frontal‐limbic circuitry, particularly the CSTCC circuit, are most vulnerable to military related injury, which may also plays an important role in the development of neuropsychological symptoms frequently seen in military TBI patients.
Interpretation of Microstructural Changes in TBI
The timing after injury is crucial in interpreting DTI metrics. Several DTI studies have shown decreased FA and increased apparent diffusion coefficient (ADC) in acute TBI patients [Arfanakis et al., 2002; Benson et al., 2007; Huisman et al., 2004; Lipton et al., 2009; Miles et al., 2008], possibly explained by the disruption of membrane skeleton and/or vasogenic edema due to the increased axolemmal permeability. Few studies have found increased FA and/or decreased ADC in acute (within 72 hours) [Bazarian et al., 2007] and subacute (around 2 weeks post‐injury) [Mayer et al., 2010] TBI patients. The increased FA is primarily due to the decreased radial diffusivity [Mayer et al., 2010], explained by cytotoxic edema (swollen axon) causing a net movement of water into intracelluar space and, restricting free water movement, resulting in a decreased ADC and possibly an increased FA.
The majority of our patients were in a subacute stage of injury, i.e. around 3 months or more post‐injury. Our tract‐specific analysis of the DTI diffusion metrics is consistent with the findings of recent reports [Bendlin et al., 2008; Singh et al., 2010], which found lower FA and higher trace in the pathways of fronto‐striatal and fronto‐limbic circuitry and brain stem fiber tracts. Our findings of FA decreases were generally due to increased λ⊥ but not decreased λ||, which is also consistent with a report on nonblast TBI patients with mild to moderate injuries [Singh et al., 2010]. Increased λ⊥ is interpreted as more free space for radial diffusion of water molecules because of the absence of barriers posed by myelin sheath and axonal membrane [Singh et al., 2010]. The tendency of increased λ|| can be explained by axonal regrowth and regeneration [Jiang et al., 2011], astrogliosis [Budde et al., 2011], and possibly the more coherently oriented fibers on intercepting fiber tracts (Pierpaoli and Basser, 1996) or loss of crossing fibers, which can also be applied to the findings of high Z‐score (Z > 3.5) FA clusters in some of the TBI patients (Supporting Information Fig. 3A).
Secondary white matter changes with axonal degeneration can begin in 2–7 days post‐injury followed by myelin degradation and astrocyte infiltration at 2 weeks post‐injury [Iizuka et al., 1989; Thomalla et al., 2005). Our findings of the inverse relationship between post‐injury duration and FA in the compromised white matter tracts in TBI (e.g., superior corona radiata near the regions of superior frontal gyrus), suggest of Wallerian degeneration which may contribute to the long‐lasting cognitive and behavioral problems frequently seen in chronic TBI patients.
Low FA and Fiber Discontinuity in TBI
Fiber discontinuity in TBI has been demonstrated by integrating multi‐modal modalities, such as DTI tractography on the white matter hyperintensities (WMHs) shown in fluid‐attenuated inversion recovery (FLAIR) (Rutgers et al., 2008) (Supporting Information Fig. 7A), and fiber tacking on the microbleeds revealed by susceptibility‐weighted imaging (SWI) (Yeh et al., 2012) (Supporting Information Fig. 7B–D). TAI is often associated with microbleeds, usually displayed as small “black holes” in SWI (Supporting Information Fig. 7B) and hyperintensities in quantitative susceptibility imaging (Supporting Information Fig. 7C). Based on our preliminary observation, WMHs tend to be on the disrupted fiber paths, while microbleeds are often adjacent to the fiber discontinuity (Supporting Information Fig. 7B–D). Thus the fiber discontinuity demonstrated by tractography is more likely due to white matte shearing but less likely due to the susceptibility effect of iron products. Nevertheless, the inter‐relationships between fiber disruption, WMHs and microbleeds are not clear and out of scope beyond this study. The use of low‐valued FA clusters as seed masks for fiber tracking, revealed by comparing the spatially normalized FA to a group of controls, is useful in identifying fiber “breaks” in TBI patients. It can be very time‐consuming to examine the whole brain tractography without knowing where the lesions are located, so any type of initial localization will make tractography more practical. Moreover, our findings of using low FA clusters as seeds for fiber tracking have demonstrated that the fiber discontinuities were associated with symptomatology of TBI patients, such as poor executive function with DLPFC fibers, mood swing and anxiety with limbic fibers (Fig. 3), and hearing problem with auditory and language networks (Supporting Information Fig. 3). However, not all of the involved fiber tracking showed discontinuity on fiber tracking, which is consistent with the findings of a report on mild TBI patients (Rutgers et al., 2008). Our results showed that the most frequent locations of low FA with fiber “breaks” were primarily at the frontal short association fibers, the supratentorial projection fibers (i.e. corona radiata), the fronto‐temporo‐occipital long association fibers, the callosal fibers, and the limbic fibers (i.e. fornix, cingulum) (Fig. 3), consistent with the previous report [Rutgers et al., 2008]. In our study, visible fiber “breaks” were mostly found in moderate TBI patients with microhemorrhanges documented by susceptibility weighted imaging (Supporting Information Fig. 2). However, we also found the infratentorial projection fibers (i.e. cerebellar peduncles) (Fig. 3) and the internal capsules were susceptible to breaking, which is contrary to the previous report of civilian nonblast TBI patients [Rutgers et al., 2008]. This discrepancy may be due to different mechanisms and tissue vulnerability between blast and nonblast injury (see below for discussion). Nevertheless, these FA biomarkers appear to be useful to monitor the consequences of brain damage and recovery following TBI.
Blast TBI vs. Non blast TBI
Blast TBI as described in this work refers to “blast plus”. That is, while components of primary blast may be involved, most injuries involve secondary or tertiary blast, which have features more consistent with mechanically induced TBI; therefore, primary blast is rare [Warden et al., 2009]. However, it is anticipated that blast injury and nonblast injury have different pathogenetic mechamisms, but also share some similarities of pathophysiological changes after trauma. To the best of our knowledge, there is no report on the differences of white matter microstructural changes between blast TBI and nonblast TBI. It is not surprising that ROI analysis of hemispheric asymmetries did not show statistical significance between groups after using a conservative Bonferroni correction. Nevertheless, the results of hemispheric asymmetry TBSS analysis were consistent with those of whole brain voxel‐wise analysis. The findings support that frontal and cerebellar white matter, as well as medial temporal, occipital and interhemispheric white matter systems are vulnerable to traumatic injury, both in blast and nonblast. Moreover, nonblast tends to inflict more damage on the fiber tracts along the anterior‐posterior axis, e.g. oribofrontal white matter; while blast damages more frontal tracts along the inferior‐superior paths, e.g. white matter in the superior frontal, somatomotor and somatosensory regions, genu of internal capsule and brainstem (Fig. 6). Using the hemispheric asymmetry TBSS analysis, we have shown a difference in vulnerability of left and right hemispheres (asymmetries) in certain fiber tracts between blast and nonblast injury, although there was no voxel‐wise FA difference. Our findings suggest that central and superior‐inferiorly oriented fibers such as the projection fibers interconnecting cortico‐subcortical regions, e.g. superior corona radiata, cerebral peduncles / corticospinal tracts, cingulum bundles, precuneual white matter, fornix, cerebellar peduncles, and brainstem fibers are more vulnerable to blast injury, while shear and strain forces resulting from direct impact force may have more detrimental effects on anterior‐posteriorly orientated fibers, e.g. anterior limbs of internal capsules, anterior corona radiata, superior longitudinal fasciculus, sagittal stratum. Interestingly, these observations are supported by the results of the association between FA and post‐concussion and PTSD symptoms when separating blast and nonblast TBI patients (Fig. 5), i.e. the associated fiber tracts in blast TBI were more symmetrically distributed in bilateral superior‐inferiorly oriented fibers near the brainstem and deep subcortical regions, while more asymmetrically distributed in unilateral anterior‐posteriorly orientated fibers in nonblast TBI patients. These findings may support the postulation that blast waves ripple through the torso up into the brain through the major great vessels (Bhattacharjee, 2008; Cernak et al., 2001) leading to shear‐strain deformation and resulting in multi‐focal scattered lesions commonly seen in cerebral gray‐white matter junction, the deep subcortical white matter tracts, centrum semiovale, the dorsolateral aspect of the upper brain stem, basal ganglion, and cerebellum (Gentry et al., 1989; Hesselink et al., 1988; Parizel et al., 1998). In addition to these regions, impact injury is also more likely to inflict the anterior‐posterior and left‐right positioned fibers, particularly in the frontal, parietal and occipital regions through direct contact, where the adjacent tissues have a relatively greater difference in shear modulus (rigidity). Shear and or tensile strains develop between tissues in concussion [Gentry et al., 1988] and fiber tracts such as the anterior corona radiata, the anterior dorsal cingulum, and the genu and splenium of corpus callosum [Hortobagyi et al., 2007] receive the highest strain concentration after impact [Viano et al., 2005]. Our finding of a higher frequency of compromised white matter interconnecting Broca's area and Wernicke's area in the temporal and parietal lobes in blast injury may explain some common speech subjectively reported problems in blast TBI patients. Moreover, our findings suggest that pathologically leftward or rightward asymmetry can have significant impacts on neuropsychological functions and the manifestation of neurobiological symptoms after TBI.
Post‐Concussion and PTSD Symptoms and Neurocircuitry Affected in TBI
In this study, mild TBI participants had greater post‐concussion and PTSD symptoms than moderate TBI patients. This has been reported elsewhere in a military population [Belanger et al., 2009] and is consistent with the findings of a negative association between the severity of bodily injuries and the reporting of traumatic stress and post‐concussion symptoms from the same military population but an earlier and larger cohort [French, 2010]. One study showed that increased FA was correlated with the severity of post‐concussion symptoms of acute (within 6 days post‐injury) mild TBI patients, who had higher FA than the controls [Wilde et al., 2008], while another study did not find a significant relationship between post‐concussion symptoms and FA measured in three regions of corpus callosum in subacute mild TBI patients [Lange et al., 2012]. On the contrary, our findings of significant associations between FA and post‐concussion symptoms were in the affected regions of the neural networks in which the cognitive (frontal fibers), affective (limbic fibers), and somatic sequelae (sensory/motor pathways) following brain injury can be explained.
The frequent comorbidity of PTSD and TBI is well described in military TBI patients [Belanger et al., 2009; Hoge et al., 2008; Ruff et al., 2010; Warden, 2006]. Compromised integrity of white matter fiber connections, such as mainly decreased FA in the frontal region, has also been reported in PTSD patients [Schuff et al., 2011]. Therefore, the compromised integrity of white matter fiber connections of this study can be the combination of comorbid PTSD and TBI as these two separate and distinct diseases share common clinical symptoms.
Neuropsychological (NP) Measures and Neurocircuitry Affected in TBI
Complex cognitive processes, such as attention, executive functions and memory, require intact white matter tracts among frontal [Liston et al., 2006; Stuss, 2011], parietal [Olesen et al., 2003] and medial temporal lobes [Ariza et al., 2006], where the white matter circuits interconnecting these regions are particularly vulnerable to brain injury [Salmond et al., 2005]. Recent DTI studies suggest that cognitive impairment following trauma may correlate with the severity of white matter injury [see Levin et al., 2010 for review]. However, previous studies applying whole brain voxel‐wise analysis to explore the relationship between FA and cognitive tasks have found both positive and negative correlations [Baird et al., 2005; Palmer et al., 2010; Tuch et al., 2005; Turken et al., 2008]. It is thought that TAI has a negative effect on transmission between cortices; however, depending on the interconnecting cortices, the fiber tracts in the neural networks may have stimulatory and/or inhibitory functions [Yeh et al., 2010]. Thus, the relationship between DTI measures of these fiber tracts and cognitive function may not be straightforward.
The ANAM TBI Battery is currently being administered to U.S. military troops before deployment, as a baseline measure of neurocognitive performance. Although we did not compare the changes of ANAM subtests due to the unavailability of before‐injury data, the average ANAM Throughput scores of our military cohort were comparable to the previous report with active duty U.S. military samples [Eonta et al., 2011].
The CPT measures a person's sustained and selective attention and impulsivity. Errors of Commission are assumed to reflect impulsivity (responses that occur when on response is required), while errors of Omission are assumed to reflect symptoms of inattention [Epstein et al., 2003]. Response Style, an index of the speed and accuracy trade off and a measure of inhibition response, suggests the tendency to minimize or exaggerate responses. Higher Response Style score emphasizes on avoiding commission errors [Conners, 2002]. On the other hand, greater CPT Variability of Reaction Time is a common finding of attention deficit hyperactivity disorder [Barkley et al., 1990]. Ventral striatum and VTA are the major regions of mesocorticolimbic reward networks [Camara et al., 2009] and Papez impulsivity control circuits [Papez, 1995]. The VTA dopamine neurons [Margolis et al., 2006] serve several functions in the reward system [Luo et al., 2011], as well as in motivation, cognition, drug addiction, and have been the foci of several psychiatric disorders. VTA has been shown to process various types of emotion output from the amygdala, where it may also play a role in avoidance and fear‐conditioning. Our findings of the correlations between the ventral striatum / VTA FA and Response Style (Fig. 7C), as well as between the striatal FA and post‐concussion / PTSD symptoms (Figs. 4 and 5) suggest that disrupted striatal network is associated with compulsivity control and reward sensitivity of TBI patients.
Negative correlation between processing speed and FA in the splenium of CC in normal adults [Madden et al., 2004], and positive correlation between behavioral reaction time (RT) and the total number of lower FA lesions in mild TBI [Niogi et al., 2008] have been reported by using ROI analysis. The association between RT and FA is influenced by myelin thickness on brain water self‐diffusion [Beaulieu, 2002] and by nerve conduction velocity (NCV) [Jack et al., 1983], consistent with our findings of the negativity of CPT‐HRT and FA in the superior corona radiata (Fig. 7B). However, the positivity of the FA‐reaction time was also observed using voxel‐wise analysis [Tuch et al., 2005]. The positive relationship is thought to be caused by intravoxel fiber crossings [Pierpaoli et al., 2001; Tuch et al., 2003] and/or neuroplasticity after injury [Budde et al., 2011], resulting in more orientated fiber tracts in one direction, where the increased FA of an individual fiber population causes a decrease in the overall FA [Pierpaoli et al., 2001; Tuch et al., 2005; Wiegell et al., 2000] and reverses the correlation direction between FA and Reaction Time [Tuch et al., 2005]. Using whole brain voxel‐wise analysis, we also found increased FA clusters in several TBI patients, although there was no significant systemic difference across group. High FA in the deep subcortical white matter is thought to be compensatory plasticity following injury, but not directly due to trauma itself [Lipton et al., 2012]. More interestingly, increased FA and reduced mean diffusivity after trauma may suggest a poorer NP performance, which can be used as biomarkers for an ominous outcome of TBI [see Shenton et al., 2012 for review].
Our findings of the positive FA‐Hit Reaction Time correlation in the posterior dorsal cingulum bundles and precuneus (Fig. 7B) are likely due to the damaged intersecting fibers [Tuch et al., 2005] at the junction of posterior dorsal cingulum, major forceps and tapetum of CC, and/or by brain plasticity after TBI [Lipton et al., 2012]. Activation of precuneus is related to response time in serial reaction tasks [Oishi et al., 2005]. Precuneus, a part of the left executive control networks consisting of the left dorsolateral prefrontal cortex (DLPFC), parietal lobe and cerebellum [Shirer et al., 2012], plays an important role in visuo‐spatial function, episode memory retrieval and consciousness [Cavanna and Trimble, 2006]. Interestingly, the posterior dorsal cingulum and precuneus clusters were also found to be vulnerable to blast injury using hemispheric asymmetry TBSS analysis (Fig. 6B), suggesting that disrupted fronto‐cingulate‐precuneus interconnections by blast injury has a detrimental consequence on the executive function of military TBI patients.
The integrity of the interhemispheric connections has been shown to be related to intelligence factors [Tang et al., 2010], which is consistent with our findings of the positivity of callosal FA and WTAR score (Fig. 7A). However, the negative association between cognitive function and FA in the limbic fiber, e.g. cingulum, and between executive function and FA in the commissural fibers and DLPFC association fibers has also been reported in TBI patients [Kraus et al., 2007]. We also found the negativity of WAIS‐III Symbol Search and FA in the fornix (Fig. 7B), a part of the fronto‐limbic circuit, which might indicate the failure of prefrontal “top‐down” control for an aggressive‐impulsive behavior [Raine and Yang, 2006] in TBI patients. Lower FA, particularly in the DLPFC, has been shown to be associated with worse executive function performance of TBI patients [Lipton et al., 2009]. However, the reversed association was also observed in other studies [Kraus et al., 2007; Writer et al., 2010], which may be due to the differences of cellular responses and post‐injury phases, e.g., cytotoxic edema vs. vasogenic edema, acute vs. chronic. In addition, IQ and demographic factors influence the measures of executive skills, and using WAIS‐III, without taking demographic factors into account, might bias the assessment of executive skills [Palacios et al., 2011]. Recent studies have suggested that using unbiased measures, e.g. measure of discriminability, the d‐prime index [Haatveit et al., 2010], is superior to using WAIS‐III subtests in evaluating working memory dysfunction after TBI [Palacios et al., 2011].
Dysfunctional fronto‐thalamic‐cerebellar circuitry, via the pathways of superior and middle cerebellar peduncles interconnecting brainstem and cerebellum, has been hypothesized as the underlying cause of cognitive impairment in several psychiatric disorders [Andreasen et al., 1996; Sullivan et al., 2003; Yeh et al., 2009]. Our findings of the positivity of ANAM Spatial Processing with the cerebellar FA, and of memory function with FA in the middle cerebellar peduncles and anterior corona radiata indicate the vulnerabilities of the fronto‐thalamic‐cerebellar circuitry to trauma and their cognitive consequences.
In summary, the complex relationships between DTI measures and cognitive performance have made DTI in predicting neuropsychological consequences after TBI difficult. Nevertheless, our findings suggest the projection fibers interconnecting cortico‐subcortical regions, brainstem fibers and cerebellar peduncles are particularly vulnerable to military‐related blast injury, while anterior‐posteriorly orientated fibers are more susceptible to nonblast injury, where the compromised circuits have significant effects on the functional outcome of TBI patients. Specifically, disrupted fronto‐cingulate‐precuneus circuitry and fronto‐thalamic‐cerebellar circuitry have detrimental consequences on executive functions, while comprised mesocorticolimbic networks such as fronto‐strital circuitry and fronto‐limbic circuitry have significance on compulsivity control and PTSD symptoms of injured warriors. Newer techniques, such as high angular resolution diffusion imaging and diffusion spectrum imaging, resolving the intravoxel fiber crossing problem and clarifying the relationship between composite fiber architecture and diffusion MRI measures will help to elucidate the consequences of TAI on cognitive changes.
LIMITATIONS
We did not correct diffusion EPI distortion induced by the high field inhomogeneity in the preprocessing step. However, the high‐dimensional tensor warping algorithms used in this study have been shown to be efficient in minimizing EPI distortion and improving white matter tract alignment, and thus to enhance the power of statistical inference in clinical settings [Zhang et al., 2005]. Not all the brain injuries of TBI participants were directly related to combat operations, i.e. one participant was injured in a bicycle accident, and one was injured while playing football. While we might expect that the emotional valence of a combat injury is different, all deployed individuals are routinely exposed to emotionally traumatic events [Hoge et al., 2004]. The service members included in this study reflect the overall demographic characteristics of this clinical population. There is varied time since injury, they are on a variety of medications, and they manifest a range of stress symptoms. This heterogeneity complicates interpretation of the data. Additionally, the blast injuries seen in our population reflect “blast‐plus” in which components of the blast wave (primary blast) are combined with more traditional mechanical and rotational components. We did not administer neuropsychological testing to the controls and were not able to assess the difference of the correlation between NP testing and DTI measures among TBI and controls. Finally, we are aware that our results of white matter abnormalities may not be caused solely by trauma. Thus, the microstructural alterations in white matter integrity revealed in the study may not be specific to TBI, and their presence does not necessarily confirm a diagnosis of traumatic axonal injury. Nevertheless, the results of this study suggest that DTI metrics can be used as noninvasive biomarkers in assessing affected networks and for a better understanding of neuropathology of TBI.
Supporting information
Supplementary Information
ACKNOWLEDGMENTS
The authors thank Dr. H. Tang, B. Bogale and J. Morissette for MR technical support, C. Melford, R. Wolfowitz, S. Gentile and J. Harper for participant recruitment and project coordination.
Disclaimer The views expressed in this article are those of the author and do not reflect the official policy of the Department of Army/Navy/Air Force, Department of Defense, or U.S. Government.
REFERENCES
- Adams JH, Doyle D, Ford I, Gennarelli TA, Graham DI, McLellan DR (1989): Diffuse axonal injury in head injury: Definition, diagnosis and grading. Histopathology 15:49–59. [DOI] [PubMed] [Google Scholar]
- Alexander GE, DeLong MR, Strick PL (1986): Parallel organization of functionally segregated circuits linking basal ganglia and cortex. Annu Rev Neurosci 9:357–381. [DOI] [PubMed] [Google Scholar]
- Andersson JLR, Jenkinson M, Smith S (2007): Non‐linear optimisation, FMRIB technical report TR07JA1. Oxford, United Kingdom: FMRIB Centre.
- Andreasen NC, O'Leary DS, Cizadlo T, Arndt S, Rezai K, Ponto LL, Watkins GL, Hichwa RD (1996): Schizophrenia and cognitive dysmetria: A positron‐emission tomography study of dysfunctional prefrontal‐thalamic‐cerebellar circuitry. Proc Natl Acad Sci USA 93:9985–9990. [DOI] [PMC free article] [PubMed] [Google Scholar]
- Arfanakis K, Haughton VM, Carew JD, Rogers BP, Dempsey RJ, Meyerand ME (2002): Diffusion tensor MR imaging in diffuse axonal injury. AJNR Am J Neuroradiol 23:794–802. [PMC free article] [PubMed] [Google Scholar]
- Ariza M, Pueyo R, Junque C, Mataro M, Poca MA, Mena MP, Sahuquillo J (2006): Differences in visual vs. verbal memory impairments as a result of focal temporal lobe damage in patients with traumatic brain injury. Brain Inj 20:1053–1059. [DOI] [PubMed] [Google Scholar]
- Baird AA, Colvin MK, Vanhorn JD, Inati S, Gazzaniga MS (2005): Functional connectivity: Integrating behavioral, diffusion tensor imaging, and functional magnetic resonance imaging data sets. J Cogn Neurosci 17:687–693. [DOI] [PubMed] [Google Scholar]
- Barkley RA, DuPaul GJ, McMurray MB (1990): Comprehensive evaluation of attention deficit disorder with and without hyperactivity as defined by research criteria. J Consult Clin Psychol 58:775–789. [DOI] [PubMed] [Google Scholar]
- Basser PJ, Jones DK (2002): Diffusion‐tensor MRI: theory, experimental design and data analysis—A technical review. NMR Biomed 15(7–8):456–467. [DOI] [PubMed] [Google Scholar]
- Basser PJ, Mattiello J, LeBihan D (1994): Estimation of the effective self‐diffusion tensor from the NMR spin echo. J Magn Reson B 103:247–254. [DOI] [PubMed] [Google Scholar]
- Basser PJ, Pajevic S, Pierpaoli C, Duda J, Aldroubi A (2000): In vivo fiber tractography using DT‐MRI data. Magn Reson Med 44:625–632. [DOI] [PubMed] [Google Scholar]
- Bazarian JJ, Zhong J, Blyth B, Zhu T, Kavcic V, Peterson D (2007): Diffusion tensor imaging detects clinically important axonal damage after mild traumatic brain injury: A pilot study. J Neurotrauma 24:1447–1459. [DOI] [PubMed] [Google Scholar]
- Beaulieu C (2002): The basis of anisotropic water diffusion in the nervous system—A technical review. NMR Biomed 15(7–8):435–455. [DOI] [PubMed] [Google Scholar]
- Belanger HG, Kretzmer T, Vanderploeg RD, French LM (2009): Symptom complaints following combat‐related traumatic brain injury: Relationship to traumatic brain injury severity and posttraumatic stress disorder. J Int Neuropsychol Soc:1–6. [DOI] [PubMed] [Google Scholar]
- Bendlin BB, Ries ML, Lazar M, Alexander AL, Dempsey RJ, Rowley HA, Sherman JE, Johnson SC (2008): Longitudinal changes in patients with traumatic brain injury assessed with diffusion‐tensor and volumetric imaging. Neuroimage 42:503–514. [DOI] [PMC free article] [PubMed] [Google Scholar]
- Benson RR, Meda SA, Vasudevan S, Kou Z, Govindarajan KA, Hanks RA, Millis SR, Makki M, Latif Z, Coplin W, Meythaler J, Haacke EM (2007): Global white matter analysis of diffusion tensor images is predictive of injury severity in traumatic brain injury. J Neurotrauma 24:446–459. [DOI] [PubMed] [Google Scholar]
- Bhattacharjee Y (2008): Neuroscience. Shell shock revisited: solving the puzzle of blast trauma. Science 319:406–408. [DOI] [PubMed] [Google Scholar]
- Blanchard EB, Jones‐Alexander J, Buckley TC, Forneris CA (1996): Psychometric properties of the PTSD Checklist (PCL). Behav Res Ther 34:669–673. [DOI] [PubMed] [Google Scholar]
- Blumberg HP (2007): Dimensions in the development of bipolar disorder. Biol Psychiatry 62:104–106. [DOI] [PubMed] [Google Scholar]
- Budde MD, Janes L, Gold E, Turtzo LC, Frank JA (2011): The contribution of gliosis to diffusion tensor anisotropy and tractography following traumatic brain injury: Validation in the rat using Fourier analysis of stained tissue sections. Brain 134(Part 8):2248–2260. [DOI] [PMC free article] [PubMed] [Google Scholar]
- Cader S, Johansen‐Berg H, Wylezinska M, Palace J, Behrens TE, Smith S, Matthews PM (2007): Discordant white matter N‐acetylasparate and diffusion MRI measures suggest that chronic metabolic dysfunction contributes to axonal pathology in multiple sclerosis. Neuroimage 36:19–27. [DOI] [PubMed] [Google Scholar]
- Camara E, Rodriguez‐Fornells A, Ye Z, Munte TF (2009): Reward networks in the brain as captured by connectivity measures. Front Neurosci 3:350–362. [DOI] [PMC free article] [PubMed] [Google Scholar]
- Caplan LJ, Ivins B, Poole JH, Vanderploeg RD, Jafee MS, Schwab K (2010): The structure of postconcussive symptoms in 3 US military samples. J Head Trauma Rehab 25:447–458. [Google Scholar]
- Cavanna AE, Trimble MR (2006): The precuneus: A review of its functional anatomy and behavioural correlates. Brain 129(Part 3):564–583. [DOI] [PubMed] [Google Scholar]
- Cernak I (2010): The importance of systemic response in the pathobiology of blast‐induced neurotrauma. Front Neurol 1:151. [DOI] [PMC free article] [PubMed] [Google Scholar]
- Cernak I, Vink R, Zapple DN, Cruz MI, Ahmed F, Chang T, Fricke ST, Faden AI (2004): The pathobiology of moderate diffuse traumatic brain injury as identified using a new experimental model of injury in rats. Neurobiol Dis 17:29–43. [DOI] [PubMed] [Google Scholar]
- Cernak I, Wang Z, Jiang J, Bian X, Savic J (2001): Ultrastructural and functional characteristics of blast injury‐induced neurotrauma. J Trauma 50:695–706. [DOI] [PubMed] [Google Scholar]
- Chavko M, Koller WA, Prusaczyk WK, McCarron RM (2007): Measurement of blast wave by a miniature fiber optic pressure transducer in the rat brain. J Neurosci Methods 159:277–281. [DOI] [PubMed] [Google Scholar]
- Chen YC, Smith DH, Meaney DF (2009): In‐vitro approaches for studying blast‐induced traumatic brain injury. J Neurotrauma 26:861–876. [DOI] [PMC free article] [PubMed] [Google Scholar]
- Cicerone KD, Kalmar K (1995): Persistent postconcussion syndrome: the structure of subjective complaints after mild traumatic brain injury. J Head Trauma Rehab 10:1–7. [Google Scholar]
- Cloots RJ, van Dommelen JA, Kleiven S, Geers MG (2013): Multi‐scale mechanics of traumatic brain injury: predicting axonal strains from head loads. Biomech Model Mechanobiol 12:137–150. [DOI] [PubMed] [Google Scholar]
- Connell S, Gao J, Chen J, Shi R (2011): Novel model to investigate blast injury in the central nervous system. J Neurotrauma 28:1229–1236. [DOI] [PubMed] [Google Scholar]
- Conners K (2002): Conner's continuous performance test II (CPT II). Toronto, Ontario, Canada: Multi‐Health Systems. [Google Scholar]
- Delis DC, Kaplan E, Kramer JH (2001): Delis‐Kaplan Executive Function System. San Antonio, Texas: The Psychological Corporation. [Google Scholar]
- Delis DC, Kramer JH, Kaplan E, Ober BA (2000): The California Verbal Learning Test Manual ‐ 2nd Edition (CVLT‐II). New York, NY: Psychological Corporation. [Google Scholar]
- Diagnostic and Statistical Manual of Mental Disorders. Fourth Edition. Washington, DC: American Psychiatric Association. [Google Scholar]
- Eonta SE, Carr W, McArdle JJ, Kain JM, Tate C, Wesensten NJ, Norris JN, Balkin TJ, Kamimori GH (2011): Automated Neuropsychological Assessment Metrics: Repeated assessment with two military samples. Aviat Space Environ Med 82:34–39. [DOI] [PubMed] [Google Scholar]
- Epstein JN, Erkanli A, Conners CK, Klaric J, Costello JE, Angold A (2003): Relations between Continuous Performance Test performance measures and ADHD behaviors. J Abnorm Child Psychol 31:543–554. [DOI] [PubMed] [Google Scholar]
- French LM (2010): Military traumatic brain injury: an examination of important differences. Ann NY Acad Sci 1208:38–45. [DOI] [PubMed] [Google Scholar]
- Gentry LR, Godersky JC, Thompson B (1988): MR imaging of head trauma: Review of the distribution and radiopathologic features of traumatic lesions. AJR Am J Roentgenol 150:663–672. [DOI] [PubMed] [Google Scholar]
- Gentry LR, Godersky JC, Thompson BH (1989): Traumatic brain stem injury: MR imaging. Radiology 171:177–187. [DOI] [PubMed] [Google Scholar]
- Haatveit BC, Sundet K, Hugdahl K, Ueland T, Melle I, Andreassen OA (2010): The validity of d prime as a working memory index: Results from the “Bergen n‐back task”. J Clin Exp Neuropsychol 32:871–880. [DOI] [PubMed] [Google Scholar]
- Hardman JM, Manoukian A (2002): Pathology of head trauma. Neuroimaging Clin N Am 12:175–187, vii. [DOI] [PubMed] [Google Scholar]
- Hesselink JR, Dowd CF, Healy ME, Hajek P, Baker LL, Luerssen TG (1988): MR imaging of brain contusions: a comparative study with CT. AJR Am J Roentgenol 150:1133–1142. [DOI] [PubMed] [Google Scholar]
- Hoge CW, Castro CA, Messer SC, McGurk D, Cotting DI, Koffman RL (2004): Combat duty in Iraq and Afghanistan, mental health problems, and barriers to care. N Engl J Med 351:13–22. [DOI] [PubMed] [Google Scholar]
- Hoge CW, Castro CA, Messer SC, McGurk D, Cotting DI, Koffman RL (2008): Combat duty in Iraq and Afghanistan, mental health problems and barriers to care. US Army Med Dep J 7–17. [PubMed] [Google Scholar]
- Hortobagyi T, Wise S, Hunt N, Cary N, Djurovic V, Fegan‐Earl A, Shorrock K, Rouse D, Al‐Sarraj S (2007): Traumatic axonal damage in the brain can be detected using beta‐APP immunohistochemistry within 35 min after head injury to human adults. Neuropathol Appl Neurobiol 33:226–237. [DOI] [PubMed] [Google Scholar]
- Huisman TA, Schwamm LH, Schaefer PW, Koroshetz WJ, Shetty‐Alva N, Ozsunar Y, Wu O, Sorensen AG (2004): Diffusion tensor imaging as potential biomarker of white matter injury in diffuse axonal injury. AJNR Am J Neuroradiol 25:370–376. [PMC free article] [PubMed] [Google Scholar]
- Iizuka H, Sakatani K, Young W (1989): Corticofugal axonal degeneration in rats after middle cerebral artery occlusion. Stroke 20:1396–1402. [DOI] [PubMed] [Google Scholar]
- Inglese M, Makani S, Johnson G, Cohen BA, Silver JA, Gonen O, Grossman RI (2005): Diffuse axonal injury in mild traumatic brain injury: A diffusion tensor imaging study. J Neurosurg 103:298–303. [DOI] [PubMed] [Google Scholar]
- Jack JJB, Noble D, Tsien RW. 1983. Electrical Current Flow in Excitable Cells. Oxford: Oxford University Press. [Google Scholar]
- Jenkinson M, Bannister P, Brady M, Smith S (2002): Improved optimization for the robust and accurate linear registration and motion correction of brain images. Neuroimage 17:825–841. [DOI] [PubMed] [Google Scholar]
- Jiang Q, Qu C, Chopp M, Ding GL, Davarani SP, Helpern JA, Jensen JH, Zhang ZG, Li L, Lu M, et al. (2011): MRI evaluation of axonal reorganization after bone marrow stromal cell treatment of traumatic brain injury. NMR Biomed 24:1119–1128. [DOI] [PMC free article] [PubMed] [Google Scholar]
- Kasahara K, Hashimoto K, Abo M, Senoo A (2012): Voxel‐ and atlas‐based analysis of diffusion tensor imaging may reveal focal axonal injuries in mild traumatic brain injury—Comparison with diffuse axonal injury. Magn Reson Imaging 30:496–505. [DOI] [PubMed] [Google Scholar]
- Kennedy JE, Leal FO, Lewis JD, Cullen MA, Amador RR (2010): Posttraumatic stress symptoms in OIF/OEF service members with blast‐related and non‐blast‐related mild TBI. NeuroRehabilitation 26:223–231. [DOI] [PubMed] [Google Scholar]
- Kocsis JD, Tessler A (2009): Pathology of blast‐related brain injury. J Rehabil Res Dev 46:667–672. [DOI] [PubMed] [Google Scholar]
- Kraus MF, Susmaras T, Caughlin BP, Walker CJ, Sweeney JA, Little DM (2007): White matter integrity and cognition in chronic traumatic brain injury: A diffusion tensor imaging study. Brain 130(Part 10):2508–2519. [DOI] [PubMed] [Google Scholar]
- Kumar R, Husain M, Gupta RK, Hasan KM, Haris M, Agarwal AK, Pandey CM, Narayana PA (2009): Serial changes in the white matter diffusion tensor imaging metrics in moderate traumatic brain injury and correlation with neuro‐cognitive function. J Neurotrauma 26:481–495. [DOI] [PubMed] [Google Scholar]
- Lange RT, Iverson GL, Brubacher JR, Madler B, Heran MK (2012): Diffusion tensor imaging findings are not strongly associated with postconcussional disorder 2 months following mild traumatic brain injury. J Head Trauma Rehabil 27:188–198. [DOI] [PubMed] [Google Scholar]
- Langlois JA, Rutland‐Brown W, Wald MM (2006): The epidemiology and impact of traumatic brain injury: a brief overview. J Head Trauma Rehabil 21:375–378. [DOI] [PubMed] [Google Scholar]
- Lazar M, Weinstein DM, Tsuruda JS, Hasan KM, Arfanakis K, Meyerand ME, Badie B, Rowley HA, Haughton V, Field A, et al. (2003): White matter tractography using diffusion tensor deflection. Hum Brain Mapp 18:306–321. [DOI] [PMC free article] [PubMed] [Google Scholar]
- Levin HS, Wilde E, Troyanskaya M, Petersen NJ, Scheibel R, Newsome M, Radaideh M, Wu T, Yallampalli R, Chu Z, et al. (2010): Diffusion tensor imaging of mild to moderate blast‐related traumatic brain injury and its sequelae. J Neurotrauma 27:683–694. [DOI] [PubMed] [Google Scholar]
- Ling G, Bandak F, Armonda R, Grant G, Ecklund J (2009): Explosive blast neurotrauma. J Neurotrauma 26:815–825. [DOI] [PubMed] [Google Scholar]
- Lipton ML, Gulko E, Zimmerman ME, Friedman BW, Kim M, Gellella E, Gold T, Shifteh K, Ardekani BA, Branch CA (2009): Diffusion‐tensor imaging implicates prefrontal axonal injury in executive function impairment following very mild traumatic brain injury. Radiology 252:816–824. [DOI] [PubMed] [Google Scholar]
- Lipton ML, Kim N, Park YK, Hulkower MB, Gardin TM, Shifteh K, Kim M, Zimmerman ME, Lipton RB, Branch CA (2012): Robust detection of traumatic axonal injury in individual mild traumatic brain injury patients: Intersubject variation, change over time and bidirectional changes in anisotropy. Brain Imaging Behav 6:329–342. [DOI] [PubMed] [Google Scholar]
- Liston C, Watts R, Tottenham N, Davidson MC, Niogi S, Ulug AM, Casey BJ (2006): Frontostriatal microstructure modulates efficient recruitment of cognitive control. Cereb Cortex 16:553–560. [DOI] [PubMed] [Google Scholar]
- Luo AH, Tahsili‐Fahadan P, Wise RA, Lupica CR, Aston‐Jones G (2011): Linking context with reward: a functional circuit from hippocampal CA3 to ventral tegmental area. Science 333:353–357. [DOI] [PMC free article] [PubMed] [Google Scholar]
- Mac Donald CL, Johnson AM, Cooper D, Nelson EC, Werner NJ, Shimony JS, Snyder AZ, Raichle ME, Witherow JR, Fang R, et al. (2011): Detection of blast‐related traumatic brain injury in U.S. military personnel. N Engl J Med 364:2091–2100. [DOI] [PMC free article] [PubMed] [Google Scholar]
- Madden DJ, Whiting WL, Huettel SA, White LE, MacFall JR, Provenzale JM (2004): Diffusion tensor imaging of adult age differences in cerebral white matter: Relation to response time. Neuroimage 21:1174–1181. [DOI] [PubMed] [Google Scholar]
- Margolis EB, Lock H, Hjelmstad GO, Fields HL (2006): The ventral tegmental area revisited: Is there an electrophysiological marker for dopaminergic neurons? J Physiol 577(Part 3):907–924. [DOI] [PMC free article] [PubMed] [Google Scholar]
- Matsushita M, Hosoda K, Naitoh Y, Yamashita H, Kohmura E (2011): Utility of diffusion tensor imaging in the acute stage of mild to moderate traumatic brain injury for detecting white matter lesions and predicting long‐term cognitive function in adults. J Neurosurg 115:130–139. [DOI] [PubMed] [Google Scholar]
- Mayer AR, Ling J, Mannell MV, Gasparovic C, Phillips JP, Doezema D, Reichard R, Yeo RA (2010): A prospective diffusion tensor imaging study in mild traumatic brain injury. Neurology 74:643–650. [DOI] [PMC free article] [PubMed] [Google Scholar]
- Messe A, Caplain S, Paradot G, Garrigue D, Mineo JF, Soto Ares G, Ducreux D, Vignaud F, Rozec G, Desal H, et al. (2011): Diffusion tensor imaging and white matter lesions at the subacute stage in mild traumatic brain injury with persistent neurobehavioral impairment. Hum Brain Mapp 32:999–1011. [DOI] [PMC free article] [PubMed] [Google Scholar]
- Miles L, Grossman RI, Johnson G, Babb JS, Diller L, Inglese M (2008): Short‐term DTI predictors of cognitive dysfunction in mild traumatic brain injury. Brain Inj 22:115–122. [DOI] [PubMed] [Google Scholar]
- Mori S, Crain BJ, Chacko VP, van Zijl PC (1999): Three‐dimensional tracking of axonal projections in the brain by magnetic resonance imaging. Ann Neurol 45:265–269. [DOI] [PubMed] [Google Scholar]
- Mori S, Oishi K, Jiang H, Jiang L, Li X, Akhter K, Hua K, Faria AV, Mahmood A, Woods R, et al. (2008): Stereotaxic white matter atlas based on diffusion tensor imaging in an ICBM template. Neuroimage 40:570–582. [DOI] [PMC free article] [PubMed] [Google Scholar]
- Mori S, van Zijl PC (2002): Fiber tracking: principles and strategies—A technical review. NMR Biomed 15 (7–8):468–480. [DOI] [PubMed] [Google Scholar]
- Mukherjee P, Chung SW, Berman JI, Hess CP, Henry RG (2008): Diffusion tensor MR imaging and fiber tractography: technical considerations. AJNR Am J Neuroradiol 29:843–852. [DOI] [PMC free article] [PubMed] [Google Scholar]
- Nichols TE, Holmes AP (2002): Nonparametric permutation tests for functional neuroimaging: A primer with examples. Hum Brain Mapp 15:1–25. [DOI] [PMC free article] [PubMed] [Google Scholar]
- Niogi SN, Mukherjee P (2010): Diffusion tensor imaging of mild traumatic brain injury. J Head Trauma Rehabil 25:241–255. [DOI] [PubMed] [Google Scholar]
- Niogi SN, Mukherjee P, Ghajar J, Johnson C, Kolster RA, Sarkar R, Lee H, Meeker M, Zimmerman RD, Manley GT, et al. (2008): Extent of microstructural white matter injury in postconcussive syndrome correlates with impaired cognitive reaction time: A 3T diffusion tensor imaging study of mild traumatic brain injury. AJNR Am J Neuroradiol 29:967–973. [DOI] [PMC free article] [PubMed] [Google Scholar]
- O'Bryant SE, Gavett BE, McCaffrey RJ, O'Jile JR, Huerkamp JK, Smitherman TA, Humphreys JD (2008): Clinical utility of Trial 1 of the Test of Memory Malingering (TOMM). Appl Neuropsychol 15:113–116. [DOI] [PubMed] [Google Scholar]
- Oishi K, Faria A, Jiang H, Li X, Akhter K, Zhang J, Hsu JT, Miller MI, van Zijl PC, Albert M, et al. (2009): Atlas‐based whole brain white matter analysis using large deformation diffeomorphic metric mapping: application to normal elderly and Alzheimer's disease participants. Neuroimage 46:486–499. [DOI] [PMC free article] [PubMed] [Google Scholar]
- Oishi K, Toma K, Bagarinao ET, Matsuo K, Nakai T, Chihara K, Fukuyama H (2005): Activation of the precuneus is related to reduced reaction time in serial reaction time tasks. Neurosci Res 52:37–45. [DOI] [PubMed] [Google Scholar]
- Okie S. (2005): Traumatic brain injury in the war zone. N Engl J Med 352:2043–2047. [DOI] [PubMed] [Google Scholar]
- Palacios EM, Fernandez‐Espejo D, Junque C, Sanchez‐Carrion R, Roig T, Tormos JM, Bargallo N, Vendrell P (2011): Diffusion tensor imaging differences relate to memory deficits in diffuse traumatic brain injury. BMC Neurol 11:24. [DOI] [PMC free article] [PubMed] [Google Scholar]
- Palmer HS, Garzon B, Xu J, Berntsen EM, Skandsen T, Haberg AK (2010): Reduced fractional anisotropy does not change the shape of the hemodynamic response in survivors of severe traumatic brain injury. J Neurotrauma 27:853–862. [DOI] [PubMed] [Google Scholar]
- Papez JW (1995): A proposed mechanism of emotion. 1937. J Neuropsychiatry Clin Neurosci 7:103–112. [DOI] [PubMed] [Google Scholar]
- Parizel PM, Ozsarlak, Van Goethem JW, van den Hauwe L, Dillen C, Verlooy J, Cosyns P, De Schepper AM (1998): Imaging findings in diffuse axonal injury after closed head trauma. Eur Radiol 8:960–965. [DOI] [PubMed] [Google Scholar]
- Parizel PM, Van Goethem JW, Ozsarlak O, Maes M, Phillips CD (2005): New developments in the neuroradiological diagnosis of craniocerebral trauma. Eur Radiol 15:569–581. [DOI] [PubMed] [Google Scholar]
- Peng H, Orlichenko A, Dawe RJ, Agam G, Zhang S, Arfanakis K (2009): Development of a human brain diffusion tensor template. Neuroimage 46:967–980. [DOI] [PMC free article] [PubMed] [Google Scholar]
- Pierpaoli C, Barnett A, Pajevic S, Chen R, Penix LR, Virta A, Basser P (2001): Water diffusion changes in Wallerian degeneration and their dependence on white matter architecture. Neuroimage 13(Part 1):1174–1185. [DOI] [PubMed] [Google Scholar]
- Pierpaoli C, Basser PJ (1996): Toward a quantitative assessment of diffusion anisotropy. Magn Reson Med 36:893–906. [DOI] [PubMed] [Google Scholar]
- Pierpaoli C, Jezzard P, Basser PJ, Barnett A, Di Chiro G (1996): Diffusion tensor MR imaging of the human brain. Radiology 201:637–648. [DOI] [PubMed] [Google Scholar]
- Raine A, Yang Y (2006): Neural foundations to moral reasoning and antisocial behavior. Soc Cogn Affect Neurosci 1:203–213. [DOI] [PMC free article] [PubMed] [Google Scholar]
- Reeves DL, Winter KP, Bleiberg J, Kane RL (2007): ANAM genogram: historical perspectives, description, and current endeavors. Arch Clin Neuropsychol 22:S15–S37. [DOI] [PubMed] [Google Scholar]
- Ruff RL, II RGR, Ruff SS (2010): Relationships between mild traumatic brain injury sustained in combat and post‐traumatic stress disorder. Med Rep 2:64–68. [DOI] [PMC free article] [PubMed] [Google Scholar]
- Rutgers DR, Toulgoat F, Cazejust J, Fillard P, Lasjaunias P, Ducreux D (2008): White matter abnormalities in mild traumatic brain injury: A diffusion tensor imaging study. AJNR Am J Neuroradiol 29:514–519. [DOI] [PMC free article] [PubMed] [Google Scholar]
- Saljo A, Bao F, Shi J, Hamberger A, Hansson HA, Haglid KG (2002): Expression of c‐Fos and c‐Myc and deposition of beta‐APP in neurons in the adult rat brain as a result of exposure to short‐lasting impulse noise. J Neurotrauma 19:379–385. [DOI] [PubMed] [Google Scholar]
- Salmond CH, Chatfield DA, Menon DK, Pickard JD, Sahakian BJ (2005): Cognitive sequelae of head injury: involvement of basal forebrain and associated structures. Brain 128(Part 1):189–200. [DOI] [PubMed] [Google Scholar]
- Scheid R, Preul C, Gruber O, Wiggins C, von Cramon DY (2003): Diffuse axonal injury associated with chronic traumatic brain injury: Evidence from T2*‐weighted gradient‐echo imaging at 3 T. AJNR Am J Neuroradiol 24:1049–1056. [PMC free article] [PubMed] [Google Scholar]
- Schuff N, Zhang Y, Zhan W, Lenoci M, Ching C, Boreta L, Mueller SG, Wang Z, Marmar CR, Weiner MW, et al. (2011): Patterns of altered cortical perfusion and diminished subcortical integrity in posttraumatic stress disorder: An MRI study. Neuroimage 54:S62–S68. [DOI] [PMC free article] [PubMed] [Google Scholar]
- Shaw NA (2002): The neurophysiology of concussion. Prog Neurobiol 67:281–344. [DOI] [PubMed] [Google Scholar]
- Sheline YI (2003): Neuroimaging studies of mood disorder effects on the brain. Biol Psychiatry 54:338–352. [DOI] [PubMed] [Google Scholar]
- Shenton ME, Hamoda HM, Schneiderman JS, Bouix S, Pasternak O, Rathi Y, Vu MA, Purohit MP, Helmer K, Koerte I, et al. (2012): A review of magnetic resonance imaging and diffusion tensor imaging findings in mild traumatic brain injury. Brain Imaging Behav 6:137–192. [DOI] [PMC free article] [PubMed] [Google Scholar]
- Shirer WR, Ryali S, Rykhlevskaia E, Menon V, Greicius MD (2012): Decoding subject‐driven cognitive states with whole‐brain connectivity patterns. Cereb Cortex 22:158–165. [DOI] [PMC free article] [PubMed] [Google Scholar]
- Singh M, Jeong J, Hwang D, Sungkarat W, Gruen P (2010): Novel diffusion tensor imaging methodology to detect and quantify injured regions and affected brain pathways in traumatic brain injury. Magn Reson Imaging 28:22–40. [DOI] [PMC free article] [PubMed] [Google Scholar]
- Smith SM (2002): Fast robust automated brain extraction. Hum Brain Mapp 17:143–155. [DOI] [PMC free article] [PubMed] [Google Scholar]
- Smith SM, Nichols TE (2009): Threshold‐free cluster enhancement: Addressing problems of smoothing, threshold dependence and localisation in cluster inference. Neuroimage 44:83–98. [DOI] [PubMed] [Google Scholar]
- Smith SM, Jenkinson M, Woolrich MW, Beckmann CF, Behrens TE, Johansen‐Berg H, Bannister PR, De Luca M, Drobnjak I, Flitney DE, et al. (2004): Advances in functional and structural MR image analysis and implementation as FSL. Neuroimage 23:S208–S219. [DOI] [PubMed] [Google Scholar]
- Smith SM, Jenkinson M, Johansen‐Berg H, Rueckert D, Nichols TE, Mackay CE, Watkins KE, Ciccarelli O, Cader MZ, Matthews PM, et al. (2006): Tract‐based spatial statistics: Voxelwise analysis of multi‐subject diffusion data. Neuroimage 31:1487–1505. [DOI] [PubMed] [Google Scholar]
- Song SK, Sun SW, Ju WK, Lin SJ, Cross AH, Neufeld AH (2003): Diffusion tensor imaging detects and differentiates axon and myelin degeneration in mouse optic nerve after retinal ischemia. Neuroimage 20:1714–1722. [DOI] [PubMed] [Google Scholar]
- Stuss DT (2011): Traumatic brain injury: Relation to executive dysfunction and the frontal lobes. Curr Opin Neurol 24:584–589. [DOI] [PubMed] [Google Scholar]
- Sullivan EV, Harding AJ, Pentney R, Dlugos C, Martin PR, Parks MH, Desmond JE, Chen SH, Pryor MR, De Rosa E, et al. (2003): Disruption of frontocerebellar circuitry and function in alcoholism. Alcoholism Clin Exp Res 27:301–309. [DOI] [PubMed] [Google Scholar]
- Taber KH, Warden DL, Hurley RA (2006): Blast‐related traumatic brain injury: What is known? J Neuropsychiatry Clin Neurosci 18:141–145. [DOI] [PubMed] [Google Scholar]
- Tang CY, Eaves EL, Ng JC, Carpenter DM, Mai X, Schroeder DH, Condon CA, Colom R, Haier RJ (2010): Brain networks for working memory and factors of intelligence assessed in males and females with fMRI and DTI. Intelligence 38:293–303. [Google Scholar]
- Thiebaut de Schotten M, Ffytche DH, Bizzi A, Dell'Acqua F, Allin M, Walshe M, Murray R, Williams SC, Murphy DG, Catani M (2011): Atlasing location, asymmetry and inter‐subject variability of white matter tracts in the human brain with MR diffusion tractography. Neuroimage 54:49–59. [DOI] [PubMed] [Google Scholar]
- Thomalla G, Glauche V, Weiller C, Rother J (2005): Time course of wallerian degeneration after ischaemic stroke revealed by diffusion tensor imaging. J Neurol Neurosurg Psychiatry 76:266–268. [DOI] [PMC free article] [PubMed] [Google Scholar]
- Tombaugh TN (1996): TOMM: Test of Memory Malingering. North Tonawanda, NY: Multi‐Health Systems. [Google Scholar]
- Tuch DS, Reese TG, Wiegell MR, Wedeen VJ (2003): Diffusion MRI of complex neural architecture. Neuron 40:885–895. [DOI] [PubMed] [Google Scholar]
- Tuch DS, Salat DH, Wisco JJ, Zaleta AK, Hevelone ND, Rosas HD (2005): Choice reaction time performance correlates with diffusion anisotropy in white matter pathways supporting visuospatial attention. Proc Natl Acad Sci USA 102:12212–12217. [DOI] [PMC free article] [PubMed] [Google Scholar]
- Turken A, Whitfield‐Gabrieli S, Bammer R, Baldo JV, Dronkers NF, Gabrieli JD (2008): Cognitive processing speed and the structure of white matter pathways: convergent evidence from normal variation and lesion studies. Neuroimage 42:1032–1044. [DOI] [PMC free article] [PubMed] [Google Scholar]
- Viano DC, Casson IR, Pellman EJ, Zhang L, King AI, Yang KH (2005): Concussion in professional football: Brain responses by finite element analysis: part 9. Neurosurgery 57:891–916; discussion 891–916. [DOI] [PubMed] [Google Scholar]
- Warden D (2006): Military TBI during the Iraq and Afghanistan wars. J Head Trauma Rehabil 21:398–402. [DOI] [PubMed] [Google Scholar]
- Warden DL, French LM, Shupenko L, Fargus J, Riedy G, Erickson ME, Jaffee MS, Moore DF (2009): Case report of a soldier with primary blast brain injury Neuroimage 47:T152–T153. [DOI] [PubMed] [Google Scholar]
- Wechsler D (1997a): Wechsler adult intelligence scale III. San Antonio,TX: Harcourt Assessment. [Google Scholar]
- Wechsler D (1997b): Wechsler Adult Intelligence Scale: Administration and scoring manual. San Antonio, TX: The Psychological Corporation. [Google Scholar]
- Wiegell MR, Larsson HB, Wedeen VJ (2000): Fiber crossing in human brain depicted with diffusion tensor MR imaging. Radiology 217:897–903. [DOI] [PubMed] [Google Scholar]
- Wilde EA, McCauley SR, Hunter JV, Bigler ED, Chu Z, Wang ZJ, Hanten GR, Troyanskaya M, Yallampalli R, Li X, et al. (2008): Diffusion tensor imaging of acute mild traumatic brain injury in adolescents. Neurology 70:948–955. [DOI] [PubMed] [Google Scholar]
- Worsley KJ, Marrett S, Neelin P, Vandal AC, Friston KJ, Evans AC (1996): A unified statistical approach for determining significant signals in images of cerebral activation. Hum Brain Mapp 4:58–73. [DOI] [PubMed] [Google Scholar]
- Writer BW, Schillerstrom JE, Regwan HK, Harlan BS (2010): Executive clock drawing correlates with performance‐based functional status in people with combat‐related mild traumatic brain injury and comorbid posttraumatic stress disorder. J Rehabil Res Dev 47:841–850. [DOI] [PubMed] [Google Scholar]
- Yeh PH, Oakes TR, Riedy G (2012): Diffusion tensor imaging and its application to traumatic brain injury: Basic principles and recent advances. Open J Med Imaging 2:137–161. [Google Scholar]
- Yeh PH, Simpson K, Durazzo TC, Gazdzinski S, Meyerhoff DJ (2009): Tract‐Based Spatial Statistics (TBSS) of diffusion tensor imaging data in alcohol dependence: Abnormalities of the motivational neurocircuitry. Psychiatry Res 173:22–30. [DOI] [PMC free article] [PubMed] [Google Scholar]
- Yeh PH, Zhu H, Nicoletti MA, Hatch JP, Brambilla P, Soares JC (2010): Structural equation modeling and principal component analysis of gray matter volumes in major depressive and bipolar disorders: differences in latent volumetric structure. Psychiatry Res 184:177–185. [DOI] [PMC free article] [PubMed] [Google Scholar]
- Yushkevich PA, Zhang H, Simon TJ, Gee JC (2008): Structure‐specific statistical mapping of white matter tracts. Neuroimage 41:448–461. [DOI] [PMC free article] [PubMed] [Google Scholar]
- Zhang H, Yushkevich PA, Gee JC (2005): Deformable registration of diffusion tensor MR images with explicit orientation optimization. Med Image Comput Comput Assist Interv 8(Part 1):172–179. [DOI] [PubMed] [Google Scholar]
- Zhang S, Peng H, Dawe RJ, Arfanakis K (2011): Enhanced ICBM diffusion tensor template of the human brain. Neuroimage 54:974–984. [DOI] [PMC free article] [PubMed] [Google Scholar]
Associated Data
This section collects any data citations, data availability statements, or supplementary materials included in this article.
Supplementary Materials
Supplementary Information