

Abstract
The brain of congenital blind (CB) has experienced a series of structural and functional alterations, either undesirable outcomes such as atrophy of the visual pathway due to sight loss from birth, or compensatory plasticity to interact efficiently with the environment. However, little is known, so far, about alterations in the functional architecture of resting‐state networks (RSNs) in CB. This study aimed to investigate intra‐ and internetwork connectivity differences between CB and sighted controls (SC), using independent component analysis (ICA) on resting state functional MRI data. Compared with SC, CB showed significantly increased network connectivity within the salience network (SN) and the occipital cortex. Moreover, CB exhibited enhanced internetwork connectivity between the SN and the frontoparietal network (FPN) and between the FPN and the occipital cortex; however, they showed decreased internetwork connectivity between the occipital cortex and the sensorimotor network. These findings suggest that CB experience large scale reorganization at the level of the functional network. More importantly, the enhanced intra‐ and internetwork connectivity of the SN, FPN, and occipital cortex in CB may improve their abilities to identify salient stimuli, to initiate the executive function, and to top‐down control of attention, which are critical for the CB to guide appropriate behavior and to better adaption to the environment. Hum Brain Mapp 35:2573–2581, 2014. © 2013 Wiley Periodicals, Inc.
Keywords: congenital blind, resting‐state network, MRI, independent component analysis
INTRODUCTION
Congenital blind (CB) lost their sight from birth and they have to make major adjustments to interact effectively with the environment. The occipital cortex that serves processing of visual information in sighted controls (SC) has experienced a series of structural and functional alterations in CB, including decreased gray/white matter volume (Bridge et al., 2009; Lepore et al., 2010; Ptito et al., 2008) and white matter integrity (Shimony et al., 2006), increased cortical thickness (Jiang et al., 2009; Park et al., 2009), regional brain activity as measured by regional homogeneity (ReHo) (Liu et al., 2011), and glucose metabolism as measured by positron emission tomography (PET) (Veraart et al., 1990). Interestingly, task‐based functional MRI (fMRI) has revealed that the occipital cortex of the early blind shifts its function to process tactile (Burton et al., 2006) and auditory information (Poirier et al., 2006) and to engage in many higher‐level cognitive functions (Amedi et al., 2003; Burton and McLaren, 2006), although preserved functional organization has been found in several higher‐tier visual areas (Reich et al., 2011; Ricciardi et al., 2007). Beyond the occipital cortex, several other brain areas also show alterations, such as increased white matter volume underlying the sensorimotor cortex (Noppeney et al., 2005), increased white matter integrity in the corticospinal tract (Yu et al., 2007), as well as the increase of the corticocortical (Kupers et al., 2006), thalamocortical (Karlen et al., 2006) and intracortical (Callaway and Katz, 1991) connections. These findings suggest that early visual deprivation results in widely distributed structural and functional changes in the brain rather than the dysfunction of a single brain area.
Traditionally, resting‐state functional connectivity (rsFC) focused upon constructing cross‐correlation maps of the chosen seed regions of interest with the other brain regions, which reflects the temporal coherence of low frequency fluctuations of BOLD signals between every two spatially remote brain areas (Biswal et al., 1995; Biswal et al., 1997; Cordes et al., 2002). It has been used to investigate the functional changes in early blind individuals, and found decreased rsFC between occipital and sensorimotor areas and increased rsFC between occipital and frontal areas (Liu et al., 2007; Yu et al., 2008). Although this approach can find altered rsFC between two brain areas, it cannot answer how the intra‐ and internetwork connectivity is altered in the brain. Thus, a better understanding of the neurobiology of congenital blindness would require investigations at the level of the brain network.
During resting‐state, it has been suggested that the brain is organized into multiple resting‐state networks (RSNs) (Damoiseaux et al., 2006; De Luca et al., 2006), which can be identified by independent component analysis (ICA) on resting state fMRI data. Investigations on the intra‐ and internetwork connectivity have largely improved our understanding on the large scale functional organization in normal and abnormal brains (Buckner and Vincent, 2007; Fox and Raichle, 2007; Greicius et al., 2004). However, little is known, so far, about alterations in the functional connectivity within and between RSNs in CB. We hypothesize that the intra‐network FCs may be altered at least in the VN in the CB because of the altered structural and functional characteristics of the occipital cortex in the CB (Bridge et al., 2009; Jiang et al., 2009; Lepore et al., 2010; Park et al., 2009; Ptito et al., 2008; Shimony et al., 2006; Veraart et al., 1990). We also hypothesize that the VN‐related inter‐network FCs may be altered in the CB because the altered rsFCs have been reported between the visual cortex and brain regions belonging to other RSNs in the CB (Liu et al., 2007; Yu et al., 2008). This kind of study will largely improve our understanding on the impairment and compensatory plasticity in CB at the level of the large scale functional network. In the present study, we used an ICA‐based RSN analysis to test the hypothesis that both intra‐ and inter‐network functional connectivity are altered in CB.
MATERIALS AND METHODS
Subjects
Thirty seven CB and 76 sighted controls (SC) participated in this experiment after giving written informed consent in accordance with the Medical Research Ethics Committee of Tianjin Medical University. One sighted subject was excluded due to excessive head motion; thus 37 CB (23 males, mean age 24.5 ± 4.9 years) and 75 SC (52 males, mean age 27.8 ± 7.6 years) were finally included. There was significant group difference in age [T (110) = −2.43, P = 0.017], but not in gender [χ 2(1) = 0.58, P = 0.45] (Table 1). All CB subjects had lost their sight since birth, and 20 of them had weak light perception (Table 2). None of the CB subjects had a history of normal vision, and none had memories of visual experience.
Table 1.
Demographic information and head motion of participants
| CB | SC | P value | |
|---|---|---|---|
| Number of subjects | 37 | 75 | |
| Age (years) | 24.5 (4.9) | 27.8 (7.6) | 0.017 |
| Sex (male/female) | 23/14 | 52/23 | 0.45 |
| FD | 0.15(0.07) | 0.15(0.06) | 0.77 |
The data are shown as the means (SD); CB, congenital blind; FD, framewise displacement; SC, sighted control.
Table 2.
Demographic information of congenital blind subjects
| Subjects | Gender | Age (years) | Light perception | Causes of blindness |
|---|---|---|---|---|
| CB001 | M | 28 | Weak | Retinal dysplasia |
| CB002 | F | 28 | Weak | Retinal pigmentosa |
| CB003 | F | 27 | None | Optic nerve atrophy |
| CB004 | M | 23 | Weak | Fundus oculi illness |
| CB005 | M | 24 | None | Eyeball dysplasia |
| CB006 | F | 27 | Weak | Retinal pigmentosa |
| CB007 | F | 20 | None | Unknown |
| CB008 | M | 22 | None | Retinal dystrophia |
| CB009 | M | 30 | Weak | Congenital cataract |
| CB010 | M | 22 | Weak | Congenital cataract |
| CB011 | M | 27 | None | Optic nerve atrophy |
| CB012 | F | 20 | None | Microphthalmus |
| CB013 | M | 23 | Weak | Unknown |
| CB014 | M | 39 | None | Microphthalmus |
| CB015 | M | 36 | Weak | Hypoplasia of fundus oculi |
| CB016 | M | 29 | Weak | Unknown |
| CB017 | F | 21 | Weak | Hypoplasia of fundus oculi |
| CB018 | M | 31 | Weak | Congenital microphthalmus |
| CB019a | F | 27 | None | Hypoplasia of fundus oculi |
| CB020 | F | 27 | None | Congenital cataract |
| CB021 | M | 28 | None | Hypoplasia of fundus oculi |
| CB022 | F | 23 | None | Retinitis pigmentosa |
| CB023 | M | 21 | None | Retinitis pigmentosa |
| CB024 | M | 21 | None | Optic nerve atrophy |
| CB025 | M | 25 | None | Optic nerve atrophy |
| CB026 | M | 19 | Weak | Retinitis pigmentosa |
| CB027 | M | 25 | Weak | Retinitis pigmentosa |
| CB028 | F | 24 | Weak | Optic hypoplasia |
| CB029 | M | 22 | None | Congenital glaucoma |
| CB030 | M | 29 | None | Optic nerve hypoplasia |
| CB031 | M | 23 | None | Congenital glaucoma |
| CB032 | F | 27 | Weak | Optic nerve atrophy |
| CB033 | F | 16 | Weak | Optic nerve atrophy |
| CB034 | F | 18 | Weak | Retinitis pigmentosa |
| CB035 | F | 22 | None | Congenital cataract |
| CB036 | F | 22 | Weak | Congenital glaucoma |
| CB037a | M | 21 | Weak | Congenital glaucoma |
| CB038 | M | 19 | None | Optic nerve hypoplasia |
| CB039 | M | 19 | None | Retrolental fibroplasia |
These two CB subjects were excluded from rest‐state functional connectivity analysis for excessive head motion. CB, congenital blind.
MRI Data Acquisition
MRI data were obtained using a 3.0‐Tesla MR scanner (Trio Tim system; Siemens, Erlangen, Germany) with a 12‐channel head coil. Tight but comfortable foam padding was used to minimize head movement, and earplugs were used to reduce scanner noise. The resting‐state fMRI data were obtained with a gradient‐echo echo‐planar imaging (GRE‐EPI) sequence. The acquisition parameters included: TR/TE = 2,000/30 ms, flip angle = 90°, matrix = 64 × 64, FOV = 220 mm × 220 mm, 32 axial slices with a 3‐mm slice thickness and a 1‐mm gap. The fMRI data was scanned for 6 minutes with each functional run of 180 continuous volumes. During the fMRI scans, all subjects were instructed to keep their eyes closed, to stay as still as possible, to think of nothing in particular and to not fall asleep.
Data Preprocessing
The resting‐state fMRI data were preprocessed using Statistical Parametric Mapping (SPM8, http://www.fil.ion.ucl.ac.uk/spm). The first 10 volumes of each functional time series were discarded due to the signals reaching equilibrium and the participants adapting to the scanning noise. The remaining 170 vol were corrected for the acquisition time delay between different slices and realigned to the first volume. Head movement parameters were computed by estimating the translation in each direction and the angular rotation on each axis for each volume and the translational or rotational parameters of all subjects were within 2 mm or 2 degrees. Considering that small amounts of head motion from volume to volume could influence the functional connectivity results (Power et al., 2012a), we also calculated framewise displacement (FD), which indexes volume‐to‐volume changes in head position. The FD was obtained from the derivatives of the rigid body realignment estimates that are used to realign fMRI data (Power et al., 2012a). We checked the FD of every subject and found one sighted subject with a FD of > 0.5. This subject was then excluded from further analyses. Although there were no significant (P = 0.77) differences in FD between the CB and SC groups (Table 1), we still used the mean FD of each subject as a nuisance covariate in the following analyses. Following this step, each image was normalized with the Montreal Neurological Institute (MNI) EPI template image and resampled to 3‐mm cubic voxels; The normalized fMRI data were smoothed with 6‐mm full width at half maximum (FWHM). We also used a linear regression process for further regressing out the linear drift.
Independent Component Analysis
The ICA was performed employing a group ICA model for fMRI data (GIFT) (http://icatb.sourceforge.net/, version 1.3h) with three distinct stages: (i) data reduction, (ii) application of the ICA algorithm, and (iii) back reconstruction for each individual subject (Calhoun et al., 2001; Schmithorst and Holland, 2004). A three‐step principal component analysis (PCA) was used to decompose the data set into 30 components. Subsequently, the Informax algorithm (Bell and Sejnowski, 1995) was used in IC estimation. In the back reconstruction step, the group ICA 3 (GICA3) approach, which has been shown to be a test‐retest reliable method to explore ICs (Erhardt et al., 2011), was used to back‐reconstruct the individual subject components. After back‐reconstruction, the IC time‐courses and spatial maps for each participant were acquired and the subject‐specific spatial maps were transformed to z scores. Upon visual inspection, eleven meaningful components were identified and represented functionally relevant RSNs as described previously (Beckmann et al., 2005, 2009; Beckmann and Smith, 2005; Damoiseaux et al., 2006; De Luca et al., 2006; Mantini et al., 2007). IC patterns representing RSNs were entered into a random‐effect one‐sample t test in SPM8. To improve the representativeness of each RSN, we used t > 15 to select voxels of a component. Then, a two‐sample t test was used to compare the synchronization differences within each network between the CB and SC with FD, gender and age as nuisance covariates. Multiple comparisons were corrected using a false discovery rate (FDR) method with a statistical threshold of q < 0.05 and a cluster size of >15 voxels.
Analyses of the Functional Network Connectivity
In spatial aspect, the ICs are maximally independent, however; in temporal aspect the time courses are not independent and can exhibit considerable temporal dependencies which are significant among components. In contrast to functional connectivity analysis that focused on the correlation between a single seed region and the other brain regions, we focused upon the temporal correlation among different RSNs estimated from ICA. The time‐courses of each RSN were extracted from the ICA procedure, which was then normalized with Fisher r‐to‐z transformation. Then, the time‐courses of each pair of the 11 RSNs were used to calculate the temporal correlation, namely functional network connectivity (FNC). A two‐sample t test was used to compare group differences in the FNCs with a threshold of P < 0.005 (uncorrected).
RESULTS
Resting‐State Networks
A total of 30 components were estimated by the ICA. Eleven of these components coincided with RSNs described in previous studies (Beckmann et al., 2005, 2009; Beckmann and Smith, 2005; Damoiseaux et al., 2006; De Luca et al., 2006; Mantini et al., 2007). These 11 RSNs are shown in Figure 1. The default mode network (DMN) was mainly composed of the posterior cingulate cortex and precuneus (PCC/Pcu), the medial prefrontal and anterior cingulate cortices (MPFC/ACC), and the bilateral lateral parietal cortices (LPC) (Buckner et al., 2008; Fox et al., 2005; Greicius et al., 2004; Raichle et al., 2001) (Fig. 1A). The left and right frontoparietal networks (FPN) are shown in Figure 1B,C, whose key nodes consisted of the dorsolateral prefrontal cortex (DLPFC) and posterior parietal cortex (PPC). Figure 1D–F show the sensorimotor network (SMN) including the bilateral precentral and postcentral gyri, and supplementary motor areas. Figure 1G–I correspond to the striate part (VN1), ventral part (VN2), and dorsal part (VN3) of the visual network (VN), respectively. The salience network (SN) includes the bilateral ventrolateral prefrontal cortex (VLPFC), anterior insula (AI), and the dorsal anterior cingulate cortex (dACC) (Beckmann et al., 2005; Fox et al., 2006; Greicius et al., 2003; Seeley et al., 2007) (Fig. 1J). The auditory network (AN) primarily includes the bilateral superior temporal cortex (Fig. 1K).
Figure 1.
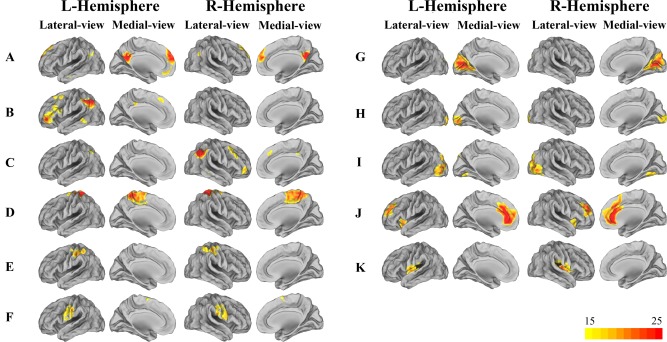
Cortical representation of brain networks identified in an independent component analysis. (A) Default‐mode network (DMN); (B) Left frontoparietal networks (LFPN); (C) Right frontoparietal networks (RFPN); (D–F) sensorimotor network (SMN); (G–I) Visual network (VN); (J) Salience network (SN); (K) Audio network (AN). Color bar represents the t values ranging from 15 to 25. Data are displayed on the lateral, medial surfaces of each hemisphere. [Color figure can be viewed in the online issue, which is available at http://wileyonlinelibrary.com.]
Altered Synchronization of RSN in CB
After regressing out the effects of FD, gender and age, in the SN, compared with SC, CB showed a significantly increased synchronization in the right frontoinsular cortex (FIC; peak MNI coordinates: x = 45, y = 21, z = 6) and the bilateral ventrolateral prefrontal regions (left: x = −12, y = 57, z = 12; right: x = 18, y = 57, z = 24) (q < 0.05, FDR corrected) (Fig. 2A). Moreover, CB also showed significantly increased synchronization in the ventral part of the VN bilaterally (x = −9, y = −84, z = −9) (q < 0.05, FDR corrected) (Fig. 2A). No brain regions showed a significant decrease in synchronization in the SN or VN in the CB group relative to the SC group. There are no significant group differences (q < 0.05, FDR corrected) in the synchronization of the remaining RSNs. To investigate whether weak light perception affected the rsFC analysis results, we also compared the rsFCs between CB subjects with and without light perception. There was no significant group difference even using an uncorrected P < 0.05.
Figure 2.
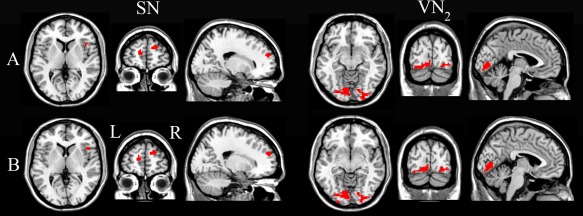
Brain regions with significant differences between the CB and SC in the intra‐network connectivity with (A) and without (B) removing the effect of age. Compared with SC, CB showed a significantly increased synchronization in the right anterior insula and bilateral ventral‐lateral prefrontal regions of the SN, as well as in the inferior and ventral parts of the occipital cortex bilaterally (q < 0.05, FDR corrected, cluster size > 15 voxels). L, left; R, right; SN, salience network; VN2, ventral part of the visual network. [Color figure can be viewed in the online issue, which is available at http://wileyonlinelibrary.com.]
It should be noted that the above statistical analysis was based on a hypothesis that the rsFC has a linear relationship with age. However, the linear hypothesis lacks strong evidence, especially for young sighted adults, because the age range of this cohort was relatively small and all participants were young adults. To validate our results, we performed a two‐sample t test with a threshold of q < 0.05 (FDR corrected, cluster size > 15 voxels) without removing the effect of age. We found that the main results were similar with those after removing the effect of age (Fig. 2B). No brain regions showed a significant decrease in synchronization in the SN, VN, and SMN in the CB group relative to the SC group. There are no significant group differences (q < 0.05, FDR corrected) in the synchronization of the remaining RSNs.
Altered FNCs in CB
Compared with the SC, CB subjects showed significantly (P < 0.005, uncorrected) increased FNCs between the SN and the right FPN, between right FPN and the VN, and between the left FPN and the VN; while the FNC between the VN and SMN was decreased in CB subjects (P < 0.005, uncorrected) (Fig. 3). However, none of these differences can survive after Bonferroni correction (P < 0.05). None of the remaining pairs of RSNs showed significant differences in the FNC between groups (P < 0.005, uncorrected).
Figure 3.
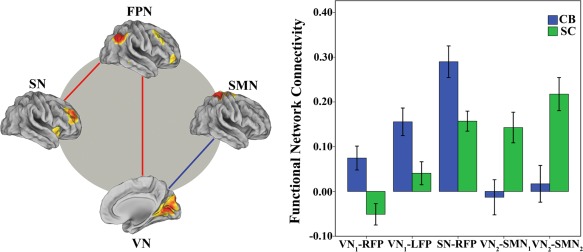
Inter‐network function changes between groups. The functional connectivity between the SN and FPN was increased in the CB, as well as between the FPN and VN (P < 0.005, uncorrected); the functional connectivity of the VN with the SMN was decreased in these subjects (P < 0.005, uncorrected). Error bars indicate standard error of mean (SEM). CB, congenital blind; FPN, frontoparietal network; RSNs, resting sate networks; SC, sighted control; SMN, sensorimotor network; SN, salience network; VN1,striate part of visual network; VN2, ventral part of visual network. [Color figure can be viewed in the online issue, which is available at http://wileyonlinelibrary.com.]
DISCUSSION
To our knowledge, this is the first study that investigates RSN connectivity alterations in CB. We found increased synchronization within the SN and the occipital cortex and enhanced FNCs between the SN and the FPN and between the FPN and the occipital cortex in CB, although the FNC between the occipital cortex and the SMN was decreased. These findings provide novel insight for the large scale functional reorganization in CB.
Increased RSN Synchronization in CB
Compared with SC, CB subjects showed increased synchronization within the occipital cortex where increased cortical thickness (Bridge et al., 2009; Jiang et al., 2009; Park et al., 2009), brain regional homogeneity (Liu et al., 2011), metabolism and blood flow (De Volder et al., 1997; Mishina et al., 2003; Uhl et al., 1993; Veraart et al., 1990), and decreased regional volume (Noppeney et al., 2005; Pan et al., 2007; Ptito et al., 2008) were coexistence. Multiple processes may contribute to the alterations in the occipital cortex in CB. First, the synaptic pruning of the occipital cortex is dependent on visual experience (Bourgeois et al., 1989; Chechik et al., 1999) and is interfered with the CB, which results in the relatively high synaptic density in the occipital cortex. Secondly, early visual deprivation lead to the increases in corticocortical (Karlen et al., 2006; Kupers et al., 2006), thalamocortical (Karlen et al., 2006; Rehkamper et al., 1994) and intracortical connections (Callaway and Katz, 1991; Sur and Leamey, 2001) in the occipital cortex. Finally, axonal degeneration secondary to the anterior visual pathway damage will result in the atrophy of the occipital cortex (Pan et al., 2007). All of these factors exert differential influences on the structural and functional alterations of the occipital cortex in CB. Therefore, the neural mechanisms of the increased synchronization in the occipital cortex in CB are complex and may represent an integrated consequence of the developmental, plastic, and degenerative factors.
CB subjects also showed increased synchronization in the right FIC and prefrontal cortex within the salience network. This network responds to the degree of subjective salience, whether cognitive, homeostatic, or emotional (Craig, 2002; 2009; Seeley et al., 2007), and serves to identify the most relevant among several internal and extrapersonal stimuli in order to guide behavior (Menon and Uddin, 2010). In particular, the FIC, especially the right one, is involved in detecting salient stimuli from the vast and continuous stream of visual, auditory, tactile and other sensory inputs and to initiate attention control signals, which are then sustained by the dorsal ACC and the prefrontal cortices (Menon and Uddin, 2010). Loss of sight makes CB subjects depend more on nonvisual inputs to efficiently interact with the environment. Many pieces of evidence have suggested that blind individuals showed increased sensitivity to auditory and tactile stimuli (Gougoux et al., 2005; Pascual‐Leone et al., 2005; Rauschecker, 1995). The increased synchronization in SN in the CB might reflect the enhanced ability to identify salient stimuli from the auditory, tactile and other sensory inputs, which may facilitate the bottom‐up control of attention.
Altered FNCs in CB
The human brain is a large, dynamic system with an optimal balance between functional specialization and integration. Investigation on the intranetwork synchronization may improve our understanding of the functional specialization, whereas investigation on internetwork connectivity may improve our understanding of the functional integration of the brain. An intriguing finding of this study is that CB showed increased FNC between the SN and the FPN. As a key node of the SN, the right FIC plays a critical and causal role in activating the FPN and deactivating the DMN (Sridharan et al., 2008). It has been suggested that the SN is to first identify salient stimuli from the vast and continuous stream of sensory stimuli (Menon and Uddin, 2010). Once such a stimulus is detected, the SN will initiate appropriate transient control signals to engage brain areas (including the FPN) which mediating attention, working memory and higher order cognitive processes (Bunge et al., 2001; Crottaz‐Herbette et al., 2004; D'Esposito, 2007; Koechlin and Summerfield, 2007; Miller and Cohen, 2001; Muller and Knight, 2006; Petrides, 2005). In the CB, the enhanced FNC between the SN and the FPN may represent a compensatory plasticity that supports a normal cognitive function in CB even in the absence of visual input.
In sighted subjects, it has been suggested that the FPN was closely associated with the visual cortex to selectively process task‐relevant visual stimuli by a top‐down control manner (Chadick and Gazzaley, 2011; Gazzaley et al., 2007). In the CB, the visual cortex shifts its function to process the auditory and tactile stimuli (Burton et al., 2006; Kujala et al., 2005; Poirier et al., 2006; Sadato et al., 1996, 1998). Thus the increased FNC between the FPN and VN in the CB may reflect the enhanced top‐down control of attention to these sensory modalities, which partly explains the better performance on the auditory and tactile tasks (Gougoux et al., 2005; Pascual‐Leone et al., 2005; Rauschecker, 1995). Alternatively, this finding may represent a large scale functional reorganization of the cognitive‐related networks in CB because previous studies have reported activations in the visual cortex of the CB during a variety of cognitive tasks (Amedi et al., 2003; Renier et al., 2010; Stevens et al., 2007).
In the present study, we also found decreased FNC between the VN and SMN in the CB, which was well consistent with two previous studies (Liu et al., 2007; Yu et al., 2008). In these two studies, the CB subjects showed decreased functional connectivity between the visual and sensory‐motor areas. General loss hypothesis due to the absence of visual input may be a candidate explanation for this finding (Liu et al., 2007; Yu et al., 2008).
Limitations
Several methodological issues should be considered when one interpreting our findings. First, it has been recently noted that even small amounts of head motion may introduce artifactual interindividual and inter‐group differences in fMRI metrics (Power et al., 2012a, 2012b; Satterthwaite et al., 2012; Van Dijk et al., 2012). More importantly, this influence cannot be effectively removed by traditionally regressing out head realignment parameters (Power et al., 2012a). We tried to reduce the influence by excluding subjects with an FD of >0.5 mm and performing our analyses using the mean FD of each subject as a nuisance covariate. Second, previous studies suggest that different size of smooth kernel may generate different results (Fransson et al., 2002; Geissler et al., 2005; Hopfinger et al., 2000; White et al., 2001). In the present study, we tested the effect of different smooth kernels (FWHM = 4, 6, and 8 mm) on our results and found similar group differences in the SN and VN across the three smoothing filters (Supporting Information Fig. S1). Thus a smooth kernel of 6mm was adopted. Third, there is no gold standard for determining the number of components in the ICA. We determined the number of components according to the representativeness of each RSN based on previous studies (Beckmann et al., 2005, 2009; Beckmann and Smith, 2005; Damoiseaux et al., 2006; De Luca et al., 2006; Mantini et al., 2007). We have decomposed our data into 20, 30, and 70 components. The scheme of 30 components seemed more plausible than the other two schemes (Supporting Information Fig. S2). However, this subjective selection of ICA components should be considered as a limitation of this study. Finally, we adopted different methods for multiple comparisons based on the effective size and the aim of the comparison. To construct the typical structure for each RSN, we used a relatively high threshold (t > 15) to improve the representativeness of each RSN; however, in the FNC analyses, we used a compromised threshold of P < 0.005 (uncorrected) to show the trends of the group difference.
CONCLUSION
In this study, we investigated RSN connectivity alterations in CB and found increased synchronization within the SN and the occipital cortex and enhanced FNCs between the SN and the FPN and between the FPN and the occipital cortex in CB. The large scale functional reorganization in CB may help us to understand the preserved ability in cognitive control in the absence of visual input.
Supporting information
Supplementary Information
REFERENCES
- Amedi A, Raz N, Pianka P, Malach R, Zohary E (2003): Early ‘visual’ cortex activation correlates with superior verbal memory performance in the blind. Nat Neurosci 6:758–766. [DOI] [PubMed] [Google Scholar]
- Beckmann CF, Smith SM (2005): Tensorial extensions of independent component analysis for multisubject FMRI analysis. Neuroimage 25:294–311. [DOI] [PubMed] [Google Scholar]
- Beckmann CF, DeLuca M, Devlin JT, Smith SM (2005): Investigations into resting‐state connectivity using independent component analysis. Philos Trans R Soc Lond B Biol Sci 360:1001–1013. [DOI] [PMC free article] [PubMed] [Google Scholar]
- Beckmann CF, Mackay C, Filippin N, Smith S (2009): Group comparison of resting‐state fmri data using multi‐subject ica and dual regression. Neuroimage 47 (Suppl 1):S39–S41. [Google Scholar]
- Bell AJ, Sejnowski TJ (1995): An information‐maximization approach to blind separation and blind deconvolution. Neural Comput 7:1129–1159. [DOI] [PubMed] [Google Scholar]
- Biswal B, Yetkin FZ, Haughton VM, Hyde JS (1995): Functional connectivity in the motor cortex of resting human brain using echo‐planar MRI. Magn Reson Med 34:537–541. [DOI] [PubMed] [Google Scholar]
- Biswal BB, Van Kylen J, Hyde JS (1997): Simultaneous assessment of flow and BOLD signals in resting‐state functional connectivity maps. NMR Biomed 10:165–170. [DOI] [PubMed] [Google Scholar]
- Bourgeois JP, Jastreboff PJ, Rakic P (1989): Synaptogenesis in visual cortex of normal and preterm monkeys: Evidence for intrinsic regulation of synaptic overproduction. Proc Natl Acad Sci USA 86:4297–4301. [DOI] [PMC free article] [PubMed] [Google Scholar]
- Bridge H, Cowey A, Ragge N, Watkins K (2009): Imaging studies in congenital anophthalmia reveal preservation of brain architecture in ‘visual’ cortex. Brain 132 (Part 12):3467–3480. [DOI] [PubMed] [Google Scholar]
- Buckner RL, Vincent JL (2007): Unrest at rest: Default activity and spontaneous network correlations. Neuroimage 37:1091–1096. [DOI] [PubMed] [Google Scholar]
- Buckner RL, Andrews‐Hanna JR, Schacter DL (2008): The brain's default network: Anatomy, function, and relevance to disease. Ann N Y Acad Sci 1124:1–38. [DOI] [PubMed] [Google Scholar]
- Bunge SA, Ochsner KN, Desmond JE, Glover GH, Gabrieli JD (2001): Prefrontal regions involved in keeping information in and out of mind. Brain 124 (Part 10):2074–2086. [DOI] [PubMed] [Google Scholar]
- Burton H, McLaren DG (2006): Visual cortex activation in late‐onset, Braille naive blind individuals: An fMRI study during semantic and phonological tasks with heard words. Neurosci Lett 392:38–42. [DOI] [PMC free article] [PubMed] [Google Scholar]
- Burton H, McLaren DG, Sinclair RJ (2006): Reading embossed capital letters: An fMRI study in blind and sighted individuals. Hum Brain Mapp 27:325–339. [DOI] [PMC free article] [PubMed] [Google Scholar]
- Calhoun VD, Adali T, Pearlson GD, Pekar JJ (2001): A method for making group inferences from functional MRI data using independent component analysis. Hum Brain Mapp 14:140–151. [DOI] [PMC free article] [PubMed] [Google Scholar]
- Callaway EM, Katz LC (1991): Effects of binocular deprivation on the development of clustered horizontal connections in cat striate cortex. Proc Natl Acad Sci USA 88:745–749. [DOI] [PMC free article] [PubMed] [Google Scholar]
- Chadick JZ, Gazzaley A (2011): Differential coupling of visual cortex with default or frontal‐parietal network based on goals. Nat Neurosci 14:830–832. [DOI] [PMC free article] [PubMed] [Google Scholar]
- Chechik G, Meilijson I, Ruppin E (1999): Neuronal regulation: A mechanism for synaptic pruning during brain maturation. Neural Comput 11:2061–2080. [DOI] [PubMed] [Google Scholar]
- Cordes D, Haughton V, Carew JD, Arfanakis K, Maravilla K (2002): Hierarchical clustering to measure connectivity in fMRI resting‐state data. Magn Reson Imaging 20:305–317. [DOI] [PubMed] [Google Scholar]
- Craig AD (2002): How do you feel? Interoception: The sense of the physiological condition of the body. Nat Rev Neurosci 3:655–666. [DOI] [PubMed] [Google Scholar]
- Craig AD (2009): How do you feel—Now? The anterior insula and human awareness. Nat Rev Neurosci 10:59–70. [DOI] [PubMed] [Google Scholar]
- Crottaz‐Herbette S, Anagnoson RT, Menon V (2004): Modality effects in verbal working memory: Differential prefrontal and parietal responses to auditory and visual stimuli. Neuroimage 21:340–351. [DOI] [PubMed] [Google Scholar]
- D'Esposito M (2007): From cognitive to neural models of working memory. Philos Trans R Soc Lond B Biol Sci 362:761–772. [DOI] [PMC free article] [PubMed] [Google Scholar]
- Damoiseaux JS, Rombouts SA, Barkhof F, Scheltens P, Stam CJ, Smith SM, Beckmann CF (2006): Consistent resting‐state networks across healthy subjects. Proc Natl Acad Sci USA 103:13848–13853. [DOI] [PMC free article] [PubMed] [Google Scholar]
- De Luca M, Beckmann CF, De Stefano N, Matthews PM, Smith SM (2006): fMRI resting state networks define distinct modes of long‐distance interactions in the human brain. Neuroimage 29:1359–1367. [DOI] [PubMed] [Google Scholar]
- De Volder AG, Bol A, Blin J, Robert A, Arno P, Grandin C, Michel C, Veraart C (1997): Brain energy metabolism in early blind subjects: Neural activity in the visual cortex. Brain Res 750:235–244. [DOI] [PubMed] [Google Scholar]
- Erhardt EB, Rachakonda S, Bedrick EJ, Allen EA, Adali T, Calhoun VD (2011): Comparison of multi‐subject ICA methods for analysis of fMRI data. Hum Brain Mapp 32:2075–2095. [DOI] [PMC free article] [PubMed] [Google Scholar]
- Fox MD, Raichle ME (2007): Spontaneous fluctuations in brain activity observed with functional magnetic resonance imaging. Nat Rev Neurosci 8:700–711. [DOI] [PubMed] [Google Scholar]
- Fox MD, Snyder AZ, Vincent JL, Corbetta M, Van Essen DC, Raichle ME (2005): The human brain is intrinsically organized into dynamic, anticorrelated functional networks. Proc Natl Acad Sci USA 102:9673–9678. [DOI] [PMC free article] [PubMed] [Google Scholar]
- Fox MD, Corbetta M, Snyder AZ, Vincent JL, Raichle ME (2006): Spontaneous neuronal activity distinguishes human dorsal and ventral attention systems. Proc Natl Acad Sci USA 103:10046–10051. [DOI] [PMC free article] [PubMed] [Google Scholar]
- Fransson P, Merboldt KD, Petersson KM, Ingvar M, Frahm J (2002): On the effects of spatial filtering—A comparative fMRI study of episodic memory encoding at high and low resolution. Neuroimage 16:977–984. [DOI] [PubMed] [Google Scholar]
- Gazzaley A, Rissman J, Cooney J, Rutman A, Seibert T, Clapp W, D'Esposito M (2007): Functional interactions between prefrontal and visual association cortex contribute to top‐down modulation of visual processing. Cereb Cortex 17 (Suppl 1):i125–i135. [DOI] [PMC free article] [PubMed] [Google Scholar]
- Geissler A, Lanzenberger R, Barth M, Tahamtan AR, Milakara D, Gartus A, Beisteiner R (2005): Influence of fMRI smoothing procedures on replicability of fine scale motor localization. Neuroimage 24:323–331. [DOI] [PubMed] [Google Scholar]
- Gougoux F, Zatorre RJ, Lassonde M, Voss P, Lepore F (2005): A functional neuroimaging study of sound localization: Visual cortex activity predicts performance in early‐blind individuals. PLoS Biol 3:e27. [DOI] [PMC free article] [PubMed] [Google Scholar]
- Greicius MD, Krasnow B, Reiss AL, Menon V (2003): Functional connectivity in the resting brain: A network analysis of the default mode hypothesis. Proc Natl Acad Sci USA 100:253–258. [DOI] [PMC free article] [PubMed] [Google Scholar]
- Greicius MD, Srivastava G, Reiss AL, Menon V (2004): Default‐mode network activity distinguishes Alzheimer's disease from healthy aging: Evidence from functional MRI. Proc Natl Acad Sci USA 101:4637–4642. [DOI] [PMC free article] [PubMed] [Google Scholar]
- Hopfinger JB, Buchel C, Holmes AP, Friston KJ (2000): A study of analysis parameters that influence the sensitivity of event‐related fMRI analyses. Neuroimage 11:326–333. [DOI] [PubMed] [Google Scholar]
- Jiang J, Zhu W, Shi F, Liu Y, Li J, Qin W, Li K, Yu C, Jiang T (2009): Thick visual cortex in the early blind. J Neurosci 29:2205–2211. [DOI] [PMC free article] [PubMed] [Google Scholar]
- Karlen SJ, Kahn DM, Krubitzer L (2006): Early blindness results in abnormal corticocortical and thalamocortical connections. Neuroscience 142:843–858. [DOI] [PubMed] [Google Scholar]
- Koechlin E, Summerfield C (2007): An information theoretical approach to prefrontal executive function. Trends Cogn Sci 11:229–235. [DOI] [PubMed] [Google Scholar]
- Kujala T, Palva MJ, Salonen O, Alku P, Huotilainen M, Jarvinen A, Naatanen R (2005): The role of blind humans' visual cortex in auditory change detection. Neurosci Lett 379:127–131. [DOI] [PubMed] [Google Scholar]
- Kupers R, Fumal A, de Noordhout AM, Gjedde A, Schoenen J, Ptito M (2006): Transcranial magnetic stimulation of the visual cortex induces somatotopically organized qualia in blind subjects. Proc Natl Acad Sci USA 103:13256–13260. [DOI] [PMC free article] [PubMed] [Google Scholar]
- Lepore N, Voss P, Lepore F, Chou YY, Fortin M, Gougoux F, Lee AD, Brun C, Lassonde M, Madsen SK, Toga AW, Thompson PM (2010): Brain structure changes visualized in early‐ and late‐onset blind subjects. Neuroimage 49:134–140. [DOI] [PMC free article] [PubMed] [Google Scholar]
- Liu C, Liu Y, Li W, Wang D, Jiang T, Zhang Y, Yu C (2011): Increased regional homogeneity of blood oxygen level‐dependent signals in occipital cortex of early blind individuals. Neuroreport 22:190–194. [DOI] [PubMed] [Google Scholar]
- Liu Y, Yu C, Liang M, Li J, Tian L, Zhou Y, Qin W, Li K, Jiang T (2007): Whole brain functional connectivity in the early blind. Brain 130 (Part 8):2085–2096. [DOI] [PubMed] [Google Scholar]
- Mantini D, Perrucci MG, Del Gratta C, Romani GL, Corbetta M (2007): Electrophysiological signatures of resting state networks in the human brain. Proc Natl Acad Sci USA 104:13170–13175. [DOI] [PMC free article] [PubMed] [Google Scholar]
- Menon V, Uddin LQ (2010): Saliency, switching, attention and control: A network model of insula function. Brain Struct Funct 214:655–667. [DOI] [PMC free article] [PubMed] [Google Scholar]
- Miller EK, Cohen JD (2001): An integrative theory of prefrontal cortex function. Annu Rev Neurosci 24:167–202. [DOI] [PubMed] [Google Scholar]
- Mishina M, Senda M, Kiyosawa M, Ishiwata K, De Volder AG, Nakano H, Toyama H, Oda K, Kimura Y, Ishii K, Sasaki T, Ohyama M, Komaba Y, Kobayashi S, Kitamura S, Katayama Y (2003): Increased regional cerebral blood flow but normal distribution of GABAA receptor in the visual cortex of subjects with early‐onset blindness. Neuroimage 19:125–131. [DOI] [PubMed] [Google Scholar]
- Muller NG, Knight RT (2006): The functional neuroanatomy of working memory: Contributions of human brain lesion studies. Neuroscience 139:51–58. [DOI] [PubMed] [Google Scholar]
- Noppeney U, Friston KJ, Ashburner J, Frackowiak R, Price CJ (2005): Early visual deprivation induces structural plasticity in gray and white matter. Curr Biol 15:R488–R490. [DOI] [PubMed] [Google Scholar]
- Pan WJ, Wu G, Li CX, Lin F, Sun J, Lei H (2007): Progressive atrophy in the optic pathway and visual cortex of early blind Chinese adults: A voxel‐based morphometry magnetic resonance imaging study. Neuroimage 37:212–220. [DOI] [PubMed] [Google Scholar]
- Park HJ, Lee JD, Kim EY, Park B, Oh MK, Lee S, Kim JJ (2009): Morphological alterations in the congenital blind based on the analysis of cortical thickness and surface area. Neuroimage 47:98–106. [DOI] [PubMed] [Google Scholar]
- Pascual‐Leone A, Amedi A, Fregni F, Merabet LB (2005): The plastic human brain cortex. Annu Rev Neurosci 28:377–401. [DOI] [PubMed] [Google Scholar]
- Petrides M (2005): Lateral prefrontal cortex: Architectonic and functional organization. Philos Trans R Soc Lond B Biol Sci 360:781–795. [DOI] [PMC free article] [PubMed] [Google Scholar]
- Poirier C, Collignon O, Scheiber C, Renier L, Vanlierde A, Tranduy D, Veraart C, De Volder AG (2006): Auditory motion perception activates visual motion areas in early blind subjects. Neuroimage 31:279–285. [DOI] [PubMed] [Google Scholar]
- Power JD, Barnes KA, Snyder AZ, Schlaggar BL, Petersen SE (2012a): Spurious but systematic correlations in functional connectivity MRI networks arise from subject motion. Neuroimage 59:2142–2154. [DOI] [PMC free article] [PubMed] [Google Scholar]
- Power JD, Barnes KA, Snyder AZ, Schlaggar BL, Petersen SE (2012b): Steps toward optimizing motion artifact removal in functional connectivity MRI: A reply to Carp. Neuroimage 76:439–441. [DOI] [PMC free article] [PubMed] [Google Scholar]
- Ptito M, Schneider FC, Paulson OB, Kupers R (2008): Alterations of the visual pathways in congenital blindness. Exp Brain Res 187:41–49. [DOI] [PubMed] [Google Scholar]
- Raichle ME, MacLeod AM, Snyder AZ, Powers WJ, Gusnard DA, Shulman GL (2001): A default mode of brain function. Proc Natl Acad Sci USA 98:676–682. [DOI] [PMC free article] [PubMed] [Google Scholar]
- Rauschecker JP (1995): Compensatory plasticity and sensory substitution in the cerebral cortex. Trends Neurosci 18:36–43. [DOI] [PubMed] [Google Scholar]
- Rehkamper G, Necker R, Nevo E (1994): Functional anatomy of the thalamus in the blind mole rat Spalax ehrenbergi: An architectonic and electrophysiologically controlled tracing study. J Comp Neurol 347:570–584. [DOI] [PubMed] [Google Scholar]
- Reich L, Szwed M, Cohen L, Amedi A (2011): A ventral visual stream reading center independent of visual experience. Curr Biol 21:363–368. [DOI] [PubMed] [Google Scholar]
- Renier LA, Anurova I, De Volder AG, Carlson S, VanMeter J, Rauschecker JP (2010): Preserved functional specialization for spatial processing in the middle occipital gyrus of the early blind. Neuron 68:138–148. [DOI] [PMC free article] [PubMed] [Google Scholar]
- Ricciardi E, Vanello N, Sani L, Gentili C, Scilingo EP, Landini L, Guazzelli M, Bicchi A, Haxby JV, Pietrini P (2007): The effect of visual experience on the development of functional architecture in hMT+. Cereb Cortex 17:2933–2939. [DOI] [PubMed] [Google Scholar]
- Sadato N, Pascual‐Leone A, Grafman J, Ibanez V, Deiber MP, Dold G, Hallett M (1996): Activation of the primary visual cortex by Braille reading in blind subjects. Nature 380:526–528. [DOI] [PubMed] [Google Scholar]
- Sadato N, Pascual‐Leone A, Grafman J, Deiber MP, Ibanez V, Hallett M (1998): Neural networks for Braille reading by the blind. Brain 121 (Part 7):1213–1229. [DOI] [PubMed] [Google Scholar]
- Satterthwaite TD, Wolf DH, Loughead J, Ruparel K, Elliott MA, Hakonarson H, Gur RC, Gur RE (2012): Impact of in‐scanner head motion on multiple measures of functional connectivity: Relevance for studies of neurodevelopment in youth. Neuroimage 60:623–632. [DOI] [PMC free article] [PubMed] [Google Scholar]
- Schmithorst VJ, Holland SK (2004): Comparison of three methods for generating group statistical inferences from independent component analysis of functional magnetic resonance imaging data. J Magn Reson Imaging 19:365–368. [DOI] [PMC free article] [PubMed] [Google Scholar]
- Seeley WW, Menon V, Schatzberg AF, Keller J, Glover GH, Kenna H, Reiss AL, Greicius MD (2007): Dissociable intrinsic connectivity networks for salience processing and executive control. J Neurosci 27:2349–2356. [DOI] [PMC free article] [PubMed] [Google Scholar]
- Shimony JS, Burton H, Epstein AA, McLaren DG, Sun SW, Snyder AZ (2006): Diffusion tensor imaging reveals white matter reorganization in early blind humans. Cereb Cortex 16:1653–1661. [DOI] [PMC free article] [PubMed] [Google Scholar]
- Sridharan D, Levitin DJ, Menon V (2008): A critical role for the right fronto‐insular cortex in switching between central‐executive and default‐mode networks. Proc Natl Acad Sci USA 105:12569–12574. [DOI] [PMC free article] [PubMed] [Google Scholar]
- Stevens AA, Snodgrass M, Schwartz D, Weaver K (2007): Preparatory activity in occipital cortex in early blind humans predicts auditory perceptual performance. J Neurosci 27:10734–10741. [DOI] [PMC free article] [PubMed] [Google Scholar]
- Sur M, Leamey CA (2001): Development and plasticity of cortical areas and networks. Nat Rev Neurosci 2:251–262. [DOI] [PubMed] [Google Scholar]
- Uhl F, Franzen P, Podreka I, Steiner M, Deecke L (1993): Increased regional cerebral blood flow in inferior occipital cortex and cerebellum of early blind humans. Neurosci Lett 150:162–164. [DOI] [PubMed] [Google Scholar]
- Van Dijk KR, Sabuncu MR, Buckner RL (2012): The influence of head motion on intrinsic functional connectivity MRI. Neuroimage 59:431–438. [DOI] [PMC free article] [PubMed] [Google Scholar]
- Veraart C, De Volder AG, Wanet‐Defalque MC, Bol A, Michel C, Goffinet AM (1990): Glucose utilization in human visual cortex is abnormally elevated in blindness of early onset but decreased in blindness of late onset. Brain Res 510:115–121. [DOI] [PubMed] [Google Scholar]
- White T, O'Leary D, Magnotta V, Arndt S, Flaum M, Andreasen NC (2001): Anatomic and functional variability: The effects of filter size in group fMRI data analysis. Neuroimage 13:577–588. [DOI] [PubMed] [Google Scholar]
- Yu C, Shu N, Li J, Qin W, Jiang T, Li K (2007): Plasticity of the corticospinal tract in early blindness revealed by quantitative analysis of fractional anisotropy based on diffusion tensor tractography. Neuroimage 36:411–417. [DOI] [PubMed] [Google Scholar]
- Yu C, Liu Y, Li J, Zhou Y, Wang K, Tian L, Qin W, Jiang T, Li K (2008): Altered functional connectivity of primary visual cortex in early blindness. Hum Brain Mapp 29:533–543. [DOI] [PMC free article] [PubMed] [Google Scholar]
Associated Data
This section collects any data citations, data availability statements, or supplementary materials included in this article.
Supplementary Materials
Supplementary Information