

Abstract
Sleep‐induced changes in human brain connectivity/excitability and their physiologic basis remain unclear, especially in the frontal lobe. We investigated sleep‐induced connectivity and excitability changes in 11 patients who underwent chronic implantation of subdural electrodes for epilepsy surgery. Single‐pulse electrical stimuli were directly injected to a part of the cortices, and cortico‐cortical evoked potentials (CCEPs) and CCEP‐related high‐gamma activities (HGA: 100–200 Hz) were recorded from adjacent and remote cortices as proxies of effective connectivity and induced neuronal activity, respectively. HGA power during the initial CCEP component (N1) correlated with the N1 size itself across all states investigated. The degree of cortical connectivity and excitability changed during sleep depending on sleep stage, approximately showing dichotomy of awake vs. non‐rapid eye movement (REM) [NREM] sleep. On the other hand, REM sleep partly had properties of both awake and NREM sleep, placing itself in the intermediate state between them. Compared with the awake state, single‐pulse stimulation especially during NREM sleep induced increased connectivity (N1 size) and neuronal excitability (HGA increase at N1), which was immediately followed by intense inhibition (HGA decrease). The HGA decrease was temporally followed by the N2 peak (the second CCEP component), and then by HGA re‐increase during sleep across all lobes. This HGA rebound or re‐increase of neuronal synchrony was largest in the frontal lobe compared with the other lobes. These properties of sleep‐induced changes of the cortex may be related to unconsciousness during sleep and frequent nocturnal seizures in frontal lobe epilepsy. Hum Brain Mapp, 2015. © 2015 Wiley Periodicals, Inc.
Keywords: CCEP, consciousness, frontal lobe epilepsy, high‐gamma activity, sleep, non‐REM
INTRODUCTION
How cortical connectivity and excitability change during sleep and the neurophysiologic basis of these changes remain unknown. The answers to these questions, however, may be closely related to other mysteries of sleep. Researchers have argued that non‐rapid eye movement (NREM) sleep that is characterized by the slow‐wave activity (SWA) [Diekelmann and Born, 2010] breaks down cortical connectivity and thus decreases the integrity of a large amount of information, leading to unconsciousness [Massimini et al., 2005, 2010; Tononi, 2008]. With regard to pathologic states related to aberrances in the brain neuronal network, the preponderance of seizure activity during sleep in frontal lobe epilepsy is well‐known clinically [Crespel et al., 1998; Derry and Duncan, 2013; Herman et al., 2001; Shouse et al., 1996]. Understanding the connectivity and excitability changes during sleep and their neurophysiologic basis, and distinguishing the changes across anatomic lobes, especially the frontal lobe vs. the other lobes, will provide insight into these phenomena.
By directly applying single‐pulse electrical stimulation (SPES) to the cortex and recording cortico‐cortical evoked potentials (CCEPs) with high spatiotemporal resolution that emanate from adjacent and remote cortices in human brain, we and other researchers have investigated inter‐areal connections, i.e., cortical connectivity of functional brain networks in vivo in patients undergoing invasive presurgical evaluation with implantation of subdural electrodes [Greenlee et al., 2004; Jimenez‐Jimenez et al., 2015; Lacruz et al., 2007; Matsumoto et al., 2004, 2007, 2012]. Previous studies demonstrated that CCEP often comprises first sharp (N1) and then slow (N2) negative components [Matsumoto et al., 2004, 2007, 2012]. What N1 and N2 reflect at a microscopic level remains unknown, while the conventional CCEP waveform, including N1 and N2, reflects cortico‐cortical connectivity in the living human brain [David et al., 2010; Kubota et al., 2013; Matsumoto et al., 2004, 2007, 2012]. Indeed, there is good correspondence between CCEP and other methods for determining connectivity, such as resting‐state functional connectivity and diffusion tractography [Keller et al., 2011; Swann et al., 2012]. Moreover, a recent intraoperative integrated cortical and subcortical white matter stimulation study demonstrated that N1, in particular, is generated by direct cortico‐cortical propagation through white matter tracts [Yamao et al., 2014]. We also demonstrated that the size of CCEP (N1) reflects cortical excitability in epileptic human brain [Iwasaki et al., 2010; Matsumoto et al., 2005]. Recent data indicate that high frequency activities (>100 Hz), i.e., high‐gamma activity (HGA) related to evoked potentials are proxies for neuronal activity or spiking synchrony [Buzsaki et al., 2012; Ray et al., 2008a,2008b,2008c], although low to mid‐frequency gamma (30–90 Hz) activity reportedly has different generation mechanisms, such as the oscillatory activities of GABAergic interneurons [Belluscio et al., 2012]. SPES applied directly to the cortex allows us to trace dynamic changes in CCEPs, i.e., the modulation of cortico‐cortical connectivity during sleep. The only reliable inferences that we can draw from event‐related potentials are the timing and relative amplitude of the underlying generators [Linden et al., 2010]; therefore, we also used CCEP‐related (N1‐ and N2‐related) HGA (100–200 Hz) to define modulation of the net neuronal activity or increased/decreased synchrony per se at the cortical response sites. We hypothesized that, as reflected by CCEPs, cortical connectivity changes across sleep stages (awake: W, Stages I–II [light sleep]: L, Stages III–IV [slow‐wave sleep]: S, stage REM [rapid eye movement]: R), and that neuronal responses revealed by CCEP‐related HGA accounts for the modulation of cortical excitability in NREM sleep. Furthermore, we hypothesized that the degree of modulation of intra‐lobar connectivity and excitability differs between the frontal lobe and other lobes, providing insight into the mechanisms of epileptogenicity in the frontal lobe.
MATERIALS AND METHODS
Patients
Among 19 consecutive patients who underwent chronic subdural electrode implantation for presurgical evaluation of intractable partial epilepsy from February 2010 through March 2013 in our hospital, 11 patients (6 men and 5 women, 22–44 years) provided written informed consent and were recruited to the study (Table 1). Among the patients, one patient (right frontal lobe epilepsy) was evaluated twice (first with bilateral strip electrodes, and secondly with unilateral subdural grid electrodes). In this patient, the first investigation was performed mainly in the left hemisphere (designated as Pt. 2L) and the second one in the right hemisphere (Pt. 2R). The protocol was according to the Declaration of Helsinki and was approved by the Ethics Committee of our Institute (IRB#443).
Table 1.
Patient profile
| Patient No., age/gender, handedness | Epilepsy classification/etiology | Electrode‐implanted side/No. of recording electrodes | Stimulus intensity (mA) | Stimulus site | ○ ⋄ (Color) | Analysis site | Drug |
|---|---|---|---|---|---|---|---|
| 1. 27M, R | R occipital lobe epilepsy/FCD | R/51 | 7 | R V2 | Blue | R V2 | CLB, PB, PHT, TPM |
| R V2 | |||||||
| 2L. 22F, R | R frontal lobe epilepsy/FCD | R, L/50 | 12 | L MFG | Orange | L MFG | CBZ, LTG |
| L FP | |||||||
| L pITG | |||||||
| R FP | |||||||
| R AG | |||||||
| 2R. 23F, R | R frontal lobe epilepsy/FCD | R/36 | 12 | R IFS | Magenta | R IFG | CBZ, LTG |
| *2nd invasive evaluation of Pt 2L | R pSTG | ||||||
| R STG | |||||||
| 3. 22M, R | L fronto‐temporal lobe epilepsy/FCD | L/60 | 10 | L FP | White | L FO | CBZ, VPA |
| 4. 44M, R | R frontal lobe epilepsy/tumor | R/44 | 10 | R AG/LO | Cyan | R AG/LO | CBZ, LEV, TPM, VPA |
| R PCC | |||||||
| R MFG | |||||||
| R/44 | 10 | R precuneus | Green | R PCC | |||
| R AG/LO | |||||||
| 5. 24M, R | L frontal lobe epilepsy/FCD | L/59 | 8 | L postCG | Cerulean blue | L postCG | LTG, PHT |
| L preCG | |||||||
| L preCG | |||||||
| 6. 29M, L | L mesial & lateral temporal lobe epilepsy/HS | L/98 | 10 | L SMG | Yellow | L SMG | CLB, PHT, ZNS |
| L IFG | |||||||
| L/98 | 10 | L pAG | Red | L AG/LO | |||
| L MTG | |||||||
| 7. 34M, R | R parieto‐temporal lobe epilepsy/traumatic injury, HS | R/73 | 4 | R preCG | Peacock green | R preCG | CBZ, LEV, TPM, ZNS |
| R/73 | 10 | R PMv | Leaf green | R SMG | |||
| R preCG | |||||||
| R SMG | |||||||
| R AG | |||||||
| 8. 27F, R | R parietal lobe epilepsy/tumor | R/54 | 5 | R postCG | Bottle green | R preCG | CBZ, CZP, LEV |
| R SMA | |||||||
| R/54 | 10 | R MFG | Rose red | R preCG | |||
| R SPL | |||||||
| R PCC | |||||||
| R mSFG | |||||||
| 9. 41F, R | L parietal and temporal lobe epilepsy/HS, perinatal brain damage | L/48 | 8 | L FG/ITG | Heliotrope | L FG | CBZ, TPM, PHT |
| L FG | |||||||
| L LO | |||||||
| L/48 | 10 | L pre/postCG | Brown | L preCG | |||
| L postCG | |||||||
| 10. 27F, R | R temporal lobe epilepsy/R mesial cystic lesion | R/52 | 6 | R V4 | Violet | R LO | CLB, LEV, fPHT |
| R FG | |||||||
| R/52 | 6 | R pre/postCG | Cream yellow | R pre/postCG | |||
| 11. 27F, L | R parietal lobe epilepsy/FCD | R/51 | 8 | R SMA/PM | Iron blue | R SMA | CBZ, LEV, fPHT, PHT |
| R preCG | |||||||
| R/51 | 8 | R V2 | Pink | R V2 |
Colors of circles (midpoint of stimulus electrode pairs) and the diamonds (selected analysis sites) correspond to those in the Figure 2. 1–2 pairs of electrodes outside the seizure onset zone were selected as the stimulus site for the night CCEP.
Abbreviation: epilepsy classification/etiology: FCD: focal cortical dysplasia, HS: hippocampal sclerosis.
Stimulus/analysis site: V2: secondary visual cortex, MFG: middle frontal gyrus, FP: frontal pole, p: posterior, ITG: inferior temporal gyrus, AG: angular gyrus, IFS: inferior frontal sulcus, IFG: inferior frontal gyrus, STG: superior temporal gyrus, FO: frontal orbital cortex, LO: lateral occipital, PCC: posterior cingulate cortex, postCG: postcentral gyrus, preCG: precentral gyrus, SMG: supramarginal gyrus, MTG: middle temporal gyrus, PMv: ventral part of premotor area, SMA: supplementary motor area, SPL: superior parietal lobule, mSFG: medial superior frontal gyrus, FG: fusiform gyrus.
Drugs: CLB: clobazam, PB: phenobarbital, PHT: phenytoin, TPM: topiramate, CBZ: carbamazepine, LTG: lamotrigine, VPA: valproic acid, LEV: levetiracetam, ZNS: zonisamide, CZP: clonazepam, fPHT: fosphenytoin.
Cortico‐Cortical Evoked Potential Recording in the Daytime and at Night (Sleep CCEP)
The CCEP methodology is described in detail elsewhere [Matsumoto et al., 2004, 2007, 2012]. Direct electrical cortical stimulation was applied in a bipolar manner to a pair of adjacently placed subdural electrodes (platinum, inter‐electrode distance: 1 cm, recording surface diameter: 2.3 mm, AD‐TECH, WI) using a constant‐current stimulator (Electrical Stimulator SEN‐7203 [only for Pt. 1], MS‐120B/MEE‐1232 [for the other patients], Nihon Koden, Tokyo, Japan) (Fig. 1A). The single‐pulse electrical stimuli (square wave pulse: 0.3‐ms duration) were delivered in alternating polarity at a fixed frequency of 1 Hz. During CCEP recording, the patients were asked to recline comfortably on the bed (Fig. 1B). In the daytime, CCEPs were recorded to identify the functional and seizure networks by stimulating the majority of implanted electrodes for research and clinical purposes [Kobayashi et al., 2015]. We used the highest intensity (maximum: 15 mA) at which (1) patients did not notice the stimulation and no symptoms were evoked, (2) the adjacent electrodes did not show excessive artifacts to prohibit recording, and (3) no afterdischarges were induced. Intensity was adjusted by increments of 1 or 2 mA. Electrocorticograms (ECoGs) were referenced to a scalp electrode placed on the skin over the mastoid process contralateral to the side of electrode implantation, and were sampled at 1,000 Hz (Pts. 6 and 7) or 2,000 Hz (other patients) with a band‐pass filter of 0.08–300 Hz or 0.08–600 Hz, respectively. The ECoGs were off‐line averaged time‐locked to the stimuli (analysis window −300 to +700 ms) (Fig. 1C). One to two stimulus sites (total of 19 sites) were selected for the nighttime CCEP study in each patient (Table 1). The selection criteria were as follows: (1) sites away from the epileptic focus, and 2) sites that produced discrete CCEP responses in the adjacent (local CCEP field) and/or distant (remote separate CCEP fields) regions. Through the pre‐determined stimulus site (N = 19 in total), single electrical pulses were delivered in each sleep stage (including the awake stage before the patient fell asleep). One stimulation set usually comprised 50–100 pulses. Approximately two cycles of sleep stages (∼3 h) were studied because not all the CCEP investigations were completed in the first sleep cycle. In general, 200–400 electrical pulses were delivered in each sleep stage. Stimulation intensity was set fixed for each stimulus site throughout the entire night (9.2 mA [mean] ± 2.1 mA [standard deviation]). CCEPs were recorded during each sleep stage (awake: W; Stage I–II [light sleep]: L; Stage III–IV [slow‐wave sleep]: S; and stage REM [rapid eye movement]: R). To define sleep stages according to a standard Rechtchaffen & Kales (R&K) sleep staging criteria [Rechtschaffen and Kales, 1968], scalp EEG at O1 or O2 (occipital electrodes), Cz, and the bilateral mastoid processes was recorded during the night study in each patient, together with an electrooculogram (all patients) and a chin electromyogram (except Pts.1–4). When the skin incision of the surgery was at or close to the above‐mentioned electrodes, the location of the electrode was moved a few centimeters away from the original location. During CCEP recordings at night, the sleep stage was evaluated on‐line by experimenters (K.U., K.K.) using the aforementioned criteria. The sleep stage was then determined off‐line for subsequent CCEP analyses by qualified electroencephalographers (H.T., R.M.).
Figure 1.

CCEP measurement and analysis. A: Subdural electrodes of a representative case (Pt. 2L) are non‐linearly co‐registered onto the MNI standard space (ICMB‐152). B: In the daytime, a 1‐Hz SPES (alternating polarity, 4–12 mA) was applied to several pairs of electrodes to map connectivity. C: ECoGs were off‐line averaged time‐locked to the stimulus (analysis window: −300 to +700 ms). In each patient, one or two stimulus sites away from the epileptic focus were selected for the sleep study, based on the presence of discrete CCEP responses in adjacent and/or distant regions (awake: W, Stage I–II: L, Stage III–IV: S, stage REM [rapid eye movement]: R). Only the response sites showing the most discrete N1 (first sharp component) and N2 (second slow component) responses, i.e., the maximum site of the adjacent and remote CCEP fields, were chosen for analysis sites. D: Five indices were used for the analysis. The troughs or positive sharp reflections before and after the N1 peak (31 ms in this representative waveform) were termed P1 (12 ms) and P2 (64 ms), respectively. Each index is highlighted by a rectangle: CCEP sizes (area under the curve) of N1 and N2 (198 ms) (N1Area and N2Area); their high‐gamma activities (HGA) counterparts (N1HG [30 ms], N2HG_min [85 ms], and N2HG_max [480 ms]).
Preparing Representative Indices of CCEPs
CCEP often comprises first sharp (N1) and then slow (N2) negative components as previously mentioned. The troughs or positive sharp reflections before and after the N1 peak were termed P1 and P2, respectively (Fig. 1D). Because we were interested in the changes of these typical components, the analysis sites were strictly selected based on the following criteria: (1) The sites were not involved in the seizure onset zone. (2) N1 was clearly distinct from both the stimulus artifact and N2. (3) CCEP responses were significantly large: at least one of the absolute values of P1, N1, P2, or N2 peak exceeded six standard deviations of the baseline [Keller et al., 2011, 2014]. (4) When more than one electrode fulfilled (1)–(3) in each separate CCEP field, we selected only the one with the maximum amplitude (N1 and/or N2) that represents the particular connectivity from each CCEP field based on our previous study [Matsumoto et al., 2012].
For each analysis site (N = 45 in total), we (K.U., K.K.) carefully checked the raw ECoG data and excluded trials that included electromyogram artifacts or epileptic discharges for subsequent analyses. Since the polarity of the stimulus artifacts varied upon stimulus polarity, i.e., odd vs. even trials, two consecutive trials were excluded together. Even with this process, however, the CCEPs at one analysis site in Pt. 11, could not be analyzed due to frequent spikes, and therefore the adjacent electrode with an almost identical CCEP waveform was selected for the analysis site because of less contamination with spikes (Pt. 11, analysis site: R V2 in Table 1).
As for each set of stimuli, four sleep stages (W, L, S, and R) were independently defined off‐line by two certified electroencephalographers (T.H., R.M.) every 30 s, based on the R&K criteria. Periods in which sleep stages were not consistent between the two electroencephalographers and sleep stage transitions were excluded from further analyses. CCEPs were not recorded in R stage at two analysis sites in the occipital lobe in one patient (Pt. 1).
CCEPs were averaged time‐locked to single‐pulse stimuli for every set of stimuli (analysis window or epoch: −300 to +700 ms from the onset of stimulation, baseline: −300 to −100 ms). All epochs in the same sleep stage were averaged together, and thus one mean CCEP was produced in each sleep stage per analysis site. For the representative CCEP indices, the areas under the curve of the N1 and N2 components were calculated, and termed N1Area and N2Area (µV·s), respectively (Fig. 1D). The latencies for the P1, N1, P2, and N2 peaks of all analysis sites were 8 ± 7 ms, 25 ± 12 ms, 63 ± 15 ms, and 191 ± 54 ms across all sleep stages (mean ± standard deviation).
To extract non‐phase‐locked, induced responses [Crone et al., 2001], we first subtracted evoked (phase‐locked) responses, namely CCEP of the corresponding ECoG dataset, from epochs in each sleep stage. This procedure was performed because (1) we focused on analyzing induced responses and (2) we attempted to exclude the possibility of false increase of gamma activities that sharply‐contoured N1 waveform itself could cause in the absence of the subtraction procedure. The epoch window was the same as that used for CCEP analyses, i.e., −300 to +700 ms from the stimulus onset. Epochs in the same sleep stage were then processed by short‐time Fourier transform (STFT) with a Hann window using in‐house scripts in Matlab software (version 2013a, MathWorks, Natick, MA) to extract stimulation‐induced HGA of CCEPs. We used a 20‐ms Fourier transform window for N1‐related HGA analysis and the center locations of the windows were set every 5 ms. Stimulus artifacts could last up to 3–4 ms after the stimulus onset [Kobayashi et al., 2015]. In this way, estimated activity at the 15‐ms bin or later was free from stimulus artifacts, although the frequency resolution was as large as 50 Hz. We carefully chose bins between 15 ms and P2 for the subsequent analyses so that the 20‐ms Fourier window neither overlapped with the stimulus artifact nor included an N2‐related HGA (after P2) in all patients. The stimulation‐induced HGA of the CCEPs was averaged for every set of stimuli. For each time bin, the log‐transformed power change in each frequency was compared with the power at baseline. The power change of three frequency bins, 100, 150, and 200 Hz, was then averaged for each time bin. Next, a simple mean of the results was obtained for each sleep stage in the same way as averaged CCEPs. The value that appeared at the nearest time bin to the N1 peak was then selected as N1HG [dB]. When the N1 peak latency was less than 15 ms, the value at 15 ms was used for N1HG, because the data before 15 ms could contain large stimulation artifacts.
The STFT was performed using a 40‐ms window for N2‐related HGA to gain a better frequency resolution (25 Hz). The log‐transformed power change after stimulation in comparison with the mean power during the baseline in frequency bins 100, 125, 150, 175, and 200 Hz was averaged for each time bin. A simple mean of the results was obtained for each sleep stage in the same way as for the averaged CCEPs. For the representative indices of HGA corresponding to N2Area, the minimum/maximum values after P2 (N2HG_min, N2HG_max [dB]) were calculated regardless of their magnitude because a preliminary study demonstrated that, following SPES, HGA often first increased during the N1 phase, then decreases after P2, and finally returned to baseline or higher.
In order to show the independency of the time–frequency representations from the analytical methods, we also performed Wavelet transform (WT) in a subset of patients using the complex‐valued Morlet wavelet in the frequency region from 100 to 200 Hz (in‐house scripts in Matlab software). It showed the power change very similar to STFT (Supporting Information Fig. 1). Therefore, we used STFT because it can directly and efficiently calculate the power of the intended frequency bins while WT requires conversion from scale to pseudofrequency that is dependent on the mother wavelet function you are using. Additionally, we evaluated the behavior of the low gamma band, namely, the N1‐ and N2‐related low gamma activity (LGA), using the power change of 50 Hz band. STFT was applied to LGA with the same parameters used in HGA analysis.
Statistical Analysis
First, our null hypothesis was that CCEP indices do not change according to sleep stages as compared with the awake stage (W) in 45 analysis sites. Therefore, a Wilcoxon signed‐rank test was performed to evaluate whether the five indices (N1Area, N2Area, N1HG, N2HG_min, and N2HG_max) of L, S, and R change compared with those of W. The P‐value threshold was defined as less than 0.05. The results were furthermore corrected by controlling the false discovery rate (FDR) = 0.05 for multiple comparisons. FDR was used for all of the multiple comparisons in this study. Superimposition of CCEPs at all the analysis sites (N = 45) showed that fluctuation of the pre‐stimulus baseline in the slow‐wave sleep stage (S), possibly reflecting underlying SWA, compared with other stages (Supporting Information Fig. 2). Considering that CCEP change might depend on the baseline slow activity, namely, the pre‐stimulus slope (upslope vs. downslope), the value relative to W was calculated for S for each index, and these values were compared between the stimulus at downslope (N = 13; the CCEP‐value at the midpoint of the baseline [−200 ms] > the value at −10 ms) and the stimulus at upslope (N = 32; the CCEP‐value at the midpoint of the baseline [−200 ms] < the value at −10 ms) using the Mann–Whitney U test (Supporting Information Fig. 3). The P‐value threshold was defined as less than 0.05. The results showed significant difference in N2Area and N2HG_min during S, while the similar analysis during L and R showed no significance. We grouped two subgroups together regardless of significant difference observed during S because our aim was to analyze the effect of sleep stages themselves on CCEP indices. In addition, to rule out the possibility that CCEP change is affected by local properties of the electrical stimulation, we also performed statistical analysis after excluding electrodes within 25 mm of the stimulus site as discussed in the previous study [Keller et al., 2011]. Furthermore, to rule out the contribution of the degree of stimulus intensity to the modulation, we separated analysis sites into two subgroups based on the average stimulus intensity (< 9.2 mA, [N = 17]; > 9.2 mA [N = 28]) and evaluated the difference statistically. It is reported that SWA decreases homeostatically in the course of NREM sleep [Riedner et al., 2007] and that spindles characterizing sleep Stage II become more diffuse in late sleep [Nir et al., 2011]. These pieces of evidence indicate that the same sleep stage physiologically varies during multiple sleep cycles per night. Some works even tried to point synaptic weights are downscaled, correlating with changes in SWA [Vyazovskiy et al., 2008]. Therefore, the difference of CCEP indices between early and later sleep was additional concern for this study. In each subject, we divided all sleep stages into two subgroups: one in the first sleep cycle (from L to R) and the other in the later sleep cycles. We only selected the analysis sites where data were available from both subgroups, and compared changes of CCEP indices.
Figure 2.

Dynamic modulation of CCEP indices by sleep. A: Stimulus (midpoint of the electrode pair: ○) and analysis (⋄) sites from all patients were coregistered onto the MNI standard space. Those in the right hemisphere were flipped to the left hemisphere for display purposes. Each stimulus site and corresponding analysis sites are shown in the same color. B: Representative CCEP waveform and CCEP‐related HGA across sleep stages (Pt. 2L, recorded from the frontal pole [FP]). C: Modulation of CCEP indices during sleep (N = 45 for W, L, and S, N = 43 for R). Relative values of each index (sleep [L, S, and R] in reference to W) are indicated by box plots (a central line in the box indicates the median of the data and the lower and upper boundary of the box are at the 25% and 75% quantiles of the data). The vertical lines (whiskers) extend to the most extreme data value within 1.5 times the height of the central box. Those outside this range were considered outliers (+). †Recorded from the contralateral hemisphere. * Statistically significant at P < 0.05, Wilcoxon signed‐rank test, corrected by false discovery rate (FDR) = 0.05. Note many indices began to show different values once the patients fell into non‐REM sleep. Except for N2HG_max, all indices tended to return to the value close to W when the sleep stage reached R, although CCEP‐related HGA (N1HG, N2HG_min) remained significantly different.
Figure 3.

Partial correlation between CCEP indices during sleep. A: Scattergrams for selected arbitrary pairs are shown across sleep stages (see Supporting Information Fig. 8 for those of all pairs). Unit for N1Area and N2Area is μV·s, and that for and N1HG, N2HG_min, and N2HG_max is 10·dB. *Statistically significant at P < 0.05, corrected by FDR = 0.05. N1HG has significant partial correlation with N1Area throughout all stages, and shows a tendency of partial anticorrelation with N2HG_min during sleep. In slow‐wave sleep, N2Area shows partial anticorrelation with N2HG_min. Regression line is given as reference, but the value of slope is not the same as the value of ρ in each figure because “partial” correlation was calculated, not correlation. B: Potentiated decrease of N2HG_min during sleep. In the scattergrams of N1HG and N2HG_min (see Fig. 3A lower left), the vectors from the point during the awake state to the point of the other sleep stages were calculated for each analysis site [W →L (N = 45), W →S (N = 45), and W →R (N = 43)] (gray arrows, black arrow denotes the synthetic vector). Note that the direction of the vectors is significantly downward from the regression line of the awake stage in each figure, and that the synthetic vector is the largest and the most downward in W →S and the least in W →R. *Statistically significant at P < 0.05, sign test, corrected by false discovery rate (FDR) = 0.05.
Second, to clarify the relationship among the five indices, Pearson partial correlations (ρ) between all pairs of the two arbitrary indices were calculated. The null hypothesis was ρ = 0. The P‐value threshold was defined as less than 0.05.
Third, we tested the hypothesis that the modulation of intralobar connectivity and excitability during sleep differs between the frontal lobe and other lobes. We compared the degree of change in the CCEP index between the frontal lobe (Frontal [stimulus site] – Frontal [analysis site] cortices [N = 11]) and other lobes (Parietal – Parietal, Occipital – Occipital, and Temporal – Temporal, a total of N = 13). The separation distance between the stimulus and analysis sites was not significantly different in the Frontal–Frontal and non‐Frontal–non‐Frontal groups in the Montreal Neurological Institute (MNI) standard space (see the next section) [29.4 ± 22.8 mm vs. 24.7 ± 19.7 mm, P = 0.59 by unpaired t‐test]. The value relative to W was calculated for each of the sleep stages (L, S, R) for each index, and these values were compared between the frontal lobe and the non‐frontal lobes using the Mann–Whitney U test. The P‐value threshold was defined as less than 0.05. In addition, a Wilcoxon signed‐rank test was used to evaluate the modulation of each index during sleep, as compared with stage W, separately for the frontal and non‐frontal analysis sites. Stimulus intensity in the frontal lobe of this study tended to be higher than in other lobes (Frontal: 9.8 ± 2.4 mA, non‐Frontal: 8.6 ± 1.4 mA, P = 0.068, Mann–Whitney U test), because less symptoms were evoked by single pulse stimulation and accordingly the intensity was occasionally set higher in the rostral part of the frontal lobe. To rule out the possibility that the difference of the stimulus intensity may influence the results obtained by comparing frontal and non‐frontal CCEP, we matched the intensity between the two groups by excluding the stimulus sites ≥ 12 mA and corresponding analysis sites in the frontal lobe and those ≤ 7 mA in the non‐frontal lobe. Then, we repeated statistical analysis (Frontal: 8.6 ± 2.2 mA [N = 7], non‐Frontal: 9.2 ± 1.0 mA [N = 10], P = 0.86, Mann–Whitney U test).
Finally, we investigated the temporal relationship among N2 latencies, i.e., N2 peak latency, and N2HG_min and N2HG_max latencies, to clarify the temporal profile of rebound gamma activity related to N2 during sleep. A Wilcoxon signed‐rank test was performed to compare N2 peak vs. N2HG_min latencies, and N2 peak vs. N2HG_min latencies in each stage. The P‐value threshold was defined as less than 0.05.
The same statistical analyses were applied to assessment of CCEP‐related LGA.
Anatomic Localization of Electrodes in Individual and Standard Spaces
The method for standard electrode placement and coregistration into the MNI standard space are reported in detail elsewhere [Matsumoto et al., 2004, 2011]. In brief, anatomic T1‐weighted volume data, namely, magnetization‐prepared rapid gradient echo (MPRAGE) sequences, were obtained before and after the implantation of subdural electrodes. Using the scan after implantation, we identified the electrode location by confirming a signal void due to the platinum alloy properties. The coordinates in each patient were then non‐linearly coregistered to the scan image obtained before implantation, and next to MNI standard space (ICBM‐152) using FNIRT (http://www.fmrib.ox.ac.uk/fsl/fnirt). The electrodes on the right side were flipped to the left side for display purposes. Anatomic labels for electrodes or stimulus sites in MNI standard space were defined in reference to the atlas of Talairach Daemon implemented in FSL View [Lancaster et al., 2000]. In the FNIRT process, a slight deviation of the location at the level of the gyri between MNI and individual space was occasionally detected. In such cases, the anatomic labels were named based on those of the individual MPRAGE.
RESULTS
CCEP Indices Change During Sleep
Based on the CCEP connectivity findings obtained in the daytime for mapping cortico‐cortical connections, one or two stimulus sites were selected in each patient. In total, SPES was applied to 19 sites across the patients. SPES evoked multiple CCEPs fields in all the patients. One to five response sites per stimulus site, namely, a total of 45 response sites, satisfied the selection criteria for further analysis (Fig. 2A, Table 1). Five CCEP indices were measured (Fig. 1D): CCEP sizes of N1 and N2 (N1Area and N2Area) and their HGA counterparts (N1HG, N2HG_min, and N2HG_max). Statistical analysis was performed for each of the five indices (Fig. 2). Compared with the awake state (W), four CCEP indices changed significantly during sleep: CCEP size (both N1 and N2) significantly increased in L (Stage I–II) and S (Stage III–IV) (L: P < 0.001, S: P < 0.001, R: P = 0.913 for N1Area, and L: P = 0.005, S: P < 0.001, R: P = 0.385 for N2Area); N1HG significantly increased during L, S, and R (L: P < 0.001, S: P < 0.001, R: P < 0.001); and N2HG_min decreased during L, S, and R (L: P < 0.001, S: P < 0.001, R: P < 0.001) (Fig. 2C). Significant difference was not seen for N2HG_max (L: P = 0.569, S: P = 0.056, R: P = 0.241, Wilcoxon signed‐rank test, rejection threshold of P‐value by FDR = 0.005). Except for N2HG_max, all indices tended to return to a value close to W when the sleep stage reached R, although CCEP‐related HGA (N1HG, N2HG_min) remained significantly different (Fig. 2C). The similar results were observed even after the analysis sites within 25 mm of the stimulus site were excluded (Supporting Information Fig. 4) or when the analysis sites were separated into two subgroups in terms of stimulus intensities (more or less than the average intensity [9.2 mA]) (Supporting Information Fig. 5). The changes of CCEP indices between the first sleep cycle and later ones were also compared, but only observed was a tendency for more N1 size increase and more N2‐related HGA decrease in the light sleep during later sleep cycles (Supporting Information Fig. 6). To investigate how other frequency bands behave, a low gamma band in particular, the N1‐ or N2‐related low gamma activity (LGA) was also calculated and analyzed using the power change of 50 Hz band. The changes of indices for induced LGA, especially in N2‐related LGA, were not as remarkable as those for HGA during sleep (Supporting Information Fig. 7).
Figure 4.
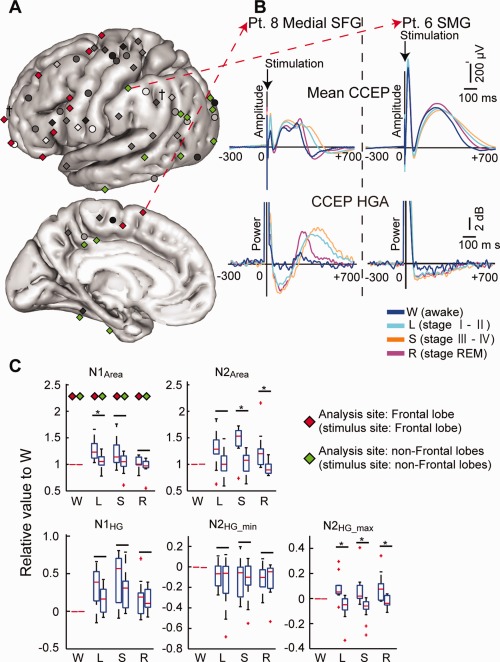
Modulation of intralobar connectivity and excitability during sleep. A: The modulation mode was compared between the frontal lobe (stimulus and analysis sites in the frontal lobe:  N = 11) and other lobes (
 N = 13). B: Representative CCEP waveform and its HGA counterpart in the frontal (superior frontal gyrus [SFG] of Pt. 8) and parietal (the supramarginal gyrus [SMG] of Pt. 6) lobes. C: Values relative to W were calculated in the sleep stages (L, S, R) for each index, and these values were compared between the Frontal lobe and the non‐Frontal lobes. In each sleep stage, the left column denotes values of the Frontal sites and the right column denotes values of the non‐Frontal sites (N = 11 in L, S, R for Frontal sites; and N =13 in L, S and N =11 in R for non‐Frontal sites). *Statistically significant at P < 0.05, Mann–Whitney U test, corrected by FDR = 0.05. Note the significant difference in N2HG_max (L, S, R) between Frontal and non‐frontal sites. The direction of the change was opposite: increase in frontal sites and decrease in non‐Frontal sites. The other conventions including the box plots are the same as for Figure 2.
Figure 5.

Temporal relationship among latencies related with N2–N2 peak, N2HG_min, and N2HG_max. A: The indices for which latencies were analyzed are highlighted by a rectangle. B: Comparison of the latencies (N2 peak vs. N2HG_min, and N2 peak vs. N2HG_max) in each stage. *Statistically significant at P < 0.05, Wilcoxon signed‐rank test, corrected by FDR = 0.05. Note the temporal relationship (N2HG_min →N2 peak →N2HG_max) became consistent once the patients fell asleep.
Potentiated High Gamma Decrease Following Its Increase at N1 Peak During Sleep
The direct correlations between two arbitrary indices among the five were investigated to clarify the relationship among the local field potential (CCEP N1 and N2) and its neural correlates of HGA (Fig. 3A, see Supporting Information Fig. 8 for all the scattergrams). During all the awake and sleep stages, partial correlation (ρ) was detected between N1Area and N1HG (W: ρ = 0.44 [P = 0.003], L: ρ = 0.65 [P < 0.001], S: ρ = 0.66 [P < 0.001], R: ρ = 0.59 [P < 0.001]), and partial anticorrelation or its tendency between N1HG and N2HG_min (W: ρ = −0.43 [P = 0.004], L: ρ = −0.37 [P = 0.015], S: ρ = −0.36 [P = 0.016], R: ρ = −0.34 [P = 0.027], the rejection threshold of P‐value by FDR = 0.004). Only during slow‐wave sleep was partial correlation detected between N2Area and N2HG_min (ρ = −0.46 [P = 0.002]), i.e., the smaller N2HG_min (= the larger HGA decrease), the larger N2Area.
Considering the relationship between N1HG and N2HG_min, we tested the hypothesis that N2‐related HGA decrease (N2HG_min) is more potentiated than that expected from the anticorrelation between N1HG and N2HG_min during sleep. In the scattergrams of N1HG and N2HG_min (see Fig. 3A lower left), the vectors from the point during awake state to the point of the other sleep stages were calculated in each analysis site [W →L (N = 45), W →S (N = 45), and W →R (N = 43)]. Then, whether the direction of the vectors in total is different from the regression line of the awake stage was examined using a sign test. We observed significantly downward direction in all sleep stages (L: P = 0.016, S: P = 0.036, R: P = 0.014, the rejection threshold of P‐value by FDR = 0.036), which demonstrated that N2HG_min decrease during sleep was reinforced independently of the degree of N1HG increase (Fig. 3B). The synthetic vector was the largest and the most downward in W →S, followed by W →L, and then W →R, suggesting the largest potentiated decrease in slow‐wave sleep.
We also investigated direct correlation/anticorrelation among CCEP N1/N2 and N1/N2‐related LGA. Significant anticorrelation was observed between N2Area and N2‐related decreased LGA (ρ = −0.48 [P = 0.001], the rejection threshold of P‐value by FDR = 0.001). However, we found a fewer pairs of partial correlation/anticorrelation for LGA as compared with HGA (Supporting Information Fig. 9).
The Degree of the Excitability Change in the Frontal Lobe Differs From That in the Other Lobes During Sleep
To compare the degree of the intra‐lobar connectivity and excitability change between the frontal lobe and other lobes, four groups were first extracted from the 45 analysis sites, based on the criteria that the cortical responses were recorded from the same lobe, i.e., the stimulus site and its analysis sites were located within the same lobe (Frontal [stimulus site] – Frontal [analysis site]: N = 11, Parietal – Parietal: N = 7, Occipital – Occipital: N = 4, Temporal – Temporal: N = 2). Analysis sites other than the frontal lobe were then combined as non‐Frontal sites (a total of N = 13 sites for analyses in L and S, 11 sites for R [R stage was not reached in two sites]) (Fig. 4A). Frontal sites and non‐Frontal sites were compared using the value of each index relative to W in each sleep stage (Fig. 4). Compared with the non‐Frontal sites, the Frontal sites had a significantly larger N1Area during L (P = 0.008), but not during S (P = 0.183) and R (P = 0.393) (Mann–Whitney U test, rejection threshold of P‐value by FDR = 0.009). The Frontal sites also produced significantly larger values for N2Area during S (P = 0.001) and R (P = 0.003), but not during L (P = 0.032), and for N2HG_max in all sleep stages (L: P < 0.001, S: P < 0.001, R: P = 0.009). Significant difference was not seen for N1HG (L: P = 0.056, S: P = 0.148, R: P = 0.948) and N2HG_min (L: P = 0.817, S: P = 1.000, R: P = 0.948). Similar results were observed for N2HG_max even after the stimulus intensity was matched between Frontal and non‐Frontal sites (Supporting Information Fig. 10). When compared with W, N2HG_max exhibited significant changes in both Frontal and non‐Frontal sites, but the direction of the change was opposite between the two: the Frontal–Frontal group showed an increase in L and S (L: P = 0.014, S: P = 0.032, Wilcoxon signed‐rank test, the rejection threshold of P‐value by FDR = 0.032), and the non‐Frontal–non‐Frontal group showed a decrease in L and S (L: P = 0.01, S: P = 0.001, the rejection threshold of P‐value by FDR = 0.017). In contrast, LGA indices did not show any significant differences between Frontal and non‐Frontal sites during sleep (Supporting Information Fig. 11).
HGA was Suppressed in the N2 Ascending Slope and Rebounded After the N2 Peak During Sleep
Finally, the temporal relationship of the latencies of the three indices of N2 (the peak of N2 [N2 peak], N2HG_min, and N2HG_max) was investigated (Fig. 5). The latency of N2HG_min was significantly shorter than the latency of the N2 peak during sleep (W: P = 0.583, L: P = 0.001, S: P < 0.001, R: P = 0.002), indicating that HGA was suppressed in the ascending N2 slope during sleep. The N2HG_max latency followed the N2 peak latency in all stages (P < 0.001 in each of four stages, Wilcoxon signed‐rank test, the rejection threshold of P‐value by FDR = 0.003), suggesting that HGA had a rebound increase after its suppression.
DISCUSSION
By directly applying SPES to the cortex and recording CCEPs and CCEP‐related HGA during sleep in humans, we probed the dynamic modulation of cortico‐cortical connectivity, the underlying neuronal activity, and inter‐lobar differences with high spatiotemporal resolution. We found that (1) with regard to CCEP, cortical connectivity changed when the patients fell asleep, and the degree of the change depended on the sleep stage (approximately, awake & REM vs. NREM); (2) HGA (100–200 Hz) was related to the cardinal components of CCEPs (N1 and N2), and HGA at the N1 phase (N1HG) correlated well with N1 size, and increased during NREM sleep. The power of induced HGA tended to become close to that of the awake stage in REM sleep, but the difference still remained significant; (3) Following an increase of HGA at N1 (N1HG), HGA was decreased (N2HG_min) in the N2 ascending slope, and the degree of HGA decrease tended to correlate with the N1HG increase. Furthermore, during sleep (especially slow‐wave sleep), the HGA decrease (N2HG_min) was potentiated independently of the preceded HGA increase (N1HG); (4) In slow‐wave sleep, HGA decrease showed negative correlation with N2 (the smaller N2HG_min, the larger N2 size); (5) The decrease was temporally followed by N2 peak, and then followed by HGA re‐increase or rebound (N2HG_max) during sleep across all lobes; (6) the CCEP waveforms and rebound HGA differed between the frontal lobe and the other lobes; and (7) CCEP‐related LGA (50 Hz) was also analyzed, but the changes of CCEP indices, correlation/anticorrelation between indices, and the difference of the changes between the frontal lobe and other lobes were not remarkable compared to HGA analysis.
Considering that (1) the conventional CCEP waveform, especially N1, reflects direct cortico‐cortical connectivity [Yamao et al., 2014], (2) HGA (>100 Hz) reflects neuronal activities in the local field [Buzsaki et al., 2012], and (3) gamma activities of ∼60–200 Hz well reflect increases in neuronal synchrony in addition to firing rates [Ray et al., 2008a], the present N1HG finding and its relationship with N1 and N2HG_min can be interpreted as follows: exogenous inputs induced an increase of neuronal activity (N1HG) through the cortico‐cortical pathway, which was immediately followed by a suppression or decrease in activity (N2HG_min). Our observation using macro‐electrodes highly likely reflects the microelectrode findings in cats [Li and Chou, 1962] and humans [Alarcon et al., 2012] that electrical cortical microstimulation induces spiking synchrony and subsequent inhibition. The present investigation across sleep stages revealed more intense neuronal activation occurred during NREM sleep than in the awake state. More intense neuronal excitation was likely to be accompanied by more profound suppression or inhibition although inhibition was potentiated during sleep compared to the awake stage. Once REM sleep was achieved, the degrees of both excitation and inhibition (N1HG and N2HG_min) tended to become closer to those in the awake stage at a group level, although the difference remained significant. Comparisons between the lobes revealed that the frontal lobe produced more rebound activity (N2HG_max) after inhibition during sleep stages, compared with the other lobes.
HGA possibly reflects a smaller field than the conventional local field potential (CCEP) because of its short effective current‐dipole length [Linden et al., 2010], but partial anticorrelation between the size of CCEP components and HGA (N2area and N2HG_min) became significant in slow‐wave sleep. This is likely due to the fact that, compared with the awake state, neurons in broader areas began to behave as an ensemble when SWA became predominant, which is consistent with studies in cat [Volgushev et al., 2006].
Massimini et al. reported that transcranial magnetic stimulation applied to the human brain while awake and in REM sleep similarly evoked an initial response (∼15 ms) when recorded by high‐density electroencephalography (EEG) at the stimulus site [Massimini et al., 2010]. Interestingly, the initial wave was followed by a sequence of EEG waves that propagated to the other areas [Massimini et al., 2010]. On the other hand, stimulation in NREM sleep evoked a larger initial response than in the awake state, but EEG activity did not propagate spatiotemporally as during the awake state, except for the subsequent negative rebound at 80–140 ms [Massimini et al., 2005]. This EEG study demonstrated a dynamic change in the propagation pattern during sleep using a spatiotemporal cortical current map. The present ECoG study complements the scalp EEG study by providing neural properties to the exogenous (electrical) inputs at the local cortical level, namely, at each subdural electrode. We demonstrated that the immediate and more potentiated inhibition of HGA was clear at the ascending slope of N2, especially during NREM sleep, indicating its role in prohibiting further signal processing within the same cortical region. During NREM sleep, this immediate neuronal inhibition following excitation to the exogenous input was globally observed across the studied cortices, implying the contribution of a system that has access to diffuse brain areas in the generation of the inhibition. The tendency for inhibition in NREM sleep probably reflects the hyperpolarized state, which the cortical neurons generate when there are decreased inputs from acetylcholinergic neurons to the thalamus [Sanchez‐Vives and McCormick, 2000; Steriade and Contreras, 1995; Steriade et al., 1993], or stimulation‐evoked corticothalamic feedback [Destexhe et al., 1998]. Either condition results in a decreased net profit of neural interaction, i.e., impinges on unity of information—one requirement for producing consciousness according to integrated information theory [Tononi, 2008]. Therefore, consciousness may fade out during NREM sleep.
Pigorini et al. (2015) focused on wide‐band activities below 100 Hz (8–100 Hz) and showed decreases in the phase locking factor and power in this frequency range around N2 activity during NREM sleep [Pigorini et al., 2015]. The present study extended their findings to both LGA (50 Hz) and HGA (100–200 Hz) by demonstrating correlation between the degree of N2‐related power decrease/inhibition and N2 size during slow‐wave sleep. In addition, our results revealed a substantial difference in the amount of correlation/anticorrelation between HGA and LGA; a fewer pairs became significant with LGA. The difference may arise from their generator mechanisms. The low‐gamma range activities are correlated with synaptic inputs [Niessing et al., 2005; Ray et al., 2008a; Viswanathan and Freeman, 2007] or oscillatory GABAergic activities of interneurons [Belluscio et al., 2012]. On the other hand, HGA sensitively detects the change of outputs of neuronal firing or synchrony [Ray et al., 2008a].
In REM sleep, our results clarified that the degree of inhibition tended to return toward the level of the awake stage especially for CCEPs, while CCEP‐related HGA often remained significantly different. This finding is in line with the previous report by Massimini et al. that showed the similar but consistent difference between the awake stage and REM sleep in terms of TMS‐evoked potentials [Massimini et al., 2010]. In addition, the positron emission tomography and fMRI studies in healthy subjects demonstrated different activation patterns between the two stages [Braun et al., 1998; Koike et al., 2011]. Our results indicate that REM sleep is the intermediate state between the awake stage and NREM sleep in that it shares the common features with the awake stage in terms of evoked effective connectivity (CCEP) and with NREM sleep for induced neuronal activities (CCEP‐related HGA). Such an intermediate state of the cortex during REM sleep—probably determined by the balance between aminergic and cholinergic drive—could let our consciousness partially recover as “dreaming.” REM sleep is subdivided into phasic (with REM) and tonic (without REM) periods and some reports showed that the brain is more isolated from external inputs during phasic REM periods than during tonic REM periods [Takahara et al., 2002; Wehrle et al., 2007]. Detailed comparison of the evoked effective connectivity and induced cortical neuronal activities using SPES between the two subgroups in a larger patient population would warrant the distinction of these two subdivisions of REM sleep.
Rebound excitability following inhibition is a characteristic of the frontal lobe, based on our CCEP/HGA analyses, compared with the other lobes, although inhibition after the initial excitation was universally observed across the lobes during sleep. Reportedly, SWA, which is predominant in the frontal lobe, microscopically comprises alternate up‐ and down‐states, and is generated by the interplay between the hyperpolarization‐activated cation current (I h) and the transient low‐threshold Ca2+ current (I t) [Steriade et al., 1993]. Furthermore, the interplay requires hyperpolarization associated with a decreased level of acetylcholine during NREM sleep. Considering its similarity to the present results that showed increased synchrony (rebound) after inhibition during sleep, our finding in the frontal lobe might reflect its property to generate SWA and suggests that these channels have a denser population in the frontal lobe compared with the other lobes. This propensity in the frontal lobe could also explain why seizures frequently occur nocturnally in patients with frontal lobe epilepsy. Generally speaking, increased neuronal synchrony across brain areas is necessary for seizure generation. Taken together with the rich connectivity within the frontal lobe [Changeux and Dehaene, 1996], the local rebound of neuronal synchrony we observed in the frontal lobe may constitute the physiologic basis of the nocturnal seizures during NREM sleep in frontal lobe epilepsy. Further insights are drawn from a genetic epilepsy syndrome, autosomal dominant nocturnal frontal lobe epilepsy. One of the causal genes encodes neuronal nicotinic acetylcholine receptors, whose gain of function is suspected to give rise to epileptogenicity during sleep [Marini and Guerrini, 2007]. The accentuated depolarization via abnormal nicotinic acetylcholine receptors might be pathogenic in NREM sleep.
The present data must be cautiously interpreted, mainly due to clinical and technical matters. First, because this study recruited only intractable partial epilepsy patients, the neurophysiologic properties might not be the same as those of normal brains, although we intentionally selected stimulus sites remote from the epileptic focus and removed the effects of spontaneous spikes for analysis. Second, the patient backgrounds varied with regard to antiepileptic drugs, electrode locations, number of electrodes, and stimulus intensity, all of which lead to potential biases toward the present findings. We attempted to resolve these potential biases by analyzing the patients as a group, not individually, and using relative values to compare the connectivity between the frontal lobe and the other lobes. Third, electrical stimulation was delivered at a fixed frequency of 1 Hz in this study, which might have made impossible to observe the effect occurring later than 1 s after stimulation [Bergmann et al., 2012]. In addition, we cannot exclude a possibility that behaviors of CCEP indices partly depended on the pre‐existing up‐ or down‐slope of SWA in slow‐wave sleep. Future studies focusing on the effect of SWA phases on CCEP indices are warranted to clarify the role of SWA in processing the external inputs to the cortices both physiologically and pathologically. Fourth, we attempted to investigate the difference of CCEP indices between the first and later sleep cycles but only found a tendency for more N1 size increase and more N2‐related inhibition during later light sleep. The impact of sleep cycles on CCEP indices is another interesting topic to be studied in detail in the future. Lastly, we selected a single response site with the maximum amplitude (N1 and/or N2) as the representative analysis site for each separate CCEP field since these sites represent the most robust nodes of networks. The whole network analysis such as a graph theory warrants investigation of the global network connectivity change during sleep, but it goes beyond our scope in the present study.
CONCLUSION
In summary, we elucidated the changes in cortico‐cortical connectivity and local cortical excitability that occur during sleep, by applying direct electrical stimulation to the human brain. By analyzing both induced local field potentials (CCEPs) and HGA (100–200 Hz), we attempted to fill the gap between the macroscopic and microscopic phenomena and revealed that the frontal lobe has distinct behaviors in terms of its connectivity and neural processing to cortico‐cortical inputs. Comparison using other modalities and further investigation of the physiologic and neurochemical basis of the present findings are warranted, as well as the development of an antiepileptic drug targeting rebound excitability in the frontal lobe.
Supporting information
Supporting Information
Supporting Information
Supporting Information
Supporting Information
Supporting Information
Supporting Information
Supporting Information
Supporting Information
Supporting Information
Supporting Information
Supporting Information
Supporting Information
ACKNOWLEDGMENT
Authors are especially grateful to the 11 patients and their families for their continued support of their research studies.
Conflict of interest: Department of Epilepsy, Movement Disorders and Physiology is an endowment department, supported with a grant from GlaxoSmithKline K.K., NIHON KOHDEN CORPORATION, Otsuka Pharmaceutical Co., and UCB Japan Co., Ltd.
Correction added on 3 September 2015, after first online publication.
REFERENCES
- Alarcon G, Martinez J, Kerai SV, Lacruz ME, Quiroga RQ, Selway RP, Richardson MP, Garcia Seoane JJ, Valentin A (2012): In vivo neuronal firing patterns during human epileptiform discharges replicated by electrical stimulation. Clin Neurophysiol 123:1736–1744. [DOI] [PMC free article] [PubMed] [Google Scholar]
- Belluscio MA, Mizuseki K, Schmidt R, Kempter R, Buzsaki G (2012): Cross‐frequency phase‐phase coupling between theta and gamma oscillations in the hippocampus. J Neurosci 32:423–435. [DOI] [PMC free article] [PubMed] [Google Scholar]
- Bergmann TO, Molle M, Schmidt MA, Lindner C, Marshall L, Born J, Siebner HR (2012): EEG‐guided transcranial magnetic stimulation reveals rapid shifts in motor cortical excitability during the human sleep slow oscillation. J Neurosci 32:243–253. [DOI] [PMC free article] [PubMed] [Google Scholar]
- Braun AR, Balkin TJ, Wesensten NJ, Gwadry F, Carson RE, Varga M, Baldwin P, Belenky G, Herscovitch P (1998): Dissociated pattern of activity in visual cortices and their projections during human rapid eye movement sleep. Science 279:91–95. [DOI] [PubMed] [Google Scholar]
- Buzsaki G, Anastassiou CA, Koch C (2012): The origin of extracellular fields and currents—EEG, ECoG, LFP and spikes. Nat Rev Neurosci 13:407–420. [DOI] [PMC free article] [PubMed] [Google Scholar]
- Changeux JP, Dehaene S. (1996) Neuronal models of cognitive functions associated with the prefrontal cortex In: Damasio AR, Damasio H, Christen Y, editors. Neurobiology of Decision‐Making. New York: Springer; pp 125–144. [Google Scholar]
- Crespel A, Baldy‐Moulinier M, Coubes P (1998): The relationship between sleep and epilepsy in frontal and temporal lobe epilepsies: Practical and physiopathologic considerations. Epilepsia 39:150–157. [DOI] [PubMed] [Google Scholar]
- Crone NE, Boatman D, Gordon B, Hao L (2001): Induced electrocorticographic gamma activity during auditory perception. Brazier Award‐winning article, 2001. Clin Neurophysiol 112:565–582. [DOI] [PubMed] [Google Scholar]
- David O, Bastin J, Chabardes S, Minotti L, Kahane P (2010): Studying network mechanisms using intracranial stimulation in epileptic patients. Front Syst Neurosci 4:148. [DOI] [PMC free article] [PubMed] [Google Scholar]
- Derry CP, Duncan S (2013): Sleep and epilepsy. Epilepsy Behav 26:394–404. [DOI] [PubMed] [Google Scholar]
- Destexhe A, Contreras D, Steriade M (1998): Mechanisms underlying the synchronizing action of corticothalamic feedback through inhibition of thalamic relay cells. J Neurophysiol 79:999–1016. [DOI] [PubMed] [Google Scholar]
- Diekelmann S, Born J (2010): The memory function of sleep. Nat Rev Neurosci 11:114–126. [DOI] [PubMed] [Google Scholar]
- Greenlee JD, Oya H, Kawasaki H, Volkov IO, Kaufman OP, Kovach C, Howard MA, Brugge JF (2004): A functional connection between inferior frontal gyrus and orofacial motor cortex in human. J Neurophysiol 92:1153–1164. [DOI] [PubMed] [Google Scholar]
- Herman ST, Walczak TS, Bazil CW (2001): Distribution of partial seizures during the sleep–wake cycle: Differences by seizure onset site. Neurology 56:1453–1459. [DOI] [PubMed] [Google Scholar]
- Iwasaki M, Enatsu R, Matsumoto R, Novak E, Thankappen B, Piao Z, O'Connor T, Horning K, Bingaman W, Nair D (2010): Accentuated cortico‐cortical evoked potentials in neocortical epilepsy in areas of ictal onset. Epileptic Disord 12:292–302. [DOI] [PubMed] [Google Scholar]
- Jimenez‐Jimenez D, Abete‐Rivas M, Martin‐Lopez D, Lacruz ME, Selway RP, Valentin A, Alarcon G (2015): Incidence of functional bi‐temporal connections in the human brain in vivo and their relevance to epilepsy surgery. Cortex 65:208–218. [DOI] [PubMed] [Google Scholar]
- Keller CJ, Bickel S, Entz L, Ulbert I, Milham MP, Kelly C, Mehta AD (2011): Intrinsic functional architecture predicts electrically evoked responses in the human brain. Proc Natl Acad Sci USA 108:10308–10313. [DOI] [PMC free article] [PubMed] [Google Scholar]
- Keller CJ, Honey CJ, Entz L, Bickel S, Groppe DM, Toth E, Ulbert I, Lado FA, Mehta AD (2014): Corticocortical evoked potentials reveal projectors and integrators in human brain networks. J Neurosci 34:9152–9163. [DOI] [PMC free article] [PubMed] [Google Scholar]
- Kobayashi K, Matsumoto R, Matsuhashi M, Usami K, Shimotake A, Kunieda T, Kikuchi T, Mikuni N, Miyamoto S, Fukuyama H, Takahashi R, Ikeda A (2015): Different mode of afferents determines the frequency range of high frequency activities in the human brain: Direct electrocorticographic comparison between peripheral nerve and direct cortical stimulation. PLoS One 10:e0130461. [DOI] [PMC free article] [PubMed] [Google Scholar]
- Koike T, Kan S, Misaki M, Miyauchi S (2011): Connectivity pattern changes in default‐mode network with deep non‐REM and REM sleep. Neurosci Res 69:322–330. [DOI] [PubMed] [Google Scholar]
- Kubota Y, Enatsu R, Gonzalez‐Martinez J, Bulacio J, Mosher J, Burgess RC, Nair DR (2013): In vivo human hippocampal cingulate connectivity: A corticocortical evoked potentials (CCEPs) study. Clin Neurophysiol 124:1547–1556. [DOI] [PubMed] [Google Scholar]
- Lacruz ME, Garcia Seoane JJ, Valentin A, Selway R, Alarcon G (2007): Frontal and temporal functional connections of the living human brain. Eur J Neurosci 26:1357–1370. [DOI] [PubMed] [Google Scholar]
- Lancaster JL, Woldorff MG, Parsons LM, Liotti M, Freitas CS, Rainey L, Kochunov PV, Nickerson D, Mikiten SA, Fox PT (2000): Automated Talairach atlas labels for functional brain mapping. Hum Brain Mapp 10:120–131. [DOI] [PMC free article] [PubMed] [Google Scholar]
- Li CL, Chou SN (1962): Cortical intracellular synaptic potentials and direct cortical stimulation. J Cell Comp Physiol 60:1–16. [DOI] [PubMed] [Google Scholar]
- Linden H, Pettersen KH, Einevoll GT (2010): Intrinsic dendritic filtering gives low‐pass power spectra of local field potentials. J Comput Neurosci 29:423–444. [DOI] [PubMed] [Google Scholar]
- Marini C, Guerrini R (2007): The role of the nicotinic acetylcholine receptors in sleep‐related epilepsy. Biochem Pharmacol 74:1308–1314. [DOI] [PubMed] [Google Scholar]
- Massimini M, Ferrarelli F, Huber R, Esser SK, Singh H, Tononi G (2005): Breakdown of cortical effective connectivity during sleep. Science 309:2228–2232. [DOI] [PubMed] [Google Scholar]
- Massimini M, Ferrarelli F, Murphy M, Huber R, Riedner B, Casarotto S, Tononi G (2010): Cortical reactivity and effective connectivity during REM sleep in humans. Cogn Neurosci 1:176–183. [DOI] [PMC free article] [PubMed] [Google Scholar]
- Matsumoto R, Nair DR, LaPresto E, Najm I, Bingaman W, Shibasaki H, Lüders HO (2004): Functional connectivity in the human language system: A cortico‐cortical evoked potential study. Brain 127:2316–2330. [DOI] [PubMed] [Google Scholar]
- Matsumoto R, Kinoshita M, Taki J, Hitomi T, Mikuni N, Shibasaki H, Fukuyama H, Hashimoto N, Ikeda A (2005): In vivo epileptogenicity of focal cortical dysplasia: A direct cortical paired stimulation study. Epilepsia 46:1744–1749. [DOI] [PubMed] [Google Scholar]
- Matsumoto R, Nair DR, LaPresto E, Bingaman W, Shibasaki H, Luders HO (2007): Functional connectivity in human cortical motor system: A cortico‐cortical evoked potential study. Brain 130:181–197. [DOI] [PubMed] [Google Scholar]
- Matsumoto R, Imamura H, Inouchi M, Nakagawa T, Yokoyama Y, Matsuhashi M, Mikuni N, Miyamoto S, Fukuyama H, Takahashi R, Ikeda A (2011): Left anterior temporal cortex actively engages in speech perception: A direct cortical stimulation study. Neuropsychologia 49:1350–1354. [DOI] [PubMed] [Google Scholar]
- Matsumoto R, Nair DR, Ikeda A, Fumuro T, Lapresto E, Mikuni N, Bingaman W, Miyamoto S, Fukuyama H, Takahashi R, Najm I, Shibasaki H, Luders HO (2012): Parieto‐frontal network in humans studied by cortico‐cortical evoked potential. Hum Brain Mapp 33:2856–2872. [DOI] [PMC free article] [PubMed] [Google Scholar]
- Niessing J, Ebisch B, Schmidt KE, Niessing M, Singer W, Galuske RA (2005): Hemodynamic signals correlate tightly with synchronized gamma oscillations. Science 309:948–951. [DOI] [PubMed] [Google Scholar]
- Nir Y, Staba RJ, Andrillon T, Vyazovskiy VV, Cirelli C, Fried I, Tononi G (2011): Regional slow waves and spindles in human sleep. Neuron 70:153–169. [DOI] [PMC free article] [PubMed] [Google Scholar]
- Pigorini A, Sarasso S, Proserpio P, Szymanski C, Arnulfo G, Casarotto S, Fecchio M, Rosanova M, Mariotti M, Lo Russo G, Palva JM, Nobili L, Massimini M (2015): Bistability breaks‐off deterministic responses to intracortical stimulation during non‐REM sleep. Neuroimage 112:105–113. [DOI] [PubMed] [Google Scholar]
- Ray S, Crone NE, Niebur E, Franaszczuk PJ, Hsiao SS (2008a): Neural correlates of high‐gamma oscillations (60–200 Hz) in macaque local field potentials and their potential implications in electrocorticography. J Neurosci 28:11526–11536. [DOI] [PMC free article] [PubMed] [Google Scholar]
- Ray S, Hsiao SS, Crone NE, Franaszczuk PJ, Niebur E (2008b): Effect of stimulus intensity on the spike‐local field potential relationship in the secondary somatosensory cortex. J Neurosci 28:7334–7343. [DOI] [PMC free article] [PubMed] [Google Scholar]
- Ray S, Niebur E, Hsiao SS, Sinai A, Crone NE (2008c): High‐frequency gamma activity (80–150Hz) is increased in human cortex during selective attention. Clin Neurophysiol, 119:116–133. [DOI] [PMC free article] [PubMed] [Google Scholar]
- Rechtschaffen A, Kales A (1968): A Manual of Standardized Terminology, Techniques and Scoring System for Sleep Stages of Human Subjects. Los Angeles: UCLA Brain Information Service/Brain Research Institute. [Google Scholar]
- Riedner BA, Vyazovskiy VV, Huber R, Massimini M, Esser S, Murphy M, Tononi G (2007): Sleep homeostasis and cortical synchronization. III. A high‐density EEG study of sleep slow waves in humans. Sleep 30:1643–1657. [DOI] [PMC free article] [PubMed] [Google Scholar]
- Sanchez‐Vives MV, McCormick DA (2000): Cellular and network mechanisms of rhythmic recurrent activity in neocortex. Nat Neurosci 3:1027–1034. [DOI] [PubMed] [Google Scholar]
- Shouse MN, da Silva AM, Sammaritano M (1996): Circadian rhythm, sleep, and epilepsy. J Clin Neurophysiol 13:32–50. [DOI] [PubMed] [Google Scholar]
- Steriade M, Contreras D (1995): Relations between cortical and thalamic cellular events during transition from sleep patterns to paroxysmal activity. J Neurosci 15:623–642. [DOI] [PMC free article] [PubMed] [Google Scholar]
- Steriade M, McCormick DA, Sejnowski TJ (1993): Thalamocortical oscillations in the sleeping and aroused brain. Science 262:679–685. [DOI] [PubMed] [Google Scholar]
- Swann NC, Cai W, Conner CR, Pieters TA, Claffey MP, George JS, Aron AR, Tandon N (2012): Roles for the pre‐supplementary motor area and the right inferior frontal gyrus in stopping action: Electrophysiological responses and functional and structural connectivity. Neuroimage 59:2860–2870. [DOI] [PMC free article] [PubMed] [Google Scholar]
- Takahara M, Nittono H, Hori T (2002): Comparison of the event‐related potentials between tonic and phasic periods of rapid eye movement sleep. Psychiatr Clin Neurosci 56:257–258. [DOI] [PubMed] [Google Scholar]
- Tononi G (2008): Consciousness as integrated information: A provisional manifesto. Biol Bull 215:216–242. [DOI] [PubMed] [Google Scholar]
- Viswanathan A, Freeman RD (2007): Neurometabolic coupling in cerebral cortex reflects synaptic more than spiking activity. Nat Neurosci 10:1308–1312. [DOI] [PubMed] [Google Scholar]
- Volgushev M, Chauvette S, Mukovski M, Timofeev I (2006): Precise long‐range synchronization of activity and silence in neocortical neurons during slow‐wave oscillations [corrected]. J Neurosci 26:5665–5672. [DOI] [PMC free article] [PubMed] [Google Scholar]
- Vyazovskiy VV, Cirelli C, Pfister‐Genskow M, Faraguna U, Tononi G (2008): Molecular and electrophysiological evidence for net synaptic potentiation in wake and depression in sleep. Nat Neurosci 11:200–208. [DOI] [PubMed] [Google Scholar]
- Wehrle R, Kaufmann C, Wetter TC, Holsboer F, Auer DP, Pollmacher T, Czisch M (2007): Functional microstates within human REM sleep: First evidence from fMRI of a thalamocortical network specific for phasic REM periods. Eur J Neurosci 25:863–871. [DOI] [PubMed] [Google Scholar]
- Yamao Y, Matsumoto R, Kunieda T, Arakawa Y, Kobayashi K, Usami K, Shibata S, Kikuchi T, Sawamoto N, Mikuni N, Ikeda A, Fukuyama H, Miyamoto S (2014): Intraoperative dorsal language network mapping by using single‐pulse electrical stimulation. Hum Brain Mapp 35:4345–4361. [DOI] [PMC free article] [PubMed] [Google Scholar]
Associated Data
This section collects any data citations, data availability statements, or supplementary materials included in this article.
Supplementary Materials
Supporting Information
Supporting Information
Supporting Information
Supporting Information
Supporting Information
Supporting Information
Supporting Information
Supporting Information
Supporting Information
Supporting Information
Supporting Information
Supporting Information