

Abstract
Introduction
Blood oxygenation‐level dependent (BOLD) magnetic resonance imaging signal changes in response to stimuli have been used to evaluate age‐related changes in neuronal activity. Contradictory results from these types of experiments have been attributed to differences in cerebral blood flow (CBF) and cerebral metabolic rate of oxygen (CMRO2). To clarify the effects of these physiological parameters, we investigated the effect of age on baseline CBF and CMRO2.
Materials and Methods
Twenty young (mean ± sd age, 28 ± 3 years), and 45 older subjects (66 ± 4 years) were investigated. A dual‐echo pseudocontinuous arterial spin labeling (ASL) sequence was performed during normocapnic, hypercapnic, and hyperoxic breathing challenges. Whole brain and regional gray matter values of CBF, ASL cerebrovascular reactivity (CVR), BOLD CVR, oxygen extraction fraction (OEF), and CMRO2 were calculated.
Results
Whole brain CBF was 49 ± 14 and 40 ± 9 ml/100 g/min in young and older subjects respectively (P < 0.05). Age‐related differences in CBF decreased to the point of nonsignificance (B=−4.1, SE=3.8) when EtCO2 was added as a confounder. BOLD CVR was lower in the whole brain, in the frontal, in the temporal, and in the occipital of the older subjects (P<0.05). Whole brain OEF was 43 ± 8% in the young and 39 ± 6% in the older subjects (P = 0.066). Whole brain CMRO2 was 181 ± 60 and 133 ± 43 µmol/100 g/min in young and older subjects, respectively (P<0.01).
Discussion
Age‐related differences in CBF could potentially be explained by differences in EtCO2. Regional CMRO2 was lower in older subjects. BOLD studies should take this into account when investigating age‐related changes in neuronal activity. Hum Brain Mapp 36:3973–3987, 2015. © 2015 Wiley Periodicals, Inc.
Keywords: calibrated magnetic resonance imaging, cerebral metabolic rate of oxygen, cerebral blood flow, ageing
Abbreviations
- ΔEtO2
Difference in EtO2 from baseline to hypercapnia
- ΔEtCO2
Difference in EtCO2 from baseline to hypercapnia
- λ
Blood‐tissue water partition coefficient
- ASL
Arterial spin labeling
- BOLD
Blood oxygen level‐dependent signal
- CBF
Cerebral blood flow
- CMRO2
Cerebral metabolic rate of oxygen
- CVR
Cerebrovascular reserve
- DWI
Diffusion‐weighted imaging
- EtO2
End‐tidal partial pressure of oxygen
- EtCO2
End‐tidal partial pressure of carbon dioxide
- FLAIR
Fluid attenuation inversion recovery
- M0b
Blood magnetization
- M0t
Tissue magnetization
- MNI
Montreal neurological institute
- MP‐RAGE
Magnetization prepared rapid acquisition echo
- ns
Nonsignificant
- O15‐PET
Oxygen‐15 positron emission tomography
- OEF
Oxygen extraction fraction
- PaCO2
Arterial partial pressure of carbon dioxide
- PCA
phase‐contrast MR angiography
- pCASL
Pseudocontinuous arterial spin labeling
- ROI
Region of interest
INTRODUCTION
Neuroimaging studies have been used to relate age‐associated performance decline to structural and physiological changes. For instance, structural imaging studies have demonstrated an age‐dependent frontal lobe atrophy [Coffey et al., 1992; Cowell et al., 1994; Good et al., 2001] consistent with a decline in frontal cortical density [Good et al., 2001; Sowell et al., 2003; Tisserand et al., 2004; Van Laere and Dierckx, 2001]. Decreases in cerebral blood flow (CBF) have [Kalaria, 2009; Leenders et al., 1990; Parkes et al., 2004] been attributed to changes in the cerebral blood vessels density, the fibrogenesis of basement membranes [Farkas and Luiten, 2001], degeneration of pericytes, and a decreased elasticity of arteries, arterioles, and capillaries [Kalaria, 1996]. Blood oxygen‐level dependent (BOLD) magnetic resonance imaging (MRI), which is based on changes in T2*‐weighted signal, has been used to investigate the effect of aging on neuronal activity [Rajah and D'Esposito, 2005]. The BOLD signal is complex but is thought to be dependent on changes in CBF, cerebral blood volume (CBV) or oxygen extraction fraction (OEF), and can therefore only be considered as an indirect measure of neuronal activity. Changes in the BOLD response over time may also be reflective of structural changes occurring in the cerebrovascular system due to normal ageing. Calibrated MRI is increasingly used to isolate the different subcomponents of the BOLD contrast [Davis et al., 1998; Hoge et al., 1999] and thus to provide a more direct measure of neuronal activity. This technique generally uses a dual‐echo arterial spin labeling (ASL) sequence which allows for simultaneous acquisition of perfusion‐weighted (first echo) and BOLD contrast (second echo) [Kim et al., 1997]. When this sequence is combined with a hypercapnic or a hyperoxic challenge and an activity task, calibration models can be used to obtain relative changes in the cerebral metabolic rate of oxygen (CMRO2) [Davis et al., 1998; Gauthier et al., 2012; Hoge et al., 1999]. Studies adopting this technique have demonstrated that the ratio of the change in CBF as a function of changes in CMRO2 (ΔCBF/ΔCMRO2) is linked to age‐dependent changes in the BOLD signal [Hutchison et al., 2013]. Still, the effect of age on neuronal activity remains unclear as one study found a lower ΔCBF in the elderly with equal BOLD response suggesting an increase in neuronal activity with age [Gauthier et al., 2013], while another study found an equal ΔCBF with an increase in BOLD signal suggesting a reduction in neuronal activity with age [Mohtasib et al., 2012]. These conflicting results could be explained by age‐related differences in baseline CBF and CMRO2. The current standard to evaluate baseline CBF and CMRO2 simultaneously is oxygen‐15 positron emission tomography (O15‐PET) [Mintun et al., 1984]. Its invasive nature and the requirement of an onsite cyclotron have limited the number of studies. Furthermore, the low resolution of this technique can result in partial volume effects that are difficult to manage in patient populations with different degrees of brain atrophy. The uncertain effect of partial volume on the obtained measurements has made that the effect of age on baseline CBF and CMRO2 is still unsettled. While some studies found a stable CMRO2 [Pantano et al., 1984], others found a decrease with age [Yamaguchi et al., 1986]. Recent methodological developments in calibrated MRI have made it possible to not only measure relative changes in CBF and CMRO2 but also to obtain absolute baseline values. For this, ASL MRI is used to measure baseline CBF while respiratory modulations (hypercapnic and hyperoxic challenges) are used to calculate OEF and CMRO2 [Bulte et al., 2012; Gauthier and Hoge, 2012]. As the quantitative measurements obtained with this technique were shown to be in agreement with PET studies [Wise et al., 2013] it offers prospects to use this technique to evaluate changes in baseline CBF and CMRO2, which can then consequently give insight into age‐related changes in neuronal activity.
Thus, the purpose of this study was to apply calibrated MRI to evaluate the effect of age on baseline CBF and CMRO2.
MATERIALS AND METHODS
Subjects
This study was approved by the medical ethical review board of our institution. Sixty‐five volunteers were included and informed consent was obtained from all participants. The group was split into twenty young healthy subjects with a mean age of 28 years (sd 3, range: 24–33 years) and 45 elderly healthy subjects (n = 45) with a mean age of 66 (sd 4, range: 60–78 years). Subjects were defined as healthy if no previous history of cerebrovascular disease or other brain disease was present and if no structural lesions were seen on MR imaging (conventional MRI and MR angiography).
MR Imaging
MRI was performed on a 3 Tesla MRI scanner with a quadrature body coil for transmission and an eight‐channel head coil as a signal receiver (Achieva, Philips Medical Systems, Best, The Netherlands). Cardiac and respiratory rate were monitored throughout the entire examination. The following scans were acquired; a T 1‐weighted magnetization prepared rapid acquisition gradient echo (MP‐RAGE), a T2‐weighted fluid attenuation inversion recovery (T2‐FLAIR), diffusion‐weighted MR imaging (DWI), a sagittal and coronal two‐dimensional‐phase‐contrast MR angiography (2D‐PCA), a blood magnetization map (M 0), a T 1 of tissue map (T 1 map), and a dual‐echo pseudocontinuous arterial spin labeling (pCASL) sequence [Dai et al., 2008].
Scan parameters of the pCASL sequence were; TR/TE1/TE2: 4,000/13.79/36.25 ms, echo train length 35, voxel size 3 × 3 × 7 mm3, gap between slices 1 mm, 11 slices, matrix 80 × 80, FOV 240 × 240 mm, 135 dynamics, and imaging time 18:30 min. The label duration was 1,650 ms and the postlabel delay ranged from 1,550to 2,185 ms. The range of postlabel delays was caused by the use of a multislice single‐shot echo‐planar imaging readout causing a different postlabel delay in each slice. The labeling plane of the pCASL sequence was positioned based on the PCA images, this was done according to the guidelines of the recently published ASL white paper [Alsop et al., in press]; 85 mm below the AC‐PC line [Aslan et al., 2010]. Scan parameters of the M 0 map and the T 1 map were identical to the pCASL sequence (same matrix and same echo time) but without labeling. For the M 0 map, a long TR (8,000 ms) was used.
Respiratory Challenge
A prospective end‐tidal gas targeting system (RespirActTM, Thornhill Research, Toronto, Canada) was used to modulate end‐tidal CO2 and O2 pressures (EtCO2 and EtO2, respectively) [Slessarev et al., 2007]. The Respiract system is a three‐gas blender system connected to a single tube. The gas is delivered through four connected gas mixtures; gas A: 21 O2/79% N2, gas B: 100% O2, gas C: 10% O2/90% N2, and gas D: 20% CO2, 10% O2/70% N2 and is delivered to the subject via a face mask which is airtight sealed using transparent medical dressings (Tegaderm; 3M, St Paul, MN). Sample lines are connected to this face mask to sample gases. Built in gas sensors for CO2 and O2 are used to digitize and record the CO2 and O2 concentrations continuously at 40 Hz and a pressure transducers is used to identify end‐tidal values (EtCO2 and EtO2) from these raw CO2 and O2 data. A laptop computer controls the composition of the gas delivered to the subject and is used to build respiratory paradigms. Before each experiment baseline parameters (i.e., EtCO2, EtO2, respiratory rate, and gas breathing volume) of the subject were recorded during a test run outside the MRI scanner just prior to MR imaging. The respiratory paradigm which was executed during the dual‐echo pCASL sequence, consisted of baseline breathing interleaved with two hypercapnia phases of 105 s where EtCO2 was targeted at 10 mmHg above the subject's baseline. Between these hypercapnic challenges, a single hyperoxia phase of 180 s during which EtO2 was targeted at 300 mmHg EtO2 was performed (Fig. 1). Two separate hypercapnia blocks were preferred above one longer block to improve the patient tolerability. To further improve the patient tolerability the EtCO2 was gradually (75 s) ramped up from baseline to hypercapnia level. At the same time, this step had the advantage that an equilibrium level was ensured at the time of the hypercapnia phase. As well, a considerable amount of time was spent at baseline breathing in between the hypercapnia and hyperoxia blocks to establish a return of the signal to baseline level such that a robust BOLD drift correction could be applied during post processing and to avoid mixing effects The average EtCO2 and EtO2 values which were recorded during baseline, hypercapnic and hyperoxic breathing were measured for each subject. Table 1 shows the average values for the young and elderly subjects.
Figure 1.
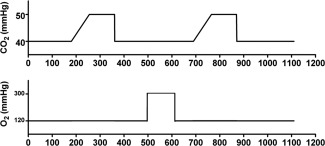
Image displaying the respiratory paradigm. Baseline breathing was interleaved with two hypercapnic blocks of 105 s in which EtCO2 was targeted at 10 mmHg above the individual subject baseline EtCO2 and one block of 180 s of hyperoxic breathing with a target of 300 mmHg EtO2. The EtCO2 was gradually (75 s) ramped up to hypercapnia level to ensure that an equilibrium stage was reached at the time of the hypercapnia phase.
Table 1.
Subject characteristics
| Young | Elderly | P‐value | |
|---|---|---|---|
| N | 16 | 30 | |
| Male | 7 (44%) | 17 (57%) | |
| Age (years) | 28 ± 3 (24–33) | 66 ± 4 (60–76) | <0.001 |
| EtO2 baseline (mmHg) | 122 ± 5 | 114 ± 4 | <0.001 |
| EtCO2 baseline (mmHg) | 39 ± 3 | 35 ± 3 | <0.01 |
| EtO2 hypercapnia (mmHg) | 128 ± 8 | 121 ± 5 | <0.01 |
| EtCO2 hypercapnia (mmHg) | 46 ± 4 | 41 ± 3 | <0.001 |
| EtO2 hyperoxia (mmHg) | 277 ± 25 | 257 ± 24 | <0.01 |
| EtCO2 hyperoxia (mmHg) | 39 ± 3 | 35 ± 3 | <0.01 |
| ΔEtO2 hypercapnia (mmHg) | 6 ± 4 | 7 ± 3 | ns |
| ΔEtCO2 hypercapnia (mmHg) | 7 ± 3 | 6 ± 2 | ns |
| ΔEtO2 hyperoxia (mmHg) | 155 ± 21 | 142 ± 23 | ns |
| ΔEtCO2 hyperoxia (mmHg) | −0.2 ± 1.1 | 0.2 ± 0.8 | ns |
Baseline characteristics and end‐tidal partial pressure of oxygen (EtO2) and carbon dioxide (EtCO2) at baseline, at hypercapnia and at hyperoxia are given (mean ± standard deviation).
Postprocessing
An in‐house Interactive Data Language (IDL) tool was used to calculate the brain hemodynamic maps (IDL 6.1 for Windows, ITT Visual Information Solutions, Boulder, CO). Coregistration of label and control images was performed on the first echo using an affine transformation. Thereafter, first echo label and control data were surround subtracted [Liu and Wong, 2005] to create ASL subtraction images (ΔM images). The ΔM images obtained at baseline, hypercapnic and hyperoxic breathing were averaged to create ΔM total (baseline, hypercapnic, and hyperoxic) images. Baseline data analysis excluded the hypercapnia ramps, the hypercapnia plateau phases and the hyperoxia phase. As well, the data acquired within the first minute after each block was excluded. This leads to 7:30 min of acquisition time which was used to analyze the baseline data. To ensure an equilibrium state of the signal within the hypercapnia and hyperoxia plateau phases, the first 2 dynamics were discarded prior to averaging. Perfusion was quantified based on these images using the following equation [Alsop et al., in press]:
| (1) |
where the T 1b represents the longitudinal relaxation time of arterial blood (1.65 s), λ is the blood‐tissue water partition coefficient (0.98), IE is the inversion efficiency, and PLD is the postlabel delay (1,550–2,185 ms). The inversion efficiency was put at 0.95 for the images obtained at baseline breathing and 0.84 for the images obtained during hypercapnic breathing [Aslan et al., 2010].
BOLD data was obtained using the second echo (long TE) of the ASL scan. With a quadratic fit to the baseline points the BOLD signal time series was detrended to remove signal drift. BOLD signal changes during hypercapnic and hyperoxic breathing were obtained by averaging the signal changes obtained within these phases, prior to this the first two image pairs within each phase were discarded.
ASL and BOLD CVR was determined by calculating the percent CBF and BOLD change (from baseline to hypercapnia) and dividing these values by the magnitude of the individual's hypercapnic breathing challenge (ΔEtCO2).
A general BOLD signal model was used to calculate OEF and CMRO2 maps. For this, a constant influence of the CBF change on the BOLD signal and a constant relationship between changes in CBF and CBV was assumed. First, the BOLD signal was calibrated against known changes in CBF to obtain the BOLD calibration constant M. For this the hypercapnia calibration model was used and the M is than the theoretical maximum BOLD signal change that would emerge with a complete washout of deoxyhemoglobin [Bulte et al., 2012; Davis et al., 1998; Hoge et al., 1999]:
| (2) |
where BOLD0, CMRO2|0, and CBF0 represent the values at baseline and the corresponding variables without subscript represent the values at hypercapnic breathing. The β was set at 1.3 for 3.0 Tesla field strengths [Chiarelli et al., 2007b] and α (the Grubb coefficient) was set at 0.23 [Chen and Pike, 2009]. Thereafter, the hyperoxia calibration model [Chiarelli et al., 2007b] was used to calculate the relative change in deoxyhaemoglobin (HHb) concentration:
| (3) |
OEF was estimated using the framework described by Bulte et al. [2012] (Appendix A), and finally, the CMRO2 was calculated from the OEF0 and the CBF0 [Xu et al., 2009]:
| (4) |
In this equation, C a is a constant representing the amount of oxygen molecules a unit volume of blood can carry (C a = 833.7 μmol O2/100 ml blood) [Xu et al., 2009].
FMRIB Software Library was used for coregistration (FSL, FMRIB, Oxford, UK). All maps (CBF, ASL‐CVR, BOLD‐CVR, OEF, and CMRO2 maps) were coregistered to the MNI standard space (2 mm isotropic resolution) [Mazziotta et al., 2001]. This was done by first isolating brain tissue voxels in the MP‐RAGE images using the FSL brain extraction tool (BET) [Smith et al., 2004]. This was followed by coregistration of the T 1 maps to the brain‐extracted MP‐RAGE. These images were subsequently coregistered to the MNI standard brain using an affine (FMRIB's linear image registration tool) [Jenkinson and Smith, 2001] and a nonlinear transform (FMRIB's nonlinear image registration tool) [Andersson et al., 2007]. The resulting transformation matrices were then applied to the hemodynamic maps. Region of interest (ROI) were derived from the MNI‐registered MP‐RAGE images by intersecting the subject's own gray matter mask with the MNI template for the different anatomical regions (whole brain gray matter, frontal gray matter, temporal gray matter, occipital gray matter, parietal gray matter, and deep gray matter). These regions were consequently overlaid on the MNI‐registered hemodynamic maps to obtain the hemodynamic values within these regions.
Statistical Analysis
Prior to the statistical analysis, a neuroradiologist (J.H.) assessed the T2‐FLAIR and DWI images for lesions within the brain tissue. IBM SPSS package (version 19.0.1. SPSS, Chicago, IL) was used for statistical analysis. To detect outliers in both the young and the older group, the outlier labeling rule was applied and a multiplier (g‐factor) of 1.5 [Hoaglin et al., 1986] was used. For this, the 25th and 75th percentile values were calculated using descriptive statistics after which the difference between the upper and lower percentile was calculated and multiplied by the g‐factor. This value was then subtracted from the lower quartile and enumerated to the upper quartile providing us with a lower and upper boundary. To compare the results of the young subjects to the results of the older subjects, two‐sided independent student's t tests were performed. A P‐value < 0.05 was considered statistically significant. The relation between the hemodynamic parameters and EtCO2 was evaluated with linear regression analysis. For specific cases (CBF and CMRO2), a linear model with EtCO2 added as a covariate was created to evaluate differences between the young and older subjects. EtCO2 was considered a confounder as this factor is known to be related to the arterial concentration of CO2 [Fierstra et al., 2011] which is known to have a large effect on perfusion and thus on the other hemodynamic parameters as well [Grubb, Jr. et al., 1974; Kety and Schmidt, 1948].
RESULTS
Calibrated MRI could not be performed in 15 of the 65 subjects due to either anxiety during hypercapnic breathing (n=7) or due to technical problems (n=8). Technical problems were related to the scanner or to the scan sequence in five subjects. In one subject there was a problem with the RespirActTM device, and in two subjects the head did not fit inside the head coil while wearing the breathing mask. In one subject calibrated MRI was performed but the data had to be excluded due to failed coregistration and lesions in the frontal cortex caused by a previous head trauma, respectively.
During outlier detection analysis, the 25th percentile of the whole brain CBF data were found to be 32 ml/100 g/min while that of the 75th percentile was 64 ml/100 g/min. From this, a lower and upper outlier‐boundary of 0 and 112 ml/100 g/min was calculated. Two young subjects had whole brain CBF data of 129 and 167 ml/100 g/min, respectively, and thus were excluded from analysis. Thus, analysis were performed on the results of 16 young volunteers (mean (±sd) age: 28 ± 3 years, range: 24–33 years, 6 male subjects) and 30 elderly volunteers (mean (±sd) age: 66 ± 4 years, range: 60–76 years, 16 male subjects). Figure 2 demonstrates schematically why included subjects or their data were excluded from analysis for both the young and elderly group. Baseline characteristics of the subjects are shown in Table 1.
Figure 2.
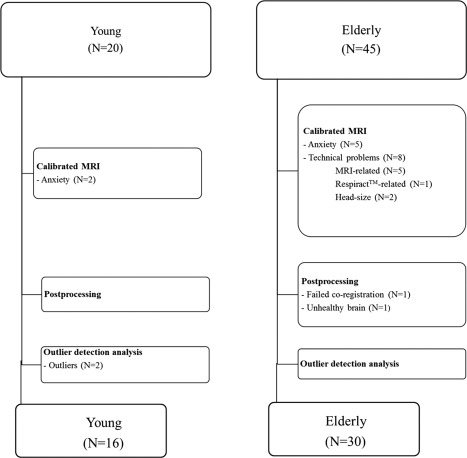
This flowchart demonstrates the reasons why data could not be retrieved from all included subjects. Either the data could not be obtained (box 1), we encountered problems during postprocessing (box 2), or subjects were found to be outliers (box 3).
The EtO2 and EtCO2 at baseline, during hypercapnia and during hyperoxia differed significantly between the young and elderly subjects. No significant differences in ΔEtO2 and ΔEtCO2 were found between both groups (Table 1). Group average CBF, ASL‐CVR, BOLD‐CVR, OEF, and CMRO2 maps of young and older subjects are shown in Figure 3. Figure 4A shows the images of a 25‐year old male subject and its corresponding CBF, CBF at hypercapnia, M, OEF, and CMRO2 value. Figure 4B shows the images of a 60‐year old male subject and its corresponding hemodynamic values.
Figure 3.
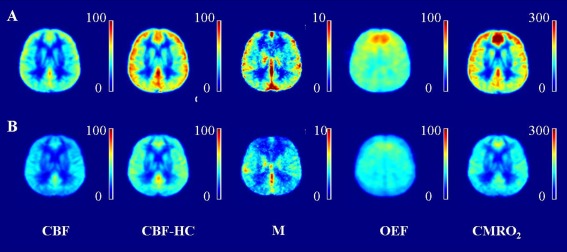
(A) Grouped maps of the young subjects, from left to right; (B) Grouped maps of the elderly subjects; ASL CBF map (in ml/100 g/min), ASL CBF at hypercapnia map (in ml/100 g/min), M map, OEF map (in %), and CMRO2 map (in µmol/100 g/min). Note the high intensity region in the frontal lobe of the young subjects, this is probably due to a vascular artifact.
Figure 4.
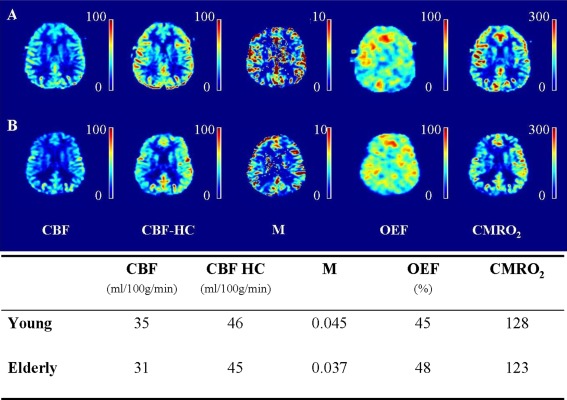
(A) Images of a 25‐year old male subject. The values of the cerebral blood flow (CBF, in ml/100 g/min), of the CBF at hypercapnia (CBF HC, in ml/100 g/min), of the M, of the oxygen extraction fraction (OEF, in %) and of the cerebral metabolic rate of oxygen (CMRO2, in µmol/100 g/min) for this subject are shown in the table. (B) Images of a 60‐year old male subject, the corresponding hemodynamic values are shown in the table.
Cerebral Blood Flow
Mean (±sd) whole brain gray matter CBF was 49 ± 14 (range: 35–93) ml/100 g/min in the young and 40 ± 9 (range: 21–59) ml/100 g/min in the elderly (P < 0.05). The CBF was significantly lower in the frontal, temporal, parietal cortex, and the deep gray matter of the older subjects (P < 0.01, < 0.01, < 0.05, and < 0.05, Table 2). No significant difference in the occipital cortex was found. There was a significant relation between the whole brain CBF and baseline EtCO2 (R 2 = 0.215, P < 0.01, Fig. 5). When EtCO2 was taken as a confounder, the difference in whole brain and regional CBF caused by the subgroup was no longer apparent (Table 3, Fig. 6).
Table 2.
Whole brain and regional evaluation
| Young (n=16) | Elderly (n=30) | P‐value | ||
|---|---|---|---|---|
| CBF (ml/100g/min) | ||||
| Wb GM | 49 ± 14 | 40 ± 9 | <0.05 | |
| Frontal | 50 ± 15 | 40 ± 9 | <0.01 | |
| Temporal | 50 ± 13 | 41 ± 10 | <0.01 | |
| Parietal | 50 ± 15 | 41 ± 10 | <0.05 | |
| Occipital | 48 ± 15 | 41 ± 11 | ns | |
| DGM | 42 ± 11 | 35 ± 9 | <0.05 | |
| ASL CVR (% per 10 mmHg ΔEtCO2) | ||||
| Wb GM | 45 ± 17 | 45 ± 15 | ns | |
| Frontal | 46 ± 15 | 46 ± 20 | ns | |
| Temporal | 54 ± 17 | 54 ± 22 | ns | |
| Parietal | 46 ± 19 | 45 ± 14 | ns | |
| Occipital | 46 ± 23 | 47 ± 17 | ns | |
| DGM | 53 ± 21 | 49 ± 22 | ns | |
| M | ||||
| Wb GM | 0.043 ± 0.014 | 0.034 ± 0.01 | <0.01 | |
| Frontal | 0.039 ± 0.013 | 0.029 ± 0.01 | <0.01 | |
| Temporal | 0.044 ± 0.013 | 0.035 ± 0.01 | <0.01 | |
| Parietal | 0.045 ± 0.015 | 0.039 ± 0.01 | ns | |
| Occipital | 0.050 ± 0.019 | 0.039 ± 0.01 | <0.05 | |
| DGM | 0.041 ± 0.013 | 0.033 ± 0.01 | <0.05 | |
| BOLD CVR (per 10 mmHg ΔEtCO2) | ||||
| Wb GM | 2.4 ± 0.7 | 2.0 ± 0.4 | <0.05 | |
| Frontal | 2.2 ± 0.7 | 1.8 ± 0.5 | <0.05 | |
| Temporal | 2.5 ± 0.7 | 2.1 ± 0.5 | <0.05 | |
| Parietal | 2.4 ± 0.7 | 2.1 ± 0.4 | ns | |
| Occipital | 2.7 ± 0.8 | 2.3 ± 0.5 | <0.05 | |
| DGM | 2.5 ± 0.8 | 2.1 ± 0.6 | ns | |
| OEF (%) | ||||
| Wb GM | 43 ± 8 | 39 ± 6 | ns | |
| Frontal | 47 ± 8 | 40 ± 6 | <0.01 | |
| Temporal | 48 ± 10 | 40 ± 7 | <0.01 | |
| Parietal | 42 ± 9 | 39 ± 7 | ns | |
| Occipital | 41 ± 11 | 39 ± 9 | ns | |
| DGM | 53 ± 8 | 42 ± 7 | <0.001 | |
| CMRO2 (µmol/100g/min) | ||||
| Wb GM | 181 ± 60 | 133 ± 43 | <0.01 | |
| Frontal | 198 ± 75 | 134 ± 42 | <0.01 | |
| Temporal | 197 ± 67 | 136 ± 43 | <0.01 | |
| Parietal | 172 ± 56 | 132 ± 42 | <0.01 | |
| Occipital | 165 ± 56 | 134 ± 54 | ns | |
| DGM | 186 ± 49 | 126 ± 43 | <0.001 | |
CBF, cerebral blood flow; ASL CVR, arterial spin labeling cerebrovascular reactivity; BOLD, blood oxygenation level‐dependent; OEF, oxygen extraction fraction; CMRO2, cerebral metabolic rate of oxygen; ns, nonsignificant.
Whole brain gray matter (Wb GM) and regional gray matter values (frontal, temporal, parietal and occipital cortex and the deep gray matter (DGM)) of the young subjects were compared to the values of the older subjects.
Figure 5.
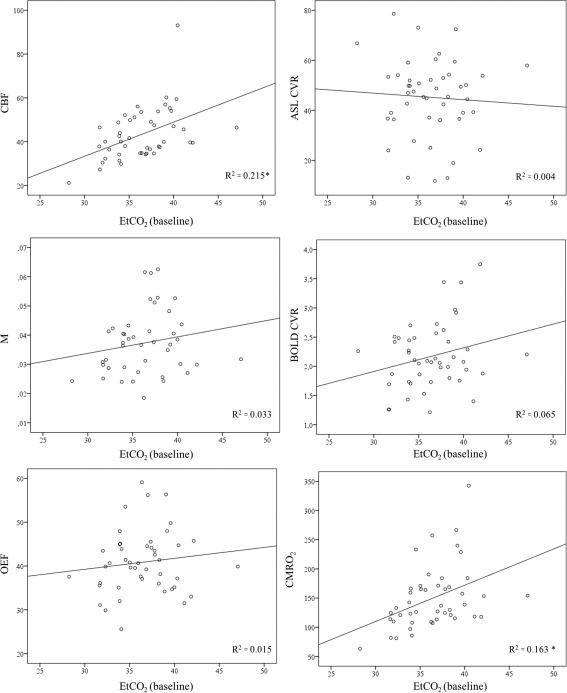
The relation between baseline EtCO2 (x‐axis) and the hemodynamic parameters (the CBF, the ASL CVR, the M value, the blood oxygenation level‐dependent CVR (ΔBOLD), the OEF and the CMRO2 is investigated. The relation between EtCO2 and CBF was significant (R 2 = 0.215, P < 0.01), same for the relation between EtCO2 and the CMRO2 (R 2 = 0.163, P < 0.01). There was no relation between EtCO2 and ASL CVR, M value, BOLD CVR or OEF (R 2 = 0.004, R 2 = 0.033, R 2 = 0.065, and R 2 = 0.015, respectively).
Table 3.
Results of the linear regression analysis
| Model 1: Crude effect | Model 2: Adjusted for EtCO2 (baseline) | |||||||||
|---|---|---|---|---|---|---|---|---|---|---|
| Parameter | B subgroup | SE | P‐value | B subgroup | SE | P‐value | B EtCO2 | SE | P‐value | |
| CBF | ||||||||||
| Wb GM | −8.7 | 3.5 | <0.05 | −4.1 | 3.8 | ns | 1.3 | 0.5 | <0.05 | |
| Frontal | −10.4 | 3.4 | <0.01 | −5.8 | 3.7 | ns | 1.3 | 0.5 | <0.05 | |
| Temporal | −9.4 | 3.4 | <0.01 | −4.6 | 3.6 | ns | 1.3 | 0.5 | <0.01 | |
| Parietal | −8.6 | 3.6 | <0.05 | −3.9 | 3.9 | ns | 1.3 | 0.5 | <0.05 | |
| Occipital | −7.7 | 3.9 | ns | −2.9 | 4.2 | ns | 1.3 | 0.6 | <0.05 | |
| DGM | −7.4 | 3.0 | <0.05 | −3.6 | 3.2 | ns | 1.0 | 0.4 | <0.05 | |
| CMRO2 | ||||||||||
| Wb GM | −47.3 | 15.4 | <0.01 | −33.0 | 17.3 | ns | 4.0 | 2.4 | ns | |
| Frontal | −64.1 | 17.1 | <0.001 | −48.9 | 19.3 | <0.05 | 4.3 | 2.6 | ns | |
| Temporal | −60.9 | 16.2 | <0.001 | −45.7 | 18.2 | <0.05 | 4.2 | 2.4 | ns | |
| Parietal | −40.5 | 14.8 | <0.01 | −25.9 | 16.5 | ns | 4.1 | 2.3 | ns | |
| Occipital | −30.7 | 16.9 | ns | −17.9 | 19.2 | ns | 3.6 | 2.6 | ns | |
| DGM | −59.7 | 14.0 | <0.001 | −43.9 | 15.4 | <0.01 | 4.4 | 2.1 | <0.05 | |
CBF, cerebral blood flow; CMRO2, cerebral metabolic rate of oxygen; EtCO2, end‐tidal CO2; SE, standard error; ns, nonsignificant.
Model 1 shows the effect of subgroup (young versus old) on CBF and CMRO2; the B‐value is the mean difference between both groups in the model. Model 2 shows the results of the model with EtCO2 as a confounder; the mean difference in CBF and CMRO2 caused by the subgroup (B subgroup) and by the EtCO2 (B EtCO2) are given.
Figure 6.
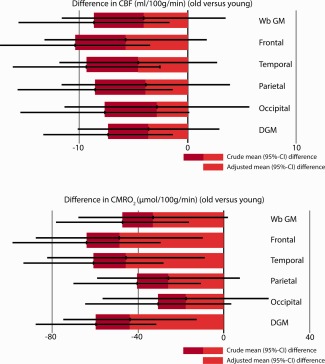
Results of the linear regression analysis. The graphs demonstrate the mean (95% confidence interval) difference in cerebral blood flow (CBF, in ml/100 g/min) and cerebral metabolic rate of oxygen (CMRO2, in µmol/100 g/min) between the young and old. The effect of EtCO2 as a confounder is given in light red, the remaining effect of the subgroup is shown in dark red. There remains a significant difference in the CMRO2 of the young versus elderly subjects measured in the frontal cortex, temporal cortex and the deep gray matter when EtCO2 is taken as a covariate. There is a trend toward a significant difference in whole brain gray matter CMRO2 (Wb GM, P = 0.063).
The M Value
The M value was significantly higher in the young subjects (0.043 ± 0.014 (0.018–0.063)) than in the elderly subjects (0.034 ± 0.01 (0.024–0.053)) (P < 0.01). The M value was significantly higher in the frontal cortex, temporal cortex, occipital cortex and deep gray matter of the young subjects (P < 0.01, 0.01, 0.05, and 0.05, respectively, Table 2). The M value was not significantly different in the parietal cortex of the young versus elderly subjects. There was no significant relation between the M value and the EtCO2 (R 2 = 0.033, P = 0.24, Fig. 5).
Cerebrovascular Reactivity
No significant difference in whole brain gray matter ASL CVR between the young (45 ± 17 (13–73)%) and the elderly (45 ± 15 (12–79)%) subjects was found. The difference in whole brain gray matter BOLD CVR between the young (2.4 ± 0.7 (1.2–3.8) and elderly (2.0 ± 0.4 (1.3–3.0)) subjects was significant (P < 0.05). No significant regional differences in ASL CVR between the young and elderly subjects were found (Table 2). BOLD CVR was significantly higher in the frontal, temporal and the occipital cortex of the younger compared to the elderly subjects (P < 0.01 and < 0.05, respectively, (Table 2)). There was no significant relation between whole brain gray matter ASL CVR and baseline EtCO2 (R 2 = 0.004) or BOLD CVR and baseline EtCO2 (R 2 = 0.065) (Fig. 5). The relation between ASL CVR, defined as the percentage change in CBF for a 10 mmHg change in EtCO2, and the CBF change per 1 mmHg change in EtCO2 was: ASL CVR = 14 (ΔCBF/1 mmHg ΔEtCO2) + 37, R 2 = 0.152 (P < 0.05) (Fig. 7).
Figure 7.
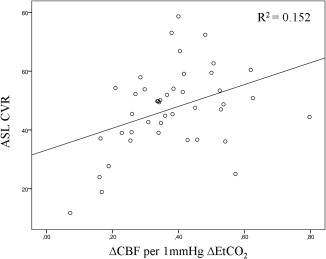
Scatter plot demonstrating the relation between the ASL CVR, defined as the percent change in CBF per 10 mmHg change in EtCO2, and the change in CBF per 1 mmHg change in EtCO2 (P < 0.05).
Oxygen Extraction Fraction
Whole brain gray matter OEF was not significantly different in the young (43 ± 8 (range: 33–59) %) than in the elderly (39 ± 6 (range: 26–56) %) subjects (P = 0.066). The OEF was higher in the frontal, temporal and the deep gray matter of the young subjects (P < 0.01, P < 0.01, and P < 0.001, respectively, Table 2). There was no relation between OEF and baseline EtCO2 (R 2 = 0.015, Fig. 5).
Cerebral Metabolic Rate of Oxygen
Whole brain gray matter CMRO2 was 181 ± 60 (109–343) µmol/100 g/min in the young and 133 ± 43 (63–267) µmol/100 g/min in the elderly subjects (P < 0.01). Regional analysis, demonstrated a significant lower CMRO2 in the frontal, temporal, parietal cortex, and the deep gray matter of the older subjects (P < 0.01, 0.01, 0.01, and 0.001 respectively Table 2). No significant differences in the occipital cortex were found. There was a significant relation between the whole brain CMRO2 and the baseline EtCO2 (R 2 = 0.163, P < 0.01, Fig. 5). When EtCO2 was taken as a confounder, we still found a significant decrease in baseline CMRO2 with age in whole brain and frontal, temporal cortex, and deep gray matter; P < 0.05, < 0.05, < 0.05, and < 0.01 (Table 3, Fig. 6).
DISCUSSSION
In this study, we found significantly lower gray matter perfusion in the older subjects. These reductions might be related to differences in the arterial partial pressure of carbon dioxide since differences decreased, and became nonsignificant when the end‐tidal partial pressure of carbon dioxide was taken into account as a confounder. We found no effect of age on ASL‐CVR. Regional OEF and whole brain and regional CMRO2 was reduced in the elderly. Regional CMRO2 stayed reduced even when EtCO2 was taken into account as a covariate. Thus, neuronal activity, evaluated with BOLD MRI, should be interpreted in the light of age‐related regional differences in baseline oxygen metabolism (CMRO2).
Cerebral Blood Flow
The effect of age on CBF has mainly been investigated in PET studies which have shown a decrease with age [Martin et al., 1991; Pantano et al., 1984]. Pantano et al. [1984] found a gray matter CBF of 50.7 ml/100 g/min in young subjects (≤50 years old) and 41.8 ml/100 g/min in older subjects (>50 years old) which is very similar to the values that were found in our study; 49 ml/100 g/min in the young subjects and 40 ml/100 g/min in the older subjects. A main disadvantage of PET is partial volume effects caused by low spatial resolution. The cerebral cortex is known to get thinner with increasing age [Creasey and Rapoport, 1985], which could result in an increased contamination of gray matter voxels with cerebrospinal fluid, and white matter in the older subjects. White matter has a lower perfusion [van Osch et al., 2009] and can thus initiate an apparent age‐related reduction in gray matter perfusion [Leenders et al., 1990; Martin et al., 1991; Pantano et al., 1984]. PET studies attempting to correct for partial volume effects could not always reproduce the reduction in CBF with age [Yoshii et al., 1988]. Although, studies performed with partial‐volume insensitive techniques, such as xenon studies [Naritomi et al., 1979] and MRI flow studies [Lu et al., 2011], did confirm a decline in CBF with increasing age. Lu et al. [2011] found a decrease in CBF of 0.8 ml/100 g/min per decade which would correspond to a CBF value of 57 ml/100 g/min at the age of 30 and 54 ml/100 g/min at 70 years of age . Parkes et al. [2004] found CBF, measured with ASL, to decrease by 0.45% per year. Assuming a linear decrease with age, this corresponds to a decrease of approximately 1.8 ml/100 g per decade which is comparable to what we found. It was suggested [Parkes et al., 2004] that either age‐related changes in physiology underlie this decrease, or, that these changes were merely artifacts resulting from brain atrophy leading to increased gray matter and CSF contamination in gray matter voxels. Alternatively, the arterial tension of carbon dioxide (PaCO2) which is also known to affect CBF [Grubb, Jr. et al., 1974; Kety and Schmidt, 1948] may play a role in age related CBF decrease. Our results support the latter hypothesis in that no significant differences in CBF were found when EtCO2, a surrogate for the arterial tension of PaCO2 [Fierstra et al., 2011], was added as a covariate to the regression models. Although, it should be noted that any other factor with a similar relation to the CBF, like for instance partial volume effects, could cause similar results. Thus, performing this analysis does not exclude the effect of partial volume on the measured decrease in CBF with age, neither that the effect could be a true age‐related effect on the CBF.
The M Value
Previous studies have demonstrated that an over‐or underestimation of the BOLD calibration constant (M) can introduce bias in the value of the coupling ratio, and thus can as such introduce errors in the CMRO2 estimates [Chiarelli et al., 2007a]. The calculation of the M value is prone to errors due to the low magnitude of perfusion changes during hypercapnia, the large extrapolation required and the relatively small number of repetitions to determine M [Chiarelli et al., 2007a]. The M values which were found in this study were corrected to match earlier published data valid for 30 ms echo time at 3T. We found slightly lower values (4.3 ± 1.4% in the young subjects and 3.4 ± 1% in the elderly subjects) than earlier published (6.0 ± 0.7%) [Gauthier and Hoge, 2012]. Interestingly, our M value was significantly lower in the elderly subjects. This was found earlier by Gauthier et al. [2013] who found a M value of 5.8 ± 0.2% in young subjects and 5.0 ± 0.3% in elderly subjects . Differences in arterial arrival time for ASL [Chiarelli et al., 2007a] and differences in baseline deoxyhaemoglobin levels [Gauthier and Hoge, 2012] have been suggested as a cause of this. Further research should aim to clarify this.
Cerebrovascular Reactivity
Pathology studies have demonstrated an age‐related decrease in vessel elasticity [Kalaria, 1996] which has been confirmed by reactivity studies [Ito et al., 2002; Lu et al., 2011]. For instance, Lu et al. [2011] found a 54% decrease in CVR in subjects going from approximately 20–80 years of age. We did not find a significant difference in whole brain (45% per 10 mmHg ΔEtCO2 for both young and elderly subjects) or regional gray matter ASL‐CVR. The CVR value which we found in our young subjects is in line with earlier published values found by Ito et al. [2002] (47% per 10 mmHg ΔEtCO2 in young subjects with a mean age of 22 years). The fact that we could not find any differences in the CVR between young and elderly subjects could be due to higher baseline EtCO2 in our young subjects (39 mmHg) compared to the elderly subjects (35 mmHg) which may have dampened the response of the young subjects to hypercapnia. Previous studies did not find such a difference in EtCO2 values between young and elderly subjects (38.5 and 39 mmHg in young and elderly subjects, respectively) [Gauthier et al., 2013]. We hypothesize these higher EtCO2 values in our young subjects to be caused by the timing of MR imaging; the young subjects were imaged in the evening after dinner time while the older subjects were imaged throughout the day. Higher glycogen status is known to be related to higher ETCO2 values [Sabapathy et al., 2006]. Although we found a significant relation between ASL CVR and the change in CBF per unit difference in EtCO2, the relation we found was only moderate. This confirms that the CVR is dependent on the actual baseline CBF.
Oxygen Metabolism
We found a trend (P = 0.066) toward lower OEF in elderly subjects (39%) compared with young subjects (43%) which seemed to arise from the frontal cortex, the temporal cortex and the deep gray matter. We found a significant decrease in baseline CMRO2 with age in whole brain and frontal, temporal, partietal cortex, and deep gray matter. This decrease remained significant in the frontal cortex, the temporal cortex and the deep gray matter after the EtCO2 was taken as a confounder. The decrease in whole brain CMRO2 trended toward significance (P = 0.063) after EtCO2 was taken as a confounder. This is in line with the results of PET studies which found a decrease in whole brain CMRO2 [Leenders et al., 1990; Yamaguchi et al., 1986]. Yamaguchi et al. found a whole brain CMRO2 of 161 µmol/100 g/min in young subjects and 142 µmol/100 g/min in elderly subjects compared with our results showing a CMRO2 of 181 µmol/100 g/min in young subjects and 133 µmol/100 g/min in older subjects. This decrease in oxygen metabolism could be attributed to several factors such as an age‐related reduction in the number of neurons [Anderson et al., 1983], an age‐related decrease in synaptic density [Huttenlocher, 1979], or an age‐related decrease in neuronal size [Terry et al., 1987]. Decreases in oxygen metabolism were most pronounced in the frontal cortex which relates well to earlier pathology studies that found the reduction in synaptic density to occur mainly in the prefrontal neocortex [Liu et al., 1996; Masliah et al., 1993; Terry et al., 1987]. Recently, Gauthier et al. [2012] found a higher OEF and CMRO2 in the frontal cortex of young subjects compared to their parietal cortex. These measurements were obtained with the “Quantitative O2 imaging” method and OEF values of 45 and 29% in the frontal and parietal cortex respectively were obtained. The CMRO2 values were 174 and 100 µmol/100 g/min in the frontal and parietal cortex, respectively [Gauthier et al., 2012]. Our results are more or less similar with a OEF of 47% in the frontal cortex of the young subjects and 42% in their parietal cortex. The CMRO2 in the frontal cortex of our subjects was 198 µmol/100 g/min and 172 µmol/100 g/min in the parietal cortex. These differences seem to disappear in the elderly subjects which could also be explained by the frontal cortex being the predilection site of neuronal loss [Liu et al., 1996; Masliah et al., 1993; Terry et al., 1987].
Limitations
To obtain gray matter values, each individual's high‐resolution T 1‐weighted image was transformed to MNI‐space and the MNI registered image was used to obtain whole brain gray matter ROI. Still, as older subjects tend to have larger peripheral subarachnoidal and ventricular spaces and may also have a thinner cortex [Creasey and Rapoport, 1985], partial volume effects may have been more pronounced within this age group. This may have influenced our results specifically as ASL voxels are rather large. Age‐related partial volume effects do not only directly affect the CBF measurements—by including more white matter in the gray matter voxels—but they also indirectly affect the quantification of the CBF through the blood water partition coefficient (λ). In this study a gray‐matter λ (= 0.98) was used for quantification [Herscovitch and Raichle, 1985]. However, the λ for white matter is 0.84 and thus when more white matter is included within the voxels, the assumed gray‐matter λ may introduce errors within the perfusion measurements. It could be a better option to estimate the equilibrium magnetization of blood based on the cerebrospinal fluid instead of the λ when investigating age‐related changes [Chen et al., 2011].
Many factors are known to affect the CBF. For instance, hormones, hydration and caffeine can have an influence [Parkes et al., 2004]. Also, factors intrinsic to ASL MR imaging, and to the perfusion model applied, such as transit times [Liu et al., 2012], capillary permeability [Bouzerar et al., 2013], labeling efficiency [Wu et al., 2011], the T 1 of blood (related to hematocrit) [Varela et al., 2011], and the T 1 of tissue [Cho et al., 1997; Salat et al., 2009] can affect perfusion estimates [Wu et al., 2010] which consequently influences the CMRO2 estimates as these are the resultant of the OEF and the CBF. Any intergroup variability within one of these parameters could have potentially influenced our results. For instance, it is known that both bolus arrival times and arterial‐arteriole transit time are increased with advancing age [Liu et al., 2012]. In this study, we did use a postlabel delay ranging from 1,550 to 2,185 ms which is in line with the postlabel delay recently recommended for both young and elderly subjects by the ASL community [Alsop et al., in press]. However, this may not be sufficient and to circumvent the effect of these increased transit times one could opt to use a multi‐TI sequence [Kelly et al., 2014]. As well, the labeling efficiency demonstrates interindividual variation [Wu et al., 2011] and changes related to breathing parameters [Aslan et al., 2010]. We did not measure the labeling efficiency for each individual, but, we adjusted it for baseline and hypercapnic breathing [Aslan et al., 2010]. Still, age‐related differences in labeling efficiency may have introduced differences in our CBF measurements. In this study, the T 1 of blood was set at 1.65 s thereby assuming a similar haematocrit between the subject groups. We did not have haematocrit data from our subjects and thus could not confirm these assumptions. Although, an earlier PET study which assessed the arterial haematocrit did not find significant differences in haematocrit across ages [Aanerud et al., 2012].
All the above described parameters have a direct influence on the CBF and thus on the CMRO2, but, they will also influence the CMRO2 estimate via the calculation of the BOLD calibration constant M which is determined by means of the BOLD‐CBF hypercapnia normalization procedure. Another source of bias when calculating the M value is that it assumes the CMRO2 to remain stable during hypercapnic breathing [Chen and Pike, 2010]. This assumption is not necessarily true as one study found an isometabolic state during hypercapnic breathing [Chen and Pike, 2010], while another study demonstrated a reduction in CMRO2 [Xu et al., 2011]. Though, if there is any effect, we can assume that it is more or less similar for both subject groups. Nevertheless, to minimize the effect, we only applied a mild hypercapnia stimulus by increasing the volume flow delivered to the subject and thereby artificially decreasing the change in EtCO2 as to what it was set for (which was a change in EtCO2 of 10 mmHg).
The BOLD signal model does not apply in case of a nonequilibrium stage, like for instance when the subject returns from hypercapnia or hyperoxia to baseline. To minimize errors related to this, we discarded the first two image pairs of each block and gradually increased the hypercapnia level to ensure an equilibrium state at the time of the true hypercapnia block. Further optimization could be achieved using a single and slightly longer hypercapnia and hyperoxia block thereby decreasing the time needed to return to baseline and at the same time keeping the paradigm tolerable and within a realistic time frame for the subject.
In this article, a fixed haemoglobin value of 15 g/dl and a fixed haematocrit of 44% were assumed when calculate the OEF and the CMRO2. Any age‐related differences in haemoglobin or haematocrit could thus introduce errors in the measurements. However, previous studies have not demonstrated significant changes in haematocrit with age [Aanerud et al., 2012].
Due to the nature of our study, a dichotomous comparison between young and old subject‐groups, we could not evaluate the pattern of age‐related decreases in oxygen metabolism. Some earlier studies have found this decrease to be linear and starting at a young age [Leenders et al., 1990; Marchal et al., 1992] while others found the oxygen metabolism to remain stable up to 40 years of age, after which point it substantially declined [Devous, Sr. et al., 1986]. Future studies should include subjects across a wide range of ages to investigate this property.
Conclusion
We found reduced cerebral perfusion in the elderly subject‐group, which could potentially be explained by physiological variations in the arterial carbon dioxide tension. Whole brain oxygen metabolism and the oxygen metabolism in the frontal cortex, temporal cortex and deep gray matter decreased with age. These findings should be taken into account when interpreting age‐related changes in the BOLD response.
Conflict of interest: The authors have no conflict of interest to declare.
REFERENCES
- Aanerud J, Borghammer P, Chakravarty MM, Vang K, Rodell AB, Jonsdottir KY, Moller A, Ashkanian M, Vafaee MS, Iversen P, Johanssen P, Gjedde A (2012): Brain energy metabolism and blood flow differences in healthy aging. J Cereb Blood Flow Metab 32:1177–1187. [DOI] [PMC free article] [PubMed] [Google Scholar]
- Alsop DC, Detre JA, Golay X, Gunther M, Hendrikse J, Hernandez‐Garcia L, Lu H, MacIntosh BJ, Parkes LM, Smits M, van Osch MJ, Wang DJ, Wong EC Zaharchuk G: Recommended implementation of arterial spin‐labeled perfusion MRI for clinical applications: A consensus of the ISMRM perfusion study group and the European consortium for ASL in dementia. Magn Reson Med (in press). doi: 10.1002/mrm.25197 [DOI] [PMC free article] [PubMed] [Google Scholar]
- Anderson JM, Hubbard BM, Coghill GR, Slidders W (1983): The effect of advanced old age on the neurone content of the cerebral cortex. Observations with an automatic image analyser point counting method. J Neurol Sci 58:235–246. [DOI] [PubMed] [Google Scholar]
- Andersson JLR, Jenkinson M, Smith S (2007): Non‐Linear Registration, Aka Spatial Normalisation. FMRIB Technical Report TR07JA2. Available at: http://www.fmrib.ox.ac.uk/analysis/techrep
- Aslan S, Xu F, Wang PL, Uh J, Yezhuvath US, van Osch M, Lu H (2010): Estimation of labeling efficiency in pseudocontinuous arterial spin labeling. Magn Reson Med 63:765–771. doi: 10.1002/mrm.25197. [DOI] [PMC free article] [PubMed] [Google Scholar]
- Bouzerar R, Chaarani B, Gondry‐Jouet C, Zmudka J, Baledent O (2013): Measurement of choroid plexus perfusion using dynamic susceptibility MR imaging: Capillary permeability and age‐related changes. Neuroradiology 55:1447–1454. [DOI] [PubMed] [Google Scholar]
- Bulte DP, Kelly M, Germuska M, Xie J, Chappell MA, Okell TW, Bright MG, Jezzard P (2012): Quantitative measurement of cerebral physiology using respiratory‐calibrated MRI. Neuroimage 60:582–591. [DOI] [PMC free article] [PubMed] [Google Scholar]
- Chen JJ, Pike GB (2009): BOLD‐specific cerebral blood volume and blood flow changes during neuronal activation in humans. NMR Biomed 22:1054–1062. [DOI] [PubMed] [Google Scholar]
- Chen JJ, Pike GB (2010): MRI measurement of the BOLD‐specific flow‐volume relationship during hypercapnia and hypocapnia in humans. Neuroimage. 53:383–391. [DOI] [PubMed] [Google Scholar]
- Chen Y, Wang Z, Detre JA (2011): What is the correct value for the brain‐blood partition coefficient for water? In: Proceedings of International Society of Magnetic Resonance in Medicine, Montréal, Québec, Canada, Vol. 19. p. 300.
- Chiarelli. PA , Bulte DP, Piechnik S, Jezzard P (2007a): Sources of systematic bias in hypercapnia‐calibrated functional MRI estimation of oxygen metabolism. Neuroimage 34:35–43. [DOI] [PubMed] [Google Scholar]
- Chiarelli PA, Bulte DP, Wise R, Gallichan D, Jezzard P (2007b): A calibration method for quantitative BOLD fMRI based on hyperoxia. Neuroimage 37:808–820. [DOI] [PubMed] [Google Scholar]
- Cho S, Jones D, Reddick WE, Ogg RJ, Steen RG (1997): Establishing norms for age‐related changes in proton T1 of human brain tissue in vivo. Magn Reson Imaging 15:1133–1143. [DOI] [PubMed] [Google Scholar]
- Coffey CE, Wilkinson WE, Parashos IA, Soady SA, Sullivan RJ, Patterson LJ, Figiel GS, Webb MC, Spritzer CE, Djang WT (1992): Quantitative cerebral anatomy of the aging human brain: A cross‐sectional study using magnetic resonance imaging. Neurology 42:527–536. [DOI] [PubMed] [Google Scholar]
- Cowell PE, Turetsky BI, Gur RC, Grossman RI, Shtasel DL, Gur RE (1994): Sex differences in aging of the human frontal and temporal lobes. J Neurosci 14:4748–4755. [DOI] [PMC free article] [PubMed] [Google Scholar]
- Creasey H, Rapoport SI (1985): The aging human brain. Ann Neurol 17:2–10. [DOI] [PubMed] [Google Scholar]
- Dai W, Garcia D, de Bazelaire C, Alsop DC (2008): Continuous flow‐driven inversion for arterial spin labeling using pulsed radio frequency and gradient fields. Magn Reson Med 60:1488–1497. [DOI] [PMC free article] [PubMed] [Google Scholar]
- Davis TL, Kwong KK, Weisskoff RM, Rosen BR (1998): Calibrated functional MRI: Mapping the dynamics of oxidative metabolism. Proc Natl Acad Sci USA 95:1834–1839. [DOI] [PMC free article] [PubMed] [Google Scholar]
- Devous MD Sr., Stokely EM, Chehabi HH, Bonte FJ (1986): Normal distribution of regional cerebral blood flow measured by dynamic single‐photon emission tomography. J Cereb Blood Flow Metab 6:95–104. [DOI] [PubMed] [Google Scholar]
- Farkas E, Luiten PG (2001): Cerebral microvascular pathology in aging and Alzheimer's disease. Prog Neurobiol 64:575–611. [DOI] [PubMed] [Google Scholar]
- Fierstra J, Machina M, Battisti‐Charbonney A, Duffin J, Fisher JA, Minkovich L (2011): End‐inspiratory rebreathing reduces the end‐tidal to arterial PCO2 gradient in mechanically ventilated pigs. Intensive Care Med 37:1543–1550. [DOI] [PubMed] [Google Scholar]
- Gauthier CJ, Hoge RD (2012): Magnetic resonance imaging of resting OEF and CMRO2 using a generalized calibration model for hypercapnia and hyperoxia. Neuroimage 60:1212–1250. [DOI] [PubMed] [Google Scholar]
- Gauthier CJ, Desjardins‐Crépeau L, Madjar C, Bherer C, Hoge RD (2012): Absolute quantificaton of resting oxygen metabolism and metabolic reactivity during functional activitation using QUO2 MRI. Neuroimage 63:1353–1363. [DOI] [PubMed] [Google Scholar]
- Gauthier CJ, Madjar C, Desjardins‐Crepeau L, Bellec P, Bherer L, Hoge RD (2013): Age dependence of hemodynamic response characteristics in human functional magnetic resonance imaging. Neurobiol Aging 34:1469–1485. [DOI] [PubMed] [Google Scholar]
- Good CD, Johnsrude IS, Ashburner J, Henson RN, Friston KJ, Frackowiak RS (2001): A voxel‐based morphometric study of ageing in 465 normal adult human brains. Neuroimage 14:21–36. [DOI] [PubMed] [Google Scholar]
- Grubb RL Jr., Raichle ME, Eichling JO, Ter‐Pogossian MM (1974): The effects of changes in PaCO2 on cerebral blood volume, blood flow, and vascular mean transit time. Stroke 5:630–639. [DOI] [PubMed] [Google Scholar]
- Herscovitch P, Raichle ME (1985): What is the correct value for the brain‐blood partition coefficient for water? J Cereb Blood Flow Metab 51:65–69. [DOI] [PubMed] [Google Scholar]
- Hoaglin DC, Iglewicz B, Tukey JW (1986): Performance of some resistant rules for outlier labeling. J Am Stat Assoc 81:991–999. [Google Scholar]
- Hoge RD, Atkinson J, Gill B, Crelier GR, Marrett S, Pike GB (1999): Investigation of BOLD signal dependence on cerebral blood flow and oxygen consumption: The deoxyhemoglobin dilution model. Magn Reson Med 42:849–863. [DOI] [PubMed] [Google Scholar]
- Hutchison JL, Lu H, Rypma B (2013): Neural mechanisms of age‐related slowing: the DeltaCBF/DeltaCMRO2 ratio mediates age‐differences in BOLD signal and human performance. Cereb Cortex 23:2337–2346. [DOI] [PMC free article] [PubMed] [Google Scholar]
- Huttenlocher PR (1979): Synaptic density in human frontal cortex—Developmental changes and effects of aging. Brain Res 163:195–205. [DOI] [PubMed] [Google Scholar]
- Ito H, Kanno I, Ibaraki M, Hatazawa J (2002): Effect of aging on cerebral vascular response to Paco2 changes in humans as measured by positron emission tomography. J Cereb Blood Flow Metab 22:997–1003. [DOI] [PubMed] [Google Scholar]
- Jenkinson M, Smith S (2001): A global optimisation method for robust affine registration of brain images. Med Image Anal 5:143–156. [DOI] [PubMed] [Google Scholar]
- Kalaria RN (1996): Cerebral vessels in ageing and Alzheimer's disease. Pharmacol Ther 72:193–214. [DOI] [PubMed] [Google Scholar]
- Kalaria RN (2009): Linking cerebrovascular defense mechanisms in brain ageing and Alzheimer's disease. Neurobiol Aging 30:1512–1514. [DOI] [PubMed] [Google Scholar]
- Kelly M, Hare H, Germuska M, Filippini N, Bulte D (2014): Changes in cerebral physiology with ageing assessed by respiratory‐calibrated MRI. In: Proceedings of International Society of Magnetic Resonance in Medicine, Milan, Italy, Vol. 22. p. 0465.
- Kety SS, Schmidt CF (1948): The effects of altered arterial tensions of carbon dioxide and oxygen on cerebral blood flow and cerebral oxygen consumption of normal young men. J Clin Invest 27:484–492. [DOI] [PMC free article] [PubMed] [Google Scholar]
- Kim SG, Tsekos NV, Ashe J (1997): Multi‐slice perfusion‐based functional MRI using the FAIR technique: Comparison of CBF and BOLD effects. NMR Biomed 10:191–196. [DOI] [PubMed] [Google Scholar]
- Leenders KL, Perani D, Lammertsma AA, Heather JD, Buckingham P, Healy MJ, Gibbs JM, Wise RJ, Hatazawa, J , Herold S, et al. (1990): Cerebral blood flow, blood volume and oxygen utilization. Normal values and effect of age. Brain 113: 27–47. [DOI] [PubMed] [Google Scholar]
- Liu TT, Wong EC (2005): A signal processing model for arterial spin labeling functional MRI. Neuroimage 24:207–215. [DOI] [PubMed] [Google Scholar]
- Liu X, Erikson C, Brun A (1996): Cortical synaptic changes and gliosis in normal aging, Alzheimer's disease and frontal lobe degeneration. Dementia 7:128–134. [DOI] [PubMed] [Google Scholar]
- Liu Y, Zhu X, Feinberg D, Guenther M, Gregori J, Weiner MW, Schuff N (2012): Arterial spin labeling MRI study of age and gender effects on brain perfusion hemodynamics. Magn Reson Med 68:912–922. [DOI] [PubMed] [Google Scholar]
- Lu H, Xu F, Rodrigue KM, Kennedy KM, Cheng Y, Flicker B, Hebrank AC, Uh J, Park DC (2011): Alterations in cerebral metabolic rate and blood supply across the adult lifespan. Cereb Cortex 21:1426–1434. [DOI] [PMC free article] [PubMed] [Google Scholar]
- Marchal G, Rioux P, Petit‐Taboue MC, Sette G, Travere JM, Le PC, Courtheoux P, Derlon JM, Baron JC (1992): Regional cerebral oxygen consumption, blood flow, and blood volume in healthy human aging. Arch Neurol 49:1013–1020. [DOI] [PubMed] [Google Scholar]
- Martin AJ, Friston KJ, Colebatch JG, Frackowiak RS (1991): Decreases in regional cerebral blood flow with normal aging. J Cereb Blood Flow Metab 11:684–689. [DOI] [PubMed] [Google Scholar]
- Masliah E, Mallory M, Hansen L, DeTeresa R, Terry RD (1993): Quantitative synaptic alterations in the human neocortex during normal aging. Neurology 43:192–197. [DOI] [PubMed] [Google Scholar]
- Mazziotta J, Toga A, Evans A, Fox P, Lancaster J, Zilles K, Woods R, Paus T, Simpson G, Pike B, Holmes C, Collins L, Thompson P, MacDonald D, Iacoboni M, Schormann T, Amunts K, Palomero‐Gallagher N, Geyer S, Parsons L, Narr K, Kabani N, Le GG, Boomsma D, Cannon T, Kawashima R, Mazoyer B (2001): A probabilistic atlas and reference system for the human brain: International Consortium for Brain Mapping (ICBM). Philos Trans R Soc Lond B Biol Sci 356:1293–1322. [DOI] [PMC free article] [PubMed] [Google Scholar]
- Mintun MA, Raichle ME, Martin WR, Herscovitch P (1984): Brain oxygen utilization measured with O‐15 radiotracers and positron emission tomography. J Nucl Med 25:177–187. [PubMed] [Google Scholar]
- Mohtasib RS, Lumley G, Goodwin JA, Emsley HC, Sluming V, Parkes LM (2012): Calibrated fMRI during a cognitive Stroop task reveals reduced metabolic response with increasing age. Neuroimage 59:1143–1151. [DOI] [PubMed] [Google Scholar]
- Naritomi H, Meyer JS, Sakai F, Yamaguchi F, Shaw T (1979): Effects of advancing age on regional cerebral blood flow. Studies in normal subjects and subjects with risk factors for atherothrombotic stroke. Arch Neurol 36:410–416. [DOI] [PubMed] [Google Scholar]
- Pantano P, Baron JC, Lebrun‐Grandie P, Duquesnoy N, Bousser MG Comar D (1984): Regional cerebral blood flow and oxygen consumption in human aging. Stroke 15:635–641. [DOI] [PubMed] [Google Scholar]
- Parkes LM, Rashid W, Chard DT, Tofts PS (2004): Normal cerebral perfusion measurements using arterial spin labeling: reproducibility, stability, and age and gender effects. Magn Reson Med 51:736–743. [DOI] [PubMed] [Google Scholar]
- Rajah MN, D'Esposito M (2005): Region‐specific changes in prefrontal function with age: a review of PET and fMRI studies on working and episodic memory. Brain 128:1964–1983. [DOI] [PubMed] [Google Scholar]
- Sabapathy S, Morris NR, Schneider DA (2006): Ventilatory and gas‐exchange responses to incremental exercise performed with reduced muscle glycogen content. J Sci Med Sport 9:267–73. [DOI] [PubMed] [Google Scholar]
- Salat DH, Lee SY, van der Kouwe AJ, Greve DN, Fischl B, Rosas HD (2009): Age‐associated alterations in cortical gray and white matter signal intensity and gray to white matter contrast. Neuroimage 48:21–28. [DOI] [PMC free article] [PubMed] [Google Scholar]
- Slessarev M, Han J, Mardimae A, Prisman E, Preiss D, Volgyesi G, Ansel C, Duffin J, Fisher JA (2007): Prospective targeting and control of end‐tidal CO2 and O2 concentrations. J Physiol 581:1207–1219. [DOI] [PMC free article] [PubMed] [Google Scholar]
- Smith SM, Jenkinson M, Woolrich MW, Beckmann CF, Behrens TE, Johansen‐Berg H, Bannister PR, De LM, Drobnjak I, Flitney DE, Niazy RK, Saunders J, Vickers J, Zhang Y, De SN, Brady JM, Matthews PM (2004): Advances in functional and structural MR image analysis and implementation as FSL. Neuroimage 23:S208–S219. [DOI] [PubMed] [Google Scholar]
- Sowell ER, Peterson BS, Thompson PM, Welcome SE, Henkenius AL, Toga AW (2003): Mapping cortical change across the human life span. Nat Neurosci 6:309–315. [DOI] [PubMed] [Google Scholar]
- Terry RD, DeTeresa R, Hansen LA (1987): Neocortical cell counts in normal human adult aging. Ann Neurol 21:530–539. [DOI] [PubMed] [Google Scholar]
- Tisserand DJ, van Boxtel MP, Pruessner JC, Hofman P, Evans AC, Jolles J (2004): A voxel‐based morphometric study to determine individual differences in gray matter density associated with age and cognitive change over time. Cereb Cortex 14:966–973. [DOI] [PubMed] [Google Scholar]
- Van Laere KJ, Dierckx RA (2001): Brain perfusion SPECT: Age‐ and sex‐related effects correlated with voxel‐based morphometric findings in healthy adults. Radiology 221:810–817. [DOI] [PubMed] [Google Scholar]
- van Osch MJ, Teeuwisse WM, van Walderveen MA, Hendrikse J, Kies DA, van Buchem MA (2009): Can arterial spin labeling detect white matter perfusion signal? Magn Reson Med 62:165–173. [DOI] [PubMed] [Google Scholar]
- Varela M, Hajnal JV, Petersen ET, Golay X, Merchant N, Larkman DJ (2011): A method for rapid in vivo measurement of blood T1. NMR Biomed 24:80–88. [DOI] [PubMed] [Google Scholar]
- Wise RG, Harris AD, Stone AJ, Murphy K (2013): Measurement of OEF and absolute CMRO2: MRI‐based methods using interleaved and combined hypercapnia and hyperoxia. Neuroimage 83:135–147. [DOI] [PMC free article] [PubMed] [Google Scholar]
- Wu WC, St Lawrence KS, Licht DJ, Wang DJ (2010): Quantification issues in arterial spin labeling perfusion magnetic resonance imaging. Top Magn Reson Imaging 21:65–73. [DOI] [PubMed] [Google Scholar]
- Wu WC, Jiang SF, Yang SC, Lien SH (2011): Pseudocontinuous arterial spin labeling perfusion magnetic resonance imaging–A normative study of reproducibility in the human brain. Neuroimage 56:1244–1250. [DOI] [PubMed] [Google Scholar]
- Xu F, Ge Y, Lu H (2009): Noninvasive quantification of whole‐brain cerebral metabolic rate of oxygen (CMRO2) by MRI. Magn Reson Med 62:141–148. [DOI] [PMC free article] [PubMed] [Google Scholar]
- Xu F, Uh J, Brier MR, Hart J Jr., Yezhuvath US, Gu H, Yang Y, Lu H (2011): The influence of carbon dioxide on brain activity and metabolism in conscious humans. J Cereb Blood Flow Metab 31:58–67. [DOI] [PMC free article] [PubMed] [Google Scholar]
- Yamaguchi T, Kanno I, Uemura K, Shishido F, Inugami A, Ogawa T, Murakami M Suzuki K (1986): Reduction in regional cerebral metabolic rate of oxygen during human aging. Stroke 17:1220–1228. [DOI] [PubMed] [Google Scholar]
- Yoshii F, Barker WW, Chang JY, Loewenstein D, Apicella A, Smith D, Boothe T, Ginsberg MD, Pascal S, Duara R (1988): Sensitivity of cerebral glucose metabolism to age, gender, brain volume, brain atrophy, and cerebrovascular risk factors. J Cereb Blood Flow Metab 8:654–661. [DOI] [PubMed] [Google Scholar]