

Abstract
Recent imaging studies have demonstrated functional brain network changes in patients with Alzheimer's disease (AD). Eigenvector centrality (EC) is a graph analytical measure that identifies prominent regions in the brain network hierarchy and detects localized differences between patient populations. This study used voxel‐wise EC mapping (ECM) to analyze individual whole‐brain resting‐state functional magnetic resonance imaging (MRI) scans in 39 AD patients (age 67 ± 8) and 43 healthy controls (age 69 ± 7). Between‐group differences were assessed by a permutation‐based method. Associations of EC with biomarkers for AD pathology in cerebrospinal fluid (CSF) and Mini Mental State Examination (MMSE) scores were assessed using Spearman correlation analysis. Decreased EC was found bilaterally in the occipital cortex in AD patients compared to controls. Regions of increased EC were identified in the anterior cingulate and paracingulate gyrus. Across groups, frontal and occipital EC changes were associated with pathological concentrations of CSF biomarkers and with cognition. In controls, decreased EC values in the occipital regions were related to lower MMSE scores. Our main finding is that ECM, a hypothesis‐free and computationally efficient analysis method of functional MRI (fMRI) data, identifies changes in brain network organization in AD patients that are related to cognition and underlying AD pathology. The relation between AD‐like EC changes and cognitive performance suggests that resting‐state fMRI measured EC is a potential marker of disease severity for AD. Hum Brain Mapp 35:2383–2393, 2014. © 2013 Wiley Periodicals, Inc.
Keywords: Alzheimer's disease, functional connectivity, resting‐state fMRI, cognition, amyloid‐beta
INTRODUCTION
Alzheimer's disease (AD) is a neurodegenerative disease with amyloid pathology leading to a complex array of cognitive disturbances [McKhann et al., 2011]. On magnetic resonance imaging (MRI), AD is characterized by cortical atrophy, predominantly located in the medial temporal and parietal lobes [Scahill et al., 2002; Sluimer et al., 2009]. Neuronal dysfunction can be detected using functional imaging techniques before structural changes manifest as cortical atrophy on MRI [Frisoni et al., 2010].
Resting‐state functional MRI (fMRI) is used to study functional properties of the brain by detecting spontaneous neuronal activity as localized changes in the blood oxyhemoglobin/deoxyhemoglobin ratio [Scholvinck et al., 2010]. Spatially distinct brain regions with co‐varying resting state fMRI signals are considered to be functionally connected [Biswal et al., 1995, 2010]. Several studies have shown AD‐related changes in brain connectivity, leading to the definition of AD as a functional disconnection syndrome [Delbeuck et al., 2003; van den Heuvel and Hulshoff Pol, 2010]. These functional changes already occur in the early stages of AD [Greicius et al., 2004; Rombouts et al., 2005], and consist of decreases as well as increases in local network connectivity [Agosta et al., 2012; Grady et al., 2003; Qi et al., 2010; Zhou et al., 2010].
Common techniques to study functional connectivity in resting‐state fMRI data are seed‐based correlations [Wang et al., 2007, 2006; Zhang et al., 2010] and independent component analysis [Binnewijzend et al., 2012; Greicius et al., 2004; Qi et al., 2010; Zhou et al., 2010], which mainly focus on specific predefined regions (seed‐based analysis) or brain subnetworks (independent component analysis). Graph analytic methods can be used to investigate the global organization of the whole‐brain network (i.e., the functional connectome), for example, by analyzing network efficiency and robustness, or by attributing importance to specific nodes in the network. Importance of a node can be expressed by a measure called centrality [Bavelas, 1948], which has recently been introduced to functional neuroimaging [Joyce et al., 2010; Lohmann et al., 2010; Zuo et al., 2012]. Centrality can be measured as a node's number of direct connections (degree centrality), its average distance to other nodes (closeness centrality), its relative occurrence on connections between other nodes (betweenness centrality), or the sum of the centralities of its direct neighbors (eigenvector centrality; EC) (Fig. 1). The benefit of a centrality analysis compared to seed‐based and independent component analyses is that it does not rely on a priori definitions of regions, and that it considers the brain as one large network rather than dividing it into several subnetworks. Furthermore, because the output of a centrality analysis is a single map per subject, group analysis is possible without expert intervention, such as selecting (sub)networks of interest.
Figure 1.
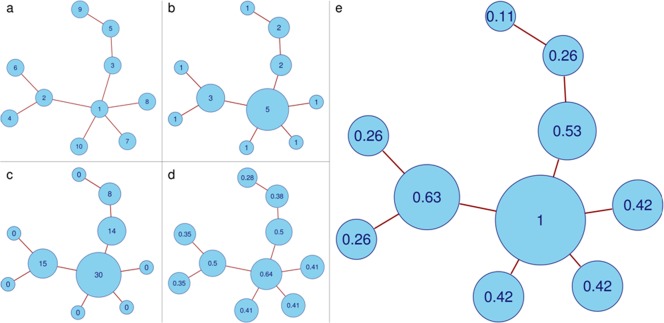
Differences between common centrality measures. a) Example of a simple graph. b) Degree centrality counts the number of edges attached to each vertex. c) Betweenness centrality counts how often a vertex occurs on the shortest path between two other vertices. d) Closeness centrality computes the average distance from a vertex to all other vertices, and differentiates between both central vertices and end vertices. e) EC counts the neighbors of each vertex, weighted by their centralities. [Color figure can be viewed in the online issue, which is available at http://wileyonlinelibrary.com.]
EC has gained attention as the mathematical principle behind the Google's PageRank algorithm [Bryan, 2006]. The recursive definition of EC, that is, computing a node's centrality by adding the centralities of its neighbors, makes it sensitive to different layers in the network hierarchy. When used as a measure for brain connectivity in resting‐state fMRI, it has shown to be easily computable from the voxel‐wise connectivity matrix, and robust against global physiological effects [Lohmann et al., 2010].
In this article, we study differences in functional brain organization between AD patients and healthy elderly controls using EC mapping (ECM). Second, we investigate whether changes in EC are related (i) to global cognition, using Mini Mental State Examination (MMSE) scores and (ii) to AD pathology, using measures of amyloid and tau proteins in cerebrospinal fluid (CSF).
MATERIALS AND METHODS
Subjects
Eighty‐two subjects were included in the study: 39 patients with AD (mean age 67, range 53–83) and 43 healthy controls (mean age 69, range 57–82). The data set was formed by combining two previously described resting‐state fMRI data sets using the same scanning protocol [Damoiseaux et al., 2008; Tolboom et al., 2009]. Patients were recruited from the Alzheimer center of the VU University Medical Center, Amsterdam, the Netherlands. AD patients underwent a standard diagnostic procedure that included medical history, physical and neurological examination, neuropsychological testing, electroencephalography, screening laboratory tests, lumbar puncture, and brain MRI. The clinical diagnosis was established in a consensus meeting by a multidisciplinary team, considering all available clinical data. AD patients met the NINCDS‐ADRDA criteria for “probable AD” [McKhann et al., 1984]. Global cognitive functioning was assessed using the MMSE [Folstein et al., 1975]. Level of education was classified from 1 to 7 (low to highly educated) [Verhage, 1964]. Controls consisted of family members of patients and volunteers recruited through advertisements posted in the Alzheimer Center and activity centers for the elderly in the community. The Ethical Review Board of the VU University Medical Center Amsterdam approved the study. Written informed consent was provided by all participants. Exclusion criteria included significant medical, neurological (other than AD) or psychiatric illness; a history of brain damage; and use of non AD‐related medication known to influence cerebral function such as benzodiazepines and antidepressants.
Data Acquisition
Imaging was performed on a 1.5 Tesla Sonata scanner (Siemens AG, Erlangen, Germany) using a standard circularly polarized head coil (gradient 40 mT/m, slew rate 200 T/m/s). Resting‐state functional scans consisted of 200 ‐weighted echo planar imaging volumes (repetition time (TR) = 2,850 ms; echo time (TE) = 60 ms; flip angle = 90°; 36 axial slices; matrix 64 × 64; voxel size 3.3 mm isotropic). Subjects were instructed to lie still with their eyes closed, not to think of anything in particular and not to fall asleep during the scan. Additionally a high‐resolution T 1‐weighted magnetization prepared rapid acquisition gradient echo image (TR = 2,700 ms; TE = 3.97 ms; inversion time (TI) = 950 ms; flip angle = 8°; 160 coronal slices; matrix 256 × 192; voxel size 1 × 1.5 × 1 mm3) was acquired.
Preprocessing of MRI Data
Images were preprocessed using FSL (version 4.1; http://www.fmrib.ox.ac.uk/fsl) [Smith et al., 2004]. Each single‐subject resting‐state fMRI data set underwent motion correction, removal of non‐brain tissue, spatial smoothing using a 5 mm full‐width‐at‐half‐maximum (FWHM) Gaussian kernel, and high‐pass temporal filtering equivalent to 100 s (0.01 Hz). After preprocessing, the fMRI volumes were registered to 2 mm isotropic standard space (MNI152) [Mazziotta et al., 2001] via the subjects' T 1‐weighted anatomical images, using affine registration.
ECM
ECM of the resting‐state fMRI time series in MNI‐space was performed using fast ECM (fECM) software (https://code.google.com/p/bias/source/browse/matlab/fastECM) [Wink et al., 2012], yielding a voxel‐wise measure of relevance to the functional brain network. ECM requires the computation of the voxel‐wise connectivity matrix to calculate its eigenvector [Lohmann et al., 2010]. The fECM software is faster and computationally more efficient because it computes matrix‐vector products without having to compute or store the connectivity matrix. As comparing the properties of different network topologies is a non‐trivial problem [van Wijk et al., 2010], a mask of in‐brain voxels across all subjects' preprocessed data sets (i.e., in the intersection of all single‐subject masks) was applied before the EC maps were computed. ECM does not require thresholding or binarizing of the connectivity matrix, so all subjects' networks had the same topology as well as the same size.
EC maps of all subjects were concatenated into a single four‐dimensional file. Nonparametric permutation tests (5,000 permutations) were used to detect statistically significant differences between AD patients and controls [Nichols and Holmes, 2002]. Age and sex were used as covariates. Statistical testing was done after threshold‐free cluster enhancement at a family‐wise error (FWE) corrected P‐value of 5% [Smith and Nichols, 2009].
Voxel‐Based Morphometry
Voxel‐based morphometry (VBM) was performed using FSL‐VBM [Douaud et al., 2007]. Structural images were brain‐extracted and gray matter‐segmented before being registered to the MNI152 standard space using nonlinear registration. All native gray matter images were nonlinearly registered to a study‐specific template and modulated to correct for local expansion or contraction due to the nonlinear component of the spatial transformation. The modulated gray matter density images were then smoothed with an isotropic Gaussian kernel with a sigma of 3 mm (i.e., FWHM of 7 mm). Finally, nonparametric permutation tests (5,000 permutations) were used to detect statistically significant differences between AD patients and controls [Nichols and Holmes, 2002].
CSF Analysis
CSF was obtained by lumbar puncture of the L3/L4 or L4/L5 intervertebral space, using a 25‐gauge needle. CSF Aβ1‐42 (amyloid), total tau (t‐tau), and phosphorylated tau (p‐tau) were measured with Innotest (Innogenetics) sandwich enzyme‐linked immunosorbent assay as described previously [Mulder et al., 2010]. The team involved in the CSF analysis was not aware of clinical diagnosis. CSF was available for 35 of 39 AD patients (90%) and 16 of 43 healthy controls (37%). Mean age (P = 0.13) and distribution of gender (P = 0.51) did not differ between these AD patients and healthy controls. Median time between lumbar puncture and scan date was 3 months (Interquartile range: 11 months).
Nonimaging Statistics
All other statistical analyses were performed using SPSS 15.0. For continuous measures, differences between groups were assessed using one‐way analysis of variance. A Chi‐squared test was used to compare frequency distributions of gender. A student's t‐test was used to assess between‐group differences in mean frame‐wise displacement [Power et al., 2012] based on individual motion correction parameters. A two‐tailed Spearman correlation analysis was performed across and within diagnostic groups to assess relationships of regional EC (extracted mean EC values from clusters of regional differences) with MMSE‐scores and with CSF measures of amyloid and tau.
RESULTS
Patient Characteristics
No group differences in age, gender, or level of education were found between patients and controls. As expected, MMSE scores were lower in AD patients (mean MMSE 22, range 17–27) than in controls (mean MMSE 29, range 25–30). In addition, AD patients showed lower amyloid and higher t‐tau and p‐tau concentrations in CSF than controls (Table 1). There were no group differences in mean frame‐wise displacement (P = 0.52) resulting from the motion correction.
Table 1.
Patient characteristics
| Controls | AD | P‐value | |
|---|---|---|---|
| N | 43 | 39 | |
| Age | 69 ± 7 | 67 ± 8 | P = 0.37 |
| Sex (%F) | 47% | 41% | P = 0.62 |
| Education | 6 ± 1 | 5 ± 1 | P = 0.09 |
| MMSE score | 29 ± 1 | 22 ± 3 | P < 0.01 |
| CSF amyloid (ng/L) | 872 ± 263 | 467 ± 98 | P < 0.01 |
| CSF t‐tau (ng/L) | 308 ± 154 | 896 ± 530 | P < 0.01 |
| CSF p‐tau (ng/L) | 52 ± 22 | 100 ± 36 | P < 0.01 |
Data are presented as means ± standard deviations for controls and AD patients. Education: level of education using Verhage's classification (Verhage, 1964), MMSE: Mini Mental State Examination, CSF: cerebrospinal fluid.
The control group included three subjects with CSF amyloid levels below 550 ng/L (i.e., an AD profile) and three subjects with low MMSE scores (≤ 26). All three controls with low amyloid levels had normal MMSE‐scores (i.e., two with MMSE‐scores of 29 and one with an MMSE‐score of 30). Of the three subjects with low MMSE‐scores, one showed a normal level of amyloid in CSF (1,015 ng/L, MMSE‐score 26). No CSF amyloid data were available of the other two controls (MMSE‐scores 25 and 26).
EC Differences
Figure 2 shows mean EC maps of the AD group and the control group, where red and yellow colors represent high EC and blue represents low EC values. In the control group, highest mean EC values were located in the precuneus and the occipital cortex. In the group of AD patients, highest mean EC values were more spread across the entire cingulate cortex.
Figure 2.
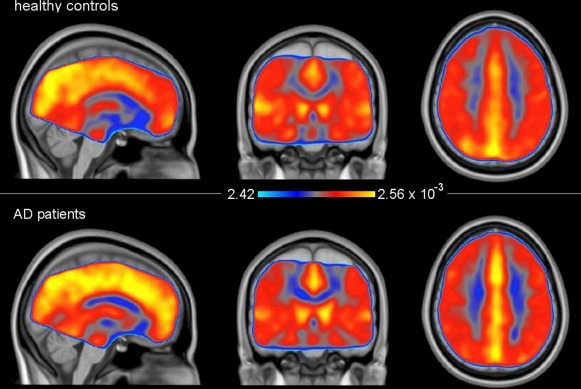
Mean EC maps for both groups. The voxel‐wise mean EC values were computed from all single subject maps in each group. For display purposes, data were resampled to a 1 × 1 × 1 voxel dimension. Red and yellow areas show high EC values, blue areas show low EC values. MNI coordinates: x = −1, y = −17, z = 37. [Color figure can be viewed in the online issue, which is available at http://wileyonlinelibrary.com.]
Between‐group analysis showed decreases in EC in AD patients compared to controls in the left and right occipital cortex (Fig. 3, blue regions), namely the cortex of the cuneus, the superior part of the lateral occipital cortex, and the occipital pole bilaterally, as well as the right inferior part of the lateral occipital cortex. Increased EC was found in AD patients compared to controls bilaterally in the medial frontal cortex (Fig. 3, red regions), namely the anterior cingulate and the paracingulate gyrus. Table 2 shows the MNI‐coordinates and number of voxels of all clusters. Repeating the between‐group analysis with an additional covariate of mean frame‐wise displacement did not change the nature of the results (data not shown).
Figure 3.
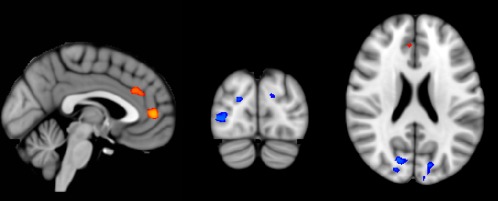
Group‐wise EC differences, after nonparametric permutation testing. Red voxels show clusters of EC increases in AD patients compared with controls, blue voxels show clusters of EC decreases in AD patients compared with controls (FWE‐corrected P < 0.05). Results are corrected for age and sex. These clusters were used as region‐of‐interest to extract mean EC values from each individual EC map. Results are displayed on standard MNI152 brain in radiological orientation. For display purposes, data were resampled to a 1 × 1 × 1 voxel dimension. MNI coordinates: x = −2, y = −84, z = 22. [Color figure can be viewed in the online issue, which is available at http://wileyonlinelibrary.com.]
Table 2.
Overview of clusters with EC differences in AD patients compared to controls
| .# | Location | Voxels (n) | MNI‐coordinates | P‐value | Overlap (n) |
|---|---|---|---|---|---|
| 1 | Anterior cingulate, paracingulate gyrus | 166 | 0, 46, 6 | P = 0.013 | 1 |
| 2 | Anterior cingulate, paracingulate gyrus | 135 | −2, 28, 28 | P = 0.030 | 6 |
| 3 | Right cuneus | 112 | 12, −76, 20 | P = 0.024 | 17 |
| 4 | Right lateral occipital cortex | 87 | 40, −82, 0 | P = 0.026 | 67 |
| 5 | Left cuneus and occipital pole | 71 | −14, −82, 24 | P = 0.030 | 0 |
| 6 | Right cuneus | 6 | 8, −72, 18 | P = 0.045 | 0 |
In four clusters in the left and right occipital cortex EC is decreased in AD (clusters 3‐6). In two clusters in the mesofrontal cortex EC is increased in AD (clusters 1 and 2). The right column displays the number of voxels that overlap with gray matter density decreases as detected by voxel‐based morphometry.
Gray Matter Density Differences
Figure 4 gives an overview of the regions of lower gray matter density in AD patients compared with controls. Differences in gray matter were visible in all lobes, most prominently in the lateral parietal cortex (including the supramarginal and angular gyrus), the precuneus and the lateral and medial temporal cortex.
Figure 4.
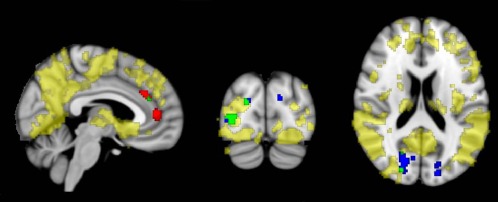
Group‐wise gray matter density differences, displayed together with EC differences. Yellow voxels show regions of decreased gray matter density in AD compared with controls (FWE‐corrected P < 0.05). Red voxels show clusters of EC increases in AD patients compared with controls; voxels are green where EC increases overlap with gray matter density decreases in AD. Blue voxels show clusters of EC decreases in AD patients compared with controls; voxels are green where EC decreases overlap with gray matter density decreases in AD. Results are corrected for age and sex. Results are displayed on standard MNI152 brain in radiological orientation. For display purposes, data were resampled to a 1 × 1 × 1 voxel dimension. MNI coordinates: x = 5, y = −84, z = 19. [Color figure can be viewed in the online issue, which is available at http://wileyonlinelibrary.com.]
Decreased EC in the lateral occipital cortex partly overlapped with areas of decreased gray matter density in AD (Fig. 4, Table 2) in the right inferior and superior occipital cortex and the cuneal cortex (84 voxels). Spatial overlap of regions with increased EC in AD patients (frontal clusters) and AD‐related gray matter decreases consisted of 7 voxels in the right paracingulate gyrus. Overall, ECM clusters consisted of 577 voxels, from which 16% (total of 91 voxels) overlapped with atrophy.
Correlation of EC With Global Cognitive Function
Both lower EC in the occipital regions and higher EC in the medial frontal regions were related to MMSE‐scores across groups (P < 0.001). Within the control group, lower occipital EC values were associated with lower performance on the MMSE (ρ = 0.38, P = 0.01). In AD patients, no relation between EC and MMSE‐scores was found (Table 3, Fig. 5).
Table 3.
Associations of mean EC values with MMSE scores and measures of AD pathology
| MMSE | Amyloid | T‐Tau | P‐Tau | |
|---|---|---|---|---|
| Frontal regions | ||||
| Across groups | −0.57*** | −0.43** | 0.42** | 0.37** |
| Controls | −0.20 | −0.12 | −0.02 | −0.06 |
| AD | 0.03 | −0.25 | 0.03 | 0.03 |
| Occipital regions | ||||
| Across groups | 0.68*** | 0.44** | −0.33* | −0.28+ |
| Controls | 0.38* | 0.29 | 0.35 | 0.41 |
| AD | 0.08 | 0.20 | 0.05 | 0.06 |
Mean EC values were extracted from the regions with decreased centrality (i.e., occipital regions) and the regions with increased centrality (i.e., frontal regions) in AD patients. Spearman correlation analysis (two‐tailed) was performed to assess associations of EC values with MMSE scores, and with amyloid, total tau (t‐tau) and phosphorylated tau (p‐tau) in CSF. Data represent Spearman correlation coefficients (rho) across and within diagnostic groups. *P < 0.05, **P < 0.01, *** P < 0.001, + P = 0.05.
Figure 5.

Scatterplots of the relationship between a) frontal EC increases and MMSE‐scores, b) occipital EC decreases and MMSE‐scores, c) frontal EC increases and amyloid in CSF, and d) occipital EC decreases and amyloid in CSF.
Correlation of EC With CSF Biomarkers
Across groups, regional mean EC values were related to CSF biomarkers (Table 3, Fig. 5). Lower levels of amyloid were associated with lower EC values in the occipital regions (ρ = 0.44, P = 0.001) and higher EC values in the frontal regions (ρ = −0.43, P = 0.002). Higher levels of t‐tau and p‐tau were associated with lower EC values in the occipital regions (ρ = −0.33, P = 0.02 and ρ = 0.42, P = 0.002) and higher EC values in the frontal regions (ρ = −0.28, P = 0.051 (trend) and ρ = 0.37, P = 0.008). No significant correlations of EC with amyloid, t‐tau and p‐tau were found within groups.
DISCUSSION
This is the first study that uses ECM to analyze resting‐state fMRI data in AD patients. The main advantages of ECM compared to current methods are that the analysis is done on single‐subject data, and that the brain is analyzed as a single network rather than being divided into subnetworks. Our results show that ECM of resting‐state fMRI data detect distributed changes in brain network function in AD. Compared to controls, AD patients show decreased EC in the bilateral occipital cortex, and increased EC in the anterior cingulate and paracingulate gyrus. These changes are associated with cognitive performance and AD pathology (CSF biomarkers) across diagnostic groups. Occipital EC decreases are associated with cognitive performance within the control group.
To date, only one other study has used ECM to study functional connectivity in AD patients [de Haan et al., 2012], using magneto‐encephalography instead of resting‐state fMRI. De Haan et al. described decreases in EC in AD patients in the temporal areas, which are strongly related to MMSE scores, and, in high‐frequency bands, in the posterior cortex. Furthermore, in most frequency bands, highest EC values are located in the parietal areas of the brain. This is in agreement with the current data, where patients and controls show high mean EC values in the medial parietal and occipital cortex. High EC values in the medial parietal cortex confirm the role of the precuneus and posterior cingulate cortex as a hub within the functional brain network [Buckner et al., 2009; Drzezga et al., 2011]. This region appears to be particularly vulnerable for AD pathology, as indicated by a convergence of amyloid deposition, hypometabolism, and atrophy in this region [Buckner et al., 2005, 2009; Drzezga et al., 2011; Minoshima et al., 1997; Mosconi et al., 2008; Scahill et al., 2002].
In our study, we have found regions of decreased EC in the bilateral occipital cortex of AD patients. This finding suggests a diminished role of the posterior part of the brain in global network function in AD patients, but does not indicate the precuneus and posterior cingulate cortex as the brain regions with most severe functional disruption in AD. A possible explanation for this finding might lay in the fact that EC measures different layers of the functional hierarchy, while other measures such as degree centrality are based on direct connections only. Buckner et al. have used degree centrality to prove the importance of the posterior cingulate cortex as a hub [Buckner et al., 2009]. However, a comparison of different centrality types (among others, degree and EC) shows highest values of degree centrality in the precuneus and posterior cingulate, while EC is highest in the occipital lobes [Zuo et al., 2012]. The fact that EC detects other brain regions as most “central” or important than degree centrality, may also explain why EC is sensitive to detecting EC changes in AD in the occipital cortex instead of the precuneus and posterior cingulate. Furthermore, a recent positron emission tomography study that compared brain glucose metabolism in APOE ε4‐carriers and non‐carriers, confirms that posterior brain function diminishing in AD is not limited to the precuneus but includes the occipital lobes as well [Ossenkoppele et al., 2013].
An important finding in this article is the increased EC in the anterior cingulate and paracingulate gyrus in AD patients. This increase indicates a more prominent role of frontal areas in the functional brain network in AD patients. Current literature on brain subnetworks (i.e., studies using seed‐based and independent component analyses) confirms these findings. While posterior brain function diminishes, the frontal areas of the brain seem to become more important in global network organization, which may indicate a mechanism of functional compensation [Agosta et al., 2012; Grady et al., 2003; Qi et al., 2010; Stern, 2002].
Sanz‐Arigita et al. use a subset of the current data to examine global functional brain connectivity in AD using synchronization likelihood as a connectivity measure [Sanz‐Arigita et al., 2010], reporting increased functional connectivity in AD patients in the frontal part of the brain and decreased functional connectivity in the parietal and occipital parts of the brain. Our EC findings not only consolidate those results, but the spatial features of our findings also provide a much more detailed picture of disease‐related brain network differences.
In our study, cognitive performance is associated with changes in EC across diagnostic groups. Markedly, within controls, occipital EC decreases are also associated with a poorer cognitive performance, indicating that AD‐like changes in network organization are related to deterioration of cognitive function within the control group. It is estimated that 20–40% of the healthy elderly population have amyloid plaque formation in the brain, possibly a sign of early stage AD [De Meyer et al., 2010; Mintun et al., 2006; Sperling et al., 2011]. Our control group included three subjects with AD‐like CSF amyloid levels in CSF and three other subjects with low MMSE‐scores. Since a lowered CSF amyloid level was no exclusion criteria for healthy controls at the moment of data collection, and these subjects had normal MMSE‐scores, they were not excluded. To prevent these outliers from dictating results, we used a nonparametric Spearman's rank correlation analysis. The relation between EC and cognition in controls indicates that resting‐state brain function measured by EC may be a potential marker of disease severity for AD. As this is not endorsed by a correlation between EC and cognition in AD patients, further research is necessary to confirm or refute this hypothesis.
Brain network alterations were associated with abnormal levels of CSF biomarkers across groups. Within groups, we found no associations between EC changes and CSF biomarkers. Amyloid plaque deposition is considered to be one of the earliest expressions of AD pathology. It is assumed that amyloid accumulation starts years before clinical symptoms arise, and has already reached a plateau in an early stage of clinical AD [Frisoni et al., 2010; Jack et al., 2010]. Tau‐mediated neuronal dysfunction is hypothesized to follow the amyloid accumulation [Frisoni et al., 2010]. As a result of the early plateau, especially CSF amyloid tends to show little variance within diagnostic groups. This is a likely reason why within‐group analyses show no relation between CSF biomarkers and EC changes. As lumbar puncture is an invasive procedure and not obligatory for healthy controls to take part in the study, CSF material was only available of 37% of the healthy controls, which may have influenced the sensitivity of the statistical tests.
Limitations and Future Directions
Our data were acquired on a 1.5 Tesla machine. Using these data, we were able to compare our results to previous results that were obtained with different analysis techniques [Binnewijzend et al., 2012; Sanz‐Arigita et al., 2010]. Current studies often use higher magnetic fields that allow a better temporal and spatial resolution. Cortical atrophy influences the blood oxygen level‐dependent (BOLD) signal, possibly leading to a reduced functional connectivity estimate due to structure loss [Momenan et al., 2004]. Ideally, partial volume correction should be applied to the unprocessed fMRI data before statistical analysis. However, to our knowledge there is no agreement in the literature on the optimal way to perform gray matter volume correction on fMRI data. We, therefore, display uncorrected EC changes and VBM maps of cortical atrophy, to show the overlap between functional and structural changes. The effect of head motion is a potentially important factor that needs to be considered when interpreting functional connectivity results from BOLD fMRI data [Satterthwaite et al., 2013; Van Dijk et al., 2012]. At the same time, recent findings show that overly zealous efforts to remove bias factors may actually degrade the data [Yan et al., 2013]. In this study, we calculated and compared mean displacement parameters. AD patients and controls showed no differences in mean frame‐wise displacement, and adding this parameter as a covariate to the voxel‐wise analysis did not essentially change between‐group EC differences. We resampled our fMRI data from 3.3 mm isotropic to a 2 mm MNI152 standard space [Wink et al., 2012], which introduces nodes and edges. However, as this introduction of edges is a global effect, and EC is less sensitive to direct numbers of neighbors (unlike degree centrality), this does not drastically influence results. This is especially true because Gaussian smoothing was used to reduce local spatial variability. Signals of white matter, CSF, heart rate, or respiration were not explicitly removed, as earlier studies state that EC does not show global effects from physiological influences [Lohmann et al., 2010]. Future research may elucidate the influence of physiological noise on different measures of centrality. Part of the control group consisted of family members of AD patients. This may have caused a selection bias, since family history is a risk factor for AD [Blacker and Tanzi, 1998]. Furthermore, no follow‐up information is available for the control group. Therefore, it is not known which portion of the group might eventually develop AD.
CONCLUSIONS
Using ECM, we have identified regional changes in global brain network organization in AD patients. The relation between AD‐like EC changes and cognitive performance suggests that resting‐state fMRI measured EC is a potential marker of disease severity for AD. We have demonstrated that ECM is a fully data‐driven functional connectivity analysis at the single‐subject level that can be readily used to detect disease‐related brain network changes.
DISCLOSURES
F. Barkhof serves on the editorial boards of Brain, European Radiology, the Journal of Neurology, Multiple Sclerosis and Neuroradiology and serves as a consultant for Bayer‐Schering Pharma, Sanofi‐Aventis, Biogen‐Idec, UCB, Merck‐Serono, Jansen Alzheimer Immunotherapy, Baxter, Novartis, and Roche.
C.J. Stam is associate editor of Clinical Neurophysiology, and serves on the editorial board of Human Brain Mapping and Nonlinear Biomedical Physics. He serves as a consultant to Danone.
M.A.A. Binnewijzend and S.M. Adriaanse contributed equally to this paper.
REFERENCES
- Agosta F, Pievani M, Geroldi C, Copetti M, Frisoni GB, Filippi M (2012): Resting state fMRI in Alzheimer's disease: Beyond the default mode network. Neurobiol Aging 33:1564‐1578. [DOI] [PubMed] [Google Scholar]
- Bavelas A (1948): A mathematical model for group structure. Anthropology 7:16‐39. [Google Scholar]
- Binnewijzend MA, Schoonheim MM, Sanz‐Arigita E, Wink AM, van der Flier WM, Tolboom N, Adriaanse SM, Damoiseaux JS, Scheltens P, van Berckel BN, Barkhof F (2012): Resting‐state fMRI changes in Alzheimer's disease and mild cognitive impairment. Neurobiol Aging 33:2018‐2028. [DOI] [PubMed] [Google Scholar]
- Biswal B, Yetkin FZ, Haughton VM, Hyde JS (1995): Functional connectivity in the motor cortex of resting human brain using echo‐planar MRI. Magn Reson Med 34:537‐541. [DOI] [PubMed] [Google Scholar]
- Biswal BB, Mennes M, Zuo XN, Gohel S, Kelly C, Smith SM, Beckmann CF, Adelstein JS, Buckner RL, Colcombe S, Dogonowski AM, Ernst M, Fair D, Hampson M, Hoptman MJ, Hyde JS, Kiviniemi VJ, Kotter R, Li SJ, Lin CP, Lowe MJ, Mackay C, Madden DJ, Madsen KH, Margulies DS, Mayberg HS, McMahon K, Monk CS, Mostofsky SH, Nagel BJ, Pekar JJ, Peltier SJ, Petersen SE, Riedl V, Rombouts SA, Rypma B, Schlaggar BL, Schmidt S, Seidler RD, Siegle GJ, Sorg C, Teng GJ, Veijola J, Villringer A, Walter M, Wang L, Weng XC, Whitfield‐Gabrieli S, Williamson P, Windischberger C, Zang YF, Zhang HY, Castellanos FX, Milham MP (2010): Toward discovery science of human brain function. Proc Natl Acad Sci USA 107:4734‐4739. [DOI] [PMC free article] [PubMed] [Google Scholar]
- Blacker D, Tanzi RE (1998): The genetics of Alzheimer disease: Current status and future prospects. Arch Neurol 55:294‐296. [DOI] [PubMed] [Google Scholar]
- Bryan K, Leise T (2006): The $25,000,000,000 Eigenvector: The Linear Algebra behind Google. SIAM Rev 48:569‐581. [Google Scholar]
- Buckner RL, Snyder AZ, Shannon BJ, LaRossa G, Sachs R, Fotenos AF, Sheline YI, Klunk WE, Mathis CA, Morris JC, Mintun MA (2005): Molecular, structural, and functional characterization of Alzheimer's disease: Evidence for a relationship between default activity, amyloid, and memory. J. Neurosci. 25:7709‐7717. [DOI] [PMC free article] [PubMed] [Google Scholar]
- Buckner RL, Sepulcre J, Talukdar T, Krienen FM, Liu H, Hedden T, Andrews‐Hanna JR, Sperling RA, Johnson KA (2009): Cortical hubs revealed by intrinsic functional connectivity: Mapping, assessment of stability, and relation to Alzheimer's disease. J Neurosci 29:1860‐1873. [DOI] [PMC free article] [PubMed] [Google Scholar]
- Damoiseaux JS, Beckmann CF, Arigita EJS, Barkhof F, Scheltens P, Stam CJ, Smith SM, Rombouts SARB. (2008): Reduced resting‐state brain activity in the “default network” in normal aging. Cereb Cortex 18:1856‐1864. [DOI] [PubMed] [Google Scholar]
- de Haan W, van der Flier WM, Wang H, Van Mieghem PF, Scheltens P, Stam CJ (2012): Disruption of functional brain networks in Alzheimer's disease: What can we learn from graph spectral analysis of resting‐state magnetoencephalography? Brain Connect 2:45‐55. [DOI] [PubMed] [Google Scholar]
- De Meyer G, Shapiro F, Vanderstichele H, Vanmechelen E, Engelborghs S, De Deyn PP, Coart E, Hansson O, Minthon L, Zetterberg H, Blennow K, Shaw L, Trojanowski JQ (2010): Diagnosis‐independent Alzheimer disease biomarker signature in cognitively normal elderly people. Arch Neurol 67:949‐956. [DOI] [PMC free article] [PubMed] [Google Scholar]
- Delbeuck X, Van der Linden M, Collette F (2003): Alzheimer's disease as a disconnection syndrome? Neuropsychol Rev 13:79‐92. [DOI] [PubMed] [Google Scholar]
- Douaud G, Smith S, Jenkinson M, Behrens T, Johansen‐Berg H, Vickers J, James S, Voets N, Watkins K, Matthews PM, James A (2007): Anatomically related grey and white matter abnormalities in adolescent‐onset schizophrenia. Brain 130:2375‐2386. [DOI] [PubMed] [Google Scholar]
- Drzezga A, Becker JA, Van Dijk KR, Sreenivasan A, Talukdar T, Sullivan C, Schultz AP, Sepulcre J, Putcha D, Greve D, Johnson KA, Sperling RA (2011): Neuronal dysfunction and disconnection of cortical hubs in non‐demented subjects with elevated amyloid burden. Brain 134:1635‐1646. [DOI] [PMC free article] [PubMed] [Google Scholar]
- Folstein MF, Folstein SE, McHugh PR (1975): “Mini‐mental state”. A practical method for grading the cognitive state of patients for the clinician. J Psychiatr Res 12:189‐198. [DOI] [PubMed] [Google Scholar]
- Frisoni GB, Fox NC, Jack CR Jr, Scheltens P, Thompson PM (2010): The clinical use of structural MRI in Alzheimer disease. Nat Rev Neurol 6:67‐77. [DOI] [PMC free article] [PubMed] [Google Scholar]
- Grady CL, McIntosh AR, Beig S, Keightley ML, Burian H, Black SE (2003): Evidence from functional neuroimaging of a compensatory prefrontal network in Alzheimer's disease. J Neurosci 23:986‐993. [DOI] [PMC free article] [PubMed] [Google Scholar]
- Greicius MD, Srivastava G, Reiss AL, Menon V (2004): Default‐mode network activity distinguishes Alzheimer's disease from healthy aging: Evidence from functional MRI. Proc Natl Acad Sci USA 101:4637‐4642. [DOI] [PMC free article] [PubMed] [Google Scholar]
- Jack CR Jr, Knopman DS, Jagust WJ, Shaw LM, Aisen PS, Weiner MW, Petersen RC, Trojanowski JQ (2010): Hypothetical model of dynamic biomarkers of the Alzheimer's pathological cascade. Lancet Neurol 9:119‐128. [DOI] [PMC free article] [PubMed] [Google Scholar]
- Joyce KE, Laurienti PJ, Burdette JH, Hayasaka S (2010): A new measure of centrality for brain networks. PLoS One 5:e12200. [DOI] [PMC free article] [PubMed] [Google Scholar]
- Lohmann G, Margulies DS, Horstmann A, Pleger B, Lepsien J, Goldhahn D, Schloegl H, Stumvoll M, Villringer A, Turner R (2010): Eigenvector centrality mapping for analyzing connectivity patterns in fMRI data of the human brain. PLoS One 5:e10232. [DOI] [PMC free article] [PubMed] [Google Scholar]
- Mazziotta J, Toga A, Evans A, Fox P, Lancaster J, Zilles K, Woods R, Paus T, Simpson G, Pike B, Holmes C, Collins L, Thompson P, MacDonald D, Iacoboni M, Schormann T, Amunts K, Palomero‐Gallagher N, Geyer S, Parsons L, Narr K, Kabani N, Le Goualher G, Boomsma D, Cannon T, Kawashima R, Mazoyer B (2001): A probabilistic atlas and reference system for the human brain: International Consortium for Brain Mapping (ICBM). Philos Trans R Soc Lond B Biol Sci 356:1293‐1322. [DOI] [PMC free article] [PubMed] [Google Scholar]
- McKhann G, Drachman D, Folstein M, Katzman R, Price D, Stadlan EM (1984): Clinical diagnosis of Alzheimer's disease: Report of the NINCDS‐ADRDA Work Group under the auspices of Department of Health and Human Services Task Force on Alzheimer's Disease. Neurology 34:939‐944. [DOI] [PubMed] [Google Scholar]
- McKhann GM, Knopman DS, Chertkow H, Hyman BT, Jack CR Jr, Kawas CH, Klunk WE, Koroshetz WJ, Manly JJ, Mayeux R, et al, (2011). The diagnosis of dementia due to Alzheimer's disease: recommendations from the National Institute on Aging-Alzheimer's Association workgroups on diagnostic guidelines for Alzheimer's disease. Alzheimers Dement 7:263‐269. [DOI] [PMC free article] [PubMed] [Google Scholar]
- Minoshima S, Giordani B, Berent S, Frey KA, Foster NL, Kuhl DE (1997): Metabolic reduction in the posterior cingulate cortex in very early Alzheimer's disease. Ann Neurol 42:85‐94. [DOI] [PubMed] [Google Scholar]
- Mintun MA, Larossa GN, Sheline YI, Dence CS, Lee SY, Mach RH, Klunk WE, Mathis CA, DeKosky ST, Morris JC (2006): [11C]PIB in a nondemented population: Potential antecedent marker of Alzheimer disease. Neurology 67:446‐452. [DOI] [PubMed] [Google Scholar]
- Momenan R, Rawlings R, Fong G, Knutson B, Hommer D (2004): Voxel‐based homogeneity probability maps of gray matter in groups: Assessing the reliability of functional effects. Neuroimage 21:965‐972. [DOI] [PubMed] [Google Scholar]
- Mosconi L, Tsui WH, Herholz K, Pupi A, Drzezga A, Lucignani G, Reiman EM, Holthoff V, Kalbe E, Sorbi S, Diehl‐Schmid J, Perneczky R, Clerici F, Caselli R, Beuthien‐Baumann B, Kurz A, Minoshima S, de Leon MJ (2008): Multicenter standardized 18F‐FDG PET diagnosis of mild cognitive impairment, Alzheimer's disease, and other dementias. J Nucl Med 49:390‐398. [DOI] [PMC free article] [PubMed] [Google Scholar]
- Mulder C, Verwey NA, van der Flier WM, Bouwman FH, Kok A, van Elk EJ, Scheltens P, Blankenstein MA (2010): Amyloid‐beta(1‐42), total tau, and phosphorylated tau as cerebrospinal fluid biomarkers for the diagnosis of Alzheimer disease. Clin Chem 56:248‐253. [DOI] [PubMed] [Google Scholar]
- Nichols TE, Holmes AP (2002): Nonparametric permutation tests for functional neuroimaging: A primer with examples. Hum Brain Mapp 15:1‐25. [DOI] [PMC free article] [PubMed] [Google Scholar]
- Ossenkoppele R, van der Flier WM, Zwan MD, Adriaanse SF, Boellaard R, Windhorst AD, Barkhof F, Lammertsma AA, Scheltens P, van Berckel BN (2013): Differential effect of APOE genotype on amyloid load and glucose metabolism in AD dementia. Neurology 80:359‐365. [DOI] [PubMed] [Google Scholar]
- Power JD, Barnes KA, Snyder AZ, Schlaggar BL, Petersen SE (2012): Spurious but systematic correlations in functional connectivity MRI networks arise from subject motion. Neuroimage 59:2142‐2154. [DOI] [PMC free article] [PubMed] [Google Scholar]
- Qi Z, Wu X, Wang Z, Zhang N, Dong H, Yao L, Li K (2010): Impairment and compensation coexist in amnestic MCI default mode network. Neuroimage 50:48‐55. [DOI] [PubMed] [Google Scholar]
- Rombouts SA, Barkhof F, Goekoop R, Stam CJ, Scheltens P (2005): Altered resting state networks in mild cognitive impairment and mild Alzheimer's disease: An fMRI study. Human Brain Mapp 26:231‐239. [DOI] [PMC free article] [PubMed] [Google Scholar]
- Sanz‐Arigita EJ, Schoonheim MM, Damoiseaux JS, Rombouts SA, Maris E, Barkhof F, Scheltens P, Stam CJ (2010): Loss of 'small‐world' networks in Alzheimer's disease: Graph analysis of FMRI resting‐state functional connectivity. PLoS One 5:e13788. [DOI] [PMC free article] [PubMed] [Google Scholar]
- Satterthwaite TD, Elliott MA, Gerraty RT, Ruparel K, Loughead J, Calkins ME, Eickhoff SB, Hakonarson H, Gur RC, Gur RE, Wolf DH (2013): An improved framework for confound regression and filtering for control of motion artifact in the preprocessing of resting‐state functional connectivity data. Neuroimage 64:240‐256. [DOI] [PMC free article] [PubMed] [Google Scholar]
- Scahill RI, Schott JM, Stevens JM, Rossor MN, Fox NC (2002): Mapping the evolution of regional atrophy in Alzheimer's disease: Unbiased analysis of fluid‐registered serial MRI. Proc Natl Acad Sci USA 99:4703‐4707. [DOI] [PMC free article] [PubMed] [Google Scholar]
- Scholvinck ML, Maier A, Ye FQ, Duyn JH, Leopold DA (2010): Neural basis of global resting‐state fMRI activity. Proc Natl Acad Sci USA 107:10238‐10243. [DOI] [PMC free article] [PubMed] [Google Scholar]
- Sluimer JD, van der Flier WM, Karas GB, van Schijndel R, Barnes J, Boyes RG, Cover KS, Olabarriaga SD, Fox NC, Scheltens P, Vrenken H, Barkhof F. (2009): Accelerating regional atrophy rates in the progression from normal aging to Alzheimer's disease. Eur Radiol 19:2826‐2833. [DOI] [PMC free article] [PubMed] [Google Scholar]
- Smith SM, Nichols TE (2009): Threshold‐free cluster enhancement: Addressing problems of smoothing, threshold dependence and localisation in cluster inference. Neuroimage 44:83‐98. [DOI] [PubMed] [Google Scholar]
- Smith SM, Jenkinson M, Woolrich MW, Beckmann CF, Behrens TE, Johansen‐Berg H, Bannister PR, De Luca M, Drobnjak I, Flitney DE, Niazy RK, Saunders J, Vickers J, Zhang Y, De Stefano N, Brady JM, Matthews PM (2004): Advances in functional and structural MR image analysis and implementation as FSL. Neuroimage 23 Suppl 1:S208‐S219. [DOI] [PubMed] [Google Scholar]
- Sperling RA, Aisen PS, Beckett LA, Bennett DA, Craft S, Fagan AM, Iwatsubo T, Jack CR Jr, Kaye J, Montine TJ, Park DC, Reiman EM, Rowe CC, Siemers E, Stern Y, Yaffe K, Carrillo MC, Thies B, Morrison‐Bogorad M, Wagster MV, Phelps CH (2011): Toward defining the preclinical stages of Alzheimer's disease: Recommendations from the National Institute on Aging‐Alzheimer's Association workgroups on diagnostic guidelines for Alzheimer's disease. Alzheimers Dement 7:280‐292. [DOI] [PMC free article] [PubMed] [Google Scholar]
- Stern Y (2002): What is cognitive reserve? Theory and research application of the reserve concept. J Int Neuropsychol Soc 8:448‐460. [PubMed] [Google Scholar]
- Tolboom N, van der Flier WM, Yaqub M, Koene T, Boellaard R, Windhorst AD, Scheltens P, Lammertsma AA, van Berckel BNM (2009): Differential association of [11C]PIB and [18F]FDDNP binding with cognitive impairment. Neurology 73:2079‐2085. [DOI] [PubMed] [Google Scholar]
- van den Heuvel MP, HulshoffPol HE (2010): Exploring the brain network: A review on resting‐state fMRI functional connectivity. Eur Neuropsychopharmacol 20:519‐534. [DOI] [PubMed] [Google Scholar]
- Van Dijk KR, Sabuncu MR, Buckner RL (2012): The influence of head motion on intrinsic functional connectivity MRI. Neuroimage 59:431‐438. [DOI] [PMC free article] [PubMed] [Google Scholar]
- van Wijk BC, Stam CJ, Daffertshofer A (2010): Comparing brain networks of different size and connectivity density using graph theory. PLoS One 5:e13701. [DOI] [PMC free article] [PubMed] [Google Scholar]
- Verhage F (1964): Intelligentie en Leeftijd: Onderzoek bij Nederlanders van twaalf tot zevenenzeventig jaar [Intelligence and Age: study with Dutch people aged 12 to 77]. Assen. Van Gorcum. [Google Scholar]
- Wang K, Liang M, Wang L, Tian L, Zhang X, Li K, Jiang T (2007): Altered functional connectivity in early Alzheimer's disease: A resting‐state fMRI study. Hum Brain Mapp 28:967‐978. [DOI] [PMC free article] [PubMed] [Google Scholar]
- Wang L, Zang Y, He Y, Liang M, Zhang X, Tian L, Wu T, Jiang T, Li K. (2006): Changes in hippocampal connectivity in the early stages of Alzheimer's disease: Evidence from resting state fMRI. Neuroimage 31:496‐504. [DOI] [PubMed] [Google Scholar]
- Wink AM, de Munck JC, van der Werf YD, van den Heuvel OA, Barkhof F. (2012): Fast eigenvector centrality mapping of voxel‐wise connectivity in functional magnetic resonance imaging: Implementation, validation, and interpretation. Brain Connect 2:265‐274. [DOI] [PubMed] [Google Scholar]
- Yan CG, Cheung B, Kelly C, Colcombe S, Craddock RC, Di Martino A, Li Q, Zuo XN, Castellanos FX, Milham MP (2013): A comprehensive assessment of regional variation in the impact of head micromovements on functional connectomics. Neuroimage 76C:183‐201. [DOI] [PMC free article] [PubMed] [Google Scholar]
- Zhang HY, Wang SJ, Liu B, Ma ZL, Yang M, Zhang ZJ, Teng GJ (2010): Resting brain connectivity: Changes during the progress of Alzheimer disease. Radiology 256:598‐606. [DOI] [PubMed] [Google Scholar]
- Zhou J, Greicius MD, Gennatas ED, Growdon ME, Jang JY, Rabinovici GD, Kramer JH, Weiner M, Miller BL, Seeley WW (2010): Divergent network connectivity changes in behavioural variant frontotemporal dementia and Alzheimer's disease. Brain 133:1352‐1367. [DOI] [PMC free article] [PubMed] [Google Scholar]
- Zuo XN, Ehmke R, Mennes M, Imperati D, Castellanos FX, Sporns O, Milham MP (2012): Network centrality in the human functional connectome. Cereb Cortex 22:1862‐1875. [DOI] [PubMed] [Google Scholar]