

Abstract
The anticipation of pain has been investigated in a variety of brain imaging studies. Importantly, today there is no clear overall picture of the areas that are involved in different studies and the exact role of these regions in pain expectation remains especially unexploited. To address this issue, we used activation likelihood estimation meta‐analysis to analyze pain anticipation in several neuroimaging studies. A total of 19 functional magnetic resonance imaging were included in the analysis to search for the cortical areas involved in pain anticipation in human experimental models. During anticipation, activated foci were found in the dorsolateral prefrontal, midcingulate and anterior insula cortices, medial and inferior frontal gyri, inferior parietal lobule, middle and superior temporal gyrus, thalamus, and caudate. Deactivated foci were found in the anterior cingulate, superior frontal gyrus, parahippocampal gyrus and in the claustrum. The results of the meta‐analytic connectivity analysis provide an overall view of the brain responses triggered by the anticipation of a noxious stimulus. Such a highly distributed perceptual set of self‐regulation may prime brain regions to process information where emotion, action and perception as well as their related subcategories play a central role. Not only do these findings provide important information on the neural events when anticipating pain, but also they may give a perspective into nocebo responses, whereby negative expectations may lead to pain worsening. Hum Brain Mapp 36:1648–1661, 2015. © 2014 Wiley Periodicals, Inc.
Keywords: pain anticipation, activation likelihood estimation meta‐analysis, meta‐analytic connectivity model, functional magnetic resonance imaging, anterior cingulate cortex, anterior insula, expectation
INTRODUCTION
Anticipation of pain is a complex state that may influence the immediate unpleasantness of pain itself [Price et al., 1999; Staub et al., 1971] and of non‐noxious stimulation [Sawamoto et al., 2000].
Neurophysiological evidence indicated that the anticipation of pain may trigger cortical systems involved in the experience of pain [Koyama et al., 2005; Ploghaus et al., 1999; Porro et al., 2002] and may be directly influenced by cognitive factors [Porro et al., 2002], even in the absence of noxious stimulation [Ploghaus et al., 2003; Porro et al., 2003]. A positron emission tomography (PET) study by Hsieh et al. [1999] demonstrated that cognitive appraisal of impending pain may differentially modulate brain activity depending on previous experience and available information on the kind of stimulus.
The anticipation of pain may have an important protective function, allowing the avoidance of bodily harm through the initiation of adaptive behavior. As far as the activated areas related with anticipation of painful stimuli are concerned, hemodynamic changes in parietal, cingulate, and insular areas, have been detected by PET [Chua et al., 1999; Drevets et al., 1995; Hsieh et al., 1999], but not in the primary somatosensory cortex (SI). Other studies demonstrated activation of the prefrontal cortex (PFC), anterior insula (AI), and anterior cingulate cortex (ACC) during the anticipation of pain using psychophysiological measures [Koyama et al., 1998] and functional magnetic resonance imaging (fMRI) [Ploghaus et al., 1999; Porro et al., 2002, 2003]. More recently, Koyama et al. [2005] have identified brain regions including the PFC, insula, ACC, the globus pallidus, putamen, thalamus [the medial thalamus was also activated in the study by Porro et al., 2003] and cerebellum, exhibiting activation that was significantly related to subjective reports of expected‐pain magnitude.
Although Porro et al. [2003] had previously demonstrated the involvement of neural populations during anticipation of pain to be related to vegetative indexes of arousal, the study by Koyama et al. [2005] underlined that the expectation‐related activation was not accompanied by any reliable increases in heart rate, suggesting that expectations of pain were not accompanied by significant alteration of affect and mood. Koyama et al. [2005] concluded that PFC, insula, and ACC worked together with their associated subcortical regions to support the mental representation of an impending stimulus. On these grounds, the different studies [except for the one by Porro et al., 2003] proposed that anticipation of pain triggers a specific neural system, distinct from the one involved in pain perception. A suggestive hypothesis that has not yet been demonstrated is that the aforementioned network may be involved in loading executive‐monitoring onto the processing of task‐relevant information in order to avoid interference by goal‐irrelevant stimuli, in pain anticipation experimental paradigms. Even if brain mechanisms underlying anticipation of pain is an issue that has important theoretical and practical implications [Price et al., 1999], the exact role of these regions in pain expectation remains unexploited, particularly with a meta‐analytic approach of brain imaging studies.
To achieve this important objective, we identified human brain regions that were consistently implicated in pain anticipation. We adopted a coordinate‐based meta‐analysis approach [Eickhoff et al., 2009; Salimi‐Khorshidi et al., 2009], to provide an analysis of the neuroimaging literature—using fMRI and assessing changes that occur during pain expectation (without/before noxious administration). Finally, with the aim to explore the brain‐wide functional connectivity (FC) pattern of given activation likelihood estimation (ALE)‐brain regions, we further provided a meta‐analytic connectivity model (MACM) [Eickhoff et al., 2011; Laird et al. 2013].
MATERIALS AND METHODS
Literature Search, Selection, and Methodological Challenges
In this study, we adopted the meta‐analysis definition embraced by the Cochrane Collaboration and the “PRISMA Statement” international guidelines to ensure that transparent and complete reporting of data selection was implemented [Liberati et al., 2009; Moher et al., 2009].
A systematic search strategy was used to identify relevant studies published on or before July 2013 using the Medline database with Pubmed literature search (http://www.ncbi.nlm.nih.gov/pubmed). During an initial phase, we analyzed the cognitive phenomics of all the keywords which allowed us to obtain literature patterns (see the Supporting Information for more details). Moreover, association measures were analyzed to get a perspective of the biomedical research literature.
We used two different sets of query terms:
“Pain” AND “Anticipation” [ALL] AND fMRI [ALL] OR “Functional Magnetic Resonance” [ALL];
“Pain” AND “Anticipation” [ALL] AND PET [ALL] OR “Positron Emission Tomography” [ALL]
We found a co‐occurrence among the first set of query terms, measured by the Jaccard Index, equal to −6.0, and a co‐occurrence among the second set of query terms equal to −8.0. Accordingly, up until July 2013, 84 papers had been indexed on PubMed using the selected search terms. We also searched the bibliographies of published meta‐analyses and reviews on pain anticipation in human experimental pain to identify additional studies which were not included in the PubMed literature search database. All included articles were analyzed and any of them that did not meet the inclusion criteria were excluded. Indeed, all articles were reviewed to establish that: (1) the experimental pain paradigms included a baseline condition to study functional activity during pain anticipation minus resting state conditions; (2) the study presents specified neuroimaging acquisition parameters; (3) the results were reported in Talairach/Tournoux or in Montreal Neurological Institute (MNI) coordinates; (4) the studies reported cerebral activation and deactivation changes, as assessed by blood‐oxygen‐level dependent (BOLD)‐fMRI or PET; (5) they were original works; (6) the field of view was not confined to a restricted region of interest (ROI). We also tried to identify any instances of multiple reports of single data sets of the articles to ensure that the coordinates of the present meta‐analysis were reported in only one study (See Figure 1: PRISMA Flow Diagram).
Figure 1.
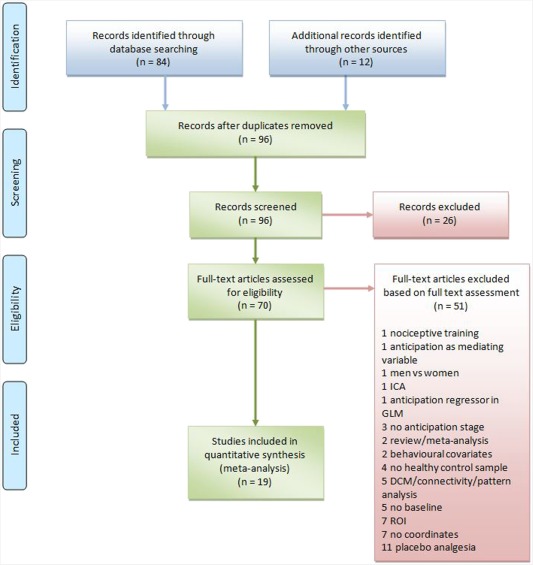
PRISMA (2009) Flow Diagram of article selection.
Importantly, the papers, we considered, analyzed the stage before pain starts, in terms of expectation or anticipation of pain. In an fMRI paradigm, this phase corresponds to the period of “expected pain,” meaning the period of time between the beginning of the scan and the beginning of the stimulus. The subsequent stage expressed as the time between the beginning of the stimulus and its termination was not analyzed in this article as it only explores the pain anticipation phase.
Studies were independently ascertained and the authors checked to see if there were any discrepancies (SP, MA, and TC), which were then discussed and resolved. Descriptive information was extracted from each article including imaging acquisition and experimental modality, sample size, and characteristics. We carefully checked the conditions and experiments, pain induction, pain assessment, and the brain mechanisms related to pain anticipation. Since the focus of our study was on pain anticipation in human experimental pain paradigms, we also checked the sample population to exclude any clinical conditions.
Tables 1 and II provide a detailed description of methods and sample in the selected studies. The number of activation and deactivation foci were established for each study.
Table 1.
Experimental procedures and correspondent numbers of activation and deactivation foci.
| Year | First author | Neuroimaging | Stimulus | Site | Side | Duration | VAS | Pain anticipation | |
|---|---|---|---|---|---|---|---|---|---|
| Activation foci | Deactivation foci | ||||||||
| 1999 | Ploghaus | fMRI | Thermal stimulation | Dorsum of the hand | Left | __ | 11 | 6 | 0 |
| 2003 | Jensen_EXP 1 | fMRI | Electrical stimulation | Index finger | Left | 200 ms | __ | 8 | 0 |
| 2003 | Jensen_EXP 2 | fMRI | Electrical stimulation | Index finger | Left | 200 ms | __ | 2 | 0 |
| 2005 | Yaguez | fMRI | Esophageal distension | Esophageal sphincter | __ | 200 ms | 10 | 20 | 0 |
| 2005 | Koyama | fMRI | Thermal stimulation | Lower lleg | Right | 120 s | __ | 19 | 14 |
| 2006 | Choi_EXP 1 | fMRI | Thermal stimulation | Middle finger | Left | 30 s | 100 | 4 | 0 |
| 2006 | Choi_EXP 2 | fMRI | Thermal stimulation | Middle finger | Left | 30 s | 100 | 7 | 0 |
| 2007 | Salomons | fMRI | Thermal stimulation | __ | __ | 5 min | __ | 21 | 0 |
| 2007 | Wise | fMRI | Thermal stimulation | Hand | Left | 5 s | __ | 11 | 0 |
| 2008 | Berman | fMRI | Rectal distention | Rectum | __ | __ | __ | 0 | 13 |
| 2009 | Straube_EXP 1 | fMRI | Electrical stimulation | Index finger | Left | 20 ms | __ | 3 | 0 |
| 2009 | Straube_EXP 2 | fMRI | Electrical stimulation | Index finger | Left | 20 ms | __ | 2 | 0 |
| 2009 | Watson | fMRI | YAP laser stimulation | Forearm | Right | 4 ms | __ | 5 | 0 |
| 2010 | Wiech | fMRI | YAP laser stimulation | __ | __ | 4 ms | __ | 46 | 0 |
| 2011 | Coen | fMRI | Esophageal distension | __ | __ | 1 s | 100 | 25 | 0 |
| 2012 | Benson_EXP 1 | fMRI | Rectal distention | Rectum | __ | 3–12 s | 100 | 1 | 0 |
| 2012 | Benson_EXP 2 | fMRI | Rectal distention | Rectum | __ | 3–12 s | 100 | 1 | 0 |
| 2013 | Ter Minassian | fMRI | Electrical stimulation | Wrist | Right | 6 s | __ | 50 | 37 |
| 2013 | Seifert | fMRI | Thermal stimulation | Arm | Left | 15 s | __ | 37 | 26 |
| 2013 | Kano_EXP 1 | fMRI | Esophageal distension | Esophageal sphincter | __ | 3–12 s | 100 | 32 | 21 |
| 2013 | Kano_EXP 2 | fMRI | Esophageal distension | Esophageal sphincter | __ | 3–12 s | 100 | 23 | 34 |
| 2013 | Linnman | fMRI | Electrical stimulation | Second & Third finger | Right | 500 ms | __ | 9 | 0 |
| 2013 | Schmid | fMRI | Rectal distention | Rectum | __ | 2–5 s | __ | 4 | 0 |
| 2013 | Strigo | fMRI | Thermal stimulation | Volar forearm | Left | 10 s | 10 | 11 | 2 |
| Experimental paradigm | % | Activation foci | Deactivation foci | ||||||
| Thermal contact heat | 33.33 | 116 | 42 | ||||||
| Electrical stimulation | 25.00 | 74 | 37 | ||||||
| Esophageal distention | 16.66 | 100 | 55 | ||||||
| Laser contact heat | 8.33 | 51 | 0 | ||||||
| Rectal distention | 16.66 | 6 | 13 | ||||||
Based on these criteria, 19 papers were included in the analysis with an overall sample of 360 subjects (see Figure 1—PRISMA Flow Diagram—and Appendix including all the references in the Supporting Information).
Coordinate‐Based Meta‐Analysis
ALE meta‐analysis is a fruitful quantitative voxel‐based method that can be used to estimate consistent activation (or areas of gray matter increases/reductions) on the basis of foci of interest across different imaging studies that have reported statistically significant peaks of activation [Laird et al., 2005; Lancaster et al., 2000, 2007]. This method requires that activation foci be reported in standard stereotactic space [Laird et al., 2005]. Indeed ALE approach considers each activation focus modeled as the center of a Gaussian probability distribution. Indeed, Talairach space has been subdivided in 2 mm3 volumes and the following probability density function has been used:
where d is the Euclidean distance between the voxels and the focus taken into account and σ is the standard deviation of the unidimensional distribution to generate a modeled activation (MA) map for each reported study. These 3D Gaussian distributions are consequently summed to generate a statistical map that estimates the probability of activation for each voxel as determined by the entire set of studies. This map is then thresholded using a permutation test [Laird et al., 2005; Lancaster et al., 2000, 2007].
To improve the output, we used an ALE algorithm that estimates the spatial uncertainty of each focus taking into account the possible differences among studies related to sample size [Eickhoff et al., 2009, 2012].
ALE maps were computed using a Java‐based version of ALE software named GingerALE (version 2.3.1, updated September 2014) at an FDR‐corrected threshold of P < 0.05 and a minimum cluster size of K > 50 mm3. The cluster analysis peaks involved all extrema. ALE maps were then visualized using Mricron (http://www.mccauslandcenter.sc.edu/mricro/mricron/index.html).
The location of clusters in the Talairach space was assigned by identifying the location of the coordinates of the maximum ALE value using the Talairach Daemon, a high‐speed database server for querying and retrieving data relative to human brain structure [Laird et al., 2005] that acts as a subroutine contained in the GingerALE software. Each label was provided automatically by the program.
Activation and deactivation foci related to pain anticipation were considered in separate analyses.
Meta‐Analytic Connectivity Modeling
The method of seeding an anatomically driven ROI and performing ALE meta‐analysis will be referred to as MACM [Eickhoff et al., 2011; Laird et al. 2013]. MACM was used to assess AI and cingulate cortices FC separately. Bilateral AI (ROI 1: AI) and cingulate (ROI 2: ACC) cortex ROI were defined using a Talairach nifti image of 1 mm of resolution obtained from the http://talairach.org web site [Lancaster et al., 2000]. The ROIs were input into the BrainMap database separately, to search for all studies that reported activation within each ROI boundary for normal subjects and experiments with activation only. Whole‐brain coordinates of activations were then downloaded (insula = 17,383 total number of subjects, 1,305 number of experiments, 19,038 number of foci; cingulate = 23,226 total number of subjects, 1,659 number of experiments, 22,307 number of foci).
ALE meta‐analyses [Laird et al. 2005; Turkeltaub et al., 2002] were performed on the sets of coordinates identified as coactivated during bilateral insula and cingulate cortices activation, to identify regions of convergence.
The resulting output images of the MACM analysis are used for an automated behavioral analysis with the plug‐in included in the Multi‐image Analysis GUI (Mango) v3.2.7 image processing system (http://ric.uthscsa.edu/mango/) [Lancaster et al., 2012]. Behavioral domains (BD) embraced the main categories of interoception, emotion, perception, action, cognition, as well as their related subcategories. Thus, we analyzed the BDs associated with each previously identified coactivation cluster for AI and ACC to determine the functional roles of the derived clusters by significant over‐representation of BDs in the experiments activating the respective cluster relative to the BrainMap database.
RESULTS
The studies we included are listed in the Supporting Information, Appendix section. Fifty‐one studies were excluded because they did not meet the inclusion criteria (see the trial flow represented in Figure 1).
The characteristics of the 19 studies (reporting 24 experimental conditions with BOLD‐fMRI), designated as suitable for meta‐analysis, are reported in Table 1. Together, these studies included data from 360 subjects and reported 347 activation and 147 deactivation foci. All the studies explored pain‐related brain activity using fMRI and used contact noxious heat stimuli (33.33%), electrical noxious heat stimuli (25%), and rectal/esophageal balloon distention (33.32%). The remaining 8.33% of the studies used laser noxious heat stimuli. The experiments yielded tabulated coordinates for 10 contrasts involving left‐side stimulation, four contrasts for right‐side stimulation, and 10 contrasts for visceral or unspecific stimulation.
The average age of the samples (calculated from 20 experimental conditions) was 22.26 years (Table 2). Manual dominance was specified for 57.5% of cases; all the subjects were right‐handed. There was a lack of information about gender for 9.17% of the sample. The remaining 45.28% were men, while 45.56% were women.
Table 2.
Composition of samples in each individual study and of the actual overall sample
| Year | First author | Sample | Male (N) | Female (N) | Menstrual cycle phase | Average age | Manual dominance | Participants |
|---|---|---|---|---|---|---|---|---|
| 1999 | Ploghaus | 12 | 7 | 5 | __ | 26 ± 3 | Right | Health |
| 2003 | Jensen_EXP 1 | 11 | 6 | 5 | __ | 28 ± 6 | Right | Health |
| 2003 | Jensen_EXP 2 | 6 | 5 | 1 | __ | 25 ± 3 | Right | Health |
| 2005 | Yaguez | 8 | 5 | 3 | __ | 22 | __ | Health |
| 2005 | Koyama | 10 | 8 | 2 | __ | 30.3 | __ | Health |
| 2006 | Choi_EXP 1 | 18 | 0 | 18 | Follicular | 23.11 ± 1.91 | __ | Health |
| 2006 | Choi_EXP 2 | 18 | 0 | 18 | Luteal | 23.11 ± 1.91 | __ | Health |
| 2007 | Salomons | 16 | 11 | 5 | __ | 22 | Right | Health |
| 2007 | Wise | 8 | 8 | 0 | __ | __ | Right | Health |
| 2008 | Berman | 12 | 0 | 12 | __ | 36.3 ± 7.3 | __ | Health |
| 2009 | Straube_EXP 1 | 12 | 12 | 0 | __ | 21.8 | Right | Health |
| 2009 | Straube_EXP 2 | 12 | 0 | 12 | __ | 23.2 | Right | Health |
| 2009 | Watson | 11 | 5 | 6 | __ | __ | Right | Health |
| 2010 | Wiech | 16 | 5 | 11 | __ | 24 | Right | Health |
| 2011 | Coen | 31 | 15 | 16 | __ | 30 | Right | Health |
| 2012 | Benson_EXP 1 | 15 | 0 | 15 | __ | 26.1 ± 8.3 | Right | Health |
| 2012 | Benson_EXP 2 | 15 | 15 | 0 | __ | 25.4 ± 3.8 | Right | Health |
| 2013 | Ter Minassian | 20 | 15 | 5 | __ | __ | Right | Health |
| 2013 | Seifert | 9 | 6 | 3 | __ | 26.4 ± 2.3 | Right | Health |
| 2013 | Kano_EXP 1 | 16 | 16 | 0 | __ | 30.9 ± 7.8 | __ | Health |
| 2013 | Kano_EXP 2 | 16 | 0 | 16 | __ | 27.8 ± 7.1 | __ | Health |
| 2013 | Linnman | 13 | 13 | 0 | __ | 36 ± 10 | Right | Health |
| 2013 | Schmid | 33 | __ | __ | Follicular phase | __ | __ | Health |
| 2013 | Strigo | 22 | 11 | 11 | Follicular | 26.8 ± 8.7 | __ | Health |
| Subjects (N) | Gender (N) | Menstrual cycle phase (N) | Average age | Manual dominance (N) | Health status (N) | |||
| 360 | Male 163Female 164Unknown 33 | Follicular phase 62Luteal phase 18Unknown 84 | 22.26 | Right 207Left 0Unknown 153 | 360 |
Clusters of Neural Activity Changes
The brain regions identified in the meta‐analysis have been presented in Table 3. Twenty‐one activation clusters were found. The pain anticipation analysis identified one cluster with a volume of 3,976 mm3 showing increased activity compared to baseline values. This included the bilateral midcingulate and the right medial and inferior frontal gyrus. A cluster with a volume of more than 2,000 mm3 included the right inferior frontal gyrus and the AI. Four other clusters with a volume between 376 and 984 mm3 include the bilateral insula, the right thalamus, the right middle frontal, and superior temporal gyri. Five clusters with volumes exceeding 200 mm3 were located in the bilateral AI, in the right culmen, in the right middle frontal and left occipital gyri, and in the left inferior parietal lobule. Other 10 clusters with a volume less than 200 mm3 were identified. The left superior and middle temporal gyri, and the left culmen, the lentiform nucleus, the medial frontal gyrus, the lingual gyrus, the caudate body, the superior temporal gyrus, the inferior parietal lobule, and the precuneus were involved (all of which were more lateralized toward the right).
Table 3.
Areas of functional change in brain activity associated with pain anticipation
| Cluster # | Volume (mm3) | Weighted center (x,y,z) | Extrema Value | Side | x | y | z | Label | BA | ||
|---|---|---|---|---|---|---|---|---|---|---|---|
| Activations | |||||||||||
| 1 | 3976 | 0.73 | 5.07 | 41.8 | 0.026760723 | Left | −4 | −2 | 44 | Cingulate gyrus | 24 |
| 0.026432797 | Left | −2 | 14 | 34 | Cingulate gyrus | 32 | |||||
| 0.020863015 | Right | 8 | 12 | 38 | Cingulate gyrus | 32 | |||||
| 0.017760256 | Right | 4 | −4 | 52 | Medial frontal gyrus | 6 | |||||
| 0.016204044 | Right | 2 | 6 | 40 | Cingulate gyrus | 32 | |||||
| 0.01610747 | Right | 6 | −8 | 64 | Medial frontal gyrus | 6 | |||||
| 2 | 2056 | 38.69 | 19.15 | 4.96 | 0.019749798 | Right | 38 | 24 | 8 | Inferior frontal gyrus | 13 |
| 0.016626155 | Right | 48 | 16 | 10 | Inferior frontal gyrus | 44 | |||||
| 0.016103687 | Right | 34 | 14 | −2 | Insula | 13 | |||||
| 0.015183485 | Right | 40 | 18 | −8 | Inferior frontal gyrus | 47 | |||||
| 0.014574555 | Right | 34 | 18 | −10 | Inferior frontal gyrus | 47 | |||||
| 3 | 984 | −41.74 | 11.39 | 1.96 | 0.027059542 | Left | −42 | 12 | 2 | Insula | 13 |
| 4 | 504 | −5.75 | −18.9 | −1.47 | 0.018086296 | Left | −6 | −20 | 0 | Thalamus | |
| 5 | 400 | 43.05 | 13.58 | 30.79 | 0.019650515 | Right | 42 | 14 | 32 | Middle frontal gyrus | 9 |
| 6 | 376 | 44.56 | 5.67 | .58 | 0.016676802 | Right | 44 | 6 | 0 | Insula | 13 |
| 0.015175186 | Right | 48 | 2 | 4 | Superior temporal gyrus | 22 | |||||
| 7 | 336 | −33.03 | 20.14 | 12.62 | 0.018826243 | Left | −32 | 20 | 12 | Insula | 13 |
| 8 | 296 | 28.86 | −55.96 | −18.72 | 0.01721359 | Right | 28 | −56 | −20 | Culmen | |
| 9 | 264 | 40.19 | 36.78 | 17.44 | 0.016413473 | Right | 40 | 36 | 18 | Middle frontal gyrus | 46 |
| 10 | 208 | −28.58 | −82.69 | 3.38 | 0.018108249 | Left | −28 | −82 | 4 | Middle occipital gyrus | 18 |
| 11 | 200 | −57.29 | −23.46 | 25.49 | 0.017619615 | Left | −58 | −24 | 26 | Inferior parietal lobule | 40 |
| 12 | 168 | −48.77 | −32.29 | 17.5 | 0.015580207 | Left | −48 | −32 | 18 | Superior temporal gyrus | 41 |
| 13 | 120 | 20.94 | −.56 | −6.42 | 0.0154311815 | Right | 22 | 0 | −6 | Putamen: lentiform nucleus | |
| 14 | 104 | 6.93 | 38.46 | 30.33 | 0.014937565 | Right | 8 | 38 | 30 | Medial frontal gyrus | 9 |
| 15 | 96 | −29.66 | −51.18 | −24.01 | 0.015370633 | Left | −30 | −52 | −24 | Culmen | |
| 16 | 88 | −51.11 | −60 | 1.81 | 0.015199458 | Left | −52 | −60 | 2 | Middle temporal gyrus | 37 |
| 17 | 64 | 25 | −73.01 | −3 | 0.01396475 | Right | 24 | −74 | −4 | Lingual gyrus | 18 |
| 18 | 64 | 13 | 8.99 | 11.52 | 0.014526118 | Right | 14 | 8 | 12 | Caudate body | |
| 19 | 56 | 48.27 | −34 | 14.57 | 0.014626882 | Right | 48 | −34 | 14 | Superior temporal gyrus | 41 |
| 20 | 56 | 52.85 | −32.29 | 24.86 | 0.013982619 | Right | 52 | −32 | 26 | Inferior parietal lobule | 40 |
| 21 | 56 | 22 | −62 | 31.99 | 0.015945906 | Right | 22 | −62 | 32 | Precuneus | 7 |
| Deactivations | |||||||||||
| 1 | 304 | 36.42 | −18.53 | .65 | 0.014397571 | Right | 36 | −18 | 0 | Claustrum | |
| 2 | 176 | 26.26 | −31.28 | −11.02 | 0.013597056 | Right | 26 | −32 | −10 | Parahippocampal gyrus | 36 |
| 3 | 160 | −13.29 | 43.02 | 32 | 0.013044022 | Left | −14 | 44 | 32 | Superior frontal gyrus | 9 |
| 4 | 144 | −11.88 | 36.12 | 3.22 | 0.013036894 | Left | −12 | 36 | 4 | Anterior cingulate | |
| 5 | 112 | −23.55 | −5.27 | −18.44 | 0.011829941 | Left | −24 | −6 | −18 | Amygdala | |
| 6 | 88 | −36.18 | −10.91 | 10.17 | 0.01174759 | Left | −36 | −10 | 10 | Claustrum | |
Six cluster of decreased activity with a volume of less than 305 mm3 were found in the right claustrum and bilateral parahippocampal gyrus, in the left superior frontal gyrus, anterior cingulate, and claustrum (Fig. 2).
Figure 2.
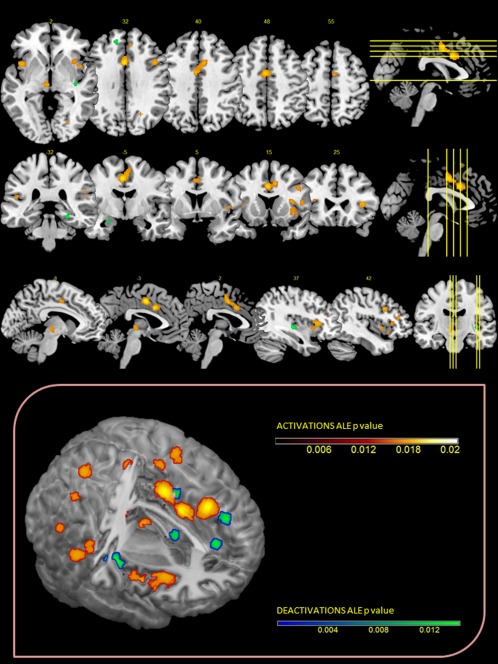
Upper Panel: ALE maps were computed using GingerALE 2.3.1 at an FDR‐corrected threshold of P < 0.05, with a minimum cluster size of K > 50 mm3 and visualized using MRIcron. Lower Panel: Activations and deactivations were projected onto a 3D rendering model of the brain.
Meta‐Analytic Connectivity Modeling Results
MACM maps for the two selected seed ROI (AI and ACC) were computed by ALE meta‐analysis over those experiments in BrainMap that featured the closest activation foci to AI or ACC. The brain regions identified in the meta‐analysis have been presented in Tables 4 and V.
Table 4.
MACM results: areas of functional coactivation associated with anterior insula.
| Cluster # | Volume (mm3) | Weighted center (x,y,z) | Extrema Value | Side | x | y | z | Label | BA | ||
|---|---|---|---|---|---|---|---|---|---|---|---|
| 1 | 228280 | −3.55 | −7.06 | 16.04 | 0.6434551 | Left | −34 | 18 | 6 | Insula | 13 |
| 0.5883515 | Right | 36 | 18 | 6 | Insula | 13 | |||||
| 0.42582726 | Left | −50 | −26 | 18 | Postcentral gyrus | 40 | |||||
| 0.40156615 | Left | −12 | −18 | 8 | Thalamus | ||||||
| 0.3695987 | Right | 10 | −16 | 8 | Thalamus: medial dorsal nucleus | ||||||
| 0.36011353 | Left | −42 | −2 | 8 | Insula | 13 | |||||
| 0.35216773 | Left | −46 | 2 | 32 | Inferior frontal gyrus | 6 | |||||
| 0.3424221 | Right | 50 | −26 | 20 | Postcentral gyrus | 40 | |||||
| 0.33011708 | Right | 44 | 4 | 30 | Inferior frontal gyrus | 9 | |||||
| 0.322656 | Right | 48 | −18 | 12 | Transverse temporal gyrus | 41 | |||||
| 0.31079876 | Left | −52 | −20 | 6 | Superior temporal gyrus | 41 | |||||
| 0.30936173 | Right | 20 | 2 | 8 | Putamen: lentiform nucleus | ||||||
| 0.3069187 | Right | 48 | −12 | 2 | Superior temporal gyrus | 22 | |||||
| 0.2869123 | Left | −30 | −56 | 44 | Inferior parietal lobule | 7 | |||||
| 0.27020133 | Right | 46 | −4 | 42 | Precentral gyrus | 6 | |||||
| 0.26156715 | Left | −22 | 0 | 8 | Putamen: lentiform nucleus | ||||||
| 0.2612229 | Right | 30 | −52 | 42 | Superior parietal lobule | 7 | |||||
| 0.24852586 | Left | −30 | −10 | 52 | Precentral gyrus | 6 | |||||
| 0.24826582 | Left | −42 | 20 | 24 | Middle frontal gyrus | 46 | |||||
| 0.22817238 | Left | −38 | −20 | 52 | Precentral gyrus | 4 | |||||
| 0.22623914 | Right | 36 | 34 | 30 | Superior frontal gyrus | 9 | |||||
| 0.19326285 | Left | −48 | −32 | 34 | Inferior parietal lobule | 40 | |||||
| 0.18658274 | Left | −56 | −8 | 18 | Postcentral gyrus | 43 | |||||
| 0.1673459 | Right | 38 | −34 | 46 | Inferior parietal lobule | 40 | |||||
| 0.1525383 | Right | 26 | −10 | 56 | Middle frontal gyrus | 6 | |||||
| 0.14430661 | Left | −36 | 44 | 16 | Middle frontal gyrus | 10 | |||||
| 0.1371554 | Right | 36 | 46 | 4 | Subgyral | ||||||
| 2 | 27720 | −.55 | 5.07 | 46.72 | 0.49378932 | Right | −2 | 0 | 52 | Medial frontal gyrus | 6 |
| 0.4199184 | Right | 2 | 10 | 44 | Medial frontal gyrus | 32 | |||||
| 3 | 9032 | −33.21 | −57.13 | −17.6 | 0.24764018 | Left | −38 | −56 | −16 | Cerebellum: declive | |
| 0.21902621 | Left | −26 | −56 | −24 | Cerebellum: culmen | ||||||
| 0.17895485 | Left | −14 | −56 | −18 | Cerebellum: culmen | ||||||
| 4 | 4560 | 24.39 | −54.67 | −20.85 | 0.22727059 | Right | 22 | −54 | −20 | Cerebellum: culmen | |
| 0.14731172 | Right | 36 | −50 | −16 | Cerebellum: culmen | ||||||
| 5 | 840 | 42.03 | −65.96 | −4.79 | 0.1577052 | Right | 42 | −66 | −4 | Inferior temporal gyrus | 37 |
| 6 | 632 | 15.25 | −76.58 | 27.69 | 0.14978878 | Right | 12 | −76 | 30 | Cuneus | 19 |
| 0.14011084 | Right | 24 | −76 | 24 | Precuneus | 31 | |||||
The AI mainly showed higher coactivation probabilities in the claustrum, thalamus, inferior/middle and superior frontal gyri, inferior parietal lobule, precuneus, lentiform nucleus (putamen), parahippocampal gyrus, pre‐/postcentral gyri, and middle temporal gyrus. The second largest cluster of coactivation involved the medial frontal gyrus, anterior and posterior cingulate (Table 4 and Fig. 3A). The ACC showed significantly higher coactivation probabilities in the insula, thalamus, inferior/middle and superior frontal gyri, inferior parietal lobule, lentiform nucleus (putamen), pre‐/postcentral gyri, and transverse temporal gyrus (Table 5 and Fig. 3B).
Figure 3.
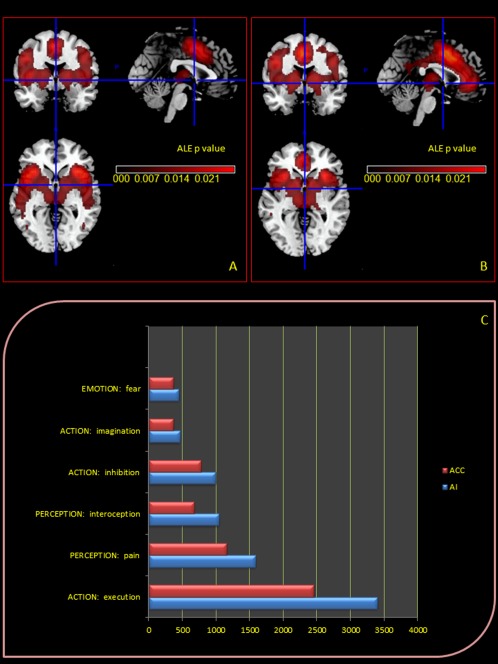
Upper Panel: Meta‐analytic connectivity modeling (MACM) assessment of anterior insula (A) and cingulate (B) corteces functional connectivity. MACM maps were computed using Lower Panel: Functional characterization by behavioural domain. The red/blue bars denote the number of foci for the particular behavioural domain within the AI and ACC selected ROI.
Table 5.
MACM results: areas of functional coactivation associated with anterior cingulate cortex.
| Cluster # | Volume (mm3) | Weighted center (x,y,z) | Extrema Value | Side | x | y | z | Label | BA | ||
|---|---|---|---|---|---|---|---|---|---|---|---|
| 1 | 172032 | −8.25 | −1.15 | 17.35 | 0.53371775 | Right | 32 | 16 | 6 | Claustrum | |
| 0.5183436 | Left | −32 | 18 | 4 | Insula | 13 | |||||
| 0.4198978 | Left | −10 | −18 | 8 | Thalamus: medial dorsal nucleus | ||||||
| 0.39752766 | Left | −44 | 2 | 30 | Inferior frontal gyrus | 6 | |||||
| 0.393495 | Right | 8 | −18 | 8 | Thalamus: medial dorsal nucleus | ||||||
| 0.3630739 | Right | 44 | 4 | 30 | Inferior frontal gyrus | 9 | |||||
| 0.35479698 | Left | −38 | −50 | 40 | Inferior parietal lobule | 40 | |||||
| 0.33239314 | Left | −28 | −64 | 42 | Precuneus | 19 | |||||
| 0.31912488 | Right | 20 | 2 | 6 | Putamen: lentiform nucleus | ||||||
| 0.3189487 | Right | 38 | 34 | 28 | Superior frontal gyrus | 9 | |||||
| 0.31761295 | Left | −30 | −8 | 50 | Precentral gyrus | 6 | |||||
| 0.30904394 | Right | 14 | 4 | 6 | Lateral globus pallidus: lentiform nucleus | ||||||
| 0.306843 | Left | −42 | 18 | 24 | Putamen: lentiform nucleus | ||||||
| 0.29688847 | Left | −12 | 6 | 2 | Middle frontal gyrus | 46 | |||||
| 0.29538175 | Left | −20 | 4 | 4 | Lateral globus pallidus: lentiform nucleus | ||||||
| 0.26115072 | Left | −22 | −6 | −12 | Putamen: lentiform nucleus | ||||||
| 0.2551982 | Right | 22 | −4 | −12 | Amygdala | ||||||
| 0.24218717 | Left | −54 | −26 | 18 | Amygdala | ||||||
| 0.24129258 | Right | 30 | −8 | 52 | Postcentral gyrus | 40 | |||||
| 0.21208912 | Left | −34 | 42 | 20 | Precentral gyrus | 6 | |||||
| 0.20621897 | Left | −36 | −24 | 50 | Middle frontal gyrus | 10 | |||||
| 0.18115602 | Right | 20 | −28 | −2 | Precentral gyrus | 4 | |||||
| 0.16311207 | Left | −22 | −26 | −4 | Thalamus | ||||||
| 0.16210227 | Left | −52 | −38 | 4 | Lateral geniculum body | ||||||
| 0.15745774 | Left | −42 | −68 | 28 | Middle temporal gyrus | 22 | |||||
| 2 | 67264 | −1.03 | 15.05 | 30.76 | 0.6752904 | Left | −4 | 6 | 46 | Angular gyrus | 39 |
| 0.5989484 | Right | 2 | 14 | 38 | Medial frontal gyrus | 32 | |||||
| 0.42025372 | Left | −2 | 44 | 0 | Cingulate gyrus | 32 | |||||
| 0.38642523 | Left | −2 | 36 | 14 | Anterior cingulate | 32 | |||||
| 0.19941182 | Left | −4 | −52 | 26 | Cingulate gyrus | 31 | |||||
| 0.19270587 | Left | −6 | −54 | 18 | Posterior cingulate | 23 | |||||
| 0.18818463 | Right | 0 | −28 | 32 | Cingulate gyrus | 23 | |||||
| 3 | 14632 | 37.52. | −46.57 | 35.35 | 0.27411708 | Right | 38 | −48 | 42 | Inferior parietal lobule | 40 |
| 0.20316766 | Right | 16 | −70 | 42 | Precuneus | 7 | |||||
| 0.19018883 | Right | 54 | −24 | 20 | Postcentral gyrus | 40 | |||||
| 0.19008641 | Right | 52 | −22 | 14 | Insula | 40 | |||||
| 0.1619685 | Right | 52 | −46 | 32 | Supramarginal gyrus | 40 | |||||
| 4 | 6400 | −37.62 | −58.03 | −17.97 | 0.24575204 | Left | −40 | −56 | −16 | Fusiform gyrus | 37 |
| 0.20823723 | Left | −30 | −56 | −28 | Cerebellum: anterior lobe | ||||||
| 5 | 4624 | 26.97 | −55.77 | −21.95 | 0.24533382 | Left | 28 | −58 | −24 | Cerebellum: anterior lobe | |
Indeed, the identified networks of coactivation are largely overlapping and seem to have a common origin in the same coactivation likelihood of the dorsolateral (BA 9,46) and medial PFC (BA 32).
Characterization of the clusters
Task‐based coactivations of each cluster were delineated by performing an ALE meta‐analysis across all experiments featuring at least one activation in that region (Fig. 3C). All the BD that were significantly over‐represented in experiments activating AI or ACC were described. Indeed, the minimum threshold of activation considered was 400 foci (labelled as “raw counts” in the output of the behavioral analysis plug‐in included in the Multi‐image Analysis GUI [Mango] v3.2.7 image processing system).
Several BDs were identified: in particular, for ROI 1 and ROI 2, activations were highly correlated to the BD of action (imagination, inhibition, and execution), emotion and perception (pain and interoception).
DISCUSSION
The novel goal of this coordinate‐based ALE meta‐analysis was to quantitatively analyze the results of neuroimaging studies investigating cerebral activation changes aiming to investigate the role of pain anticipation and the functional network on the basis of this phenomenon. We considered 19 fMRI experiments (in terms of 24 experimental conditions). Our study represents the first attempt never been addressed in the literature to consider pain anticipation paradigms in a single analysis, in order to provide a more objective overall perspective and a novel explanation of the cerebral network that consistently activate when a participant is anticipating a painful event to occur.
Our analyses identified significant ALE clusters; altogether, these studies included data from 360 subjects and reported 347 activation and 147 deactivation foci. These numbers were sufficient to objectively proceed with the ALE analysis (as previously stated by Laird in her “Users' Manual for BrainMap GingerALE 2.0”).
As far as methodological considerations are concerned, as Caspers et al. [2010] in their meta‐analysis of action observation and imitation underlined, the results of any given neuroimaging experiment are influenced by various study‐specific idiosyncrasies, including the experimental design, implementation of the paradigm, task requirements, the included subjects, and the analysis of the data. In this direction, Rainville and Duncan [2006] pointed out that meta‐analyses are prone to selection biases. Moreover, Caspers et al. [2010] added that one way to overcome these drawbacks is to integrate the results from several neuroimaging studies by means of quantitative meta‐analyses [Eickhoff et al., 2009; Laird et al., 2009; Turkeltaub et al., 2002], as we have recently demonstrated through our ALE meta‐analysis on placebo analgesia [Amanzio et al., 2013].
The outcome of the ALE obtained was characterized by brain regions consistently activated when a participant is anticipating a painful event to occur. As this outcome could encompass many independent and related processes, the simple nature of the constituent contrast makes it difficult to draw any inferences about which brain regions might be involved in discrete functional processes, nor how inter‐regional activation is likely to represent a coordinated output. To explore the BD associated with the FC network, we added to the ALE analysis a MACM. Importantly, the MACM allows meta‐analyses, which instead of pooling studies that share a common experimental design, look for global coactivation patterns across a diverse range of tasks, thus responding to the question “for a given region what tasks elicit activation?” [Laird et al. 2009]. In particular, the specific preidentified seed regions (ROI 1 and 2: AI and ACC, respectively) were differentiated with respect to their FC linking the identifying cortical modules to functional properties based on similarities and differences in the coactivation map. Indeed, the meta‐analytic connectivity profile and BD profiles were identified for each ROI. Interestingly, ROIs 1 and 2 produced very consistent results. In particular, the identified networks of coactivation were largely overlapping, mostly involving the same brain areas. Interestingly, activations in ROI 1 and 2 were highly correlated to the BD of action (imagination, inhibition, and execution), emotion (where fear represents an important domain) and perception (pain and interoception).
In line with the results we obtained, it is important to underline that the frequency of activation across all databased experiments is naturally high for heteromodal regions that are involved in a wide range of tasks such as for AI [Kurth et al. 2010] and ACC [Amodio and Frith, 2006]. These areas may be considered as a hub that connects systems involved in action monitoring, representation of the affective qualities of sensory events and interoceptive signals. They play a unique role in representing conceptual information relevant for survival and in transducing concepts into affective behavioral and physiological responses [Roy et al., 2012]. A role in this phenomenon is played by the dorsolateral and medial PFC. Its functional meaning, as underlined by Arnsten [2009] in her landmark review, is given by the ability to keep in mind an event that has just occurred, or bring to mind information from long‐term storage and use this representational knowledge to regulate behavior, thought, and emotion [Goldman‐Rakic, 1996]. The PFC is able to protect these representations from the interference of external or internal distractions and is a key for inhibiting inappropriate actions and promoting task relevant operations (so‐called “top‐down” regulation) [Thompson‐Schill et al., 2002; Aron et al., 2004; Buschman and Miller, 2007; Gazzaley et al., 2007]. PFC operations allow the flexible regulation of behavior to enable us to properly respond to a changing environment—for example, the ability to shift an attentional set to new dimensions and to alter decision making as reward contingencies shift [Lee and Seo, 2007; Robbins, 2000]. The PFC also monitors errors, giving us the insight that we are incorrect and need to shift strategies [Modirrousta and Fellows, 2008]. An influential theory states that dACC monitors performance and signals that are needed for behavioral adaptation [Holroyd et al., 2004; Ridderinkhof et al., 2004a, b]. Indeed, action monitoring is particularly important in situations that may put the health of a human being at risk and may constitute a threat. In the latter, given a choice, we select actions expected to lead to better outcomes. Such selection requires a representation of expected values of different actions, as well as the continuous monitoring of outcomes to update the aforesaid. This mechanism may represent a key aspect in pain anticipation paradigms. In this case, the individual should be ready to react to a discomforting context. The monitoring attentional system, important for the phenomenon we observed, represented by the ACC [Posner and Reichle, 1994], serves to ensure that the elaboration processes in other brain regions are of the highest efficiency, in relation to the demands of the tasks that are taking place. It is proposed that activity in the dACC signals the need for increased cognitive control [Ridderinkhof et al., 2004a, b] and interactions between the dACC and lateral prefrontal structures implement subsequent behavioral changes [Egner, 2009; Kouneiher et al., 2009; Ridderinkhof et al., 2004a, b]. The midcingulate comprises different subareas with a complex pattern of connection with limbic structures and appears to be important for the integration of emotional and cognitive processes and vegetative activity [Damasio, 1994; Devinsky et al., 1995; Ongür and Price, 2000]. In particular, the interaction between ACC, DLPFC, and AI may support the construction of a mental representation (behavioral MACM display: imagination) of a negative impending event (behavioral MACM display: fear). Importantly and novelty, the results of the MACM analysis revealed the activation of a common core system for implementing task set also known as the salience network [Seeley et al., 2007] involved in pain anticipation phenomena.
More evidence of functional interaction between ACC and AIC, as a network that initiates key control signals in response to salient stimuli or events, comes from a study by Sridharan et al. [2008] which identified a frontoinsular cingulate system engaging the brain's attentional and higher‐order control processes while disengaging other systems, such as the default mode network (DMN) that are not task‐relevant. Another cortical area involved in the salience network is the inferior frontal gyrus [Seeley et al., 2007] and the increase of this network is observed in situations important in changing behavior [Dosenbach et al., 2007], as those we found in the experimental condition we analyzed. Tractography evidence shows that AI cortex has direct white matter connections to other key regions within this network including, not only the dACC [van de Heuvel et al., 2009], but also the inferior parietal lobe [Uddin et al., 2010], another region we observed activated during pain anticipation in the ALE meta‐analysis. Tight control of the balance of activity in the salience network and DMN appears important for efficient cognitive function, as rapid deactivation of the DMN is required for focused attention [Weissman et al., 2006], such those related with a pain anticipation response. Interestingly, even if claustrum is not part of the DMN, we demonstrated in our ALE meta‐analysis a deactivation of this structure related with pain anticipation responses. The results we obtained may be explained by taking into account its physiological role. Importantly, it plays a role in multisensory integrative processing and it facilitates the interaction between the DMN and task‐related network [Smythies et al., 2013]. A reduction in its activity influences the functioning of task‐related networks, such as those associated with a context of pain anticipation.
MACM results showed that it may be interesting to imagine a supramodal system activated by pain anticipation where AI and ACC play a prominent role in selecting emotional, attentional and sensory (pain/interoception) resources. As Mennon and Uddin [2010] previously underlined, taken together, as part of a functionally coupled network, the AI and ACC help to integrate bottom‐up attention switching with top‐down control and biasing of sensory input. This dynamic process enables an organism to shift through many different incoming sensory stimuli and adjust gain for task‐relevant stimuli, processes central to attention [Yantis, 2008]. Importantly, as we have previously underlined, the AI and ACC form the core of the salience network that facilitates the detection of important environmental salient stimuli. Although salience filters likely exist at multiple levels of ascending pathways that bring sensory stimuli into the neocortex, what makes the salience network special is that it triggers a cascade of cognitive control signals that have a major impact on how such a stimulus is subsequently processed. Critically, the observation that the AI and the ACC are coactivated during a wide range of cognitive tasks provides a starting point for investigating its core functions in future studies.
As we find in the MACM, AI and ACC were coactivated by a number of BD such as monitoring, conflict, and response inhibition and negative emotions such as fear [see in this direction, e.g., Atlas & Wager, 2012]. These complex functions are not specifically related to pain perception even if prefrontal, cingulate and insula cortices and the medial thalamic nuclei are regions represented in the medial pain pathway [Petrovic et al., 1999; Rainville, 2002; Vogt, 2005] proposed to mediate the unpleasant, affective dimensions of pain, and the motivation to escape from the noxious event [Price, 2000; Treede et al., 1999].
Since the paradigms used in the selected studies analyzed the period of “expected hyperalgesia,” as the time between the beginning of the scan and the beginning of the stimulus and as the nocebo response also occurs through negative verbal suggestions when inert substances are not administered, pain anticipation phenomenon may be considered as a way to elicit and study the nocebo response. Indeed, only a few studies have analyzed the nocebo phenomenon and importantly, only one of them has described cortical–subcortical circuitries related to the nocebo response using fMRI technique [Kong et al., 2008]. Except for the hippocampus, these areas are in line with the ones we found through our meta‐analysis where a special role is played by dACC, AI, and lateral and medial prefrontal cortices.
The results we obtained during anticipation emphasize the need for an appropriate psychological approach to predict potentially noxious events. Since expectations are future predictions derived from both past experience and present contexts, this flow of expectation‐related information may be crucial for the development of the perceptual set we observed in pain expectation conditions. Such a highly distributed perceptual set of self‐regulation may prime brain regions to process information where action (imagination, inhibition, and execution), emotion and perception (pain and interoception) play a central role.
Supporting information
Supplementary Information
ACKNOWLEDGMENTS
There are no conflicts of interest that may arise as a result of this research.
REFERENCES
- Amanzio M, Benedetti F, Porro CA, Palermo S, Cauda F (2013): Activation likelihood estimation meta‐analysis of brain correlates of placebo analgesia in human experimental pain. Hum Brain Mapp 34:738–752. [DOI] [PMC free article] [PubMed] [Google Scholar]
- Amodio DM, Frith CD (2006): Meeting of minds: The medial frontal cortex and social cognition. Nat Rev Neurosci 7:268–277. [DOI] [PubMed] [Google Scholar]
- Arnsten AF (2009): Stress signalling pathways that impair prefrontal cortex structure and function. Nat Rev Neurosci 10:410–422. [DOI] [PMC free article] [PubMed] [Google Scholar]
- Aron AR, Robbins TW, Poldrack RA (2004): Inhibition and the right inferior frontal cortex. Trends Cogn Sci 8:170–177. [DOI] [PubMed] [Google Scholar]
- Atlas LY, Bolger N, Lindquist MA, Wager TD (2010): Brain mediators of predictive cue effects on perceived pain. J Neurosci 30:12964–12977. [DOI] [PMC free article] [PubMed] [Google Scholar]
- LY Atlas, TD Wager (2012): How expectations shape pain. Neurosci Lett 520:140–148. [DOI] [PubMed] [Google Scholar]
- Buschman TJ, Miller EK (2007): Top‐down versus bottom‐up control of attention in the prefrontal and posterior parietal cortices. Science 315:1860–1862. [DOI] [PubMed] [Google Scholar]
- Caspers S, Zilles K, Laird AR, Eickhoff SB (2010): ALE meta‐analysis of action observation and imitation in the human brain. Neuroimage 50:1148–1167. [DOI] [PMC free article] [PubMed] [Google Scholar]
- Chua P, Krams M, Toni I, Passingham R, Dolan R (1999): A functional anatomy of anticipatory anxiety. Neuroimage 9:563–571. [DOI] [PubMed] [Google Scholar]
- Damasio AR (1994): Descartes Error: Emotion, Reason, and the Human. Quill, New York.
- Devinsky O, Morrell MJ, Vogt BA (1995): Contributions of anterior cingulate cortex to behaviour. Brain 118 (Pt 1):279–306. [DOI] [PubMed] [Google Scholar]
- Dosenbach NU, Fair DA, Miezin FM, Cohen AL, Wenger KK, Dosenbach RA, Fox MD, Snyder AZ, Vincent JL, Raichle ME, Schlaggar BL, Petersen SE (2007): Distinct brain networks for adaptive and stable task control in humans. Proc Natl Acad Sci USA 104:11073–11078. [DOI] [PMC free article] [PubMed] [Google Scholar]
- Drevets WC, Burton H, Videen TO, Snyder AZ, Simpson JR, Raichle ME (1995): Blood flow changes in human somatosensory cortex during anticipated stimulation. Nature 373:249–252. [DOI] [PubMed] [Google Scholar]
- Eickhoff SB, Laird AR, Grefkes C, Wang LE, Zilles K, Fox PT (2009): Coordinate‐based activation likelihood estimation meta‐analysis of neuroimaging data: A random‐effects approach based on empirical estimates of spatial uncertainty. Hum Brain Mapp 30:2907–2926. [DOI] [PMC free article] [PubMed] [Google Scholar]
- Eickhoff SB, Bzdok D, Laird AR, Roski C, Caspers S, Zilles K, Fox PT (2011): Co‐activation patterns distinguish cortical modules, their connectivity and functional differentiation. Neuroimage 57:938–949. [DOI] [PMC free article] [PubMed] [Google Scholar]
- Eickhoff SB, Bzdok D, Laird AR, Kurth F, Fox PT (2012): Activation likelihood estimation meta‐analysis revisited. Neuroimage 59:2349–2361. [DOI] [PMC free article] [PubMed] [Google Scholar]
- Egner T (2009. Prefrontal cortex and cognitive control: Motivating functional hierarchies. Nat Neurosci 12:821–822. [DOI] [PubMed] [Google Scholar]
- Gazzaley A, Rissman J, Cooney J, Rutman A, Seibert T, Clapp W, D'Esposito M (2007): Functional interactions between prefrontal and visual association cortex contribute to top‐down modulation of visual processing. Cereb Cortex 17 Suppl 1:i125–i135. [DOI] [PMC free article] [PubMed] [Google Scholar]
- Goldman‐Rakic PS (1996): The prefrontal landscape: Implications of functional architecture for understanding human mentation and the central executive. Philos Trans R Soc Lond B Biol Sci 351:1445–1453. [DOI] [PubMed] [Google Scholar]
- Holroyd CB, Nieuwenhuis S, Yeung N, Nystrom L, Mars RB, Coles MG, Cohen JD (2004): Dorsal anterior cingulate cortex shows fMRI response to internal and external error signals. Nat Neurosci 7:497–498. [DOI] [PubMed] [Google Scholar]
- Hsieh JC, Stone‐Elander S, Ingvar M (1999): Anticipatory coping of pain expressed in the human anterior cingulate cortex: A positron emission tomography study. Neurosci Lett 262:61–64. [DOI] [PubMed] [Google Scholar]
- Kong J, Gollub RL, Polich G, Kirsch I, Laviolette P, Vangel M, Rosen B, Kaptchuk TJ (2008): A functional magnetic resonance imaging study on the neural mechanisms of hyperalgesic nocebo effect. J Neurosci 28:13354–13362. [DOI] [PMC free article] [PubMed] [Google Scholar]
- Koyama T, Tanaka YZ, Mikami A (1998): Nociceptive neurons in the macaque anterior cingulate activate during anticipation of pain. Neuroreport 9:2663–2667. [DOI] [PubMed] [Google Scholar]
- Koyama T, McHaffie JG, Laurienti PJ, Coghill RC (2005): The subjective experience of pain: Where expectations become reality. Proc Natl Acad Sci USA 102:12950–12955. [DOI] [PMC free article] [PubMed] [Google Scholar]
- Kouneiher F, Charron S, Koechlin E (2009): Motivation and cognitive control in the human prefrontal cortex. Nat Neurosci 12:939–945. [DOI] [PubMed] [Google Scholar]
- Kurth F, Zilles K, Fox PT, Laird AR, Eickhoff SB (2010): A link between the systems: Functional differentiation and integration within the human insula revealed by meta‐analysis. Brain Struct Funct 214:519–534. [DOI] [PMC free article] [PubMed] [Google Scholar]
- Laird AR, Lancaster JL, Fox PT (2009): Lost in localization? The focus is meta‐analysis. Neuroimage 48:18–20. [DOI] [PMC free article] [PubMed] [Google Scholar]
- Laird AR, Fox PM, Price CJ, Glahn DC, Uecker AM, Lancaster JL, Turkeltaub PE, Kochunov P, Fox PT (2005): ALE meta‐analysis: Controlling the false discovery rate and performing statistical contrasts. Hum Brain Mapp 25:155–164. [DOI] [PMC free article] [PubMed] [Google Scholar]
- Laird AR, Eickhoff SB, Rottschy C, Bzdok D, Ray KL, Fox PT (2013): Networks of task co‐activations. Neuroimage 80:505–514. [DOI] [PMC free article] [PubMed] [Google Scholar]
- Lancaster JL, Woldorff MG, Parsons LM, Liotti M, Freitas CS, Rainey L, Kochunov PV, Nickerson D, Mikiten SA, Fox PT (2000): Automated Talairach atlas labels for functional brain mapping. Hum Brain Mapp 10:120–131. [DOI] [PMC free article] [PubMed] [Google Scholar]
- Lancaster JL, Tordesillas‐Gutiérrez D, Martinez M, Salinas F, Evans A, Zilles K, Mazziotta JC, Fox PT (2007): Bias between MNI and Talairach coordinates analyzed using the ICBM‐152 brain template. Hum Brain Mapp 28:1194–1205. [DOI] [PMC free article] [PubMed] [Google Scholar]
- Lancaster JL, Laird AR, Eickhoff SB, Martinez MJ, Fox PM, Fox PT (2012): Automated regional behavioral analysis for human brain images. Front Neuroinform 6:23. [DOI] [PMC free article] [PubMed] [Google Scholar]
- Lee D, Seo H (2007): Mechanisms of reinforcement learning and decision making in the primate dorsolateral prefrontal cortex. Ann N Y Acad Sci 1104:108–122. [DOI] [PubMed] [Google Scholar]
- Liberati A, Altman DG, Tetzlaff J, Mulrow C, Gøtzsche PC, Ioannidis JP, Clarke M, Devereaux PJ, Kleijnen J, Moher D (2009): The PRISMA statement for reporting systematic reviews and meta‐analyses of studies that evaluate healthcare interventions: Explanation and elaboration. BMJ 339:b2700. [DOI] [PMC free article] [PubMed] [Google Scholar]
- Menon V, Uddin LQ (2010): Saliency, switching, attention and control: A network model of insula function. Brain Struct Funct. 214:655–667. [DOI] [PMC free article] [PubMed] [Google Scholar]
- Modirrousta M, Fellows LK (2008): Dorsal medial prefrontal cortex plays a necessary role in rapid error prediction in humans. J Neurosci 28:14000–14005. [DOI] [PMC free article] [PubMed] [Google Scholar]
- Moher D, Liberati A, Tetzlaff J, Altman DG, Group P (2009): Preferred reporting items for systematic reviews and meta‐analyses: The PRISMA statement. BMJ 339:b2535. [DOI] [PMC free article] [PubMed] [Google Scholar]
- Ongür D, Price JL (2000): The organization of networks within the orbital and medial prefrontal cortex of rats, monkeys and humans. Cereb Cortex 10:206–219. [DOI] [PubMed] [Google Scholar]
- Petrovic P, Ingvar M, Stone‐Elander S, Petersson KM, Hansson P (1999): A PET activation study of dynamic mechanical allodynia in patients with mononeuropathy. Pain 83:459–470. [DOI] [PubMed] [Google Scholar]
- Ploghaus A, Tracey I, Gati JS, Clare S, Menon RS, Matthews PM, Rawlins JN (1999): Dissociating pain from its anticipation in the human brain. Science 284:1979–1981. [DOI] [PubMed] [Google Scholar]
- Ploghaus A, Becerra L, Borras C, Borsook D (2003): Neural circuitry underlying pain modulation: Expectation, hypnosis, placebo. Trends Cogn Sci 7:197–200. [DOI] [PubMed] [Google Scholar]
- Porro CA, Baraldi P, Pagnoni G, Serafini M, Facchin P, Maieron M, Nichelli P (2002): Does anticipation of pain affect cortical nociceptive systems? J Neurosci 22:3206–3214. [DOI] [PMC free article] [PubMed] [Google Scholar]
- Porro CA, Cettolo V, Francescato MP, Baraldi P (2003): Functional activity mapping of the mesial hemispheric wall during anticipation of pain. Neuroimage 19:1738–1747. [DOI] [PubMed] [Google Scholar]
- Posner MI, Reichle ME (1994): Images of Mind. New York: Scientific American Library. [Google Scholar]
- Price DD (2000): Psychological and neural mechanisms of the affective dimension of pain. Science 288:1769–1772. [DOI] [PubMed] [Google Scholar]
- Price DD, Milling LS, Kirsch I, Duff A, Montgomery GH, Nicholls SS (1999): An analysis of factors that contribute to the magnitude of placebo analgesia in an experimental paradigm. Pain 83:147–156. [DOI] [PubMed] [Google Scholar]
- Rainville P (2002): Brain mechanisms of pain affect and pain modulation. Curr Opin Neurobiol 12:195–204. [DOI] [PubMed] [Google Scholar]
- Rainville P, Duncan GH (2006): Functional brain imaging of placebo analgesia: Methodological challenges and recommendations. Pain 121:177–180. [DOI] [PubMed] [Google Scholar]
- Ridderinkhof KR, Ullsperger M, Crone EA, Nieuwenhuis S (2004a) The role of the medial frontal cortex in cognitive control. Science 306:443–447. [DOI] [PubMed] [Google Scholar]
- Ridderinkhof KR, van den Wildenberg WP, Segalowitz SJ, Carter CS (2004b) Neurocognitive mechanisms of cognitive control: The role of prefrontal cortex in action selection, response inhibition, performance monitoring, and reward‐based learning. Brain Cogn 56:129–140. [DOI] [PubMed] [Google Scholar]
- Robbins TW (2000): From arousal to cognition: The integrative position of the prefrontal cortex. Prog Brain Res 126:469–483. [DOI] [PubMed] [Google Scholar]
- Roy M, Shohamy D, Wager TD (2012): Ventromedial prefrontal‐subcortical systems and the generation of affective meaning. Trends Cogn Sci 16:147–156. [DOI] [PMC free article] [PubMed] [Google Scholar]
- Salimi‐Khorshidi G, Smith SM, Keltner JR, Wager TD, Nichols TE (2009): Meta‐analysis of neuroimaging data: A comparison of image‐based and coordinate‐based pooling of studies. Neuroimage 45:810–823. [DOI] [PubMed] [Google Scholar]
- Sawamoto N, Honda M, Okada T, Hanakawa T, Kanda M, Fukuyama H, Konishi J, Shibasaki H (2000): Expectation of pain enhances responses to nonpainful somatosensory stimulation in the anterior cingulate cortex and parietal operculum/posterior insula: An event‐related functional magnetic resonance imaging study. J Neurosci 20:7438–7445. [DOI] [PMC free article] [PubMed] [Google Scholar]
- Seeley WW, Menon V, Schatzberg AF, Keller J, Glover GH, Kenna H, Reiss AL, Greicius MD (2007): Dissociable intrinsic connectivity networks for salience processing and executive control. J Neurosci 27:2349–2356. [DOI] [PMC free article] [PubMed] [Google Scholar]
- Smythies J, Edelstein L, Ramachandran VS (2013): The claustrum: Structural, functional and clinical neuroscience. Academic Press.
- Sridharan D, Levitin DJ, Menon V (2008): A critical role for the right fronto‐insular cortex in switching between central‐executive and default‐mode networks. Proc Natl Acad Sci USA 105:12569–12574. [DOI] [PMC free article] [PubMed] [Google Scholar]
- Staub E, Tursky B, Schwartz GE (1971): Self‐control and predictability: Their effects on reactions to aversive stimulation. J Pers Soc Psychol 18:157–162. [DOI] [PubMed] [Google Scholar]
- Thompson‐Schill SL, Jonides J, Marshuetz C, Smith EE, D'Esposito M, Kan IP, Knight RT, Swick D (2002): Effects of frontal lobe damage on interference effects in working memory. Cogn Affect Behav Neurosci 2:109–120. [DOI] [PubMed] [Google Scholar]
- Treede RD, Kenshalo DR, Gracely RH, Jones AK (1999): The cortical representation of pain. Pain 79:105–111. [DOI] [PubMed] [Google Scholar]
- Turkeltaub PE, Eden GF, Jones KM, Zeffiro TA (2002): Meta‐analysis of the functional neuroanatomy of single‐word reading: Method and validation. Neuroimage 16:765–780. [DOI] [PubMed] [Google Scholar]
- Uddin LQ, Supekar K, Amin H, Rykhlevskaia E, Nguyen DA, Greicius MD, Menon V (2010): Dissociable connectivity within human angular gyrus and intraparietal sulcus: Evidence from functional and structural connectivity. Cereb Cortex 20:2636–2646. [DOI] [PMC free article] [PubMed] [Google Scholar]
- van den Heuvel MP, Mandl RC, Kahn RS, Hulshoff Pol HE (2009): Functionally linked resting‐state networks reflect the underlying structural connectivity architecture of the human brain. Hum Brain Mapp 30:3127–3141. [DOI] [PMC free article] [PubMed] [Google Scholar]
- Vogt BA (2005): Pain and emotion interactions in subregions of the cingulate gyrus. Nat Rev Neurosci 6:533–544. [DOI] [PMC free article] [PubMed] [Google Scholar]
- Yantis S (2008): The neural basis of selective attention: Cortical sources and targets of attentional modulation. Curr Dir Psychol Sci 17:86–90. [DOI] [PMC free article] [PubMed] [Google Scholar]
- Weissman DH, Roberts KC, Visscher KM, Woldorff MG (2006): The neural bases of momentary lapses in attention. Nat Neurosci 9:971–978. [DOI] [PubMed] [Google Scholar]
Associated Data
This section collects any data citations, data availability statements, or supplementary materials included in this article.
Supplementary Materials
Supplementary Information