

Abstract
Alcohol dependence results in two different clinical forms: “uncomplicated” alcoholism (UA) and Korsakoff's syndrome (KS). Certain brain networks are especially affected in UA and KS: the frontocerebellar circuit (FCC) and the Papez circuit (PC). Our aims were (1) to describe the profile of white matter (WM) microstructure in FCC and PC in the two clinical forms, (2) to identify those UA patients at risk of developing KS using their WM microstructural integrity as a biomarker. Tract‐based spatial statistics and nonparametric voxel‐based permutation tests were used to compare diffusion tensor imaging (DTI) data in 7 KS, 20 UA, and 14 healthy controls. The two patient groups were also pooled together and compared to controls. k‐means classifications were then performed on mean fractional anisotropy values of significant clusters across all subjects for two fiber tracts from the FCC (the middle cerebellar peduncle and superior cerebellar peduncle) and two tracts from the PC (fornix and cingulum). We found graded effects of WM microstructural abnormalities in the PC of UA and KS. UA patients classified at risk of developing KS using fiber tracts of the PC from DTI data also had the lowest scores of episodic memory. That finding suggests that WM microstructure could be used as a biomarker for early detection of UA patients at risk of developing KS. Hum Brain Mapp 36:2795–2808, 2015. © 2015 Wiley Periodicals, Inc.
Keywords: alcoholism, Korsakoff's syndrome, frontocerebellar circuit, Papez's circuit, tract‐based spatial statistics, classification
INTRODUCTION
The effects of chronic and excessive alcohol consumption on the human brain and cognition result, among others, in two different clinical forms of alcohol‐dependence, which differ mainly by the extent of brain damage [Pitel et al., 2012]. The more severe clinical form is the Korsakoff's syndrome (KS) [Korsakoff, 1889], which is defined by permanent and debilitating neurological complications that arise from a combination of heavy alcohol consumption and thiamine deficiency. Patients with KS suffer from retrograde [Kopelman, 1989; for review Oscar‐Berman, 2012] and anterograde [Fama et al., 2012 for review] amnesia, as well as ataxia Sullivan et al., 2000], visuospatial deficits [Jacobson et al., 1990], and executive dysfunctions [Oscar‐Berman, 2012 for review]. Postmortem [Harper, 2009; Harper and Kril, 1990; Mayes et al., 1988; Victor et al., 1971] and neuroimaging studies [Colchester et al., 2001; Krabbendam et al., 2000; Pitel et al., 2009; Sullivan and Marsh, 2003; Sullivan et al., 1999] revealed structural brain abnormalities in KS patients, especially in the thalamus, cingulate cortex, cerebellum, mammillary bodies, and white matter (WM) tracts of the superior cerebellar vermis [Harper et al., 2003]. Studies using magnetic resonance imaging (MRI) have also shown shrinkage of the frontal and parietal cortices [Christie et al., 1988]. The impact of the pathology on the hippocampus is still under debate with some studies reporting the region as preserved [Colchester et al., 2001; Squire et al., 1990], while others found it damaged [Sullivan and Marsh, 2003; Visser et al., 1999].
The other clinical form of alcohol‐dependence refers to patients often considered as “Uncomplicated Alcoholics” (UA) [Pitel et al., 2009, 2012; for review Oscar‐Berman et al., 2014; Zahr, 2014]. Those patients, equally coined as “detoxified alcoholics” [Chanraud et al., 2007 for example], or “non‐Korsakoff alcoholics” [Parsons, 1998 for example] are those without ostensible and severe neurological complications or liver dysfunctions [Alexander‐Kaufman et al., 2006; Harper, 2007; Harper and Matsumoto, 2005; Matsumoto, 2009; for review Oscar‐Berman et al., 2014; Zahr, 2014]. This clinical form is characterized by its heterogeneity but is known to result in mild‐to‐moderate cognitive deficits [Parsons and Nixon, 1998; Sullivan et al., 2000] and brain damage [Chanraud et al., 2007; Rosenbloom et al., 2003]. The neuropsychological profile includes impairment of working memory and executive functions such as planning, organization, categorization, flexibility, inhibition, and deduction of rules [Ambrose et al., 2001; Ihara et al., 2000; Noël et al., 2001; Pitel et al., 2007]. Episodic memory is also affected in UA with both encoding and retrieval processes being impaired [Noël et al., 2012; Pitel et al., 2007]. Neuroimaging investigations revealed gray matter volume losses in the frontal, parietal, and medial temporal lobes, the cerebellar cortex, cerebellar vermis, as well as subcortical structures including the thalamus and the caudate nucleus [Chanraud et al., 2007; Pfefferbaum et al., 1992; Shear et al., 1996; Sullivan, 2003; Sullivan et al., 2003]. Neuropathological studies reported a disruption of the cytoskeleton and WM shrinkage especially in the corpus callosum, superior frontal cortex, anterior superior cerebellar vermis, and the limbic system [Chanraud et al., 2009; Harris et al., 2008; Pfefferbaum et al., 2006, 2009]. While postmortem examination of the human brain did not indicate demyelination because of the inherent rapid disintegration of cellular membranes following death, animal studies have shown thinning of myelin sheaths [Phillips et al., 1991]. Differences in microstructural integrity have also been found in vivo in diffusion tensor imaging (DTI) studies of alcoholic patients having lower fractional anisotropy (FA) in the genu of the corpus callosum in men and the centrum semiovale in women [Pfefferbaum and Sullivan, 2005]. When WM fiber tracts were defined a priori, lower FA values were revealed in the mesencephalic and pontine region, superior longitudinal fasciculus, external capsule, fornix, and cingulum [Chanraud et al., 2009; Harris et al., 2008; Pfefferbaum et al., 2006, 2009].
In both UA and KS, two brain networks and associated cognitive functions are predominantly affected: the frontocerebellar circuit (FCC) [Chanraud et al., 2010a, 2010b] and the Papez circuit (PC) [Aggleton, 2012; Parsons, 1998]. The FCC, identified in non‐human primates using viral transneuronal tracing technology [Kelly and Strick, 2003], consists of two distinct, parallel closed‐loops within the corticothalamo‐cerebellar circuitry. The first one underlies executive functions and includes Brodmann areas 9 and 46 of the dorsolateral prefrontal cortex, which receives input from the cerebellar crus I and II through the thalamus, and projects back to the cerebellum through the pons. The second one contributes to motor functions and encompasses the motor cortex, which receives input from lobules IV–VI of the cerebellar vermis through the thalamus and feeds back to the cerebellum via the pons [Chanraud et al., 2010a, 2010b]. DTI technique and tractography analyses [Oishi et al., 2011] have shown that the superior cerebellar peduncle connects the cerebellum to the thalamus, which is then connected to the dorsolateral prefrontal cortex through the anterior limb of the internal capsule and the anterior corona radiata. The feedback loop goes from the dorsolateral prefrontal cortex back to the pons via corticopontine tracts and back to the cerebellum through the middle cerebellar peduncle. The PC [Aggleton and Brown, 1999; Papez, 1937], involved in episodic memory, includes the hippocampal formation, which connects to the mammillary bodies via the fornix. The thalamus then receives information from the mammillary bodies via the mammilothalamic tract. The anterior limb of the internal capsule connects the thalamus to the cingulate gyrus, which is in turn connected back to the hippocampus through the cingulum bundle.
The PC and the FCC are affected in both clinical forms, but not to the same extent, hence, the difference of clinical severity between UA and KS patients. In fact, the comparison between these two clinical forms of alcohol‐dependence revealed patterns of differences and similarities in the profiles of cognitive impairments and brain structural deficits. Neuropsychological and neuroimaging studies have shown that impairment of the FCC is generally comparable in both UA and KS, whereas graded effects are observed for the PC [Pitel et al., 2008, 2012]. More precisely, it has been shown that while deficits in working memory and executive functions did not differ significantly between UA and KS patients, deficits in episodic memory are more severe in KS patients compared to UA [Butters and Brandt, 1985; Fama et al., 2012; Pitel et al., 2008]. Volumetric analyses of gray matter [Harper, 2009; Harper et al., 2003; Pitel et al., 2009, 2012; Sullivan and Pfefferbaum, 2009] have also indicated that nodes belonging to the PC including the medial thalami and mammillary bodies were more severely affected in KS compared to UA patients. Similar degrees of shrinkage have been observed in both patient groups in some of the nodes of the FCC including the frontal cortex but not in the pons and cerebellum, for which graded effects were observed [Sullivan and Pfefferbaum, 2009]. The few studies that have compared UA and KS patients regarding WM volumes indicated that the cerebellar WM [Kril et al., 1997], corpus callosum, and thalamic radiations were more severely damaged in KS than in UA [Harper et al., 2003; Pitel et al., 2012].
The comparison of neuropsychological functioning between UA and KS patients gave rise to the hypothesis that the effects of chronic alcohol consumption lie along a continuum from mild‐to‐moderate impairments in UA to severe ones in patients with KS [Butters and Brandt, 1985; Parsons, 1998; Ryback, 1971]. The existence of a continuum between these two clinical forms reflects the heterogeneity within the UA group with some patients having preserved results similar to those of healthy controls (HC), while others have severe deficits close to those of KS patients [Pitel et al., 2008]. The latter ones are at risk to develop severe alcohol‐related neurological complications but they often go undiagnosed [Pitel et al., 2011] and therefore do not receive appropriate treatment. Early identification of these patients would help clinicians in optimizing treatment outcome. Clinical, neuropsychological, and macrostructural brain biomarkers of risks for KS have been proposed. Previous studies have suggested that a subgroup of UA patients with episodic memory impairments [Pitel et al., 2008] and thalamic shrinkage [Pitel et al., 2012] close to those of KS patients can be identified. This subgroup of patients may even be clinically defined by the presence of signs of Wernicke's encephalopathy [Pitel et al., 2011]. How WM microstructure can also be used as a biomarker of KS has never been explored. The WM microstructure and structural connectivity has never been investigated in KS and, therefore, the integrity of the fibers bundles has never been quantitatively compared between UA and KS. Comparisons of WM have so far been limited to neuropathological investigations [Harper, 2009] and one voxel‐based morphometry (VBM) study of WM volumes [Pitel et al., 2012]. Those studies gave first insights regarding WM volumes but did not provide a clear picture of the differences in the microstructure of WM bundles. The latter is better represented by observing the differences in FA values of WM fiber tracts, obtained through DTI studies, under the assumption that FA is a structural biomarker that depicts WM disruption involving myelin, cytoskeleton, and the axons' microtubule system [Pfefferbaum et al., 2006]. We should, however, bear in mind that in absence of sound methodological procedures, measurements of FA values could turn out to be artefactual instead of reflecting impairments due to factors inherent to alcohol‐dependence. One example is the “correspondence problem” [Smith et al., 2006] following poor spatial normalization. A preserved WM tract would be observed as impaired if what are being effectively measured are FA values in crossing fibers which are inherently lower.
The first objective of the present study was, therefore, to describe the WM microstructure in UA and KS compared to HC using a voxel‐wise approach. We hypothesize graded effects of compromised WM integrity in the bundles of the PC (KS < UA < HC) but not in those of the FCC ([KS = UA] < HC). Since the UA group is classically heterogeneous, the second objective was to identify UA patients at risk of developing KS through the analysis of WM integrity across the tracts belonging to the FCC and PC.
MATERIALS AND METHODS
Participants
Twenty‐seven patients (22 men, 5 women) with alcohol‐dependence (DSM IV criteria) [American Psychiatric Association, 1994] and 14 healthy subjects (9 men, 5 women) were included in the study. To be included, all participants had to be between 18‐ and 70‐year old, and to have French as their native language. No participant had a comorbid psychiatric disorder (no other axis 1 of the DSM IV as evaluated by MINI 500) [American Psychiatric Association, 1994], was under psychotropic medication, had a history of serious chronic pathology (diabetes, hepatitis, HIV, endocrinal disorder, as revealed by participants' blood tests), neurological problems (traumatic head injury causing loss of consciousness for >30 min, epilepsy, stroke, etc.) that might have affected cognitive function. No participant fulfilled the DSM‐IV criteria for abuse of another substance over the last 3 months, nor filled the DSM‐IV criteria for dependence of another substance (except tobacco). They had not taken any other psychoactive substance for more than 5 times over the last month (except alcohol for the patients) and had not participated in any neuropsychological study or had any neuropsychological evaluation during the previous year. All participants gave their informed consent to the study, which was approved by the local ethics committee. Their demographical details are summarized in Table 1. All patients were recruited for this study while being inpatients at Caen University Hospital. The study was carried out in line with the Declaration of Helsinki [1964].
Table 1.
Demographical, clinical, and neuropsychological description of the alcoholics with and without Korsakoff's syndrome and control participants
| Variable | HC(n = 14) | UA(n =2 0) | KS(n = 7) | Between‐group comparisons |
|---|---|---|---|---|
| Age (years) | 45.4 ± 6.9 | 45.2 ± 8.1 | 55.3 ± 7.8 | HC = UA; HC < KS |
| [31–55] | [34–63] | [44–67] | UA < KS | |
| Education (years) | 11.5 ± 2.5 | 11.9 ± 1.7 | 9.4 ± 2.8 | HC = UA; HC = KS |
| [7–15] | [9–15] | [6–15] | UA < KS | |
| Alcohol Use Disorders Test (AUDIT) | 3.2 ± 1.4 | 29.2 ± 7.5 | 16.6 ± 14.0 | HC < UA; HC < KS |
| [0–5] | [9–39] | [1–37] | UA < KS | |
| Beck Depression Index (BDI) | 3.6 ± 3.2 | 13.2 ± 7.5 | 9.0 ± 10.0 | HC < UA; HC = KS |
| [0–9] | [2–27] | [0–29] | UA = KS | |
| Mini Mental State (MMS) (/30) | 28.4 ± 1.1 | 27.4 ± 2.2 | 22.3 ± 3.3 | HC = UA; HC < KS |
| [27–30] | [21–30] | [18–27] | UA < KS | |
| MATTIS Total score | 141 ± 2.0 | 136 ± 6.7 | 114 ± 12.3 | HC < UA; HC < KS |
| [136–144] | [119–143] | [95–132] | UA < KS | |
| STAIa A | 27.2 ± 7.2 | 31.6 ± 11.0 | 33.4 ± 6.4 | HC = UA; HC = KS |
| [20–47] | [20–59] | [25–42] | UA = KS | |
| STAIa B | 33.4 ± 7.0 | 44.4 ± 12.3 | 42.0 ± 11.1 | HC < UA; HC = KS |
| [23–47] | [28–66] | [26–56] | UA = KS | |
| Fagerstromb | 0.7 ± 1.8 | 4.8 ± 3.6 | N/A | HC<UA |
| [0‐6] | [0–14] | |||
| Abstinence before inclusion (days) | N/A | 2.4 ± 3.1 | 53.7 ± 29.4 | UA<SK |
| [1–13] | [1–100] | |||
| Alcohol Use (years) | N/A | 29.6 ± 9.3 | NR | NA |
| [18–51] | ||||
| Alcohol misuse (years) | N/A | 18.3 ± 8.7 | NR | NA |
| [2–30] | ||||
| Alcohol dependence (years) | N/A | 9.5 ± 6.7 | NR | NA |
| [1–26] | ||||
| Number of previous detoxifications | N/A | 3.3 ± 2.6 | NR | NA |
| [0–11] |
HC = Healthy Controls; UA = Uncomplicated Alcoholics; KS = Alcoholics with Korsakoff's Syndrome.
NR = data not reported since it was not possible to obtain complete and accurate information regarding alcohol history in all KS patients.
Mean ± standard deviation and range [minimum – maximum] are reported.
*Mann–Whitney U tests P < 0.05.
State‐Trait Anxienty Inventory for adults, Y‐A for “state anxiety” and Y‐B for “trait anxiety” [Spielberger et al., 1983].
Fagerstrom [Heatherton et al., 1991].
Of those 27 patients, seven (six men, one woman) filled the DSM IV criteria for persisting amnestic disorder [American Psychiatric Association, 1994] and were, therefore, diagnosed as KS patients. All KS patients had a history of heavy drinking (longer than 20 years), a Mini‐Mental State (MMS) [Folstein et al., 1975] score of at least 20, were abstinent for at least 7 days and were diagnosed with severely impaired episodic memory as revealed by a neuropsychological examination. The consequences of their memory impairments were such that none of the KS were able to go back to their previous jobs and all of them lived in sheltered accommodation or were inpatients waiting for a place in an institution. It was difficult to obtain accurate information about their alcohol intake due to their amnesia. The background information for the KS came mainly from family members and medical records. For each KS patient, the selection was made according to a codified procedure in a French officially registered center for addiction. The case of each patient was examined by a multidisciplinary team made up of specialists in cognitive neuropsychology and behavioral neurology. Clinical and neuroimaging investigations ruled out other possible causes of memory impairments (particularly focal brain damage).
The 20 alcoholic patients without KS were considered as UA patients. They were recruited by clinicians while being inpatients for alcohol‐dependence at Caen University Hospital. Although patients were early in abstinence (2.4 ± 3.1 days of sobriety prior to inclusion), none of them presented physical symptoms of alcohol withdrawal as assessed by the Cushman's scale [Cushman et al., 1985] at inclusion. They were interviewed with the Alcohol Use Disorders Identification Test (AUDIT) [Gache et al., 2005]) and a modified version of the semistructured lifetime drinking history [Pfefferbaum et al., 1988]. Measures included the duration of alcohol use (in years), alcohol misuse (in years), alcohol dependence (in years), number of withdrawals, and daily alcohol consumption prior to treatment (in units, a standard drink corresponding to a beverage containing 10 g of pure alcohol).
The control group (HC) was recruited locally mainly by word of mouth and to match the demographics of the UA patients. Inclusion criteria were: a minimum MMS score of 26 or a minimum MATTIS [Mattis, 1976] score of 129, and a maximum Beck Depression Index [Beck et al., 1961] of 29. The maximum score at the AUDIT was six for women and seven for men.
UA and HC were age‐ and education‐matched (P = 0.723 and P = 0.76, respectively). KS differed from both HC and UA in age, education (years of schooling) and MMSE scores. Age, education, depression (Beck Depression Inventory, and anxiety scores (State‐Trait Anxiety Inventory, STAI) for adults with two forms Y‐A for “state anxiety” and Y‐B for “trait anxiety”) [Spielberger et al., 1983] as well as nicotine dependence level (Fagerstrom Test) [Heatherton et al., 1991] are reported in Table 1.
All participants underwent a neuropsychological examination assessing intellectual abilities (Information and Matrix Reasoning subtests of the WAIS III [Wechsler, 2001a]), global cognitive function (MMSE) [Folstein et al., 1975] and episodic memory (the French version of the Free and Cued Selective Reminding Test [FSCRT]) [Grober and Buschke, 1987; Van der Linden, 2004]. Neuropsychological performances are reported in Table 2.
Table 2.
Neuropsychological description of the alcoholics with and without Korsakoff's syndrome and controls
| Cognitive functions | Tasks | HC | UA | KS | Tests* |
|---|---|---|---|---|---|
| Intellectual abilities (WAIS III subtests)a | Information | 9.1 ± 3.0 | 6.04 ± 3.0 | 5.2 ± 3.1 | HC>UA>KS |
| Matrix reasoning | 10.4 ± 2.2 | 7.71 ± 2.26 | 5.0 ± 4.4 | HC>UA>KS | |
| Episodic memory | FSCRT sum of 3 free recalls | 34.0 ± 4.9 | 28.5 ± 7.8 | 5.4 ± 2.9 | HC>UA>KS |
| Working memory (MEM‐III subtests)a | Forward visuospatial span | 8.5 ± 2.3 | 5.8 ± 1.5 | 5.1 ± 0.7 | HC>UA>KS |
| Backward visuospatial span | 8.7 ± 2.5 | 5.3 ± 1.3 | 3.9 ± 0.7 | HC>UA; HC>KS |
HC = Healthy Controls; UA = Uncomplicated Alcoholics; KS = Alcoholics with Korsakoff's Syndrome.
(Mean ± standard deviation) and range [minimum – maximum] are reported.
Mann–Whtney U tests P < 0.05.
Standard scores.
¥: comparison with KS not done as no data available.
WAIS III Wechsler Adults Intelligence Scale.
FSCRT: Free and Cued Selective Reminding Test.
DTI Data Acquisition
All participants underwent a DTI sequence on the Philips Achieva 3T MRI scanner (The Netherlands). 70 slices (slice thickness of 2mm, no gap) were acquired axially using a diffusion weighted imaging spin echo sequence (32 directions at b = 1,000 s/mm2, repetition time = 10,000 ms; echo time = 82 ms; flip angle = 90°, field of view = 224 × 224 mm2; matrix = 112 × 112 and in‐plane resolution of 2 × 2 mm2; one no‐diffusion weighted image at b = 0 s/mm2 was also acquired).
DTI Data Processing
The diffusion‐weighted images (DWI) for all subjects were first preprocessed to create FA images using the FSL Diffusion Toolbox (FDT; http://fsl.fmrib.ox.ac.uk/fsl/fslwiki/FDT) that is part of FSL 5.0 toolbox for medical image analysis [Smith et al., 2004]. The FA images were further processed using Tract‐Based Spatial Statistics (TBSS) for subsequent voxelwise statistical analysis [Smith et al., 2006]. TBSS presents an improvement on classical voxelwise approaches like VBM. More specifically, it first addresses the “correspondence problem” faced by standard registration algorithms where it is difficult to gauge whether the observed differences are indeed due to differences in tissue volumes/density or are artefactual modifications that result from local misalignment. The issue becomes more pertinent in the case of WM tracts where a higher level of precision is required to ensure that the FA values contained in the voxels come from exactly the same part of WM tract across all subjects. TBSS addresses the problem by tailoring the non‐linear registration algorithm to the requirements of the DTI data, followed by projection onto a tract representation that is alignment invariant (referred to as the mean FA skeleton). Such an approach also removes the need for applying a spatial smoothing for which the choice of the smoothing kernel is deemed to be done in an arbitrary manner, and results known to be highly dependent on the kernel size [Jones et al., 2005]. Smoothing increases partial volume effects between tissues such that it is difficult to differentiate between WM differences that are due to the biological mechanism under investigation or an artefactual measurement due to a mixture of tissues.
For each subject, the 32 DWI images were first corrected for distortions due to Eddy currents and aligned to the b = 0 s/mm2 image using rigid‐body registration for motion correction [Jenkinson et al., 2002]. FA images were then created by fitting a tensor model to the diffusion images and were further processed using TBSS. Briefly, all subjects' FA data were aligned into MNI space using the nonlinear registration tool (FNIRT), which uses a b‐spline representation of the registration warp field [Rueckert et al., 1999] resulting in FA maps of matrix size of 182 × 218 × 182 and voxel size of 1 × 1 × 1 mm3. Next, the mean FA image was calculated and thinned to create a mean FA skeleton, which represents the centers of all tracts common to the group. Each subject's aligned FA image was threshold at 0.3 to exclude low FA values that could be contaminated with partial volume effects from other non‐white‐matter tissues and to minimize intersubject variability. The resulting image is then projected onto the mean skeleton by filling every voxel of the latter with the maximum FA value that lies perpendicular to the skeleton structure. Voxel‐based statistics are performed on these “skeletonized” images.
Statistical Analyses
Comparison of WM integrity in HC, UA patients and KS patients in the whole‐brain (voxel‐based analysis)
Nonparametric permutation tests [Nichols and Holmes, 2002] were performed between HC and UA; HC and KS; and UA and KS groups. Age was included as a covariate to account for between‐group differences (KS being older than the two other groups). For each between‐group comparison, 5,000 permutations were done, and the data corrected for multiple comparisons (FWE, P < 0.05) using threshold‐free cluster enhancement (TFCE) [Smith and Nichols, 2009] for cluster‐wise correction. This statistical toolbox is implemented within FSL 5.0. (http://fsl.fmrib.ox.ac.uk/fsl/fslwiki/Randomise).
Identification of UA patients at risk of developing KS
Because of the heterogeneity within the UA group, UA and KS patients were pooled together to form a single group of alcohol‐dependant patients (UASK). The UASK group was then compared to the HC group using nonparametric permutation tests (5,000 permutations, FWE P < 0.05, TFCE).
The John Hopkins University International Consortium for Brain Mapping (JHU‐ICBM) DTI‐81 WM atlas [Oishi et al., 2011], implemented as an atlas tool in FSL 5.0 (http://fsl.fmrib.ox.ac.uk/fsl/fslwiki/Atlases), was then used to extract and binarise clusters highlighted in the previous between‐group analysis (UASK vs HC). Only the WM fiber tracts that belong to the FCC and PC were used to produce “fiber‐cluster masks.” These “fiber‐cluster masks” were then employed to extract the mean FA value within each tract belonging to the FCC and PC for each subject. Focus was laid on a couple of fiber tracts only for each circuit. In that respect, the cingulum and the fornix were chosen for the PC and the middle cerebellar peduncle and superior cerebellar peduncle for the FCC. These are the tracts that are believed to offer less variability in terms of specificity to the PC and FCC, respectively, having a lower involvement in fibers connecting other parts of the brain or involved in other circuitry.
For each fiber tract, a k‐means clustering classification was then performed on the mean FA values, with the algorithm constrained to separate the 41 participants into two groups. The aim was to find which WM fiber tract enables the identification of some UA patients classified into the same group as KS patients. A reliable classification would include all HC into one group, and all KS patients into the other group with the heterogeneous UA group fitting into either of these. Those UA who will be sorted within the same group as the KS patients will be deemed as UA_HIGH patients (for high risk of developing KS) while those who will be sorted within the same group as the HC will be labelled UA_LOW patients (for low risk of developing KS). It is hypothesized that a more robust classification will be obtained when using FA values in the fibers of the PC than in those of the FCC. Comparisons of episodic memory performance among the subsequent subgroups should help in asserting the robustness of the classification step.
-
Between‐group comparisons of episodic memory performance:
Episodic memory scores were compared between the groups of HC, UA_LOW, UA_HIGH, and KS using nonparametric Mann–Whitney U tests. The hypothesis is that the scores on the episodic memory test in UA_LOW patients will differ significantly from the UA_HIGH and KS patients but not from HC. UA_HIGH patients are expected to differ significantly from HC and UA_LOW and KS patients.
RESULTS
Comparison of WM Integrity in HC, UA Patients and KS Patients
UA versus HC
Nonparametric permutation tests (FWE, P < 0.05) between UA and HC showed lower FA values in fiber tracts spread across the whole brain including the corpus callosum (T max = 6.01; k = 6,258; η 2 = 0.17), the anterior limb of the internal capsule (T max = 5.86; k =742; η 2 =0.10), the anterior corona radiata (T max = 5.52; k = 2,215; η 2 = 0.16), the fornix (T max = 5.91; k = 560; η 2 = 0.15); the cingulum (T max = 4.95; k = 821; η 2 = 0.14); the middle cerebellar peduncle (T max = 5.17; k = 1,320; η 2 = 0.11), and the superior cerebellar peduncle T max = 4.92; k = 252; η 2 = 0.15) as shown in Figure 1.
Figure 1.
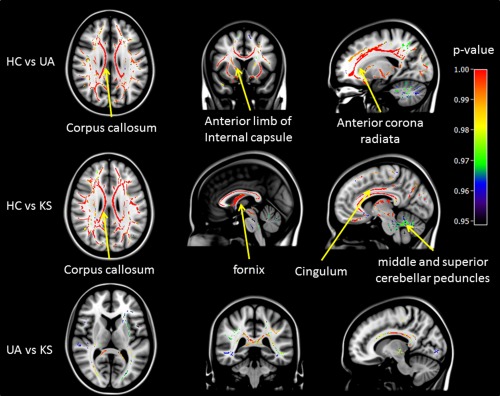
Voxel by voxel comparisons of FA values between HC and UA (top row), HC and KS (middle row), and UA and KS (bottom row) using nonparametric permutation tests (5,000 permutations, FWE P < 0.05, TFCE for cluster‐wise correction). P‐value maps are shown as (1‐p) images, displayed on a T1‐weighted MRI in MNI space.
Note: Values for effect size (η 2) have been calculated from T‐scores resulting from the nonparametric permutation tests.
KS versus HC
The profile of WM structural impairment in KS versus HC was similar to that between UA and HC. FA values were lower in KS than in HC in the same tracts as reported above but with higher T and k values: corpus callosum (T max = 10.52; k = 7,279; η 2 = 0.26), anterior corona radiata (T max = 7.45; k = 2,936; η 2 = 0.31), anterior limb of the internal capsule (T max = 7.00; k = 1,179; η 2=0.23); cingulum (T max = 6.93; k = 869; η 2 = 0.14); the fornix (T max = 6.60; k = 693; η 2 = 0.31); the middle cerebellar peduncle (T max = 6.30; k = 1,153; η 2 = 0.27), and the superior cerebellar peduncle T max = 7.27; k = 270; η 2=0.35).
UA versus KS
Group differences between UA and KS were found mainly in the corpus callosum (T max = 4.93; k = 4,453; η 2 = 0.139) and anterior corona radiata (T max = 4.9; k = 932; η 2 = 0.13). Other tracts with significant differences were also observed but they either had low T‐values or their cluster sizes were small. For example, anterior limb of the internal capsule (T max = 3.59; k = 163; η 2 = 0.11); cingulum (T max = 3.61; k = 103; η 2 = 0.14), and the fornix (T max = 3.81; k = 107; η 2 = 0.16). There were no significant differences in the middle and superior cerebellar peduncles.
There was no gender effect in the UA and KS groups across all WM fiber tracts. In the control group, differences between men and women were significant for the cingulum (Mann–Whitney U test, P = 0.014). There was no correlation between FA measures and beck depression index scores or years of education across all tracts for all three groups. There was also no correlation between FA measures and the number of detoxifications in the UA group. The same analysis could not be performed for the KS group since it was not possible to obtain complete and accurate information regarding alcohol history for these patients.
Identification of UA Patients at Risk of Developing KS
Comparison of WM integrity between HC and UASK
The comparison between HC and UASK (UA and SK patients pooled together) showed lower FA values in the patients in all the tracts mentioned in the previous results, including the middle cerebellar peduncle (T max = 5.14; k = 1,457; η 2 = 0.10); the superior cerebellar peduncle (T max = 5.20; k = 278; η 2 = 0.14); the fornix (T max = 7.20; k = 609; η 2 = 0.14), and the cingulum (T max = 5.47; k = 840; η 2 = 0.14). Figure 2 shows the WM tracts of the FCC and PC that are significantly disrupted in the UASK group compared to the HC group.
Figure 2.
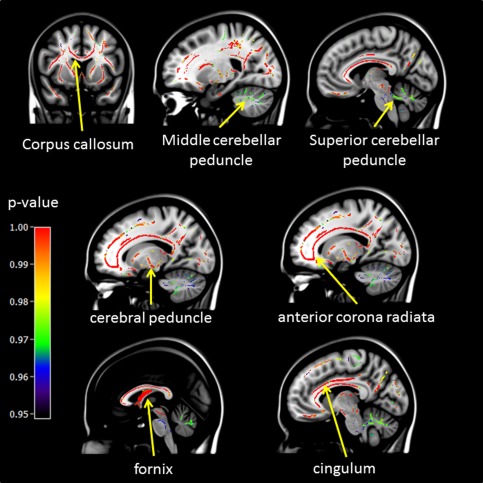
Voxel by voxel comparisons of FA values between HC and UASK using non‐parametric permutation tests (5,000 permutations, FWE P < 0.05, and TFCE for cluster‐wise correction). P‐value maps are shown as (1‐p) images, displayed on a T1‐weighted MRI in MNI space.
Identification of UA at risk to develop KS for each fiber tract
For all participants, mean FA values were extracted from significant fiber‐clusters (see above) for the middle and superior cerebellar peduncles, representing tracts from the FCC and the cingulum and fornix, representing tracts from the PC. A k‐means classification was then performed on those tracts. Figure 3 represents the distribution of the mean FA values for each selected tract identified in the WM atlas [Oishi et al., 2011] to be part of the FCC and PC.
Figure 3.
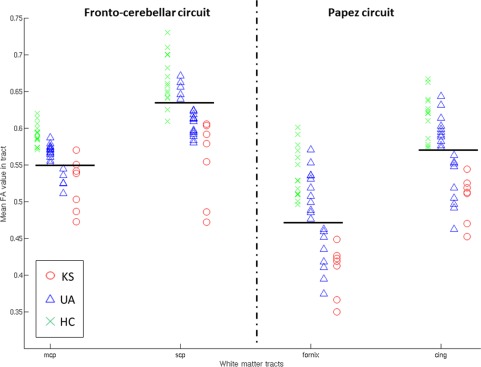
Distribution of the mean FA values for the selected WM tracts within the FCC (mcp = middle cerebellar peduncle, scp = superior cerebellar peduncle) and the PC (fornix and cing = cingulum). Horizontal black lines represent the separation between the two identified clusters. [Color figure can be viewed in the online issue, which is available at http://wileyonlinelibrary.com.]
With regard to WM tracts within the PC, the k‐means classification conducted on the FA values in the cingulum and fornix showed an expected classification of all HC in one group and all KS patients in another. Some UA patients were classified in the same group as HC and can be therefore considered as UA_LOW, while others were classified in the same group as KS and were thus qualified as UA_HIGH. The same patients were classified as UA_HIGH for both the cingulum and the fornix, except for two of them (one for cingulum and one for fornix). However, these two patients were those with the lowest FA values in the subsequent UA_LOW class. Comparisons of mean FA values among the four subgroups for both the cingulum and the fornix (ANOVA Kruskal‐Wallis) have shown that the controls did not differ from the UA_LOW group (P = 1). KS differed significantly from HC (P < 0.001) and UA_LOW (P = 0.01) but not UA_HIGH. UA_HIGH was significantly different from HC (P < 0.001), and UA_LOW (P = 0.01).
Regarding the tracts of the FCC, the results of the classification seemed less reliable since each of the two groups identified included a mix of KS patients, UA patients, and HC. Moreover, the number and the identity of the UA patients classified as UA_HIGH completely differed between the two tracts of the FCC.
Comparison of episodic memory performance in the UA_HIGH and UA_LOW groups
Since a better classification of patients for UA_HIGH and UA_LOW were obtained for the two WM tracts of the PC as opposed to the FCC, we compared episodic memory performances between the two subgroups of UA identified with the classification analysis conducted on FA values in the fornix and cingulum individually. Nonparametric Mann–Whitney U tests showed that UA_LOW did not differ from HC (P = 0.37 for the classification using the fornix and P = 0.32 for the classification using the cingulum). UA_LOW differed from UA_HIGH (P = 0.038 for the classification using the fornix and P = 0.025 for the classification using the cingulum). UA_HIGH differed significantly from HC (P = 0.002 for both fornix and cingulum) and KS (P = 0.001 for classification with the fornix and P = 0.002 for classification with the cingulum). The latter was significantly different to all the other three subgroups for both classifications (P < 0.001). These results are illustrated in Figure 4.
Figure 4.
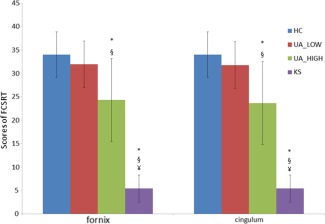
Episodic memory performance (sum of the three free‐recalls of FCSRT) in the HC,KS and subgroups UA_LOW and UA_HIGH.
UA_LOW and UA_HIGH have been identified using k‐means classification conducted on means FA values of significant fiber‐clusters in the fornix and the cingulum bundle.
*: sig different from HC; §: sig different from UA_LOW; ¥: sig different from UA_HIGH [Color figure can be viewed in the online issue, which is available at http://wileyonlinelibrary.com.]
We conducted the same analysis on the performances on matrix reasoning, and forward and backward block spans but found insignificant differences between the UA subgroups for neither the cingulum nor the fornix (data not shown). Hence, the ability to identify UA patients at risk of developing KS seems to be specific to performances in episodic memory tasks.
Note that we have also tested classification with the corpus callosum but it yielded poor results (data not shown since the corpus callosum is neither part of the FCC, nor the PC).
DISCUSSION
The first aim of this study was to describe the profile of microstructural WM integrity in UA and KS in the whole brain, at a voxel‐level, since most of the previous studies had been carried out using a region of interest approach (with anatomical regions defined a priori). In accordance with neuropathological [Harper et al., 2003; Kril et al., 1997] and neuroimaging studies [Chanraud et al., 2010a, 2010b; Pfefferbaum and Sullivan, 2005; Pfefferbaum et al., 2006, 2009], the present TBSS analysis of FA values in UA revealed widespread compromised WM microstructure including notably fibers of the FCC and the PC. Using a stringent statistical threshold (TFCE and FWE, P < 0.05), our voxel‐based analyses have successfully replicated previous DTI results in fibers defined a priori [Pfefferbaum et al., 2009] such as the superior longitudinal fasciculus, external capsule, fornix, and cingulum. Moreover, our analyses revealed compromised WM integrity in other fiber tracts such as the internal capsule, cerebral peduncles, corona radiata, and thalamic radiations, which has also been reported in a TBSS study comparing alcoholics who have been abstinent for at least 5 years with HC [Fortier et al., 2014]. Contrary to previous neuropathological [Harper et al., 2003] and neuroimaging studies [Chanraud et al., 2009; Pfefferbaum et al., 2009], we also found microstructural abnormalities in the middle and superior cerebellar peduncles. The use of a voxel‐based approach may have enabled the observation of the latter finding since a ROI approach, which would average the FA values within a region defined a priori, would not reveal any localized impairments within those fibers. Thus, WM abnormalities in the middle and superior cerebellar peduncles revealed by TBSS suggest that disruption may be more localized than spread‐throughout in those fibers.
Our study is the first to evaluate WM microstructural integrity in KS patients. When KS patients were compared to HC, the profile of WM abnormalities was similar to that observed between UA and HC, in agreement with the patterns of GM and WM shrinkage found in a recent VBM study [Pitel et al., 2012]. Compromised WM microstructure in the middle and superior cerebellar peduncles is in‐line with previous investigations that have shown significant shrinkage of the cerebellar WM of KS patients [Harper et al., 2003; Kril et al., 1997] and in proteomics studies where changes in the levels of thiamine‐dependent enzymes have been observed [Alexander‐Kaufman et al., 2006].
Previous neuropsychological and neuroimaging (structural and functional) studies have hypothesized that anterograde amnesia in KS patients is essentially due to a disconnection within the PC [Nahum et al., 2014; Warrington and Weiskrantz, 1982]. More specifically, findings of abnormalities in diencephalic structures, including the thalamus and mammillary bodies, and cortical structures from the frontal and medial temporal lobes have pushed toward the hypothesis of a disruption between nodes belonging to this neural network [Aupée et al., 2001; Kim et al., 2009; Renou et al., 2008]. Our study provides consolidating evidence of WM disruptions in the PC that is linked to episodic memory deficits and therefore amnesia [Kessels and Kopelman, 2012 for review). Based on the substantial role of the cerebellum in cognitive processes and its connections with cortical areas, damaged FCC has been hypothesized to be involved in working memory and executive dysfunction in KS [Wijnia and Goossensen, 2010]. Our data confirm compromised WM integrity in the cerebellum and especially disruption of the middle and superior cerebellar peduncles. In summary, cognitive deficits observed in KS patients, including amnesia, stems from a disconnection of neural networks, which can in turn be due to abnormalities in the nodes of the network(s), disruption of WM tracts linking those nodes, or abnormal synaptic activity between the nodes. While our study confirms the disruption of WM tracts in specific brain networks, and another study showed an absence of atrophy within connected regions [Nahum et al., 2014], it is still difficult to evaluate the cascade of events (neurotransmission dysfunction—local or global network disruption—cellular damage/atrophy) that effectively governs the pathophysiological mechanism of KS when using a cross‐sectional paradigm,. Longitudinal studies are required to concretely establish this mechanism.
Our direct voxel‐based comparison between UA and KS patients showed significant differences mainly in the corpus callosum, which follows previous volumetric studies that has reported further volume loss in the corpus callosum in alcoholic patients with Wernicke's Encephalopathy than those alcoholic patients without [Lee et al., 2005] and the other one between UA and KS [Pitel et al., 2012]. The abnormalities in the microstructural integrity of the corpus callosum have also been hypothesized to be due to thiamine deficiency as observed in a study with rats [He et al., 2007].
Contrary to our initial hypotheses, a clear graded effect of deficits in the PC was not observed. This can be attributed to our sample size and to the heterogeneity of the UA group. As neurological complications from UA to KS lie along a continuum [Ryback, 1971], it is difficult to observe a distinct pattern of microstructural degradation between these 2 groups, justifying the need to divide the UA group into subgroups to better observe their underlying pathological mechanisms. By first combining the UA and KS groups, the statistical power to detect all regions affected in alcohol dependent patients was increased [Monnig et al., 2013], ensuring that the subsequent classification step did not disregard any WM tracts that are potential structural biomarkers for identifying alcoholics at risk to develop neurological complications such as KS.
The classification step revealed that the use of DTI may be particularly relevant as a structural biomarker toward the early identification of UA patients at risk of developing KS. The early identification is important for clinicians to apply the correct and optimal treatment with the aim of preventing severe, debilitating and irreversible neurological complications. Our analysis provides consolidating evidence of the PC, as opposed to the FCC, being an appropriate neuroanatomical substrate for identifying UA patients that can potentially develop KS [Pitel et al., 2012]. The statistical comparisons of the mean FA values between the subgroups of subjects have confirmed the robustness of the classification step. The fact that there is a clear separation between HC and KS as well as consistent classification of the UA subgroups for the cingulum and fornix complements volumetric findings that have shown graded effects in the mammillary bodies, the hippocampus and the thalamus [Sullivan and Pfefferbaum, 2009]. In a previous study [Pitel et al., 2012], the volume of the thalamus was found to be comparable between some of the UA patients and the KS ones, reinforcing neuropsychological data that have shown the same trend in episodic memory deficits [Pitel et al., 2008]. While the volume of the thalamus was not explored in the present study, we confirm that UA patients classified at risk to develop KS based on WM microstructural abnormalities in the PC had the lowest episodic memory scores. Interestingly, it was also observed that 4 patients out of 10 classified as UA_LOW filled none of Caine's criteria for Wernicke's encephalopathy [Caine et al., 1997; Pitel et al., 2011], four patients filled one criterion and two filled more than two criteria. For the UA_HIGH subgroup, two patients filled no criterion, four filled one criterion and four filled more than two criteria. The number of signs of Wernicke's encephalopathy did not differ between the UA_LOW and UA_HIGH (Chi‐squared test, data not shown). Our refined neuroimaging analyses confirm that a neuropsychological evaluation, especially targeting episodic memory, is highly recommended in clinical settings, where neuroimaging tools are not available, to identify patients at risk of developing KS. Taken together, the analysis of microstructural integrity within the fornix and cingulum, in combination with scores of episodic memory, thalamic volume and signs of Wernicke's encephalopathy, could give a reliable depiction of whether a UA patient is at risk of developing KS. Our study is thus a positive iteration to the heuristic value of the continuity hypothesis [Butters and Brandt, 1985; Parsons, 1998; Pitel et al., 2008; Ryback, 1971]. While this inherent heterogeneity in the UA group enabled us to detect alcoholics at risk to develop neurological complications, the currently used average neuropsychological, structural and functional description of a UA group does not reflect the heterogeneity of individual profiles in clinical settings.
CONCLUSIONS AND FURTHER WORKS
TBSS has allowed us to describe the profile of WM integrity at a voxel‐level in UA and KS patients. While the chronological position of WM disruption is still unknown in the cascade of structural and functional events that govern the pathophysiological mechanism underlying the neurotoxicity of alcohol, we have shown the potential of DTI data to identify UA at risk of developing KS. The method paves the way for more in depth analysis of this subgroup in order to better understand the mechanism underlying these two clinical forms. Multi‐modal neuroimaging, combined with biological and neuropsychological analyses will enable researchers to explore the characteristics of these clinical forms in terms of detailed microstructure, regional volume, function, enzyme metabolism, and cognitive deficits. The specificity of the subgroup of patients at risk to develop KS is also likely to be confirmed via longitudinal studies in which the progress of the pathology can be monitored and the efficiency of the treatment can be assessed and optimized.
REFERENCES
- Aggleton JP (2012): Multiple anatomical systems embedded within the primate medial temporal lobe: Implications for hippocampal function. Neurosci Biobehav Rev 36:1579–1596. [DOI] [PubMed] [Google Scholar]
- Aggleton JP, Brown MW (1999): Episodic memory, amnesia, and the hippocampal‐anterior thalamic axis. Behav Brain Sci 22:425–444. [PubMed] [Google Scholar]
- Alexander‐Kaufman K, James G, Sheedy D, Harper C, Matsumoto I (2006): Differential protein expression in the prefrontal white matter of human alcoholics: A proteomics study. Mol Psychiatry 11:56–65. [DOI] [PubMed] [Google Scholar]
- Ambrose ML, Bowden SC, Whelan G (2001): Working memory impairments in alcohol‐dependent participants without clinical amnesia. Alcohol Clin Exp Res 25:185–191. [PubMed] [Google Scholar]
- American Psychiatric Association (1994): Diagnostic and Statistical Manual of Mental Disorders, 4th ed Washington, DC: American Psychiatric Association. [Google Scholar]
- Aupée AM, Desgranges B, Eustache F, Lalevée C, de la Sayette V, Viader F, Baron JC (2001): Voxel‐based mapping of brain hypometabolism in permanent amnesia with PET. Neuroimage 13:1164–1173. [DOI] [PubMed] [Google Scholar]
- Beck A, Ward C, Mendelson M, Mock J, Erbaugh J (1961): An inventory for measuring depression. Arch Gen Psychiatry 4:561–571. [DOI] [PubMed] [Google Scholar]
- Butters N, Brandt J (1985): The continuity hypothesis: The relationship of long‐term alcoholism to the Wernicke‐korsakoff syndrome. Recent Dev Alcohol 3:207–226. [DOI] [PubMed] [Google Scholar]
- Caine D, Halliday GM, Kril JJ, Harper CG (1997): Operational criteria for the classification of chronic alcoholics: Identification of wernicke's encephalopathy. J Neurol Neurosurg Psychiatry 62:51–60. [DOI] [PMC free article] [PubMed] [Google Scholar]
- Chanraud S, Martelli C, Delain F, Kostogianni N, Douaud G, Aubin HJ, Reynaud M, Martinot JL (2007): Brain morphometry and cognitive performance in detoxified alcohol‐dependents with preserved psychosocial functioning. Neuropsychopharmacology 32:429–438. [DOI] [PubMed] [Google Scholar]
- Chanraud S, Reynaud M, Wessa M, Penttilä J, Kostogianni N, Cachia A, et al. (2009): Diffusion tensor tractography in mesencephalic bundles: Relation to mental flexibility in detoxified alcohol‐dependent subjects. Neuropsychopharmacology 34:1223–1232. [DOI] [PubMed] [Google Scholar]
- Chanraud S, Pitel AL, Rohlfing T, Pfefferbaum A, Sullivan EV (2010a): Dual tasking and working memory in alcoholism: Relation to frontocerebellar circuitry. Neuropsychopharmacology 35:1868–1878. [DOI] [PMC free article] [PubMed] [Google Scholar]
- Chanraud S, Zahr N, Sullivan EV, Pfefferbaum A (2010b): MR diffusion tensor imaging: A window into white matter integrity of the working brain. Neuropsychol Rev 20:209–225. [DOI] [PMC free article] [PubMed] [Google Scholar]
- Christie JE, Kean DM, Douglas RHB, Engleman HM, St Clair D, Blackburn IM (1988): Magnetic resonance imaging in pre‐senile dementia of the Alzheimer‐type, multi‐infarct dementia and korsakoff's syndrome. Psychol Med 18:319–329. [DOI] [PubMed] [Google Scholar]
- Colchester A, Kingsley D, Lasserson D, Kendall B, Bello F, Rush C, Stevens TG, Goodman G, Heilpern G, Stanhope N, Kopelman MD (2001): Structural MRI volumetric analysis in patients with organic amnesia, 1: Methods and comparative findings across diagnostic groups. J Neurol Neurosurg Psychiatry 71:13–22. [DOI] [PMC free article] [PubMed] [Google Scholar]
- Cushman P Jr, Forbes R, Lerner W, Stewart M (1985): Alcohol withdrawal syndromes: clinical management with lofexidine. Alcohol Clin Exp Res 9:103–108. [DOI] [PubMed] [Google Scholar]
- Fama R, Pitel AL, Sullivan EV (2012): Anterograde episodic memory in korsakoff syndrome. Neuropsychol Rev 22:93–104. [DOI] [PMC free article] [PubMed] [Google Scholar]
- Folstein MF, Folstein SE, McHugh PR (1975): Mini‐mental state. A practical method for grading the cognitive state of patients for the clinician. J Psychiatr Res 12:189–198. [DOI] [PubMed] [Google Scholar]
- Fortier CB, Leritz EC, Salat DH, Lindemer E, Maksimovskiy AL, Shepel J, Williams V, Venne JR, Milberg WP, McGlinchey RE (2014): Widespread effects of alcohol on white matter microstructure. Alcohol Clin Exp Res 38:2925–2933. [DOI] [PMC free article] [PubMed] [Google Scholar]
- Gache P, Michaud P, Landry U, Accietto C, Arfaoui S, Wenger O, Daeppen JB (2005): The alcohol use disorders identification test (AUDIT) as a screening tool for excessive drinking in primary care: Reliability and validity of a french version. Alcohol Clin Exp Res 29:2001–2007. [DOI] [PubMed] [Google Scholar]
- Grober E, Buschke H (1987): Genuine memory deficits in dementia. Dev Neuropsychol 3:13–36. [Google Scholar]
- Harper C (2007): The neurotoxicity of alcohol. Hum Exp Toxicol 26:251–257. [DOI] [PubMed] [Google Scholar]
- Harper C (2009): The neuropathology of alcohol‐related brain damage. Alcohol Alcohol 44:136–140. [DOI] [PubMed] [Google Scholar]
- Harper C, Matsumoto I (2005): Ethanol and brain damage. Curr Opin Pharmacol 5:73–78. [DOI] [PubMed] [Google Scholar]
- Harper C, Dixon G, Sheedy D, Garrick T (2003): Neuropathological alterations in alcoholic brains. Studies arising from the new south wales tissue resource centre. Prog Neuropsychopharmacol Biol Psychiatry 27:951–961. [DOI] [PubMed] [Google Scholar]
- Harper CG, Kril JJ (1990): Neuropathology of alcoholism. Alcohol Alcohol 25:207–216. [DOI] [PubMed] [Google Scholar]
- Harris GJ, Jaffin SK, Hodge SM, Kennedy D, Caviness VS, Marinkovic K, Papadimitriou GM, Makris N, Oscar‐Berman M (2008): Frontal white matter and cingulum diffusion tensor imaging deficits in alcoholism. Alcohol Clin Exp Res 32:1001–1013. [DOI] [PMC free article] [PubMed] [Google Scholar]
- He X, Sullivan EV, Stankovic RK, Harper CG, Pfefferbaum A (2007): Interaction of thiamine deficiency and voluntary alcohol consumption disrupts rat corpus callosum ultrastructure. Neuropsychopharmacology 32:2207–2216. [DOI] [PubMed] [Google Scholar]
- Heatherton TF, Kozlowski LT, Frecker RC, Fagerström KO (1991): The fagerström test for nicotine dependence: A revision of the fagerström tolerance questionnaire. Br J Addict 86:1119–1127. [DOI] [PubMed] [Google Scholar]
- Ihara H, Berrios GE, London M (2000): Group and case study of the dysexecutive syndrome in alcoholism without amnesia. J Neurol Neurosurg Psychiatry 68:731–737. [DOI] [PMC free article] [PubMed] [Google Scholar]
- Jacobson RR, Acker CF, Lishman WA (1990): Patterns of neuropsychological deficit in alcoholic korsakoff's syndrome. Psychol Med 20:321–334. [DOI] [PubMed] [Google Scholar]
- Jenkinson M, Bannister P, Brady M, Smith S (2002): Improved optimization for the robust and accurate linear registration and motion correction of brain images. NeuroImage 17:825–841. [DOI] [PubMed] [Google Scholar]
- Jones DK, Symms MR, Cercignani M, Howard RJ (2005): The effect of filter size on VBM analyses of DT‐MRI data. NeuroImage 26:546–554. [DOI] [PubMed] [Google Scholar]
- Kelly RM, Strick PL (2003): Cerebellar loops with motor cortex and prefrontal cortex of a nonhuman primate. J Neurosci 23:8432–8444. [DOI] [PMC free article] [PubMed] [Google Scholar]
- Kessels RP, Kopelman MD (2012): Context memory in Korsakoff's syndrome. Neuropsychol Rev 22:117–131. [DOI] [PMC free article] [PubMed] [Google Scholar]
- Kim E, Ku J, Namkoong K, Lee W, Lee KS, Park J‐Y, Lee SY, Kim JJ, Kim SI, Jung YC (2009): Mammillothalamic functional connectivity and memory function in wernicke's encephalopathy. Brain 132:369–376. [DOI] [PubMed] [Google Scholar]
- Kopelman Michael D (1989): Remote and autobiographical memory, temporal context memory and frontal atrophy in korsakoff and alzheimer patients. Neuropsychologia 27:437–460. [DOI] [PubMed] [Google Scholar]
- Korsakoff S (1889): Etude medico‐psychologique sur une forme des maladies de la mémoire. Revue Philosophie 20:501–530. [Google Scholar]
- Krabbendam L, Visser PJ, Derix MMA, Verhey F, Hofman P, Verhoeven W, Tuinier S, Jolles J (2000): Normal cognitive performance in patients with chronic alcoholism in contrast to patients with korsakoff's syndrome. J Neuropsychiatry Clin Neurosci 12:44–50. [DOI] [PubMed] [Google Scholar]
- Kril JJ, Halliday GM, Svoboda MD, Cartwright H (1997): The cerebral cortex is damaged in chronic alcoholics. Neuroscience 79:983–998. [DOI] [PubMed] [Google Scholar]
- Lee S‐T, Jung Y‐M, Na DL, Park SH, Kim M (2005): Corpus callosum atrophy in wernicke's encephalopathy. J Neuroimaging 15:367–372. [DOI] [PubMed] [Google Scholar]
- Matsumoto I (2009): Proteomics approach in the study of the pathophysiology of alcohol‐related brain damage. Alcohol Alcohol 44:171–176. [DOI] [PubMed] [Google Scholar]
- Mattis S (1976): Mental status examination for organic mental syndrome in the elderly patients In: Bellak L, Karasu T, editors. Geriatrics Psychiatry: A Handbook for Psychiatrists and Primary Care Physicians. New York: Grune & Stratton; pp 77–121. [Google Scholar]
- Mayes AR, Meudell PR, Mann D, Pickering A (1988): Location of lesions in korsakoff's syndrome: Neuropsychological and neuropathological data on two patients. Cortex 24:367–388. [DOI] [PubMed] [Google Scholar]
- Monnig MA, Caprihan A, Yeo RA, Gasparovic C, Ruhl DA, Lysne P, Bogenschutz MP, Hutchison KE, Thoma RJ (2013): Diffusion tensor imaging of white matter networks in individuals with current and remitted alcohol use disorders and comorbid conditions. Psychol Addict Behav 27:455–465. [DOI] [PMC free article] [PubMed] [Google Scholar]
- Nahum L, Pignat JM, Bouzerda‐Wahlen A, Gabriel D, Liverani MC, Lazeyras F, Ptak R, Richiardi J, Haller S, Thorens G, Zullino DF, Guggisberg AG, Schnider A (2014): Neural Correlate of Anterograde Amnesia in Wernicke‐Korsakoff Syndrome. Brain Topogr [Epub ahead of print]. [DOI] [PubMed] [Google Scholar]
- Nichols TE, Holmes AP (2002): Nonparametric permutation tests for functional neuroimaging: A primer with examples. Hum Brain Mapp 15:1–25. [DOI] [PMC free article] [PubMed] [Google Scholar]
- Noël X, Van der Linden M, Schmidt N (2001): Supervisory attentional system in nonamnesic alcoholic men. Arch Gen Psychiatry 58:1152–1158. [DOI] [PubMed] [Google Scholar]
- Noël X, Van Der Linden M, Brevers D, Campanella S, Hanak C, Kornreich C, Verbanck P (2012): The contribution of executive functions deficits to impaired episodic memory in individuals with alcoholism. Psychiatry Res 198:116–122. [DOI] [PubMed] [Google Scholar]
- Oishi K, Faria A, Van Zijl PMC, Mori S (2011): An atlas of human white matter, 2nd ed. Amsterdam, Netherlands: Elsevier. Academic Press. [Google Scholar]
- Oscar‐Berman M (2012): Function and dysfunction of prefrontal brain circuitry in alcoholic korsakoff's syndrome. Neuropsychol Rev 22:154–169. [DOI] [PMC free article] [PubMed] [Google Scholar]
- Oscar‐Berman M, Valmas MM, Sawyer KS, Ruiz SM, Luhar RB, Gravitz ZR (2014): Profiles of impaired, spared, and recovered neuropsychologic processes in alcoholism. Handb Clin Neurol 125:183–210. [DOI] [PMC free article] [PubMed] [Google Scholar]
- Papez J (1937): A proposed mechanism of emotion. Arch Neurol Psychiatry 28:725–743. [Google Scholar]
- Parsons OA (1998): Neurocognitive deficits in alcoholics and social drinkers: A continuum? Alcohol Clin Exp Res 22:954–961. [PubMed] [Google Scholar]
- Parsons OA, Nixon SJ (1998): Cognitive functioning in sober social drinkers: A review of the research since 1986. J Stud Alcohol 59:180–190. [DOI] [PubMed] [Google Scholar]
- Pfefferbaum A, Sullivan EV (2005): Disruption of brain white matter microstructure by excessive intracellular and extracellular fluid in alcoholism: Evidence from diffusion tensor imaging. Neuropsychopharmacology 30:423–432. [DOI] [PubMed] [Google Scholar]
- Pfefferbaum A, Rosenbloom MJ, Crusan K, Jernigan TL (1988): Brain CT changes in alcoholics: Effects of age and alcohol consumption. Alcohol Clin Exp Res 12:81–87. [DOI] [PubMed] [Google Scholar]
- Pfefferbaum A, Lim KO, Zipursky RB, Mathalon DH, Rosenbloom MJ, Lane B, Ha CN, Sullivan EV (1992): Brain gray and white matter volume loss accelerates with aging in chronic alcoholics: A quantitative MRI study. Alcohol Clin Exp Res 16:1078–1089. [DOI] [PubMed] [Google Scholar]
- Pfefferbaum A, Adalsteinsson E, Sullivan EV (2006): Supratentorial profile of white matter microstructural integrity in recovering alcoholic men and women. Biol Psychiatry 59:364–372. [DOI] [PubMed] [Google Scholar]
- Pfefferbaum A, Rosenbloom MJ, Rohlfing T, Sullivan EV (2009): Degradation of association and projection white matter systems in alcoholism detected with quantitative fiber tracking. Biol Psychiatry 65:680–690. [DOI] [PMC free article] [PubMed] [Google Scholar]
- Phillips DE, Krueger SK, Rydquist JE (1991): Short‐ and long‐term effects of combined pre‐ and postnatal ethanol exposure (three trimester equivalency) on the development of myelin and axons in rat optic nerve. Int J Dev Neurosci 9:631–647. [DOI] [PubMed] [Google Scholar]
- Pitel AL, Beaunieux H, Witkowski T, Vabret F, Guillery‐Girard B, Quinette P, Desgranges B, Eustache F (2007): Genuine episodic memory deficits and executive dysfunctions in alcoholic subjects early in abstinence. Alcohol Clin Exp Res 31:1169–1178. [DOI] [PMC free article] [PubMed] [Google Scholar]
- Pitel AL, Beaunieux H, Witkowski T, Vabret F, De la Sayette V, Viader F, Desgranges B, Eustache F (2008): Episodic and working memory deficits in alcoholic korsakoff patients: The continuity theory revisited. Alcohol Clin Exp Res 32:1229–1241. [DOI] [PubMed] [Google Scholar]
- Pitel AL, Aupée AM, Chételat G, Mézenge F, Beaunieux H, De la Sayette V, Viader F, Baron JC, Eustache F, Desgranges B (2009): Morphological and glucose metabolism abnormalities in alcoholic korsakoff's syndrome: Group comparisons and individual analyses. PloS One 4:e7748 [DOI] [PMC free article] [PubMed] [Google Scholar]
- Pitel AL, Zahr NM, Jackson K, Sassoon SA, Rosenbloom MJ, Pfefferbaum A, Sullivan EV (2011): Signs of preclinical wernicke's encephalopathy and thiamine levels as predictors of neuropsychological deficits in alcoholism without korsakoff's syndrome. Neuropsychopharmacology 36:580–588. [DOI] [PMC free article] [PubMed] [Google Scholar]
- Pitel AL, Chételat G, Le Berre AP, Desgranges B, Eustache F, Beaunieux H (2012): Macrostructural abnormalities in korsakoff syndrome compared with uncomplicated alcoholism. Neurology 78:1330–1333. [DOI] [PubMed] [Google Scholar]
- Renou P, Ducreux D, Batouche F, Denier C (2008): Pure and acute korsakoff syndrome due to a bilateral anterior fornix infarction. Arch Neurol 65:1252–1253. [DOI] [PubMed] [Google Scholar]
- Rosenbloom MJ, Sullivan EV, Pfefferbaurn A (2003): Use of MRI to determine brain damage in alcoholics. Alcohol Res Health 27:146–152. [PMC free article] [PubMed] [Google Scholar]
- Rueckert D, Sonoda LI, Hayes C, Hill DL, Leach MO, Hawkes DJ (1999): Nonrigid registration using free‐form deformations: Application to breast MR images. IEEE Trans Med Imaging 18:712–721. [DOI] [PubMed] [Google Scholar]
- Ryback R (1971): The continuum and specificity of the effects of alcohol on memory. A Review. Q J Stud Alcohol 32:991–1016. [PubMed] [Google Scholar]
- Shear PK, Sullivan EV, Lane B, Pfefferbaurn A (1996): Mammillary body and cerebellar shrinkage in chronic alcoholics with and without amnesia. Alcohol Clin Exp Res 20:1489–1495. [DOI] [PubMed] [Google Scholar]
- Smith SM, Nichols TE (2009): Threshold‐free cluster enhancement: Addressing problems of smoothing, threshold dependence and localisation in cluster inference. NeuroImage 44:83–98. [DOI] [PubMed] [Google Scholar]
- Smith SM, Jenkinson M, Woolrich MW, Beckmann CF, Behrens TE, Johansen‐Berg H, Bannister PR, De Luca M, Drobnjak I, Flitney DE, Niazy RK, Saunders J, Vickers J, Zhang Y, De Stefano N, Brady JM, Matthews PM (2004): Advances in functional and structural MR image analysis and implementation as FSL. Neuroimage 23 Suppl 1:S208–S219. [DOI] [PubMed] [Google Scholar]
- Smith SM, Jenkinson M, Johansen‐Berg H, Rueckert D, Nichols TE, Mackay CE, Watkins KE, Ciccarelli O, Cader MZ, Matthews PM, Behrens TE (2006): Tract‐based spatial statistics: Voxelwise analysis of multi‐subject diffusion data. NeuroImage 31:1487–1505. [DOI] [PubMed] [Google Scholar]
- Spielberger CD, Gorsuch RL, Lushene R, Vagg PR, Jacobs GA (1983): Manual for the State‐Trait Anxiety Inventory (form Y). Palo Alto: Consulting Psychologists Press. [Google Scholar]
- Squire LR, Amaral DG, Press GA (1990): Magnetic resonance imaging of the hippocampal formation and mammillary nuclei distinguish medial temporal lobe and diencephalic amnesia. J Neurosci 10:3106–3117. [DOI] [PMC free article] [PubMed] [Google Scholar]
- Sullivan EV (2003): Compromised pontocerebellar and cerebellothalamocortical systems: Speculations on their contributions to cognitive and motor impairment in nonamnesic alcoholism. Alcohol Clin Exp Res 27:1409–1419. [DOI] [PubMed] [Google Scholar]
- Sullivan EV, Marsh L (2003): Hippocampal volume deficits in alcoholic korsakoff's syndrome. Neurology 61:1716–1719. [DOI] [PubMed] [Google Scholar]
- Sullivan EV, Pfefferbaum A (2009): Neuroimaging of the Wernicke‐korsakoff syndrome. Alcohol Alcohol 44:155–165. [DOI] [PMC free article] [PubMed] [Google Scholar]
- Sullivan EV, Lane B, Deshmukh A, Rosenbloom MJ, Desmond JE, Lim KO, Pfefferbaum A (1999): In vivo mammillary body volume deficits in amnesic and nonamnesic alcoholics. Alcohol Clin Exp Res 23:1629–1636. [PubMed] [Google Scholar]
- Sullivan EV, Deshmukh A, Desmond JE, Lim KO, Pfefferbaum A (2000): Cerebellar volume decline in normal aging, alcoholism, and korsakoff's syndrome: Relation to ataxia. Neuropsychology 14:341–352. [DOI] [PubMed] [Google Scholar]
- Sullivan EV, Rosenbloom MJ, Serventi KL, Deshmukh A, Pfefferbaum A (2003): Effects of alcohol dependence comorbidity and antipsychotic medication on volumes of the thalamus and pons in schizophrenia. Am J Psychiatry 160:1110–1116. [DOI] [PubMed] [Google Scholar]
- Van der Linden M (2004): L'évaluation des troubles de la mémoire : Présentation de quatre tests de mémoire épisodique. Collectif 2004. [Google Scholar]
- Victor M, Adams RD, Collins GH (1971): The Wernicke‐ Korsakoff syndrome. Philadelphia: F.A. Davis Co. [PubMed] [Google Scholar]
- Visser PJ, Krabbendam L, Verhey FRJ, Hofman PAM, Verhoeven WMA, Tuinier S, Wester A, Den Berg YW, Goessens LF, Werf YD, Jolles J (1999): Brain correlates of memory dysfunction in alcoholic Korsakoff's syndrome. J Neurol Neurosurg Psychiatry 67:774–778. [DOI] [PMC free article] [PubMed] [Google Scholar]
- Warrington EK, Weiskrantz L (1982): Amnesia: A disconnection syndrome? Neuropsychologia 20:233–248. [DOI] [PubMed] [Google Scholar]
- Wechsler D (2001): WAIS‐III : Wechsler Adult Intelligence Scale, 3rd ed. Canada: Harcourt. [Google Scholar]
- Wijnia JW, Goossensen A (2010): Cerebellar neurocognition and korsakoff's syndrome: An hypothesis. Med Hypotheses 75:266–268. [DOI] [PubMed] [Google Scholar]
- Zahr NM (2014): Structural and microstructral imaging of the brain in alcohol use disorders. Handb Clin Neurol 125:275–290. [DOI] [PMC free article] [PubMed] [Google Scholar]